| Investor Day 2022 Nasdaq: AUB May 9, 2022 |

| 2 2 Today’s Speakers Bill Cimino Senior Vice President, Investor Relations John Asbury President & Chief Executive Officer of Atlantic Union Bankshares Corporation Maria Tedesco Atlantic Union Bank President & Chief Operating Officer Kelly Dakin Digital Strategy & Enterprise Experience Group Executive Dean Hackemer Home Loans Group Executive David Zimmerman Wealth Management Group Executive Shawn O’Brien Consumer & Business Banking Group Executive David Ring Wholesale Banking Group Executive Rob Gorman Chief Financial Officer |
| 3 Forward Looking Statements Certain statements in this presentation may constitute “forward - looking statements” within the meaning of the Private Securities Litigation Reform Act of 1995. Forward - looking statements are statements that include, without limitation, statements on slides entitled “Financial Outlook” and “Top - Tier Financial Targets”, statements regarding the Company’s outlook on future economic con ditions and the impacts of the COVID - 19 pandemic, and statements that include, projections, predictions, expectations, or beliefs about future events or results or otherwise are not statements of historical fact. Such forward - looking statements are b ased on certain assumptions as of the time they are made, and are inherently subject to known and unknown risks, uncertainties, and other factors, some of which cannot be predicted or quantified, that may cause actual results, performance , a chievements, or trends to be materially different from those expressed or implied by such forward - looking statements. Such statements are often characterized by the use of qualified words (and their derivatives) such as “expect,” “believe,” “estima te, ” “plan,” “project,” “anticipate,” “intend,” “will,” “may,” “view,” “opportunity,” “potential,” or words of similar meaning o r o ther statements concerning opinions or judgment of the Company and its management about future events. Although the Company believ es that its expectations with respect to forward - looking statements are based upon reasonable assumptions within the bounds of its existing knowledge of its business and operations, there can be no assurance that actual future results, perfor man ce, or achievements of, or trends affecting, the Company will not differ materially from any projected future results, performance, achievements or trends expressed or implied by such forward - looking statements. Actual future results, performance, achievements or trends may differ materially from historical results or those anticipated depending on a variety of factors, including, but not limited to the effects of or changes in: • market interest rates and the impacts on macroeconomic conditions, customer and client behavior and the Company’s funding costs; • higher inflation and its impacts; • general economic and financial market conditions, in the United States generally and particularly in the markets in which the Company operates and which its loans are concentrated, including the effects of declines in real estate values, an increase in unemployment levels and slowdowns in economic growth, including as a result of COVID - 19; • the quality or composition of the loan or investment portfolios and changes therein; • demand for loan products and financial services in the Company’s market area; • the Company’s ability to manage its growth or implement its growth strategy; • the effectiveness of expense reduction plans; • the introduction of new lines of business or new products and services; • the Company’s ability to recruit and retain key employees; • real estate values in the Bank’s lending area; • an insufficient ACL; • changes in accounting principles, including, without limitation, relating to the CECL methodology; • the Company’s liquidity and capital positions; • concentrations of loans secured by real estate, particularly commercial real estate; • the effectiveness of the Company’s credit processes and management of the Company’s credit risk; • the Company’s ability to compete in the market for financial services and increased competition from fintech companies; • technological risks and developments, and cyber threats, attacks, or events; • the potential adverse effects of unusual and infrequently occurring events, such as weather - related disasters, terrorist acts, geopolitical conflicts (such as the ongoing conflict between Russia and Ukraine) or public health events (such as COVID - 19), and of governmental and societal responses thereto; these potential adverse effects may include, without limitation, adverse effects on the ability of the Company's borrowers to satisfy their obligations to the Company, on the val ue of collateral securing loans, on the demand for the Company's loans or its other products and services, on supply chains and methods used to distribute products and services, on incidents of cyberattack and fraud, on the Company’s liquidity or capital positions, on risks posed by reliance on third - party service providers, on other aspects of the Company's business operations and on financial markets and economic growth; • the effect of steps the Company takes in response to COVID - 19, the severity and duration of the pandemic, the uncertainty regarding new variants of COVID - 19 that have emerged, the speed and efficacy of vaccine and treatment developments, the impact of loosening or tightening of government restrictions, the pace of recovery when the pandemic subsides and the heightened impact it has on many of the risks described herein; • the discontinuation of LIBOR and its impact on the financial markets, and the Company’s ability to manage operational, legal and compliance risks related to the discontinuation of LIBOR and implementation of one or more alternate reference rates, • performance by the Company’s counterparties or vendors; • deposit flows; • the availability of financing and the terms thereof; • the level of prepayments on loans and mortgage - backed securities; • legislative or regulatory changes and requirements, including the impact of the Coronavirus Aid, Relief, and Economic Security ("CARES") Act, as amended by the Consolidated Appropriations Act, 2021, and other legislative and regulatory reactions to COVID - 19; • potential claims, damages, and fines related to litigation or government actions, including litigation or actions arising f rom the Company’s participation in and administration of programs related to COVID - 19, including, among other things, under the CARES Act, as amended by the CAA; • the effects of changes in federal, state or local tax laws and regulations; • monetary and fiscal policies of the U.S. government, including policies of the U.S. Department of the Treasury and the Federal Reserve; • changes to applicable accounting principles and guidelines; and • other factors, many of which are beyond the control of the Company. Please refer to the “Risk Factors” and “Management’s Discussion and Analysis of Financial Condition and Results of Operations ” s ections of the Company’s Annual Report on Form 10 - K for the year ended December 31, 2021 and related disclosures in other filings, which have been filed with the SEC and are available on the SEC’s website at www.sec.gov. All risk factors and un certainties described herein should be considered in evaluating forward - looking statements, all forward - looking statements made in this presentation are expressly qualified by the cautionary statements contained or referred to herein, and undue rel ian ce should not be placed on such forward - looking statements. The actual results or developments anticipated may not be realized or, even if substantially realized, they may not have the expected consequences to or effects on the Company or its bus inesses or operations. Forward - looking statements speak only as of the date they are made. The Company does not intend or assume any obligation to update, revise or clarify any forward - looking statements that may be made from time to time by or on be half of the Company, whether as a result of new information, future events or otherwise. |
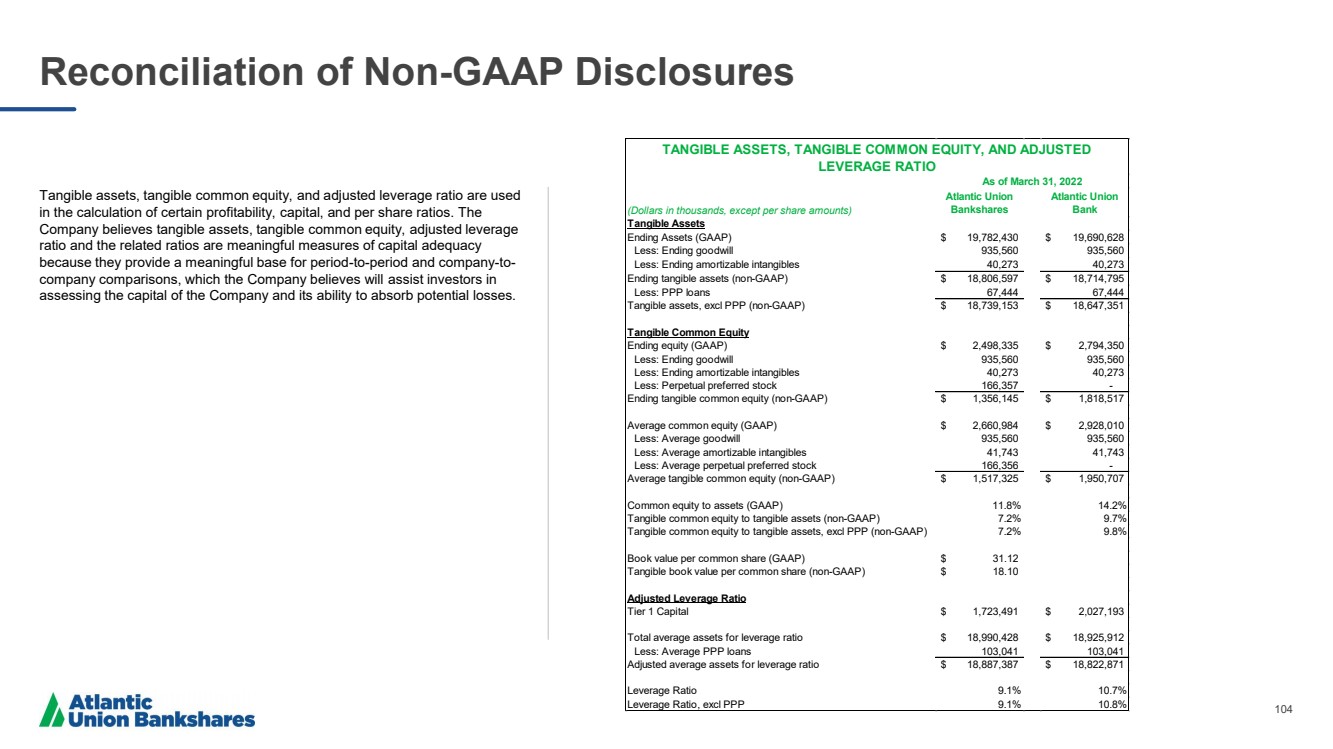
| 4 Additional Information Non - GAAP Financial Measures This presentation contains certain financial information determined by methods other than in accordance with generally accepted accounting principles in the United States (“GAAP”). These non - GAAP financial measures are a supplement to GAAP, which is used to prepare the Company’s financial statements, and should not be considered in isolation or as a substitute for comparable measures calculated in accordance with GAAP. In addition, the Company’s non - GAAP financial measures may not be comparable to non - GAAP financial measures of other companies. The Company uses the non - GAAP financial measures discussed herein in its analysis of the Company’s performance. The Company’s management believes that these non - GAAP financial measures provide additional understanding of ongoing operations, enhance comparability of results of operations with prior periods and show the effects of significant gains and charges in the periods presented without the impact of items or events that may obscure trends in the Company’s underlying performance. Please see “Reconciliation of Non - GAAP Disclosures” at the end of this presentation for a reconciliation to the nearest GAAP financial measure. No Offer or Solicitation This presentation does not constitute an offer to sell or a solicitation of an offer to buy any securities. No offer of securities shall be made except by means of a prospectus meeting the requirements of the Securities Act of 1933, as amended, and no offer to sell or solicitation of an offer to buy shall be made in any jurisdiction in which such offer, solicitation or sale would be unlawful. About Atlantic Union Bankshares Corporation Headquartered in Richmond, Virginia, Atlantic Union Bankshares Corporation (Nasdaq: AUB) is the holding company for Atlantic Union Bank. Atlantic Union Bank has 114 branches and approximately 130 ATMs located throughout Virginia, and in portions of Maryland and North Carolina. Certain non - bank financial services affiliates of Atlantic Union Bank include: Atlantic Union Equipment Finance, Inc., which provides equipment financing; Dixon, Hubard , Feinour & Brown, Inc., which provides investment advisory services; Atlantic Union Financial Consultants, LLC, which provides brokerage services; and Union Insurance Group, LLC, which offers various lines of insurance products. |
| 5 John Asbury Atlantic Union Bankshares Corporation President & Chief Executive Officer 5 |
| 6 Our Actions Match Our Words “ While evolving, maturing and responding to our changing environment, we are delivering on what we said we would do. I think of this as an agile form of consistency ..” - John Asbury, CEO |
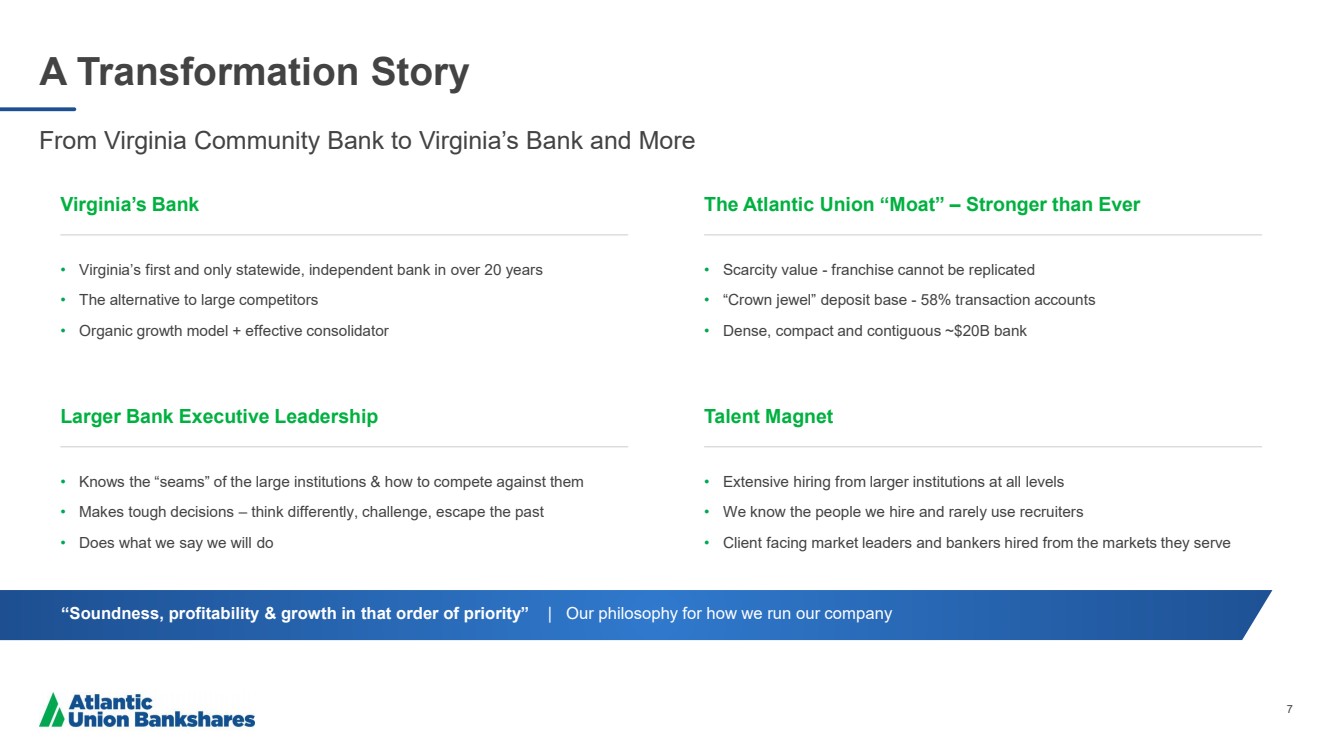
| 7 A Transformation Story From Virginia Community Bank to Virginia’s Bank and More Virginia’s Bank The Atlantic Union “Moat” – Stronger than Ever • Virginia’s first and only statewide, independent bank in over 20 years • The alternative to large competitors • Organic growth model + effective consolidator • Scarcity value - franchise cannot be replicated • “Crown jewel” deposit base - 58% transaction accounts • Dense, compact and contiguous ~$20B bank Larger Bank Executive Leadership Talent Magnet • Knows the “seams” of the large institutions & how to compete against them • Makes tough decisions – think differently, challenge, escape the past • Does what we say we will do • Extensive hiring from larger institutions at all levels • We know the people we hire and rarely use recruiters • Client facing market leaders and bankers hired from the markets they serve “Soundness, profitability & growth in that order of priority” | Our philosophy for how we run our company |
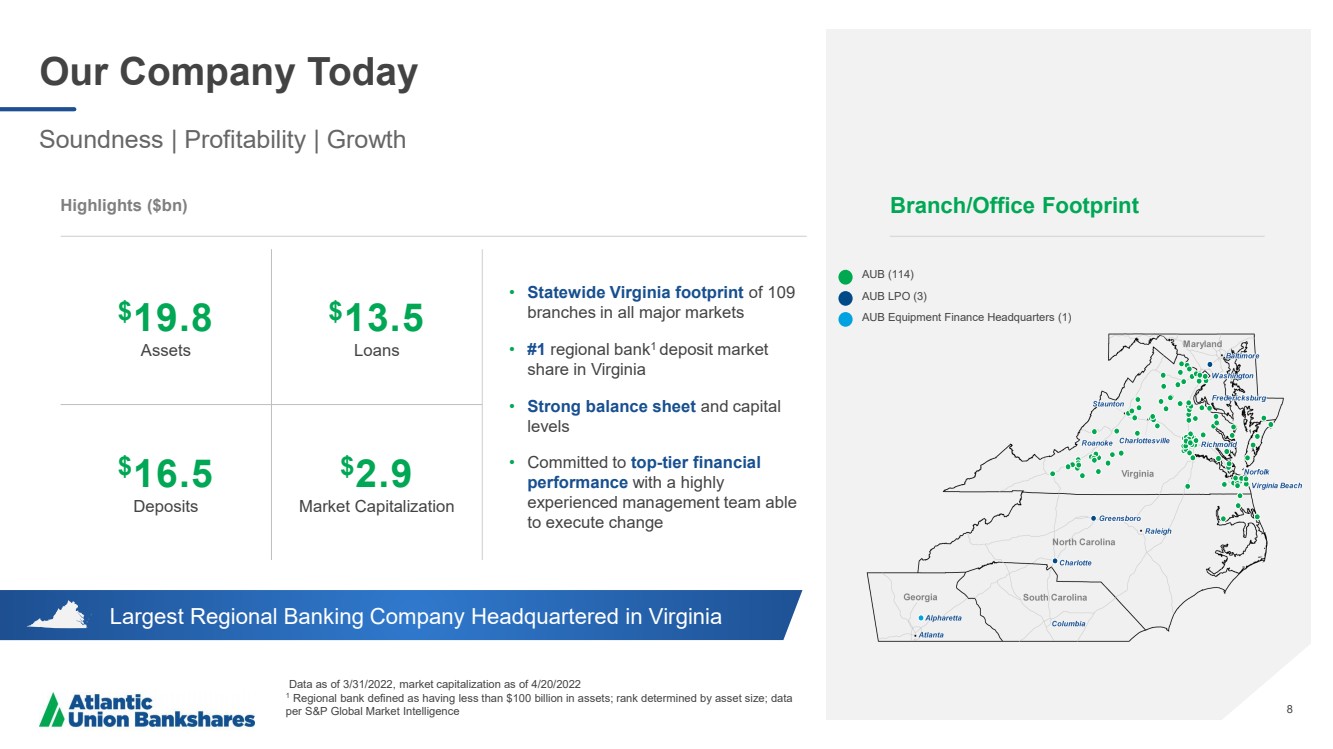
| 8 Largest Regional Banking Company Headquartered in Virginia Our Company Today Soundness | Profitability | Growth Data as of 3/31/2022, market capitalization as of 4/20/2022 1 Regional bank defined as having less than $100 billion in assets; rank determined by asset size; data per S&P Global Market Intelligence Highlights ($bn) • Statewide Virginia footprint of 109 branches in all major markets • #1 regional bank 1 deposit market share in Virginia • Strong balance sheet and capital levels • Committed to top - tier financial performance with a highly experienced management team able to execute change 8 $ 19 ..8 Assets $ 13.5 Loans $ 16.5 Deposits $ 2 ..9 Market Capitalization Branch/Office Footprint AUB (114) AUB LPO (3) AUB Equipment Finance Headquarters (1) |
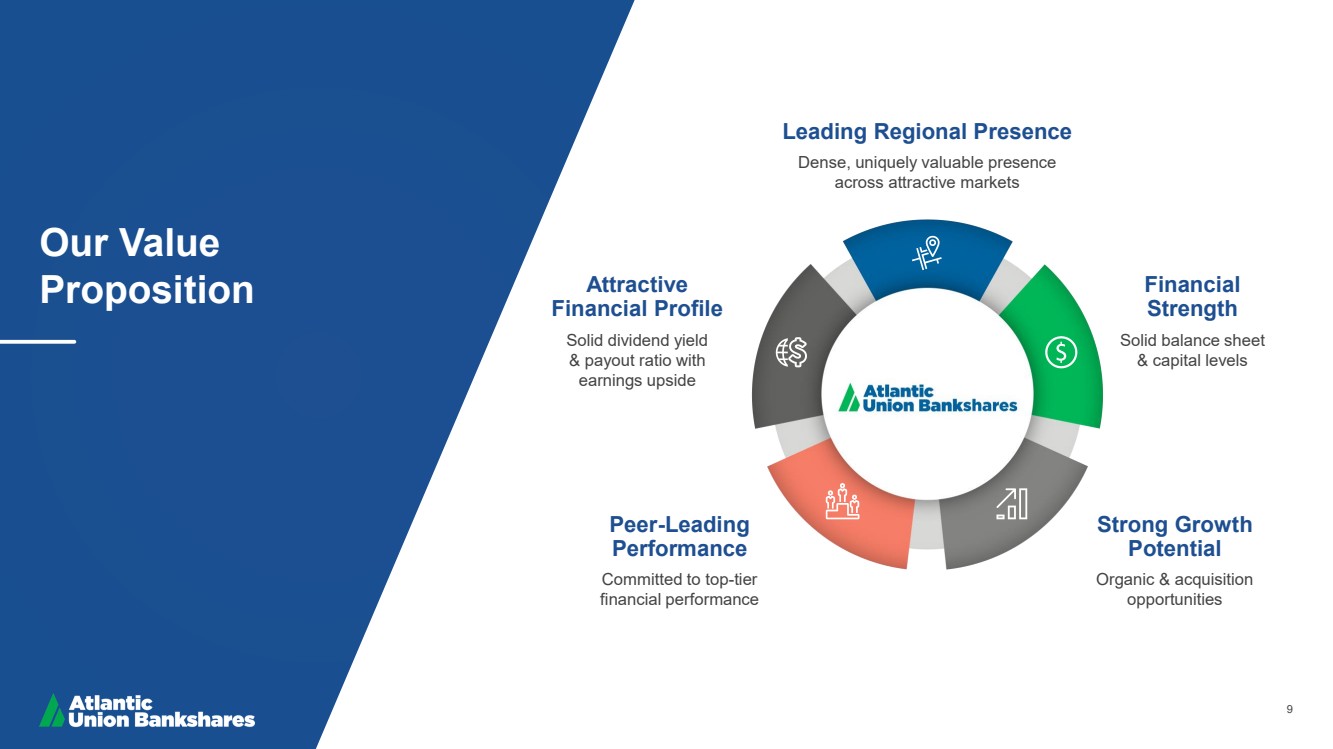
| 9 Our Value Proposition Leading Regional Presence Dense, uniquely valuable presence across attractive markets Financial Strength Solid balance sheet & capital levels Attractive Financial Profile Solid dividend yield & payout ratio with earnings upside Strong Growth Potential Organic & acquisition opportunities Peer - Leading Performance Committed to top - tier financial performance |
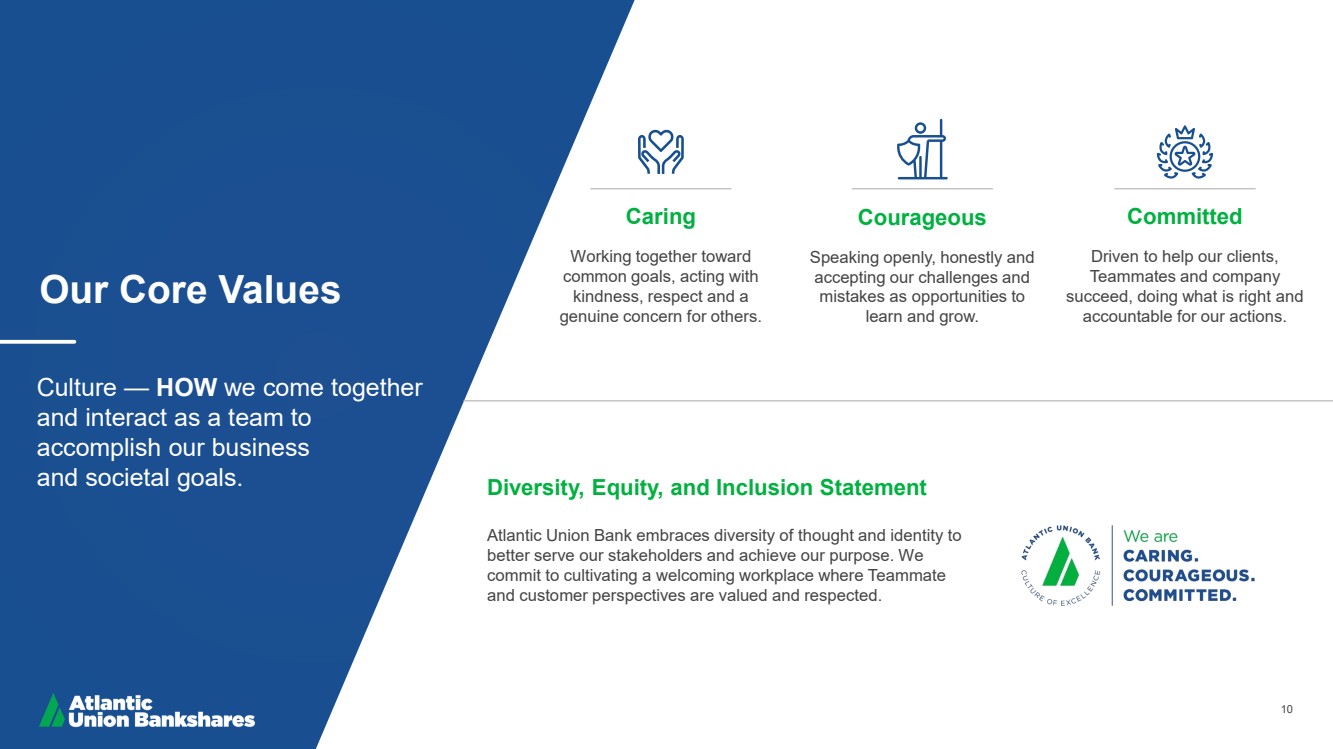
| 10 Caring Working together toward common goals, acting with kindness, respect and a genuine concern for others. Courageous Speaking openly, honestly and accepting our challenges and mistakes as opportunities to learn and grow. Committed Driven to help our clients, Teammates and company succeed, doing what is right and accountable for our actions. Culture — HOW we come together and interact as a team to accomplish our business and societal goals. Diversity, Equity, and Inclusion Statement Atlantic Union Bank embraces diversity of thought and identity to better serve our stakeholders and achieve our purpose. We commit to cultivating a welcoming workplace where Teammate and customer perspectives are valued and respected. Our Core Values |
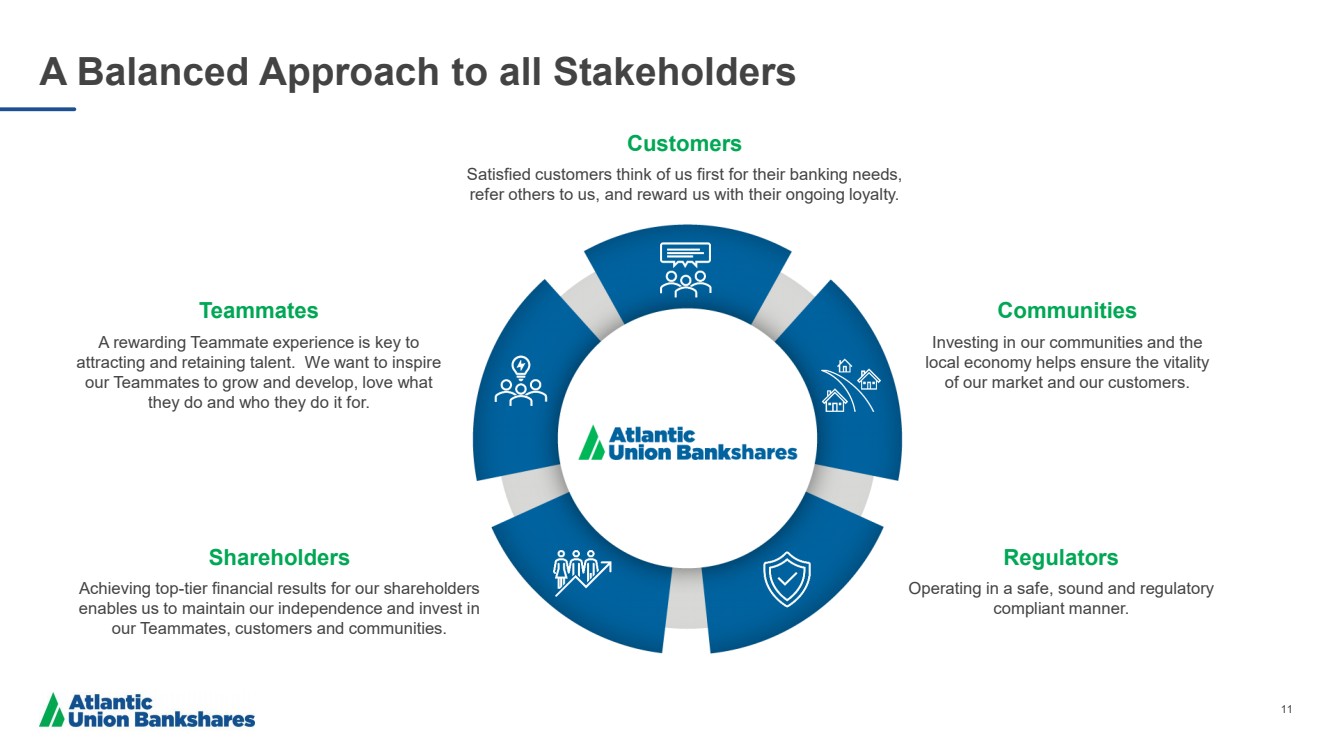
| 11 A Balanced Approach to all Stakeholders Customers Satisfied customers think of us first for their banking needs, refer others to us, and reward us with their ongoing loyalty. Communities Investing in our communities and the local economy helps ensure the vitality of our market and our customers. Teammates A rewarding Teammate experience is key to attracting and retaining talent. We want to inspire our Teammates to grow and develop, love what they do and who they do it for. Regulators Operating in a safe, sound and regulatory compliant manner. Shareholders Achieving top - tier financial results for our shareholders enables us to maintain our independence and invest in our Teammates, customers and communities. |
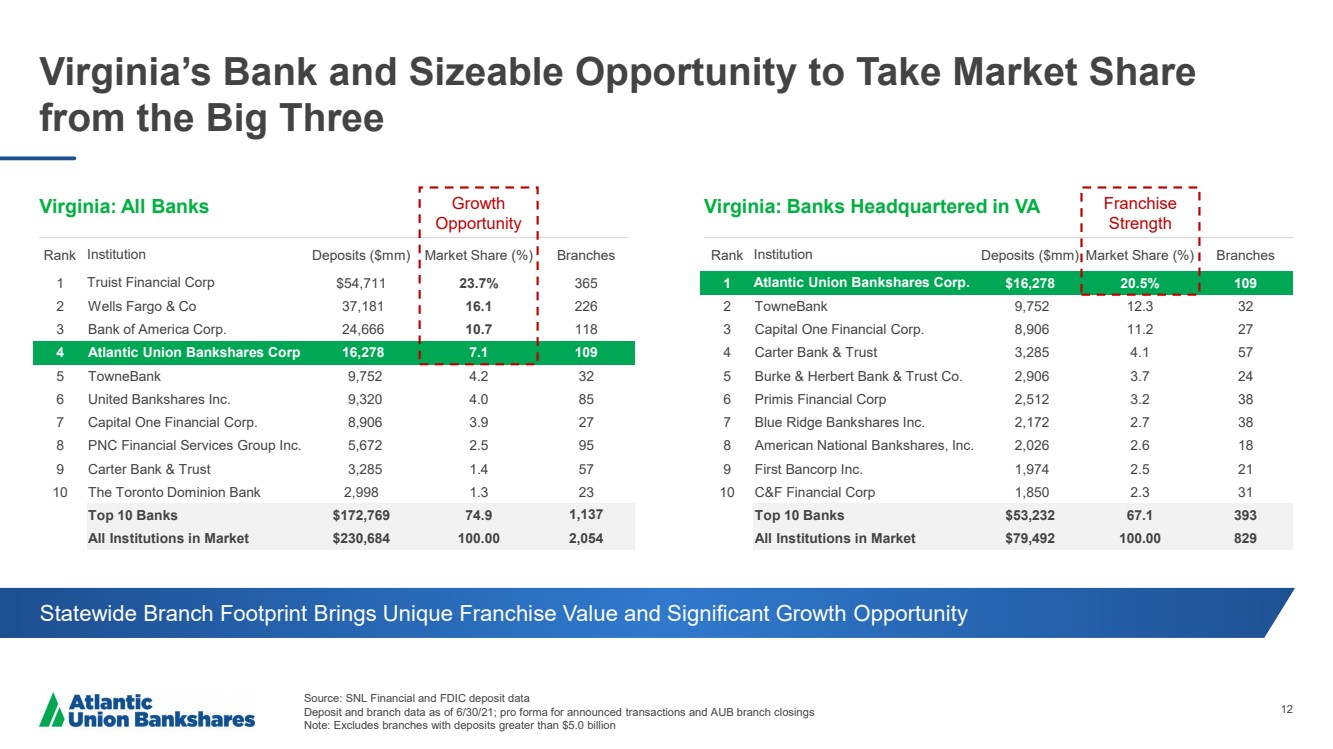
| 12 Virginia’s Bank and Sizeable Opportunity to Take Market Share from the Big Three Source: SNL Financial and FDIC deposit data Deposit and branch data as of 6/30/21; pro forma for announced transactions and AUB branch closings Note: Excludes branches with deposits greater than $5.0 billion Virginia: All Banks Virginia: Banks Headquartered in VA Rank Institution Deposits ($mm) Market Share (%) Branches 1 Truist Financial Corp $54,711 23.7% 365 2 Wells Fargo & Co 37,181 16.1 226 3 Bank of America Corp. 24,666 10.7 118 4 Atlantic Union Bankshares Corp 16,278 7.1 109 5 TowneBank 9,752 4.2 32 6 United Bankshares Inc. 9,320 4.0 85 7 Capital One Financial Corp. 8,906 3.9 27 8 PNC Financial Services Group Inc. 5,672 2.5 95 9 Carter Bank & Trust 3,285 1.4 57 10 The Toronto Dominion Bank 2,998 1.3 23 Top 10 Banks $172,769 74.9 1,137 All Institutions in Market $230,684 100.00 2,054 Rank Institution Deposits ($mm) Market Share (%) Branches 1 Atlantic Union Bankshares Corp. $16,278 20.5% 109 2 TowneBank 9,752 12.3 32 3 Capital One Financial Corp. 8,906 11.2 27 4 Carter Bank & Trust 3,285 4.1 57 5 Burke & Herbert Bank & Trust Co. 2,906 3.7 24 6 Primis Financial Corp 2,512 3.2 38 7 Blue Ridge Bankshares Inc. 2,172 2.7 38 8 American National Bankshares, Inc. 2,026 2.6 18 9 First Bancorp Inc. 1,974 2.5 21 10 C&F Financial Corp 1,850 2.3 31 Top 10 Banks $53,232 67.1 393 All Institutions in Market $79,492 100.00 829 Statewide Branch Footprint Brings Unique Franchise Value and Significant Growth Opportunity Growth Opportunity Franchise Strength |
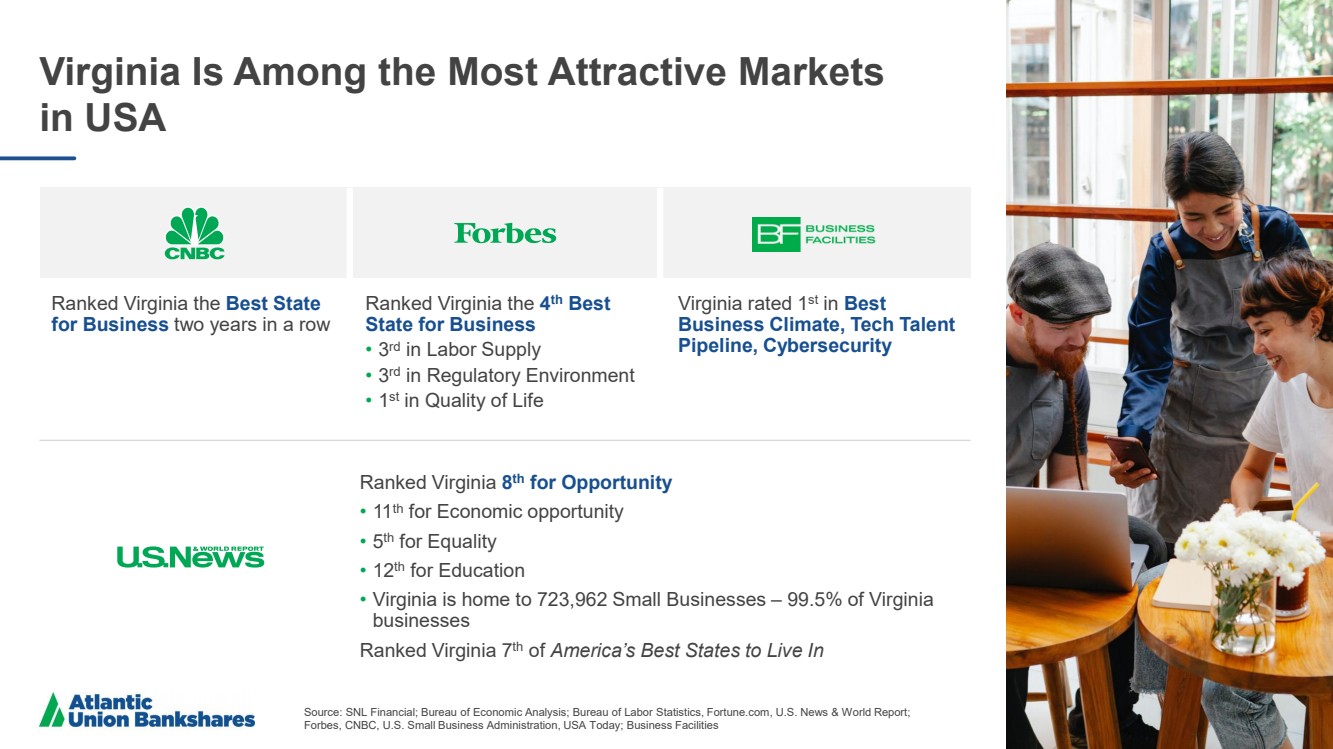
| 13 Virginia Is Among the Most Attractive Markets in USA Source: SNL Financial; Bureau of Economic Analysis; Bureau of Labor Statistics, Fortune.com, U.S. News & World Report; Forbes, CNBC, U.S. Small Business Administration, USA Today; Business Facilities Ranked Virginia 8 th for Opportunity • 11 th for Economic opportunity • 5 th for Equality • 12 th for Education • Virginia is home to 723,962 Small Businesses – 99.5% of Virginia businesses Ranked Virginia 7 th of America’s Best States to Live In Ranked Virginia the Best State for Business two years in a row Ranked Virginia the 4 th Best State for Business • 3 rd in Labor Supply • 3 rd in Regulatory Environment • 1 st in Quality of Life Virginia rated 1 st in Best Business Climate, Tech Talent Pipeline, Cybersecurity |
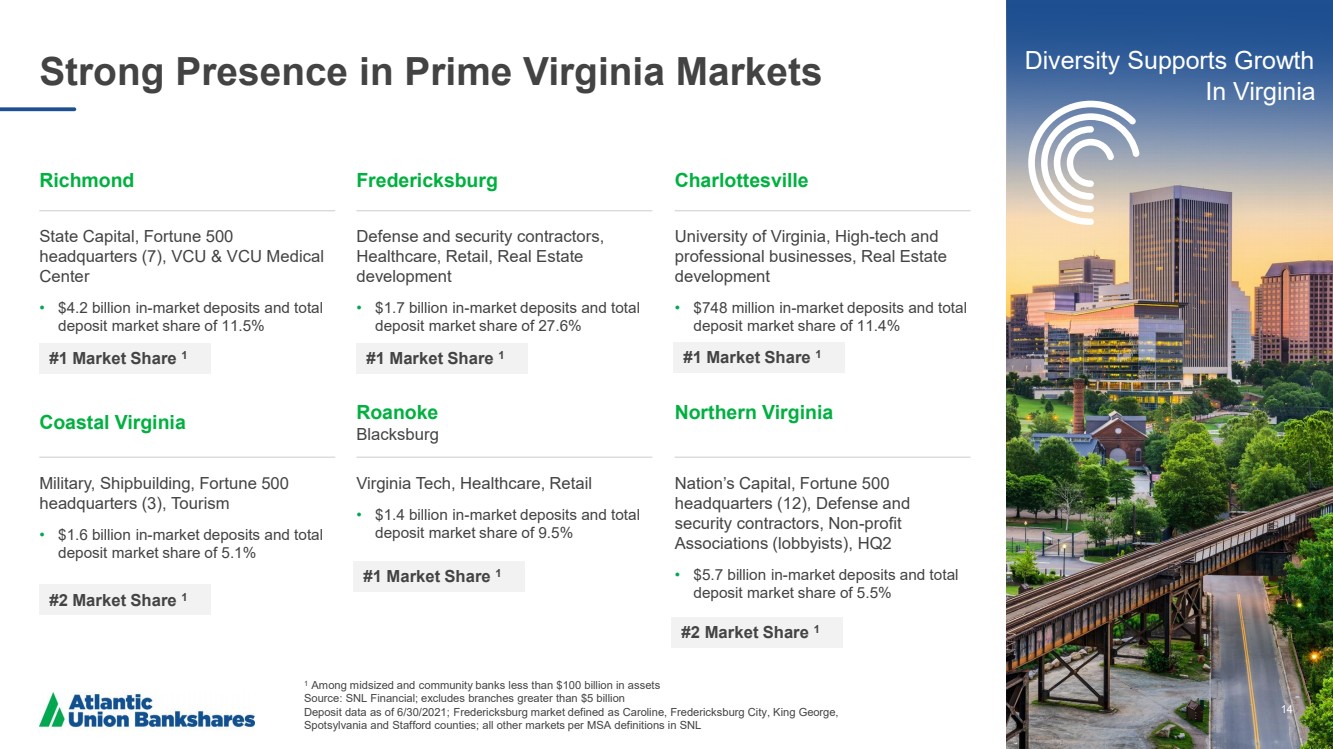
| 14 Strong Presence in Prime Virginia Markets 1 Among midsized and community banks less than $100 billion in assets Source: SNL Financial; excludes branches greater than $5 billion Deposit data as of 6/30/2021; Fredericksburg market defined as Caroline, Fredericksburg City, King George, Spotsylvania and Stafford counties; all other markets per MSA definitions in SNL 14 Coastal Virginia Military, Shipbuilding, Fortune 500 headquarters (3), Tourism • $1.6 billion in - market deposits and total deposit market share of 5.1% Roanoke Blacksburg Virginia Tech, Healthcare, Retail • $1.4 billion in - market deposits and total deposit market share of 9.5% Northern Virginia Nation’s Capital, Fortune 500 headquarters (12), Defense and security contractors, Non - profit Associations (lobbyists), HQ2 • $5.7 billion in - market deposits and total deposit market share of 5.5% Diversity Supports Growth In Virginia Richmond State Capital, Fortune 500 headquarters (7), VCU & VCU Medical Center • $4.2 billion in - market deposits and total deposit market share of 11.5% Fredericksburg Defense and security contractors, Healthcare, Retail, Real Estate development • $1.7 billion in - market deposits and total deposit market share of 27.6% Charlottesville University of Virginia, High - tech and professional businesses, Real Estate development • $748 million in - market deposits and total deposit market share of 11.4% #1 Market Share 1 #2 Market Share 1 #2 Market Share 1 #1 Market Share 1 #1 Market Share 1 #1 Market Share 1 |
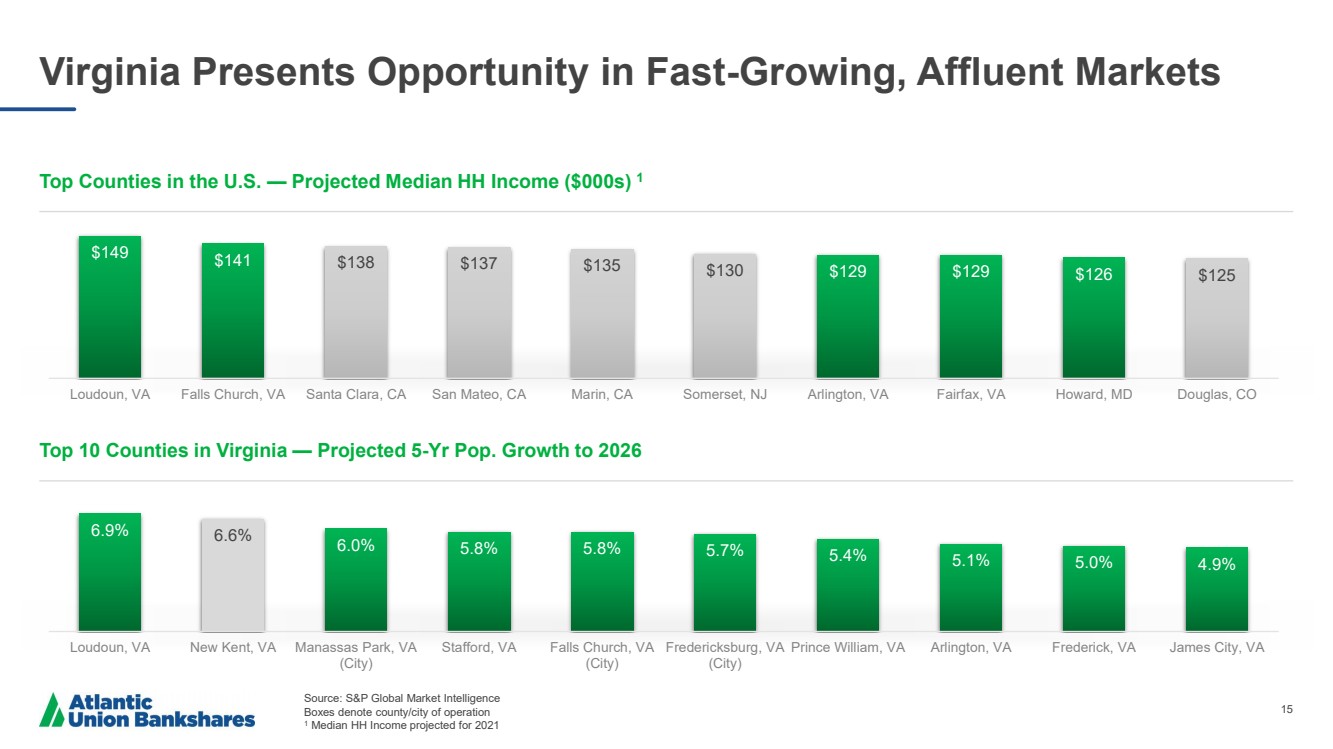
| 15 $149 $141 $138 $137 $135 $130 $129 $129 $126 $125 Loudoun, VA Falls Church, VA Santa Clara, CA San Mateo, CA Marin, CA Somerset, NJ Arlington, VA Fairfax, VA Howard, MD Douglas, CO Virginia Presents Opportunity in Fast - Growing, Affluent Markets Source: S&P Global Market Intelligence Boxes denote county/city of operation 1 Median HH Income projected for 2021 Top Counties in the U.S. — Projected Median HH Income ($000s) 1 Top 10 Counties in Virginia — Projected 5 - Yr Pop. Growth to 2026 6.9% 6.6% 6.0% 5.8% 5.8% 5.7% 5.4% 5.1% 5.0% 4.9% Loudoun, VA New Kent, VA Manassas Park, VA (City) Stafford, VA Falls Church, VA (City) Fredericksburg, VA (City) Prince William, VA Arlington, VA Frederick, VA James City, VA |
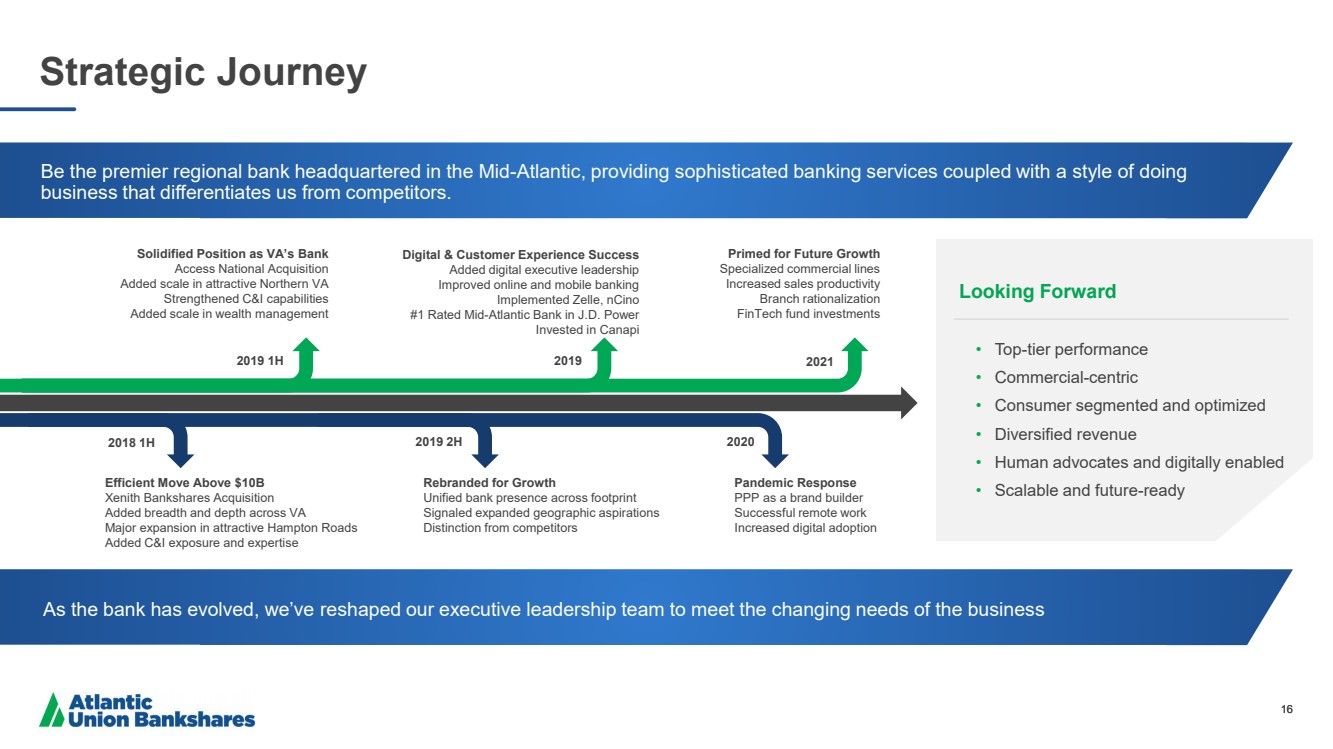
| 16 Strategic Journey Looking Forward • Top - tier performance • Commercial - centric • Consumer segmented and optimized • Diversified revenue • Human advocates and digitally enabled • Scalable and future - ready 16 2019 2H 2018 1H 2019 1H 2021 2019 2020 Efficient Move Above $10B Xenith Bankshares Acquisition Added breadth and depth across VA Major expansion in attractive Hampton Roads Added C&I exposure and expertise Rebranded for Growth Unified bank presence across footprint Signaled expanded geographic aspirations Distinction from competitors Pandemic Response PPP as a brand builder Successful remote work Increased digital adoption Solidified Position as VA’s Bank Access National Acquisition Added scale in attractive Northern VA Strengthened C&I capabilities Added scale in wealth management Digital & Customer Experience Success Added digital executive leadership Improved online and mobile banking Implemented Zelle , nCino #1 Rated Mid - Atlantic Bank in J.D. Power Invested in Canapi Primed for Future Growth Specialized commercial lines Increased sales productivity Branch rationalization FinTech fund investments Be the premier regional bank headquartered in the Mid - Atlantic, providing sophisticated banking services coupled with a style of doing business that differentiates us from competitors. As the bank has evolved, we’ve reshaped our executive leadership team to meet the changing needs of the business |
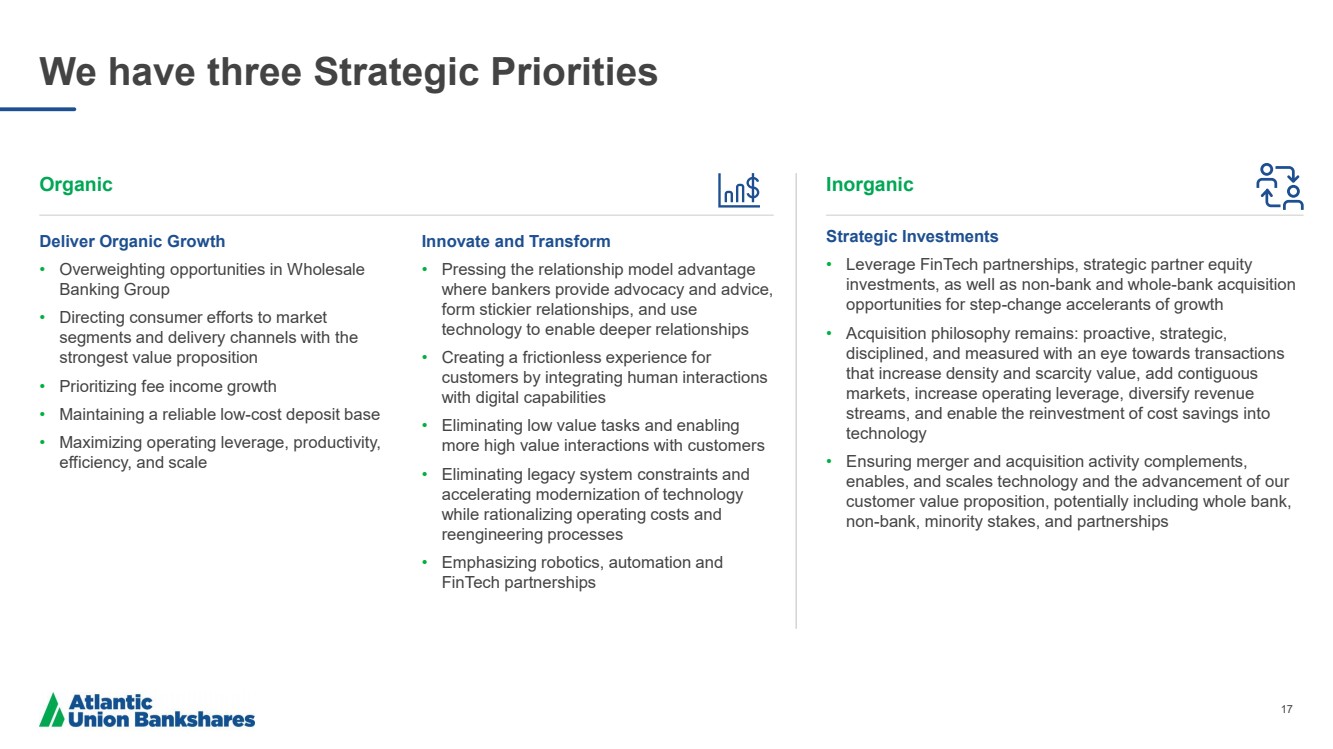
| 17 We have three Strategic Priorities Organic Deliver Organic Growth • Overweighting opportunities in Wholesale Banking Group • Directing consumer efforts to market segments and delivery channels with the strongest value proposition • Prioritizing fee income growth • Maintaining a reliable low - cost deposit base • Maximizing operating leverage, productivity, efficiency, and scale Innovate and Transform • Pressing the relationship model advantage where bankers provide advocacy and advice, form stickier relationships, and use technology to enable deeper relationships • Creating a frictionless experience for customers by integrating human interactions with digital capabilities • Eliminating low value tasks and enabling more high value interactions with customers • Eliminating legacy system constraints and accelerating modernization of technology while rationalizing operating costs and reengineering processes • Emphasizing robotics, automation and FinTech partnerships Inorganic Strategic Investments • Leverage FinTech partnerships, strategic partner equity investments, as well as non - bank and whole - bank acquisition opportunities for step - change accelerants of growth • Acquisition philosophy remains: proactive, strategic, disciplined, and measured with an eye towards transactions that increase density and scarcity value, add contiguous markets, increase operating leverage, diversify revenue streams, and enable the reinvestment of cost savings into technology • Ensuring merger and acquisition activity complements, enables, and scales technology and the advancement of our customer value proposition, potentially including whole bank, non - bank, minority stakes, and partnerships |
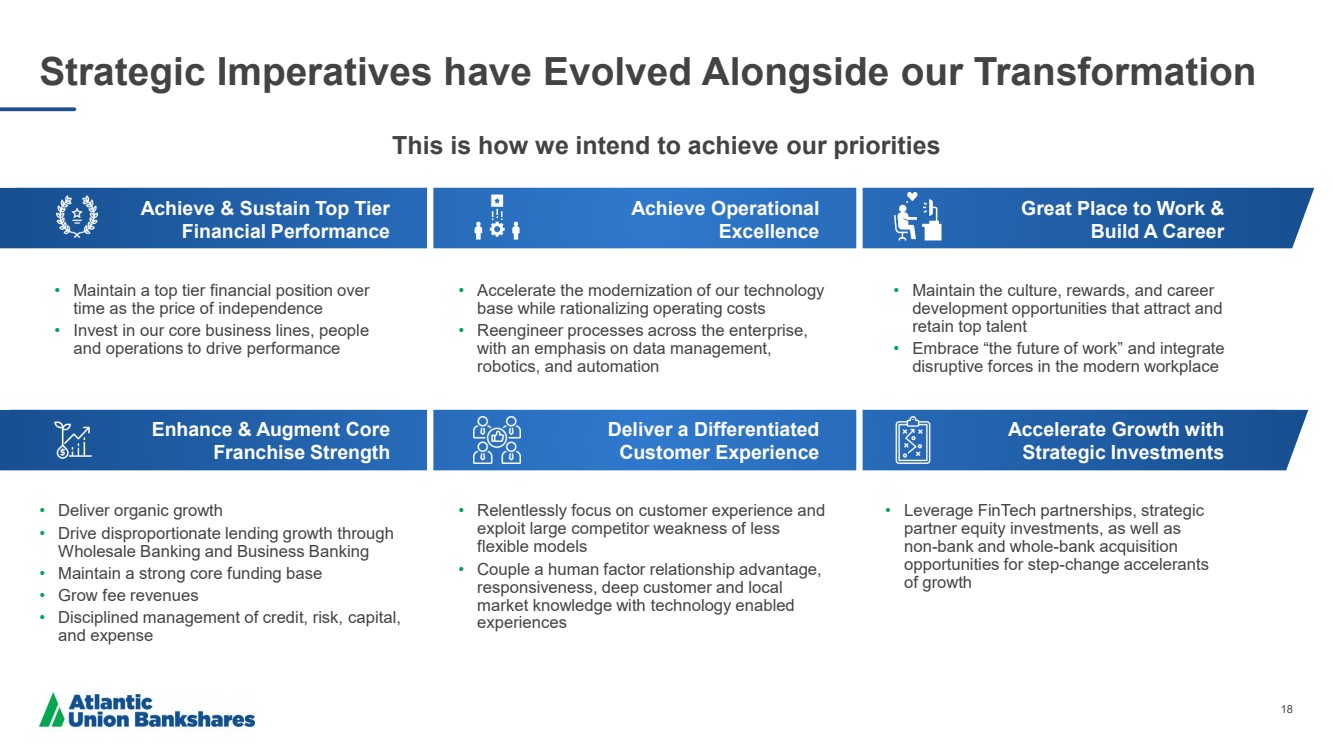
| 18 • Maintain a top tier financial position over time as the price of independence • Invest in our core business lines, people and operations to drive performance Strategic Imperatives have Evolved Alongside our Transformation Achieve & Sustain Top Tier Financial Performance • Accelerate the modernization of our technology base while rationalizing operating costs • Reengineer processes across the enterprise, with an emphasis on data management, robotics, and automation • Maintain the culture, rewards, and career development opportunities that attract and retain top talent • Embrace “the future of work” and integrate disruptive forces in the modern workplace • Deliver organic growth • Drive disproportionate lending growth through Wholesale Banking and Business Banking • Maintain a strong core funding base • Grow fee revenues • Disciplined management of credit, risk, capital, and expense Enhance & Augment Core Franchise Strength Achieve Operational Excellence Deliver a Differentiated Customer Experience Great Place to Work & Build A Career Accelerate Growth with Strategic Investments • Relentlessly focus on customer experience and exploit large competitor weakness of less flexible models • Couple a human factor relationship advantage, responsiveness, deep customer and local market knowledge with technology enabled experiences • Leverage FinTech partnerships, strategic partner equity investments, as well as non - bank and whole - bank acquisition opportunities for step - change accelerants of growth This is how we intend to achieve our priorities |
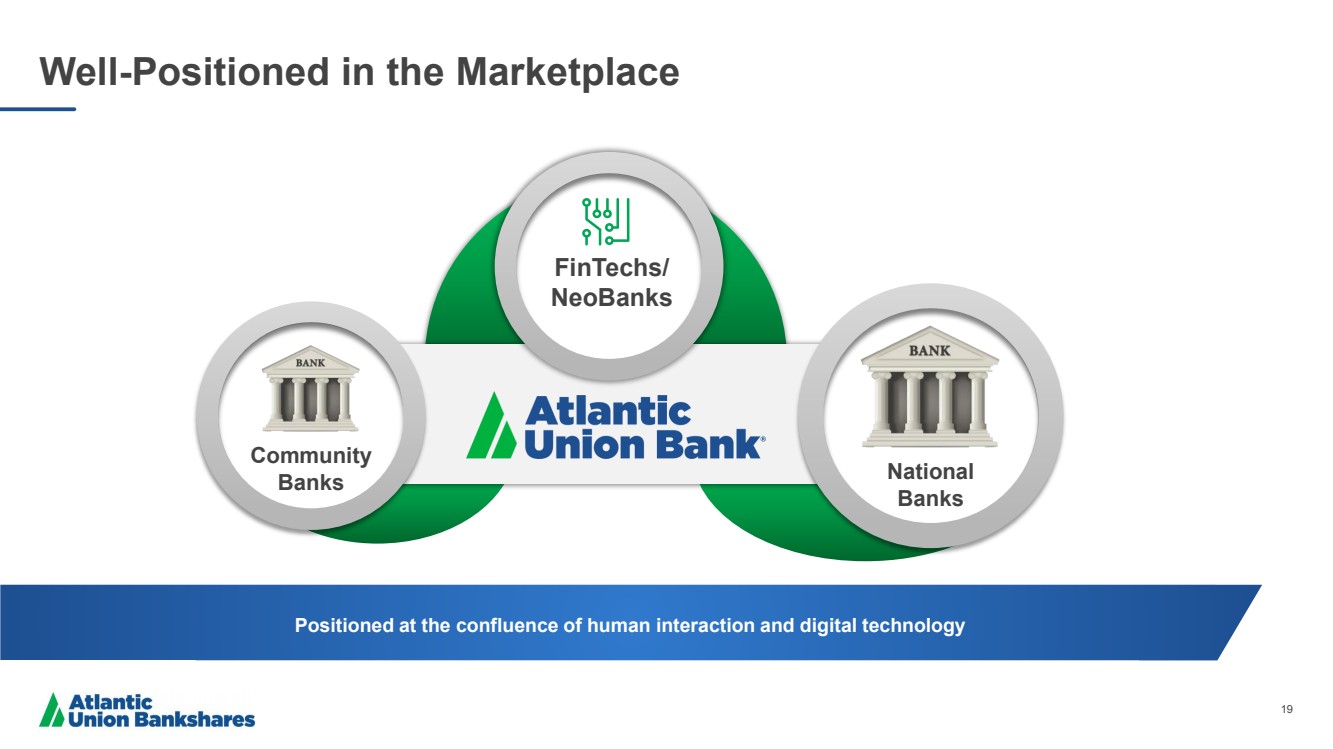
| 19 Well - Positioned in the Marketplace FinTechs / NeoBanks Community Banks National Banks Positioned at the confluence of human interaction and digital technology |
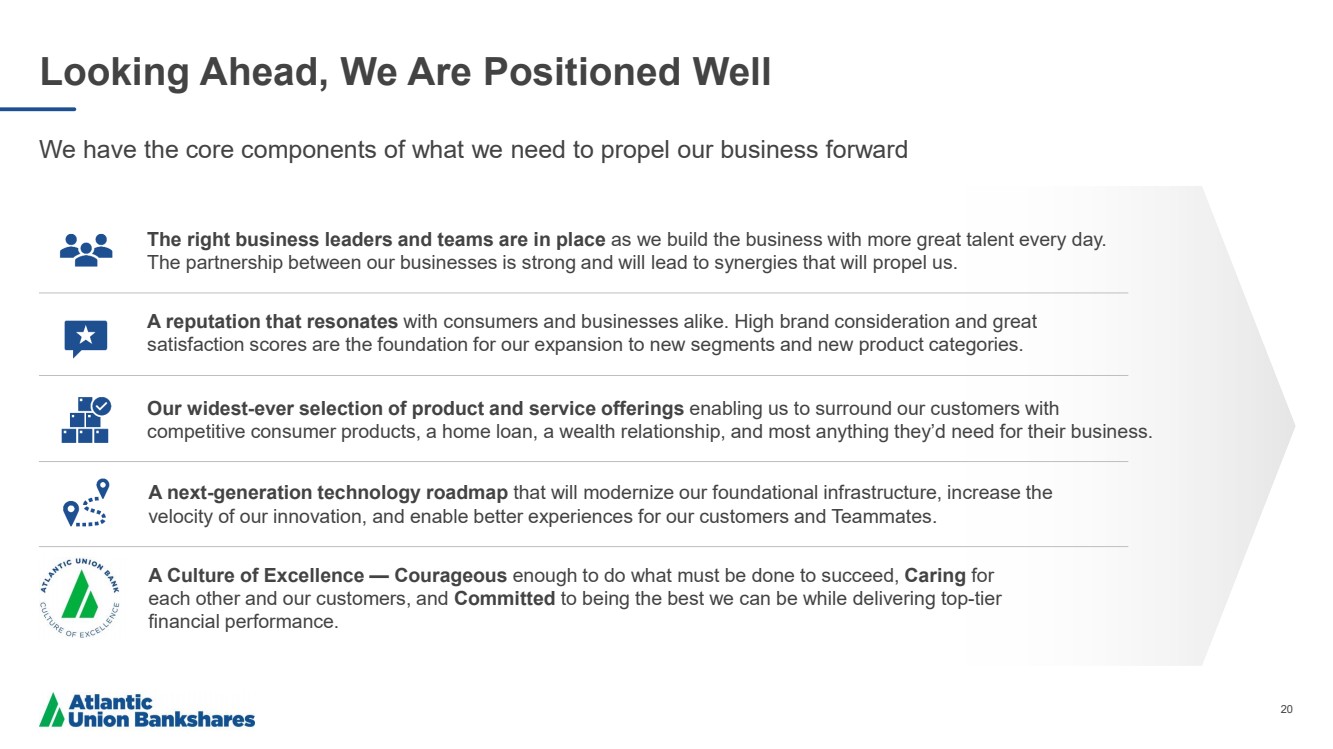
| 20 Looking Ahead, We Are Positioned Well We have the core components of what we need to propel our business forward A Culture of Excellence — Courageous enough to do what must be done to succeed, Caring for each other and our customers, and Committed to being the best we can be while delivering top - tier financial performance. The right business leaders and teams are in place as we build the business with more great talent every day. The partnership between our businesses is strong and will lead to synergies that will propel us. A next - generation technology roadmap that will modernize our foundational infrastructure, increase the velocity of our innovation, and enable better experiences for our customers and Teammates. Our widest - ever selection of product and service offerings enabling us to surround our customers with competitive consumer products, a home loan, a wealth relationship, and most anything they’d need for their business. A reputation that resonates with consumers and businesses alike. High brand consideration and great satisfaction scores are the foundation for our expansion to new segments and new product categories. |
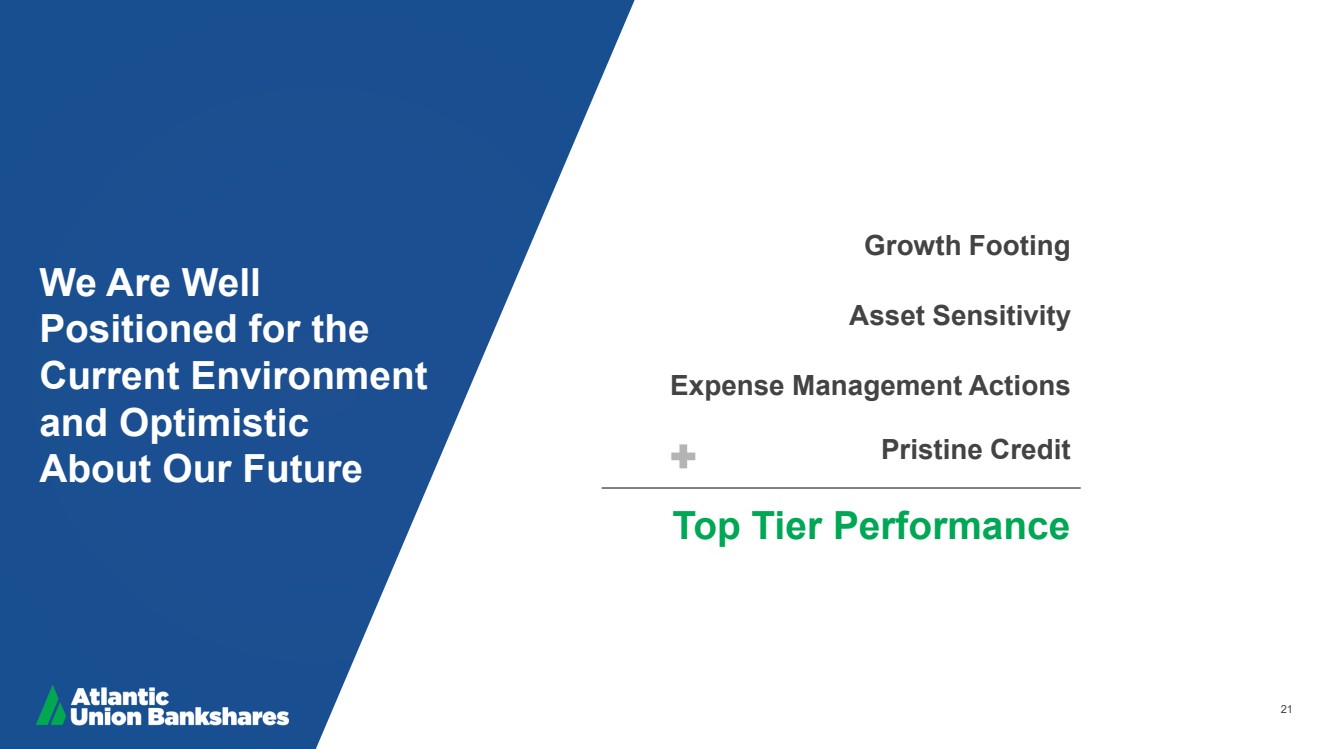
| 21 We Are Well Positioned for the Current Environment and Optimistic About Our Future Top Tier Performance Pristine Credit Expense Management Actions Asset Sensitivity Growth Footing |
| 22 Maria Tedesco Atlantic Union Bank President & Chief Operating Officer |
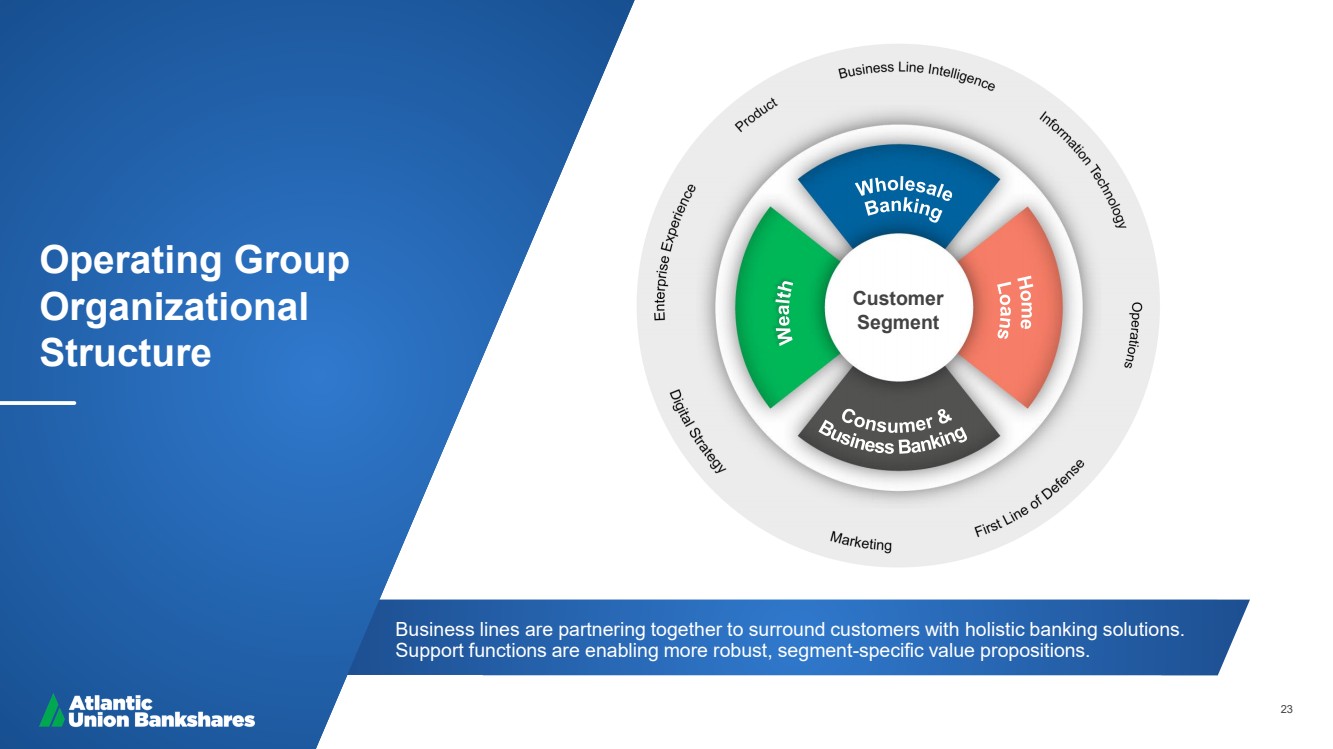
| 23 Customer Segment Business lines are partnering together to surround customers with holistic banking solutions. Support functions are enabling more robust, segment - specific value propositions. Operating Group Organizational Structure |
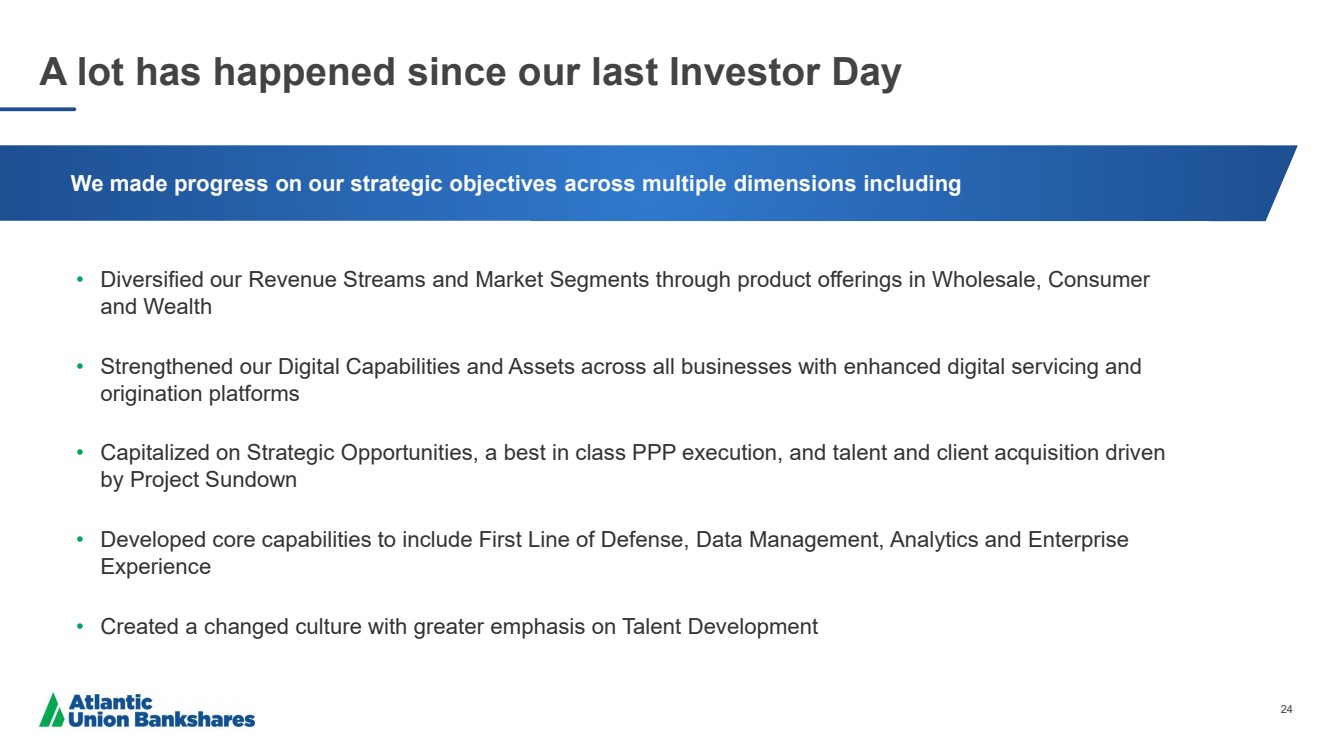
| 24 A lot has happened since our last Investor Day • Diversified our Revenue Streams and Market Segments through product offerings in Wholesale, Consumer and Wealth • Strengthened our Digital Capabilities and Assets across all businesses with enhanced digital servicing and origination platforms • Capitalized on Strategic Opportunities, a best in class PPP execution, and talent and client acquisition driven by Project Sundown • Developed core capabilities to include First Line of Defense, Data Management, Analytics and Enterprise Experience • Created a changed culture with greater emphasis on Talent Development We made progress on our strategic objectives across multiple dimensions including |
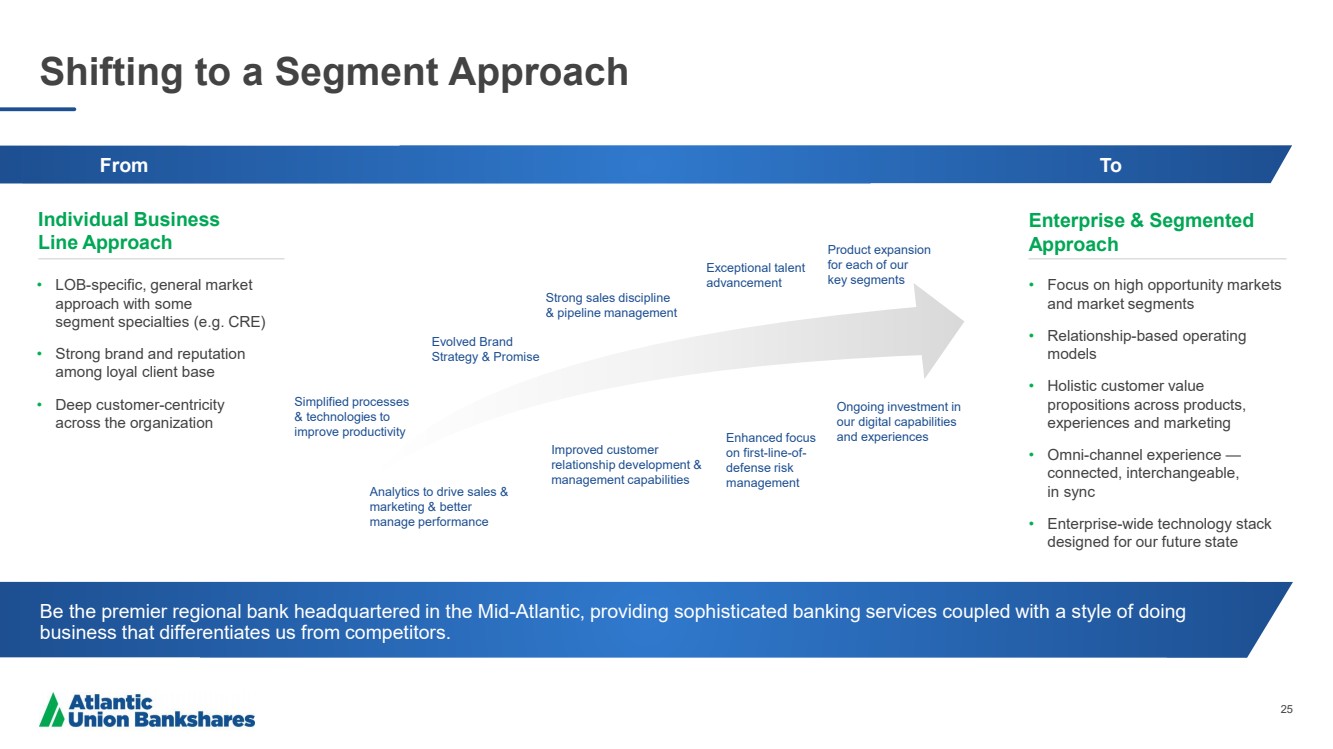
| 25 Shifting to a Segment Approach Be the premier regional bank headquartered in the Mid - Atlantic, providing sophisticated banking services coupled with a style of doing business that differentiates us from competitors. Simplified processes & technologies to improve productivity Analytics to drive sales & marketing & better manage performance Evolved Brand Strategy & Promise Improved customer relationship development & management capabilities Product expansion for each of our key segments Ongoing investment in our digital capabilities and experiences Enhanced focus on first - line - of - defense risk management Strong sales discipline & pipeline management Exceptional talent advancement Enterprise & Segmented Approach • Focus on high opportunity markets and market segments • Relationship - based operating models • Holistic customer value propositions across products, experiences and marketing • Omni - channel experience — connected, interchangeable, in sync • Enterprise - wide technology stack designed for our future state Individual Business Line Approach • LOB - specific, general market approach with some segment specialties (e.g. CRE) • Strong brand and reputation among loyal client base • Deep customer - centricity across the organization From To |
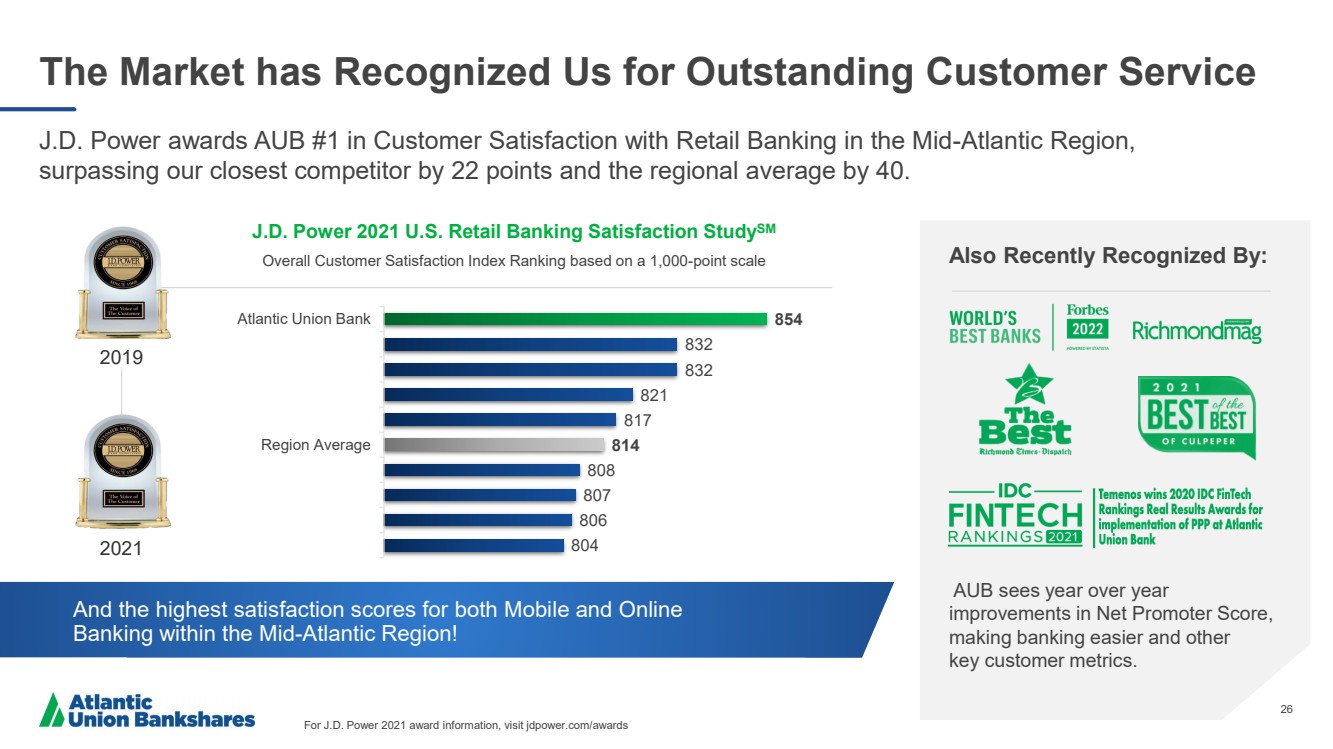
| 26 26 The Market has Recognized Us for Outstanding Customer Service J.D. Power awards AUB #1 in Customer Satisfaction with Retail Banking in the Mid - Atlantic Region, surpassing our closest competitor by 22 points and the regional average by 40. Also Recently Recognized By: AUB sees year over year improvements in Net Promoter Score, making banking easier and other key customer metrics. For J.D. Power 2021 award information, visit jdpower.com/awards And the highest satisfaction scores for both Mobile and Online Banking within the Mid - Atlantic Region! J.D. Power 2021 U.S. Retail Banking Satisfaction Study SM Overall Customer Satisfaction Index Ranking based on a 1,000 - point scale 854 832 832 821 817 814 808 807 806 804 Atlantic Union Bank Region Average 2019 2021 |
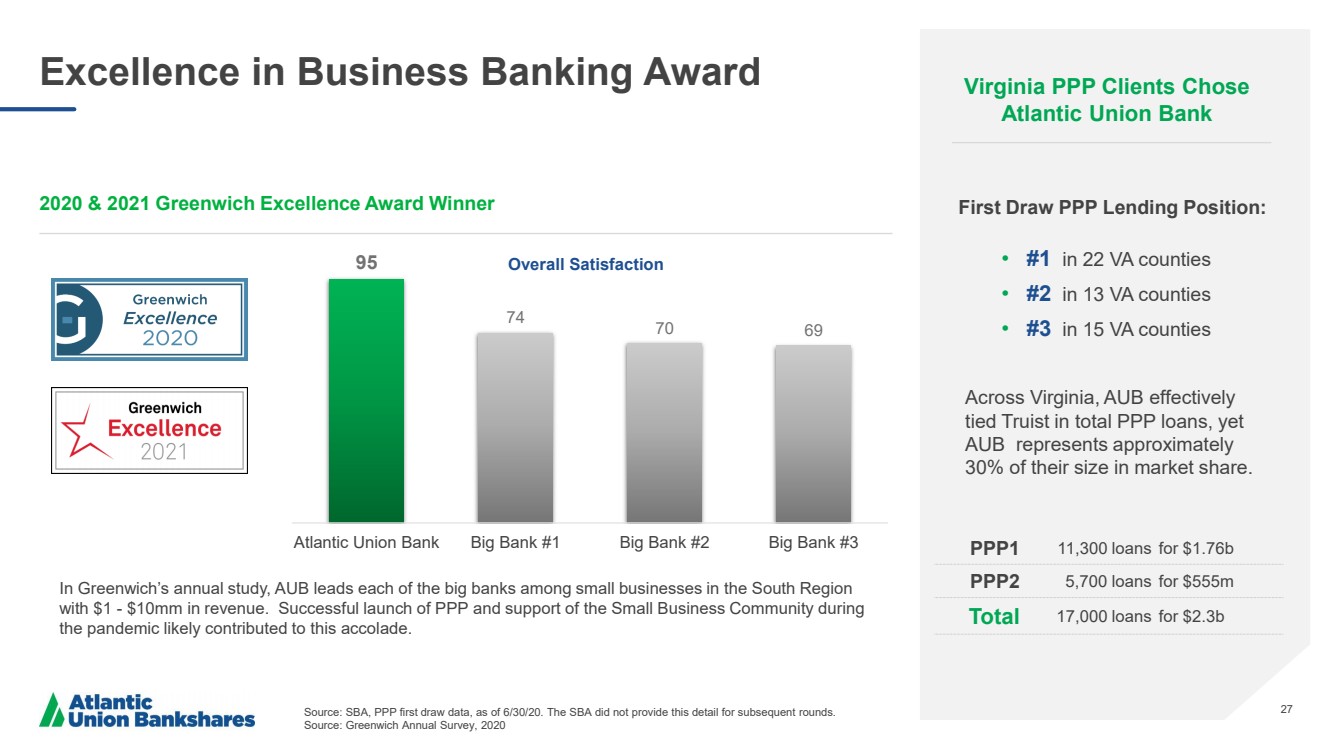
| 27 27 Excellence in Business Banking Award Source: SBA, PPP first draw data, as of 6/30/20. The SBA did not provide this detail for subsequent rounds. Source: Greenwich Annual Survey, 2020 PPP1 11,300 loans for $1.76b PPP2 5,700 loans for $555m Total 17,000 loans for $2.3b • #1 in 22 VA counties • #2 in 13 VA counties • #3 in 15 VA counties First Draw PPP Lending Position: 2020 & 2021 Greenwich Excellence Award Winner Across Virginia, AUB effectively tied Truist in total PPP loans, yet AUB represents approximately 30% of their size in market share. In Greenwich’s annual study, AUB leads each of the big banks among small businesses in the South Region with $1 - $10mm in revenue. Successful launch of PPP and support of the Small Business Community during the pandemic likely contributed to this accolade. 95 74 70 69 Atlantic Union Bank Big Bank #1 Big Bank #2 Big Bank #3 Virginia PPP Clients Chose Atlantic Union Bank Overall Satisfaction |
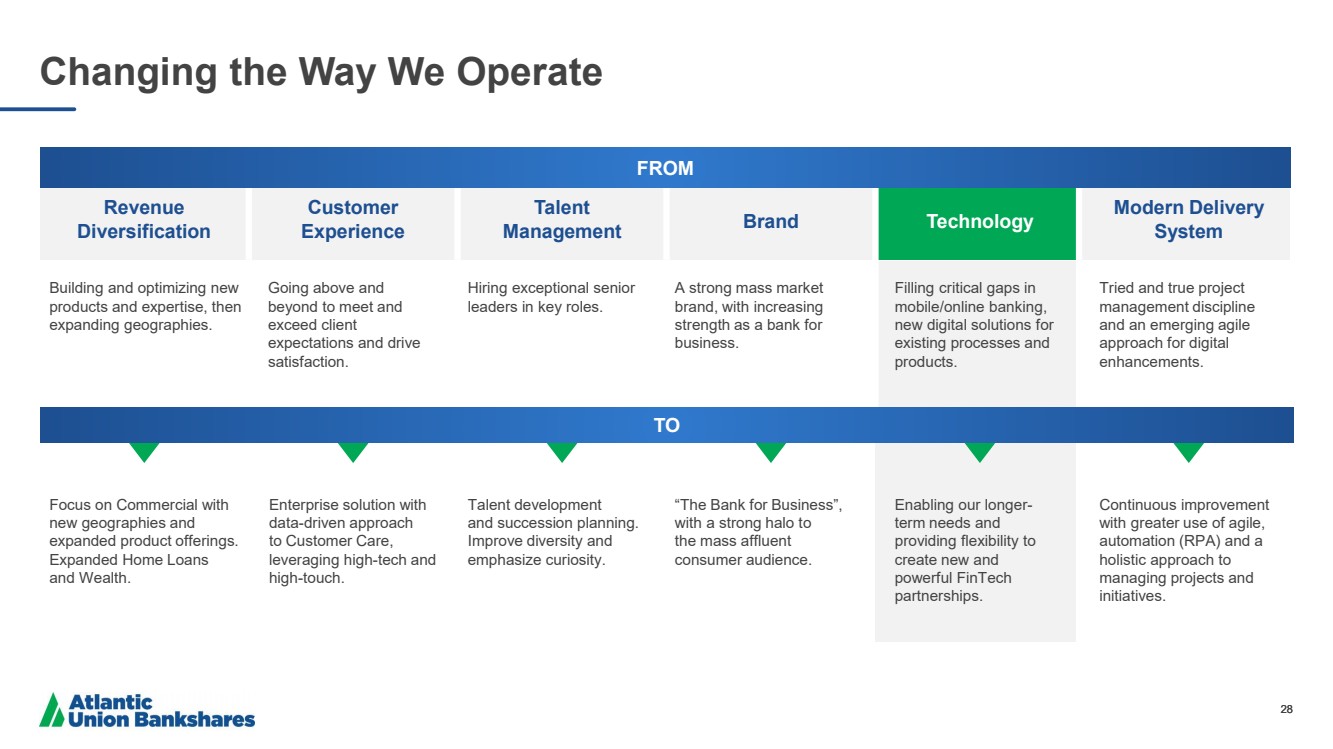
| 28 Changing the Way We Operate Revenue Diversification Customer Experience Talent Management Brand Technology Modern Delivery System Building and optimizing new products and expertise, then expanding geographies. Going above and beyond to meet and exceed client expectations and drive satisfaction. Hiring exceptional senior leaders in key roles. A strong mass market brand, with increasing strength as a bank for business. Filling critical gaps in mobile/online banking, new digital solutions for existing processes and products. Tried and true project management discipline and an emerging agile approach for digital enhancements. Focus on Commercial with new geographies and expanded product offerings. Expanded Home Loans and Wealth. Enterprise solution with data - driven approach to Customer Care, leveraging high - tech and high - touch. Talent development and succession planning. Improve diversity and emphasize curiosity. “The Bank for Business”, with a strong halo to the mass affluent consumer audience. Enabling our longer - term needs and providing flexibility to create new and powerful FinTech partnerships. Continuous improvement with greater use of agile, automation (RPA) and a holistic approach to managing projects and initiatives. 28 FROM TO |
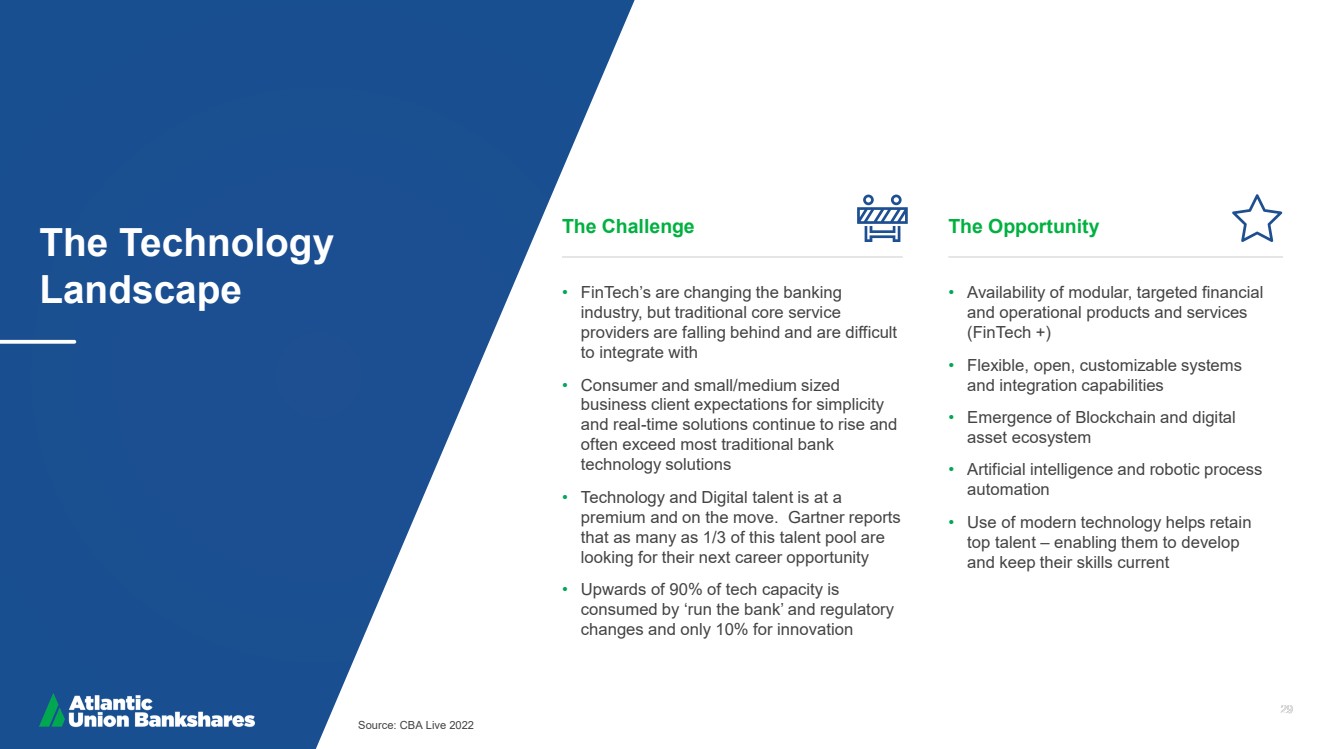
| 29 The Technology Landscape Source: CBA Live 2022 29 The Challenge The Opportunity • FinTech’s are changing the banking industry, but traditional core service providers are falling behind and are difficult to integrate with • Consumer and small/medium sized business client expectations for simplicity and real - time solutions continue to rise and often exceed most traditional bank technology solutions • Technology and Digital talent is at a premium and on the move. Gartner reports that as many as 1/3 of this talent pool are looking for their next career opportunity • Upwards of 90% of tech capacity is consumed by ‘run the bank’ and regulatory changes and only 10% for innovation • Availability of modular, targeted financial and operational products and services ( FinTech +) • Flexible, open, customizable systems and integration capabilities • Emergence of Blockchain and digital asset ecosystem • Artificial intelligence and robotic process automation • Use of modern technology helps retain top talent – enabling them to develop and keep their skills current |
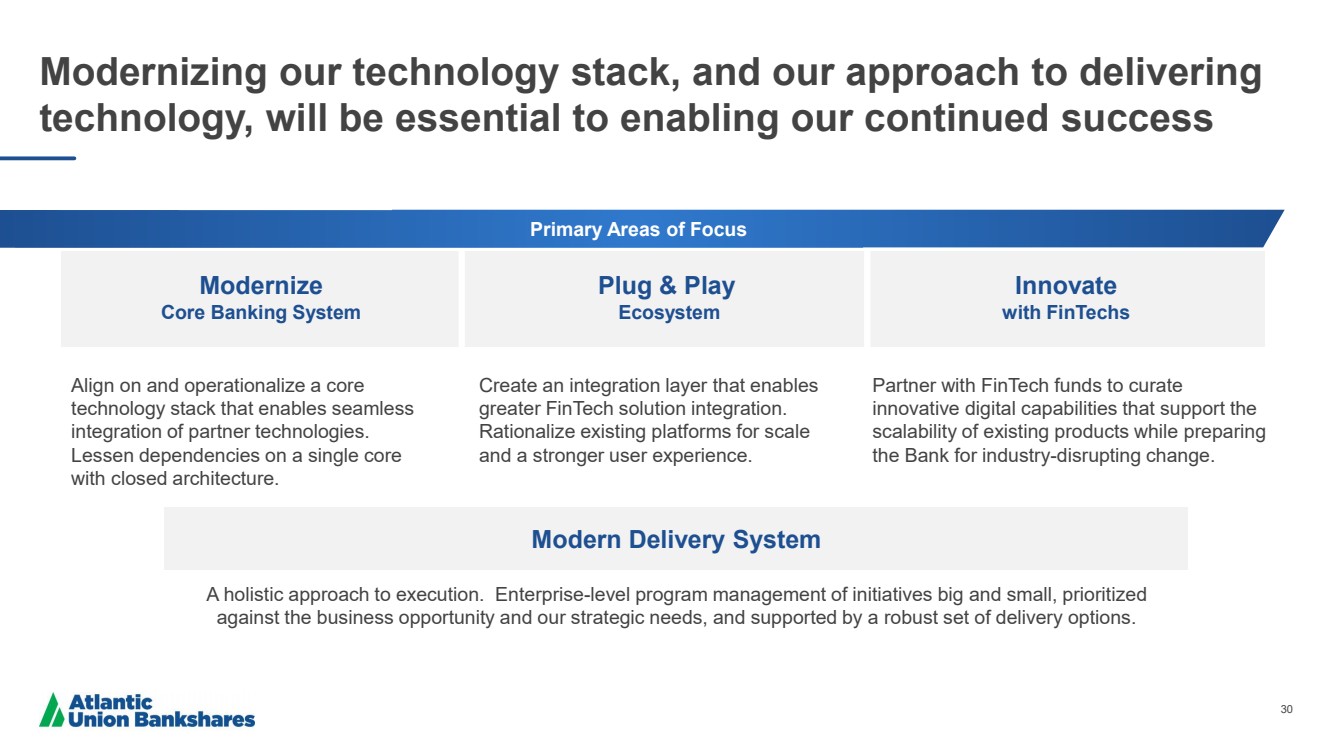
| 30 Modernizing our technology stack, and our approach to delivering technology, will be essential to enabling our continued success Modernize Core Banking System Plug & Play Ecosystem Innovate with FinTechs Align on and operationalize a core technology stack that enables seamless integration of partner technologies. Lessen dependencies on a single core with closed architecture. Create an integration layer that enables greater FinTech solution integration. Rationalize existing platforms for scale and a stronger user experience. Partner with FinTech funds to curate innovative digital capabilities that support the scalability of existing products while preparing the Bank for industry - disrupting change. A holistic approach to execution. Enterprise - level program management of initiatives big and small, prioritized against the business opportunity and our strategic needs, and supported by a robust set of delivery options. Modern Delivery System Primary Areas of Focus |
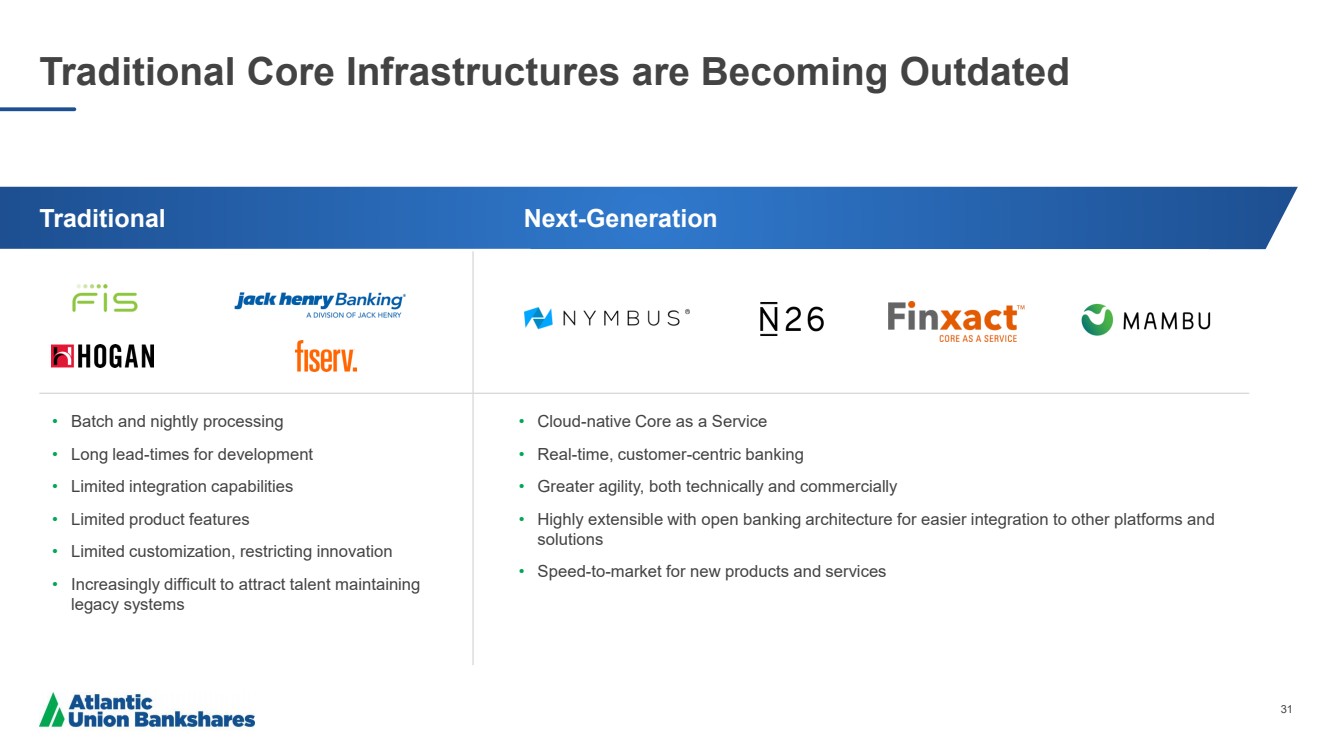
| 31 Traditional Core Infrastructures are Becoming Outdated • Batch and nightly processing • Long lead - times for development • Limited integration capabilities • Limited product features • Limited customization, restricting innovation • Increasingly difficult to attract talent maintaining legacy systems • Cloud - native Core as a Service • Real - time, customer - centric banking • Greater agility, both technically and commercially • Highly extensible with open banking architecture for easier integration to other platforms and solutions • Speed - to - market for new products and services Traditional Next - Generation |
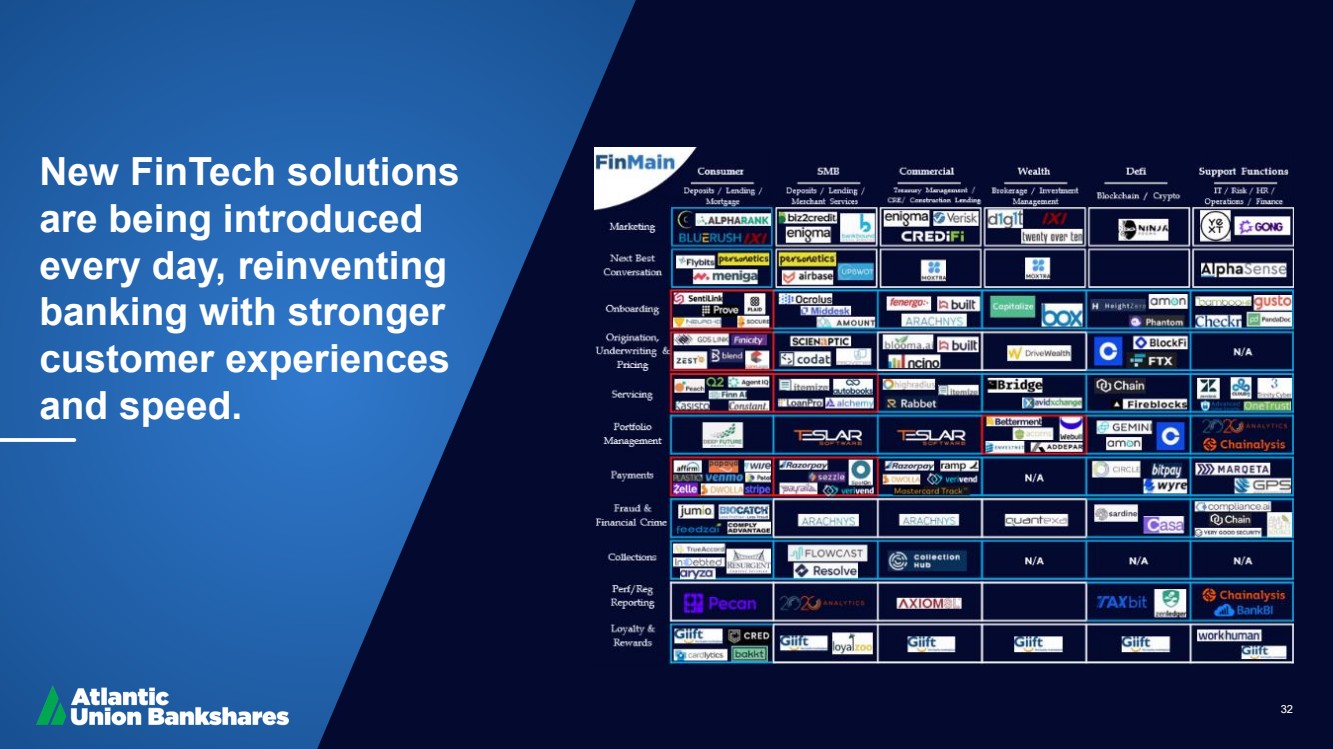
| 32 New FinTech solutions are being introduced every day, reinventing banking with stronger customer experiences and speed. 32 |
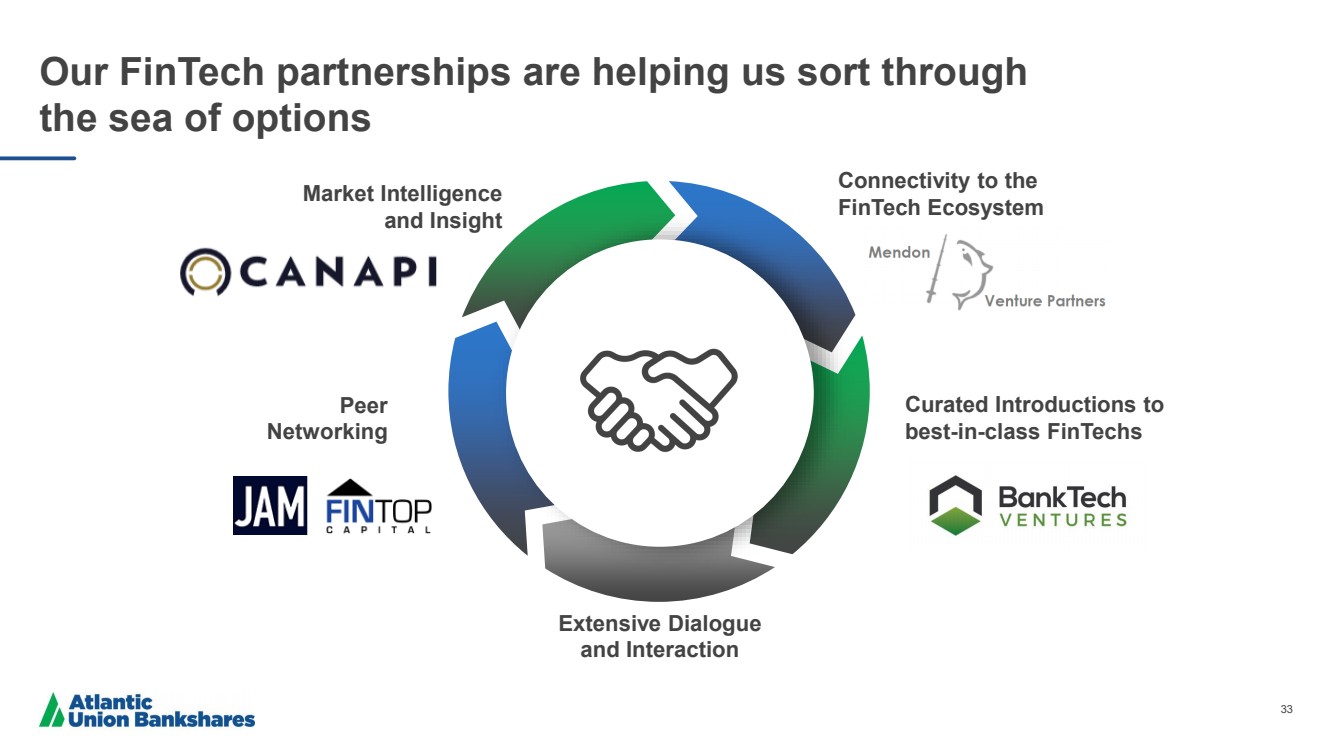
| 33 Our FinTech partnerships are helping us sort through the sea of options Market Intelligence and Insight Connectivity to the FinTech Ecosystem Curated Introductions to best - in - class FinTechs Extensive Dialogue and Interaction Peer Networking |
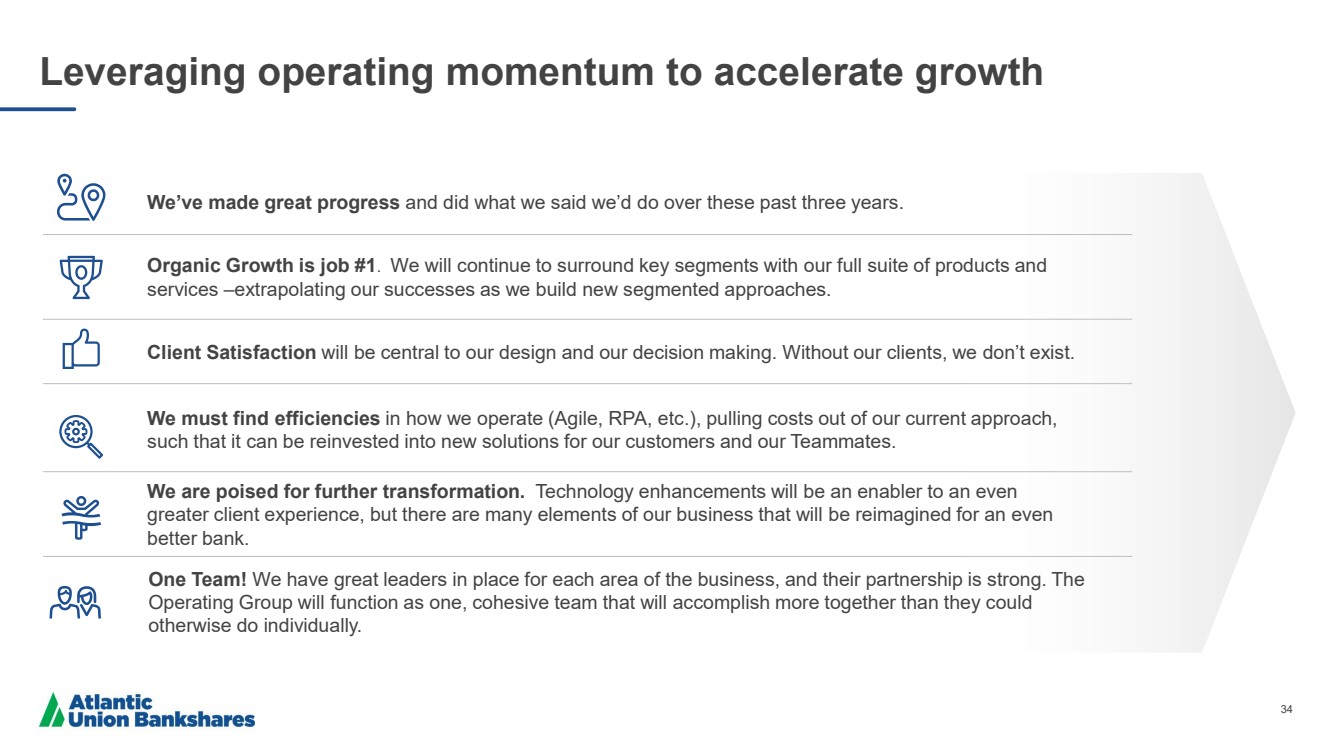
| 34 Leveraging operating momentum to accelerate growth One Team! We have great leaders in place for each area of the business, and their partnership is strong. The Operating Group will function as one, cohesive team that will accomplish more together than they could otherwise do individually. We’ve made great progress and did what we said we’d do over these past three years. We are poised for further transformation. Technology enhancements will be an enabler to an even greater client experience, but there are many elements of our business that will be reimagined for an even better bank. Client Satisfaction will be central to our design and our decision making. Without our clients, we don’t exist. Organic Growth is job #1 .. We will continue to surround key segments with our full suite of products and services – extrapolating our successes as we build new segmented approaches. We must find efficiencies in how we operate (Agile, RPA, etc.), pulling costs out of our current approach, such that it can be reinvested into new solutions for our customers and our Teammates. |
| 35 Kelly Dakin Digital Strategy & Enterprise Experience Group Executive |
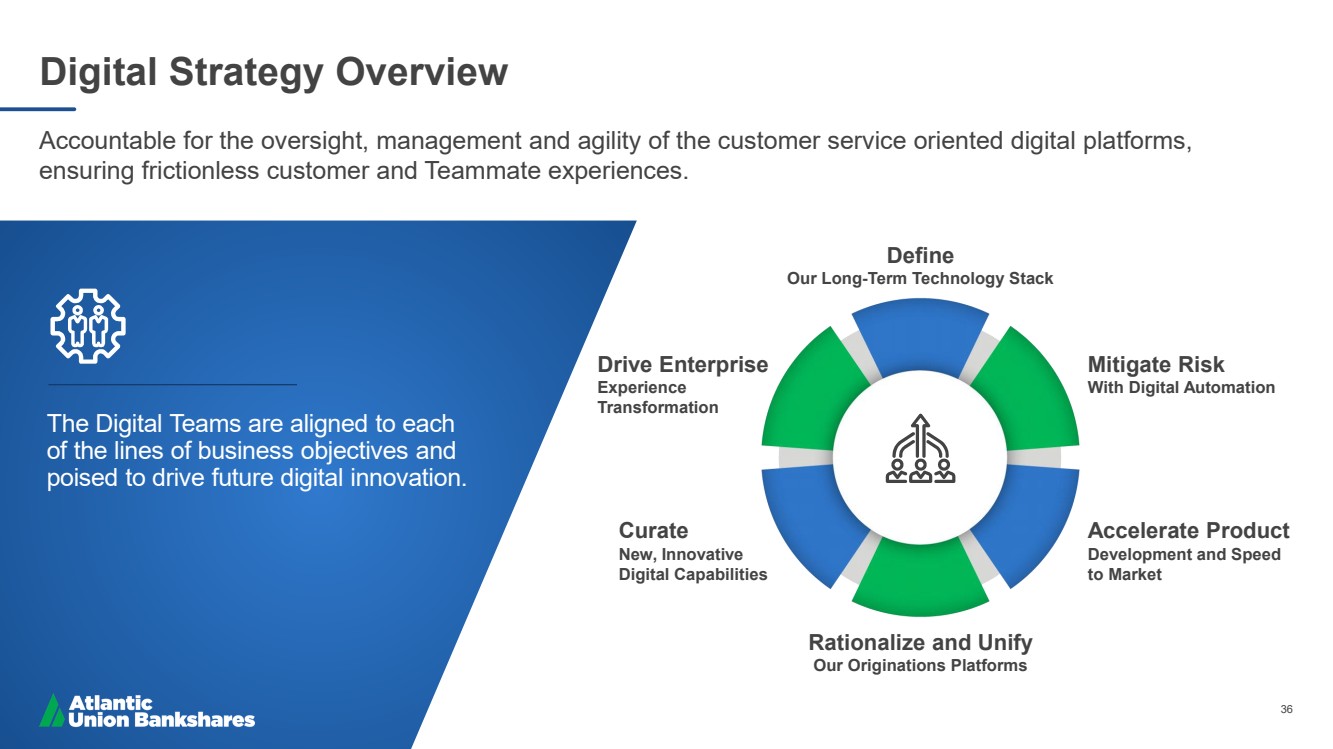
| 36 Digital Strategy Overview Accountable for the oversight, management and agility of the customer service oriented digital platforms, ensuring frictionless customer and Teammate experiences. The Digital Teams are aligned to each of the lines of business objectives and poised to drive future digital innovation. Define Our Long - Term Technology Stack Mitigate Risk With Digital Automation Accelerate Product Development and Speed to Market Rationalize and Unify Our Originations Platforms Curate New, Innovative Digital Capabilities Drive Enterprise Experience Transformation |
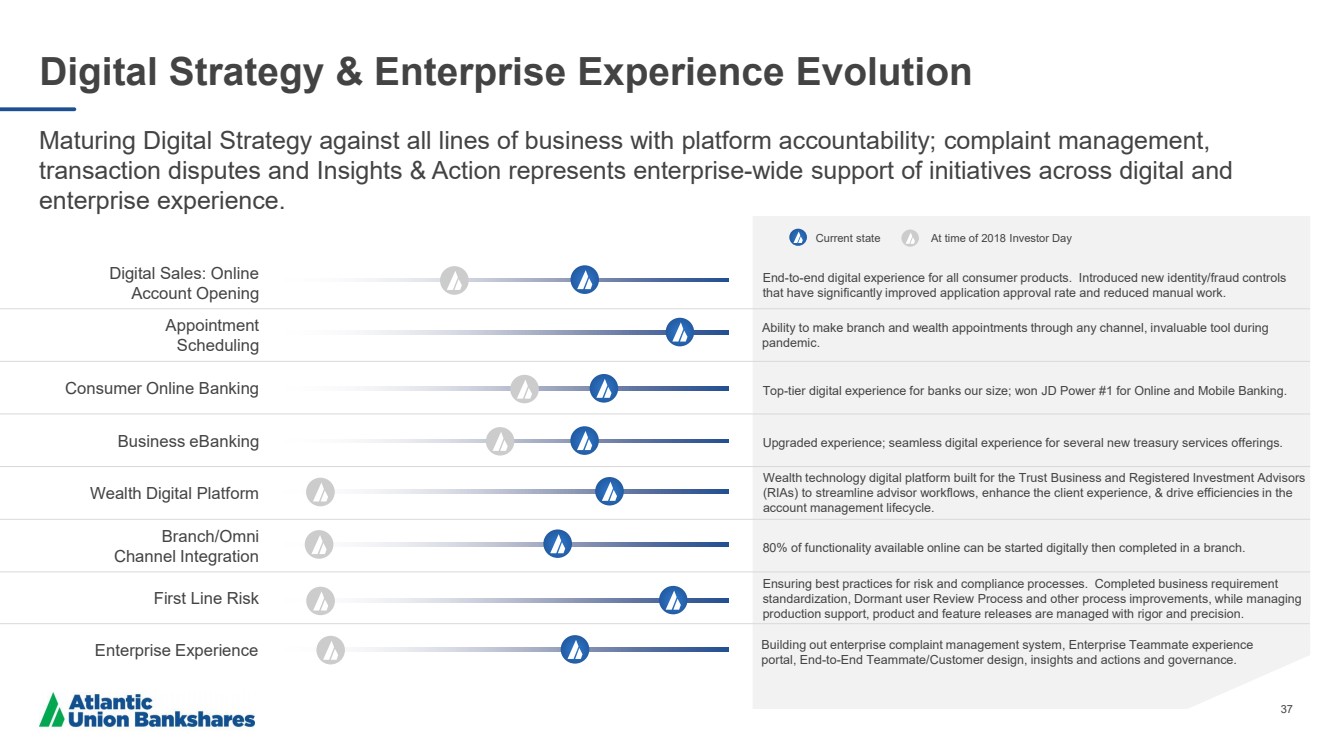
| 37 Digital Strategy & Enterprise Experience Evolution Maturing Digital Strategy against all lines of business with platform accountability; complaint management, transaction disputes and Insights & Action represents enterprise - wide support of initiatives across digital and enterprise experience. 80% of functionality available online can be started digitally then completed in a branch. Wealth technology digital platform built for the Trust Business and Registered Investment Advisors (RIAs) to streamline advisor workflows, enhance the client experience, & drive efficiencies in the account management lifecycle. Upgraded experience; seamless digital experience for several new treasury services offerings. Top - tier digital experience for banks our size; won JD Power #1 for Online and Mobile Banking. Ability to make branch and wealth appointments through any channel, invaluable tool during pandemic. Ensuring best practices for risk and compliance processes. Completed business requirement standardization, Dormant user Review Process and other process improvements, while managing production support, product and feature releases are managed with rigor and precision. Building out enterprise complaint management system, Enterprise Teammate experience portal, End - to - End Teammate/Customer design, insights and actions and governance. End - to - end digital experience for all consumer products. Introduced new identity/fraud controls that have significantly improved application approval rate and reduced manual work. Branch/Omni Channel Integration Wealth Digital Platform Business eBanking Consumer Online Banking Appointment Scheduling Digital Sales: Online Account Opening First Line Risk Enterprise Experience Current state At time of 2018 Investor Day |
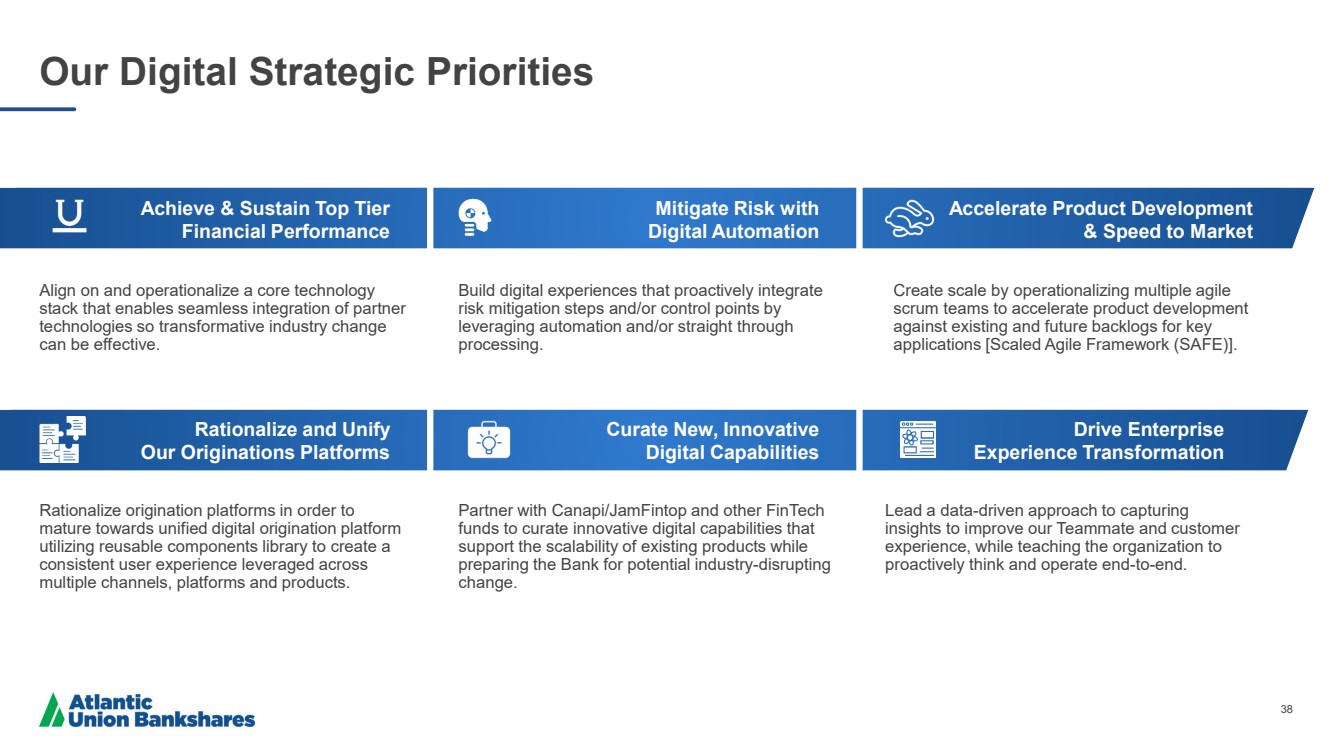
| 38 Align on and operationalize a core technology stack that enables seamless integration of partner technologies so transformative industry change can be effective. Our Digital Strategic Priorities Achieve & Sustain Top Tier Financial Performance Build digital experiences that proactively integrate risk mitigation steps and/or control points by leveraging automation and/or straight through processing. Create scale by operationalizing multiple agile scrum teams to accelerate product development against existing and future backlogs for key applications [Scaled Agile Framework (SAFE)]. Rationalize origination platforms in order to mature towards unified digital origination platform utilizing reusable components library to create a consistent user experience leveraged across multiple channels, platforms and products. Rationalize and Unify Our Originations Platforms Mitigate Risk with Digital Automation Curate New, Innovative Digital Capabilities Accelerate Product Development & Speed to Market Drive Enterprise Experience Transformation Partner with Canapi / JamFintop and other FinTech funds to curate innovative digital capabilities that support the scalability of existing products while preparing the Bank for potential industry - disrupting change. Lead a data - driven approach to capturing insights to improve our Teammate and customer experience, while teaching the organization to proactively think and operate end - to - end. |
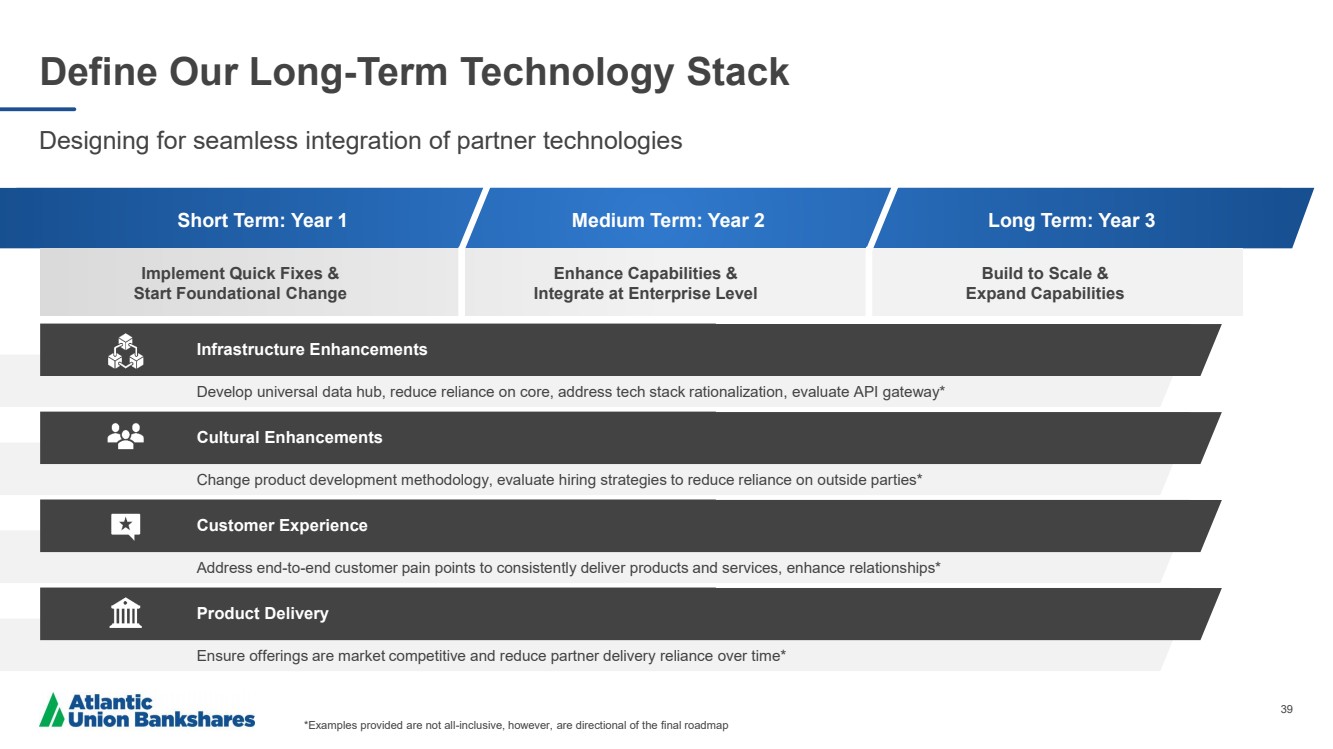
| 39 Implement Quick Fixes & Start Foundational Change Enhance Capabilities & Integrate at Enterprise Level Build to Scale & Expand Capabilities Define Our Long - Term Technology Stack Designing for seamless integration of partner technologies *Examples provided are not all - inclusive, however, are directional of the final roadmap Short Term: Year 1 Medium Term: Year 2 Long Term: Year 3 Infrastructure Enhancements Develop universal data hub, reduce reliance on core, address tech stack rationalization, evaluate API gateway* Cultural Enhancements Change product development methodology, evaluate hiring strategies to reduce reliance on outside parties* Customer Experience Address end - to - end customer pain points to consistently deliver products and services, enhance relationships* Product Delivery Ensure offerings are market competitive and reduce partner delivery reliance over time* |
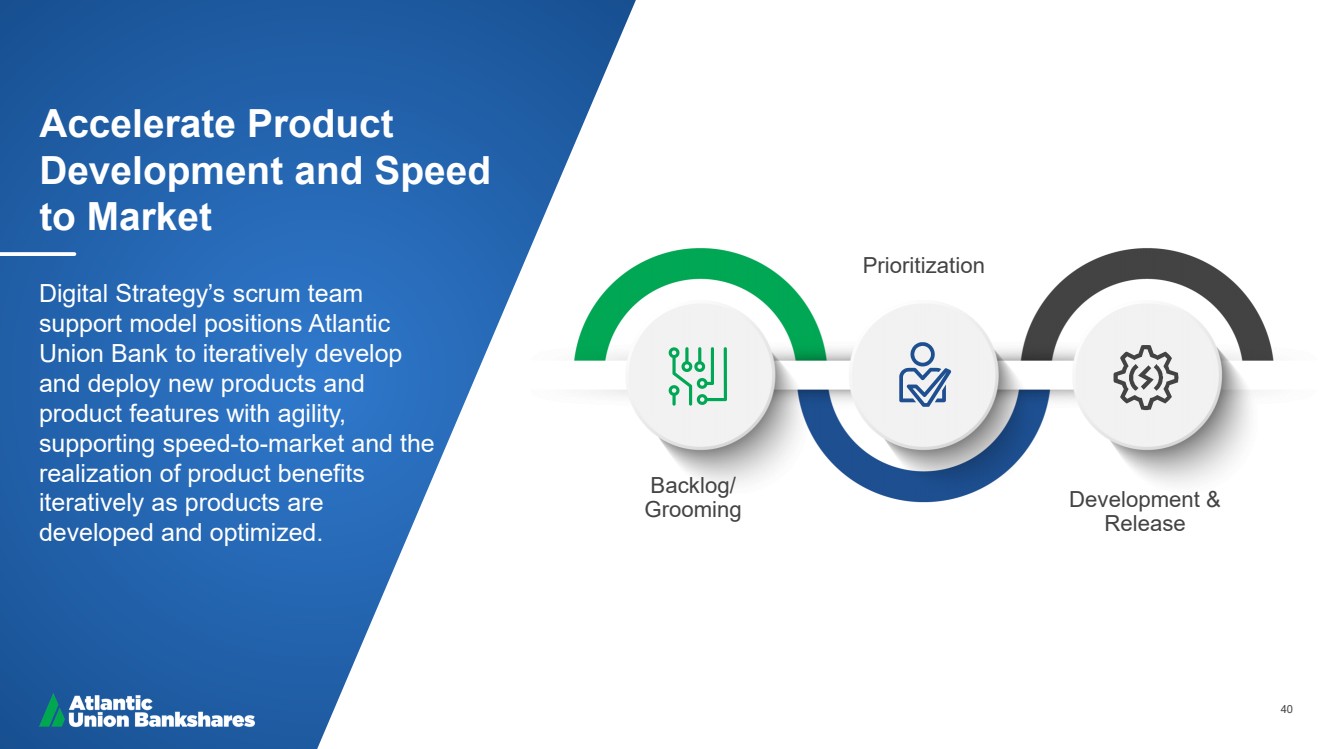
| 40 Accelerate Product Development and Speed to Market Digital Strategy’s scrum team support model positions Atlantic Union Bank to iteratively develop and deploy new products and product features with agility, supporting speed - to - market and the realization of product benefits iteratively as products are developed and optimized. Backlog/ Grooming Prioritization Development & Release |
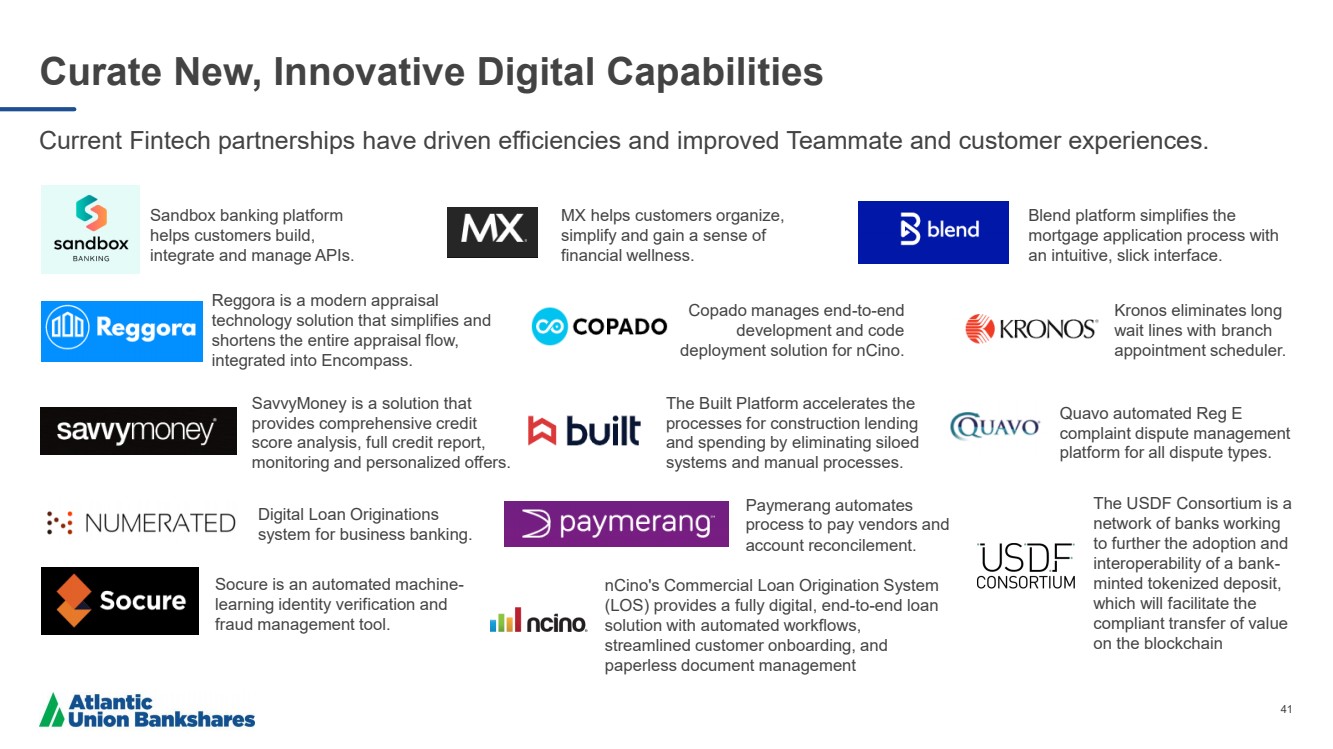
| 41 Curate New, Innovative Digital Capabilities Current Fintech partnerships have driven efficiencies and improved Teammate and customer experiences. Sandbox banking platform helps customers build, integrate and manage APIs. Reggora is a modern appraisal technology solution that simplifies and shortens the entire appraisal flow, integrated into Encompass. SavvyMoney is a solution that provides comprehensive credit score analysis, full credit report, monitoring and personalized offers. Digital Loan Originations system for business banking. Socure is an automated machine - learning identity verification and fraud management tool. Blend platform simplifies the mortgage application process with an intuitive, slick interface. Kronos eliminates long wait lines with branch appointment scheduler. Copado manages end - to - end development and code deployment solution for nCino .. Paymerang automates process to pay vendors and account reconcilement. Quavo automated Reg E complaint dispute management platform for all dispute types. The Built Platform accelerates the processes for construction lending and spending by eliminating siloed systems and manual processes. MX helps customers organize, simplify and gain a sense of financial wellness. nCino's Commercial Loan Origination System (LOS) provides a fully digital, end - to - end loan solution with automated workflows, streamlined customer onboarding, and paperless document management The USDF Consortium is a network of banks working to further the adoption and interoperability of a bank - minted tokenized deposit, which will facilitate the compliant transfer of value on the blockchain |
| 42 Dean Hackemer Home Loans Group Executive |

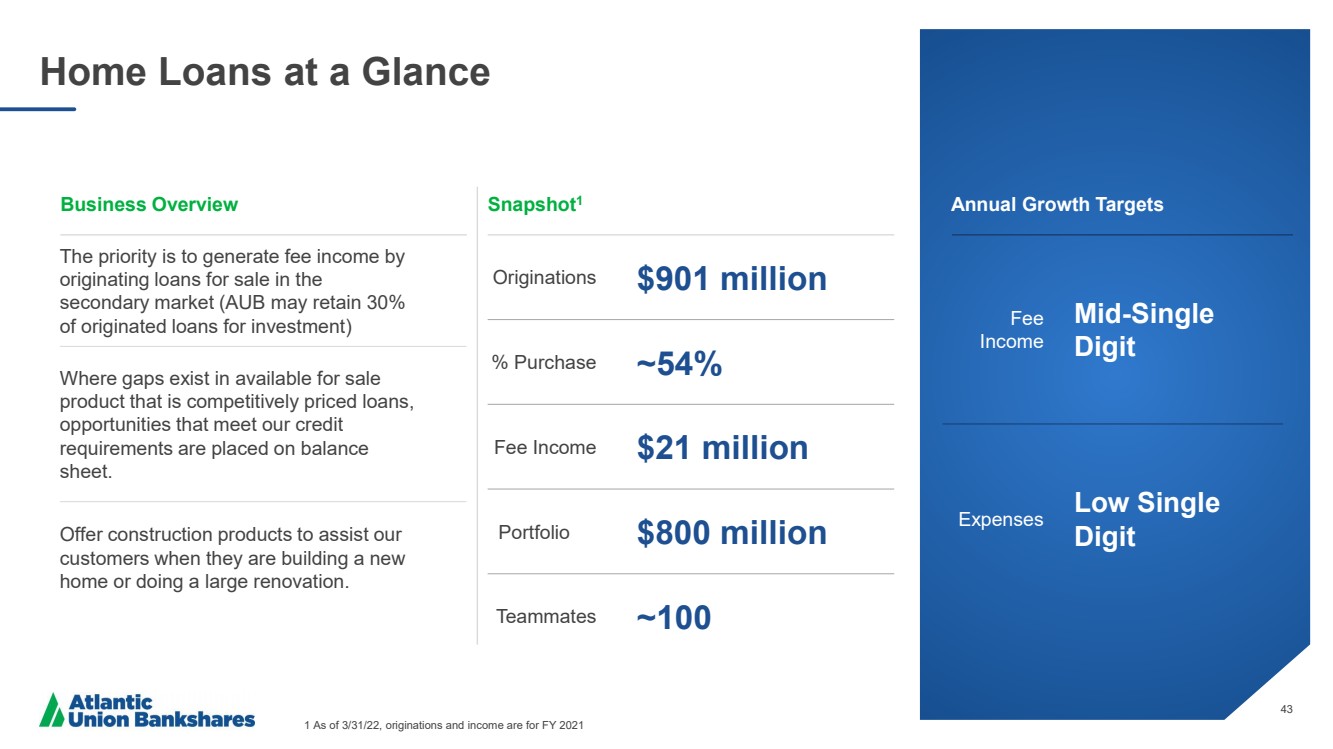
| 43 Home Loans at a Glance 1 As of 3/31/22, originations and income are for FY 2021 Annual Growth Targets The priority is to generate fee income by originating loans for sale in the secondary market (AUB may retain 30% of originated loans for investment) Where gaps exist in available for sale product that is competitively priced loans, opportunities that meet our credit requirements are placed on balance sheet. Offer construction products to assist our customers when they are building a new home or doing a large renovation. Originations $901 million % Purchase ~54% Fee Income $21 million Portfolio $800 million Teammates ~100 Fee Income Mid - Single Digit Expenses Low Single Digit Business Overview Snapshot 1 |
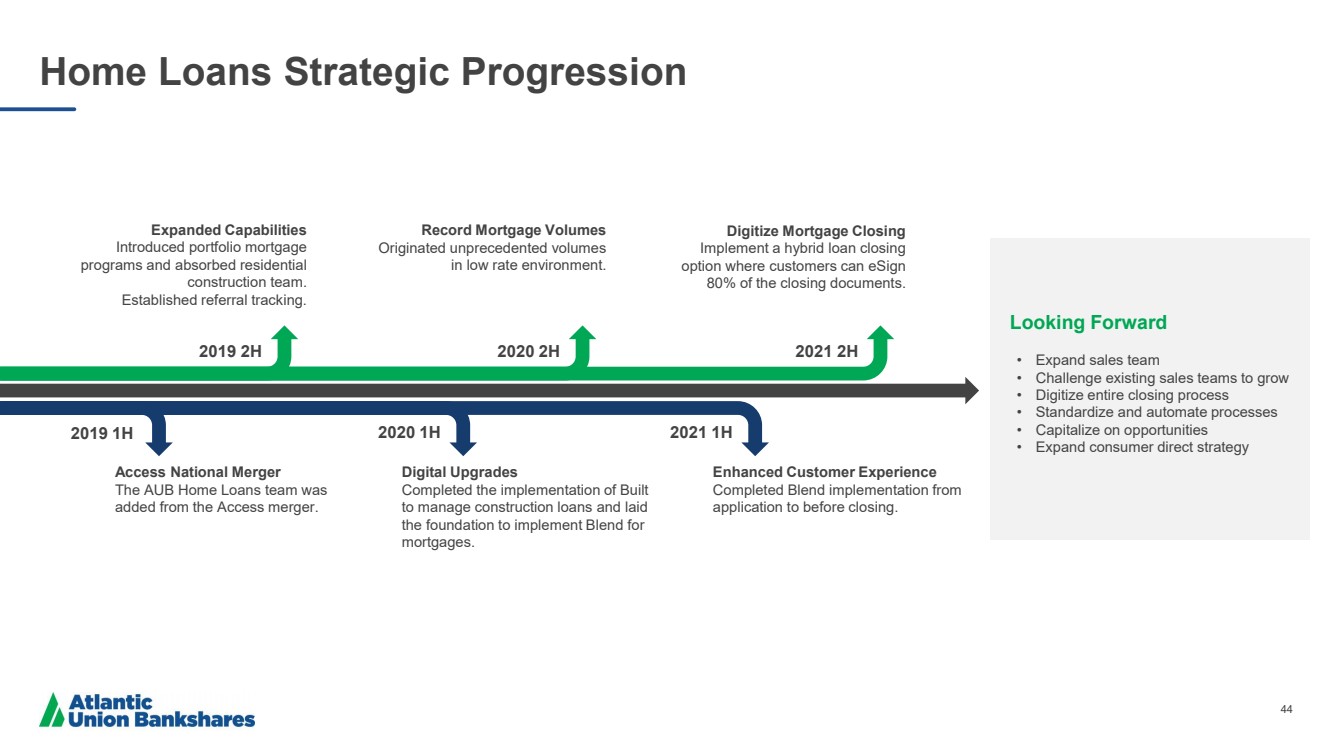
| 44 Home Loans Strategic Progression 2020 1H 2019 1H 2019 2H 2021 2H 2020 2H 2021 1H Access National Merger The AUB Home Loans team was added from the Access merger. Digital Upgrades Completed the implementation of Built to manage construction loans and laid the foundation to implement Blend for mortgages. Enhanced Customer Experience Completed Blend implementation from application to before closing. Expanded Capabilities Introduced portfolio mortgage programs and absorbed residential construction team. Established referral tracking. Record Mortgage Volumes Originated unprecedented volumes in low rate environment. Digitize Mortgage Closing Implement a hybrid loan closing option where customers can eSign 80% of the closing documents. • Expand sales team • Challenge existing sales teams to grow • Digitize entire closing process • Standardize and automate processes • Capitalize on opportunities • Expand consumer direct strategy Looking Forward |
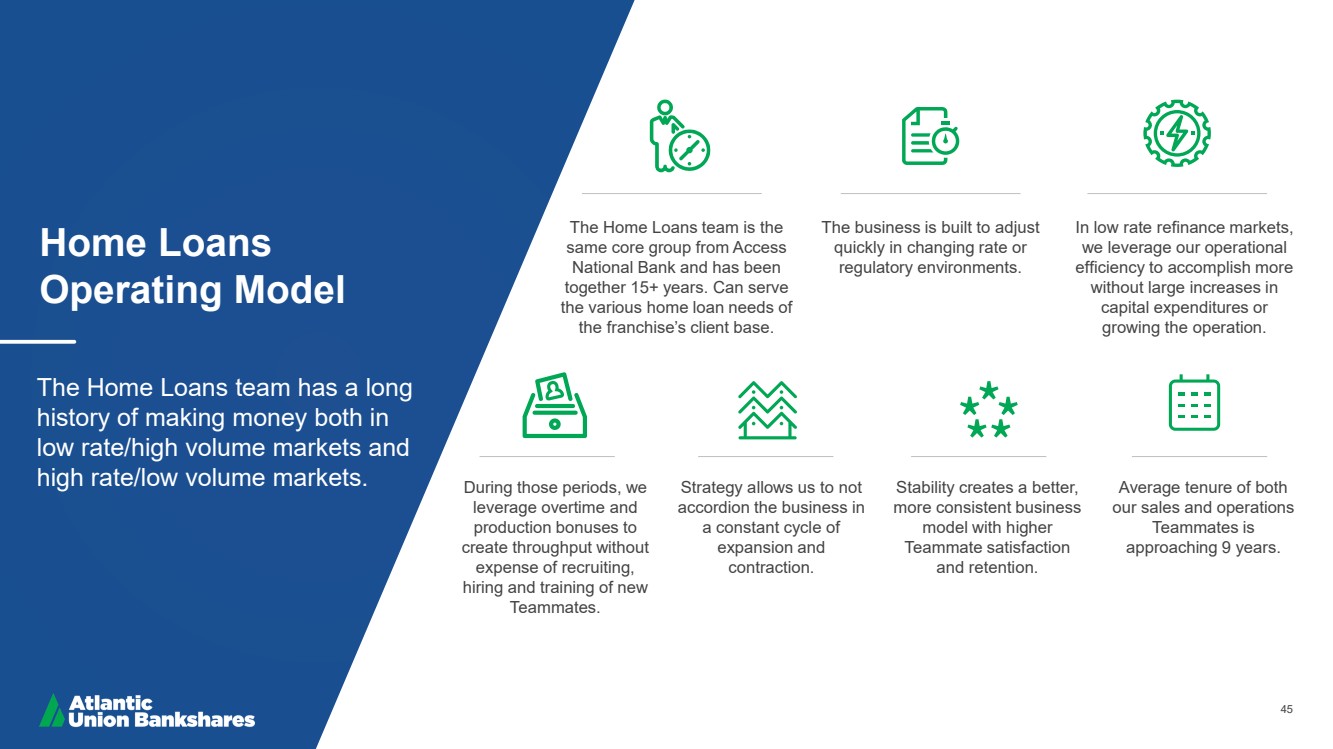
| 45 Home Loans Operating Model The Home Loans team has a long history of making money both in low rate/high volume markets and high rate/low volume markets. During those periods, we leverage overtime and production bonuses to create throughput without expense of recruiting, hiring and training of new Teammates. Strategy allows us to not accordion the business in a constant cycle of expansion and contraction. Stability creates a better, more consistent business model with higher Teammate satisfaction and retention. Average tenure of both our sales and operations Teammates is approaching 9 years. The Home Loans team is the same core group from Access National Bank and has been together 15+ years. Can serve the various home loan needs of the franchise’s client base. The business is built to adjust quickly in changing rate or regulatory environments. In low rate refinance markets, we leverage our operational efficiency to accomplish more without large increases in capital expenditures or growing the operation. |
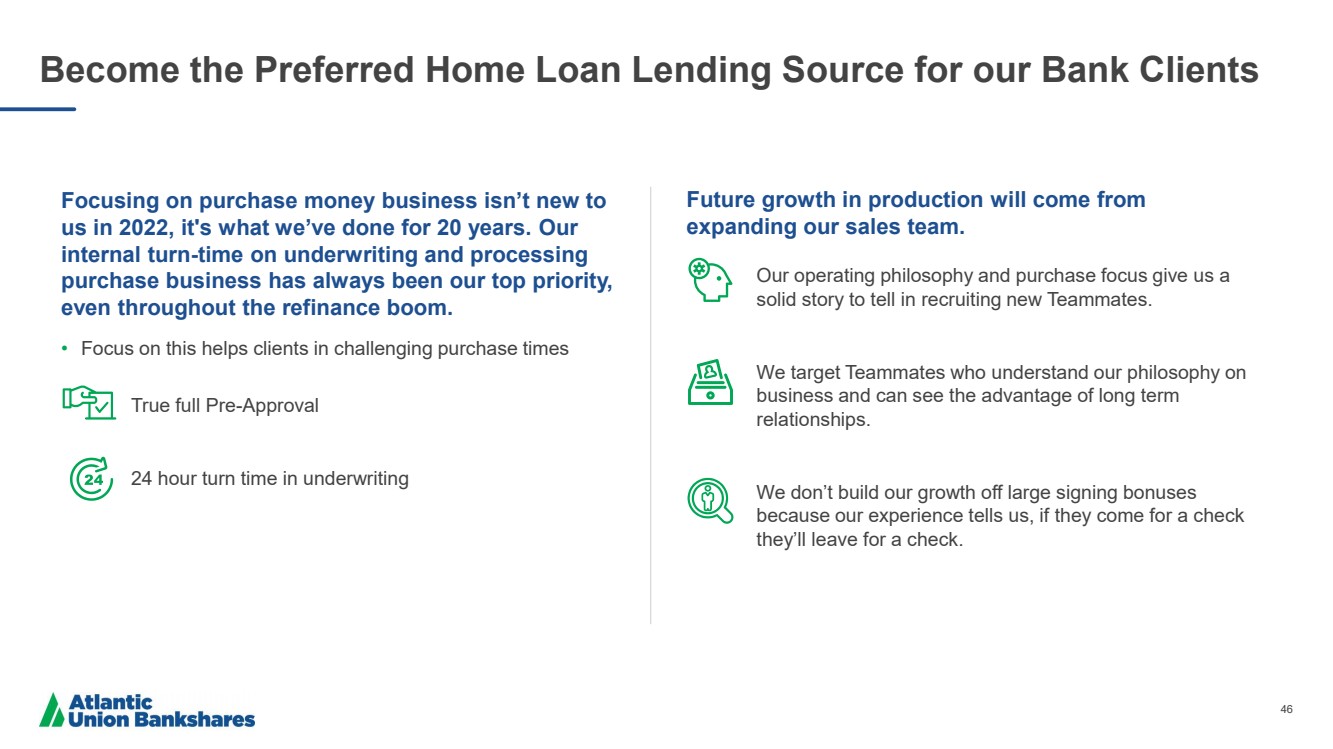
| 46 Become the Preferred Home Loan Lending Source for our Bank Clients Focusing on purchase money business isn’t new to us in 2022, it's what we’ve done for 20 years. Our internal turn - time on underwriting and processing purchase business has always been our top priority, even throughout the refinance boom. • Focus on this helps clients in challenging purchase times True full Pre - Approval 24 hour turn time in underwriting Future growth in production will come from expanding our sales team. Our operating philosophy and purchase focus give us a solid story to tell in recruiting new Teammates. We target Teammates who understand our philosophy on business and can see the advantage of long term relationships. We don’t build our growth off large signing bonuses because our experience tells us, if they come for a check they’ll leave for a check. |
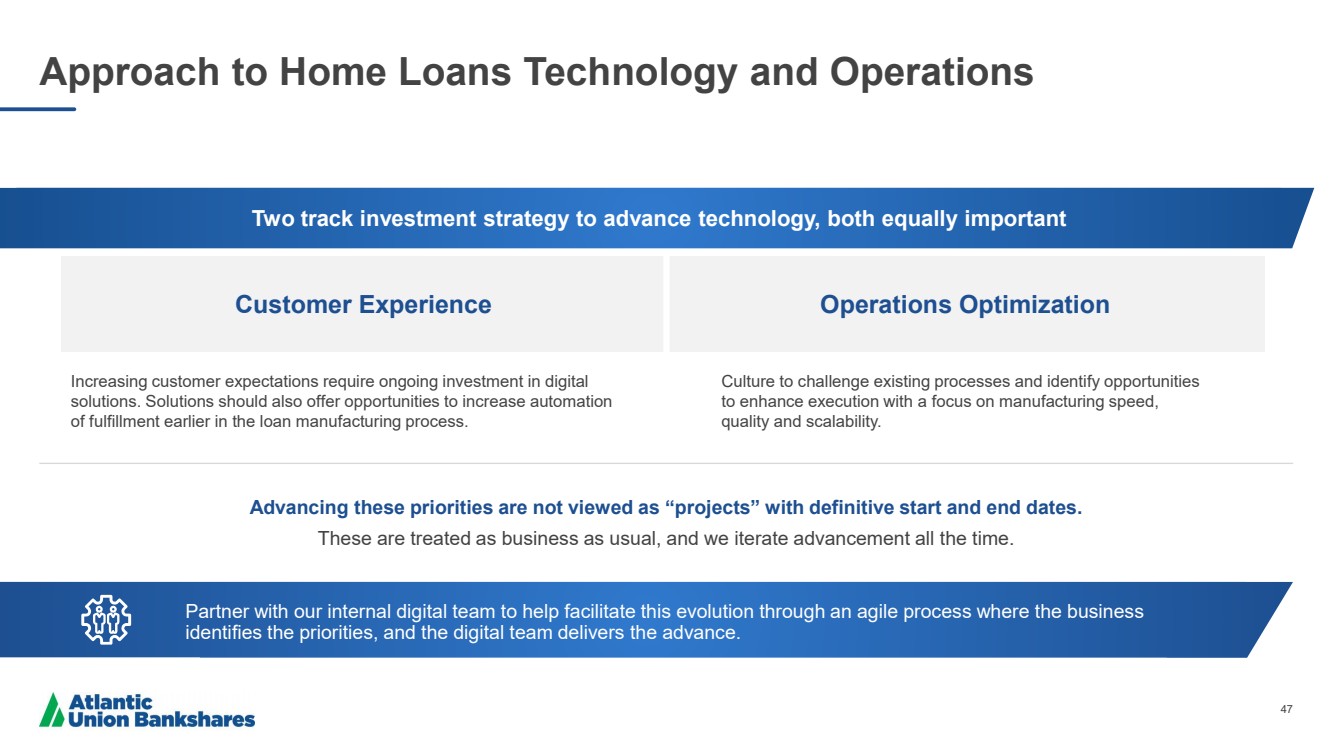
| 47 Approach to Home Loans Technology and Operations Customer Experience Operations Optimization Two track investment strategy to advance technology, both equally important Partner with our internal digital team to help facilitate this evolution through an agile process where the business identifies the priorities, and the digital team delivers the advance. Culture to challenge existing processes and identify opportunities to enhance execution with a focus on manufacturing speed, quality and scalability. Increasing customer expectations require ongoing investment in digital solutions. Solutions should also offer opportunities to increase automation of fulfillment earlier in the loan manufacturing process. Advancing these priorities are not viewed as “projects” with definitive start and end dates. These are treated as business as usual, and we iterate advancement all the time. |
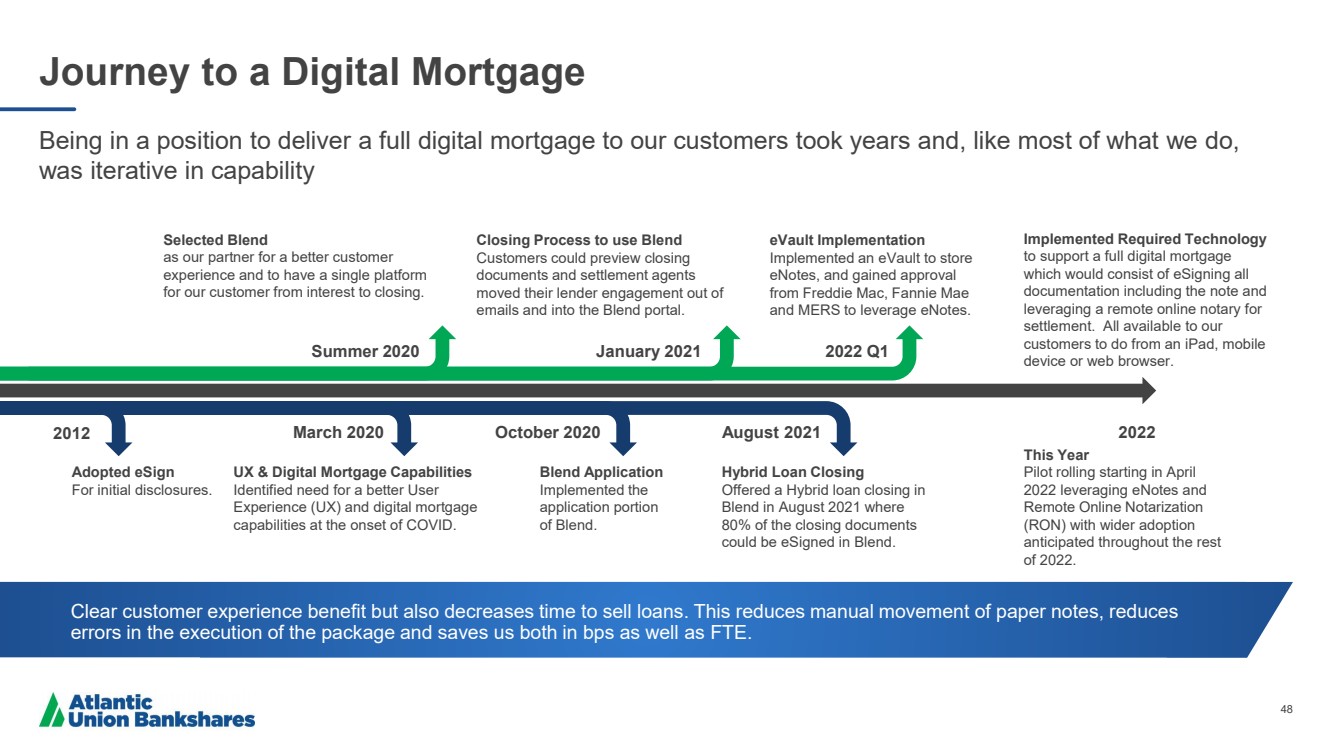
| 48 Journey to a Digital Mortgage Being in a position to deliver a full digital mortgage to our customers took years and, like most of what we do, was iterative in capability March 2020 2012 January 2021 Summer 2020 October 2020 Adopted eSign For initial disclosures. UX & Digital Mortgage Capabilities Identified need for a better User Experience (UX) and digital mortgage capabilities at the onset of COVID. Blend Application Implemented the application portion of Blend. Selected Blend as our partner for a better customer experience and to have a single platform for our customer from interest to closing. Closing Process to use Blend Customers could preview closing documents and settlement agents moved their lender engagement out of emails and into the Blend portal. Implemented Required Technology to support a full digital mortgage which would consist of eSigning all documentation including the note and leveraging a remote online notary for settlement. All available to our customers to do from an iPad, mobile device or web browser. August 2021 Hybrid Loan Closing Offered a Hybrid loan closing in Blend in August 2021 where 80% of the closing documents could be eSigned in Blend. 2022 Q1 Clear customer experience benefit but also decreases time to sell loans. This reduces manual movement of paper notes, reduces errors in the execution of the package and saves us both in bps as well as FTE. eVault Implementation Implemented an eVault to store eNotes , and gained approval from Freddie Mac, Fannie Mae and MERS to leverage eNotes .. 2022 This Year Pilot rolling starting in April 2022 leveraging eNotes and Remote Online Notarization (RON) with wider adoption anticipated throughout the rest of 2022. |
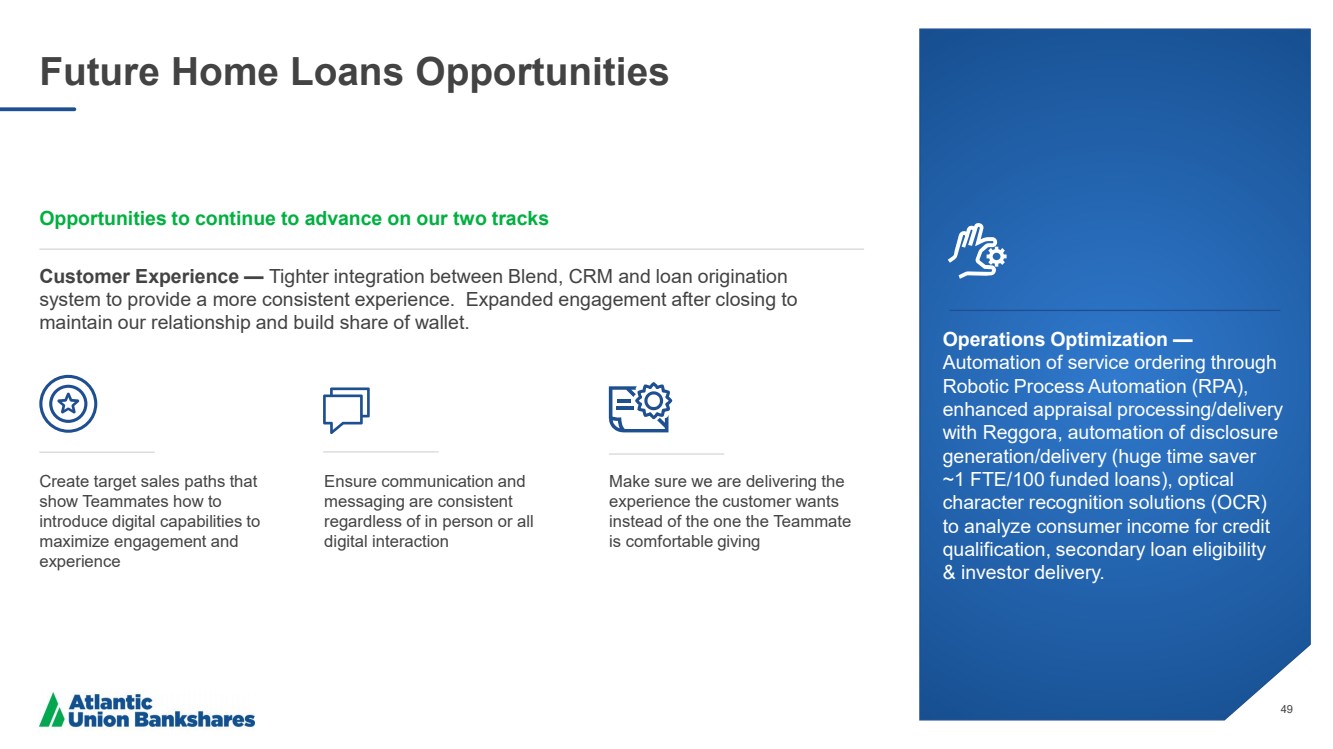
| 49 Operations Optimization — Automation of service ordering through Robotic Process Automation (RPA), enhanced appraisal processing/delivery with Reggora , automation of disclosure generation/delivery (huge time saver ~1 FTE/100 funded loans), optical character recognition solutions (OCR) to analyze consumer income for credit qualification, secondary loan eligibility & investor delivery. Future Home Loans Opportunities Opportunities to continue to advance on our two tracks Customer Experience — Tighter integration between Blend, CRM and loan origination system to provide a more consistent experience. Expanded engagement after closing to maintain our relationship and build share of wallet. Create target sales paths that show Teammates how to introduce digital capabilities to maximize engagement and experience Ensure communication and messaging are consistent regardless of in person or all digital interaction Make sure we are delivering the experience the customer wants instead of the one the Teammate is comfortable giving |
| 50 David Zimmerman Wealth Management Group Executive |
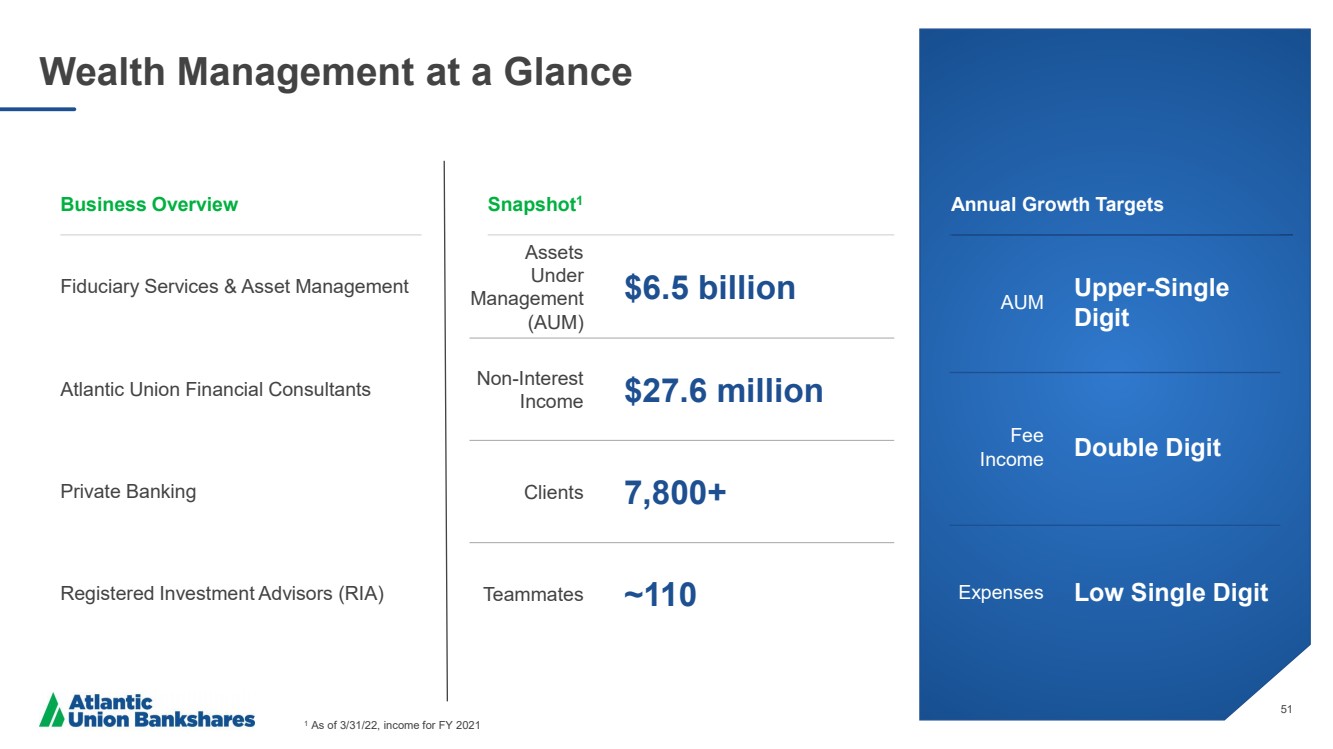
| 51 Wealth Management at a Glance 1 As of 3/31/22, income for FY 2021 Annual Growth Targets AUM Upper - Single Digit Fee Income Double Digit Expenses Low Single Digit Business Overview Snapshot 1 Fiduciary Services & Asset Management Atlantic Union Financial Consultants Private Banking Registered Investment Advisors (RIA) Assets Under Management (AUM) $6.5 billion Non - Interest Income $27.6 million Clients 7,800+ Teammates ~110 |
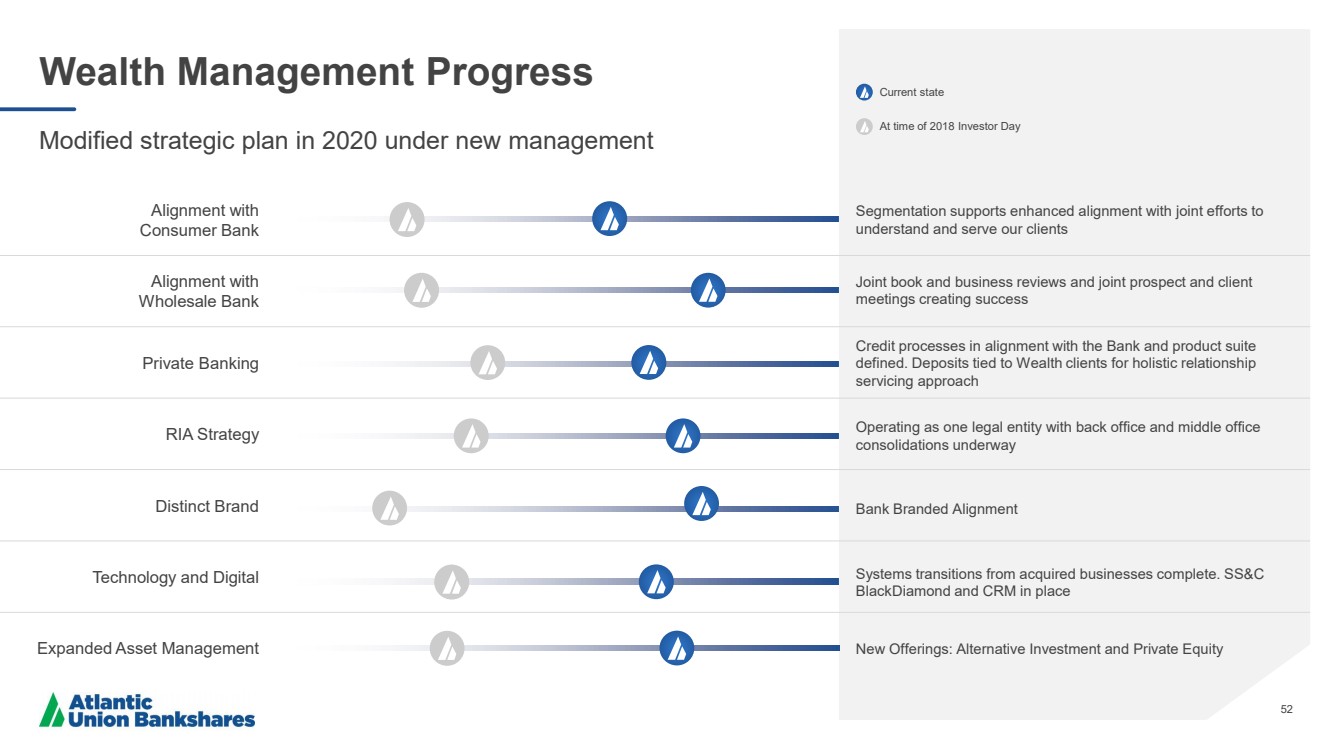
| 52 Wealth Management Progress Modified strategic plan in 2020 under new management Systems transitions from acquired businesses complete. SS&C BlackDiamond and CRM in place Bank Branded Alignment Operating as one legal entity with back office and middle office consolidations underway Credit processes in alignment with the Bank and product suite defined. Deposits tied to Wealth clients for holistic relationship servicing approach Joint book and business reviews and joint prospect and client meetings creating success Segmentation supports enhanced alignment with joint efforts to understand and serve our clients Technology and Digital Distinct Brand RIA Strategy Private Banking Alignment with Wholesale Bank Alignment with Consumer Bank Current state At time of 2018 Investor Day New Offerings: Alternative Investment and Private Equity Expanded Asset Management |
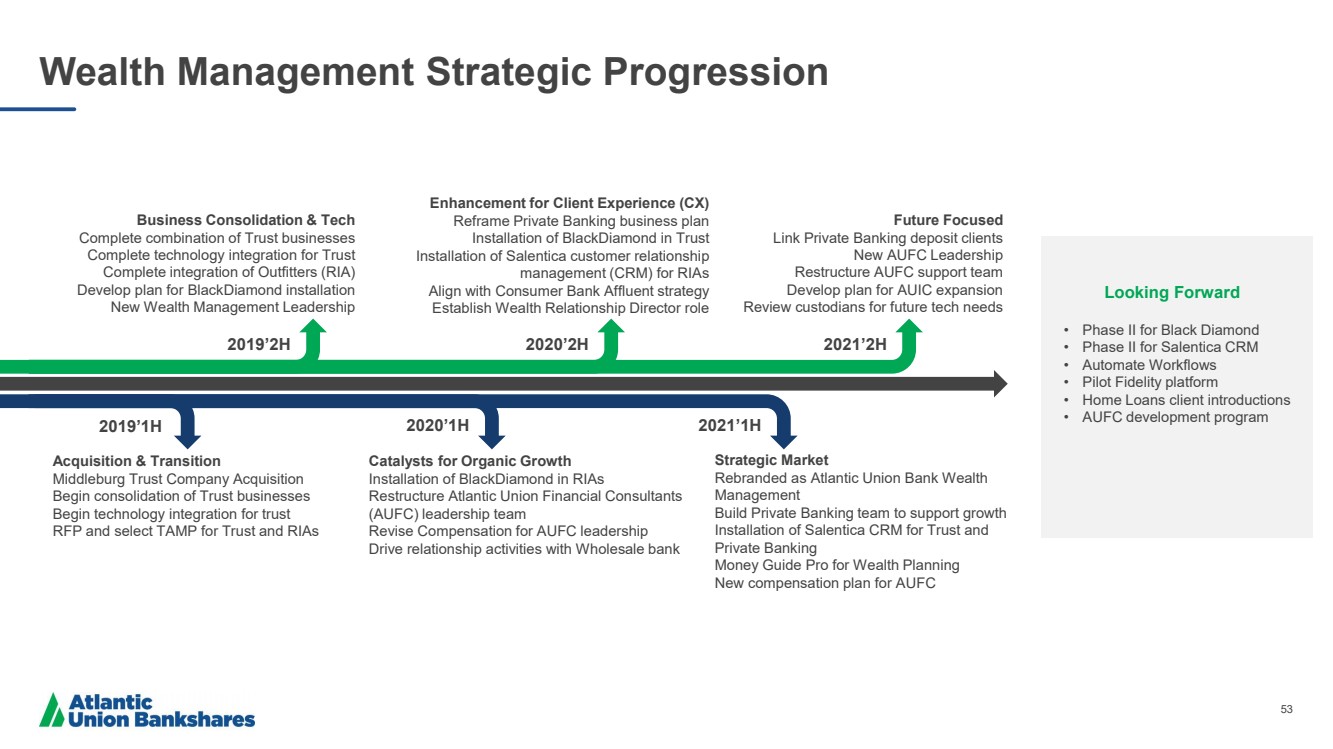
| 53 Wealth Management Strategic Progression Business Consolidation & Tech Complete combination of Trust businesses Complete technology integration for Trust Complete integration of Outfitters (RIA) Develop plan for BlackDiamond installation New Wealth Management Leadership Enhancement for Client Experience (CX) Reframe Private Banking business plan Installation of BlackDiamond in Trust Installation of Salentica customer relationship management (CRM) for RIAs Align with Consumer Bank Affluent strategy Establish Wealth Relationship Director role Future Focused Link Private Banking deposit clients New AUFC Leadership Restructure AUFC support team Develop plan for AUIC expansion Review custodians for future tech needs 2020’1H 2019’1H 2019’2H 2021’2H 2020’2H 2021’1H Acquisition & Transition Middleburg Trust Company Acquisition Begin consolidation of Trust businesses Begin technology integration for trust RFP and select TAMP for Trust and RIAs Catalysts for Organic Growth Installation of BlackDiamond in RIAs Restructure Atlantic Union Financial Consultants (AUFC) leadership team Revise Compensation for AUFC leadership Drive relationship activities with Wholesale bank Strategic Market Rebranded as Atlantic Union Bank Wealth Management Build Private Banking team to support growth Installation of Salentica CRM for Trust and Private Banking Money Guide Pro for Wealth Planning New compensation plan for AUFC • Phase II for Black Diamond • Phase II for Salentica CRM • Automate Workflows • Pilot Fidelity platform • Home Loans client introductions • AUFC development program Looking Forward |
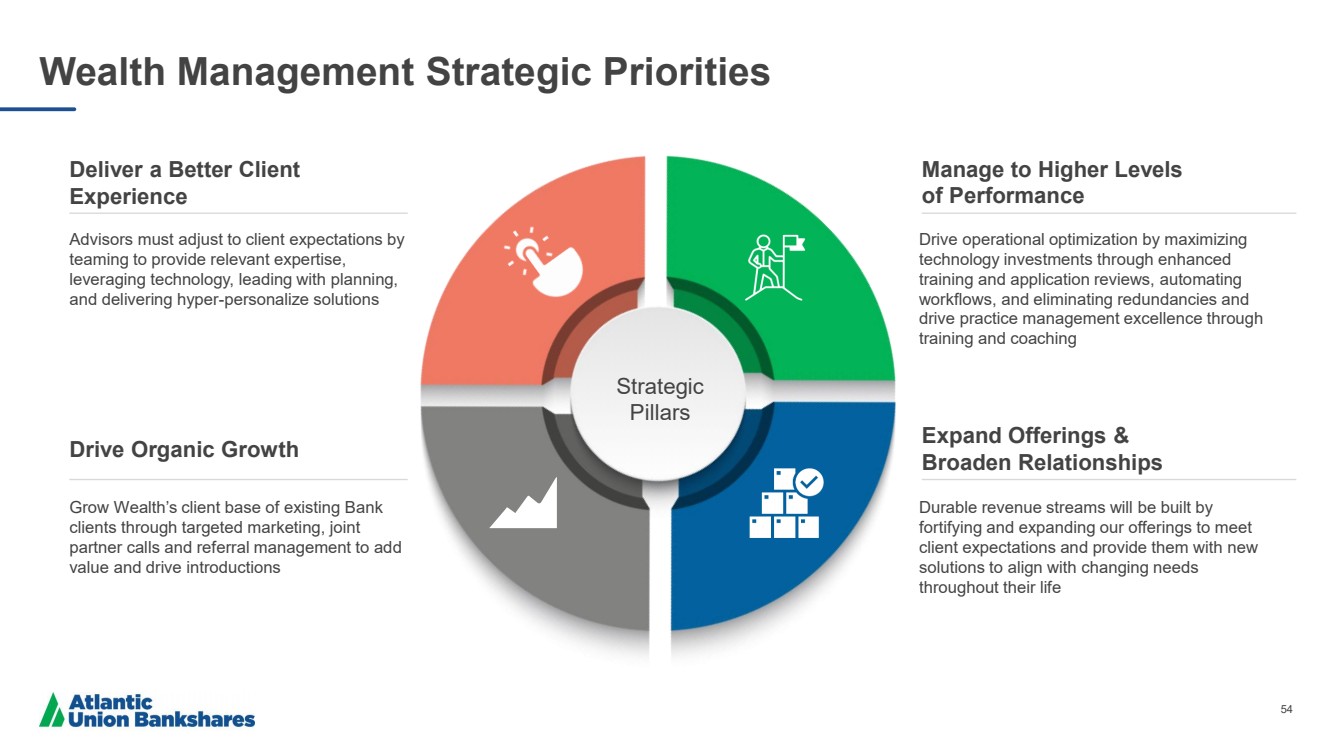
| 54 Wealth Management Strategic Priorities Grow Wealth’s client base of existing Bank clients through targeted marketing, joint partner calls and referral management to add value and drive introductions Deliver a Better Client Experience Advisors must adjust to client expectations by teaming to provide relevant expertise, leveraging technology, leading with planning, and delivering hyper - personalize solutions Durable revenue streams will be built by fortifying and expanding our offerings to meet client expectations and provide them with new solutions to align with changing needs throughout their life Drive operational optimization by maximizing technology investments through enhanced training and application reviews, automating workflows, and eliminating redundancies and drive practice management excellence through training and coaching Strategic Pillars Manage to Higher Levels of Performance Drive Organic Growth Expand Offerings & Broaden Relationships |
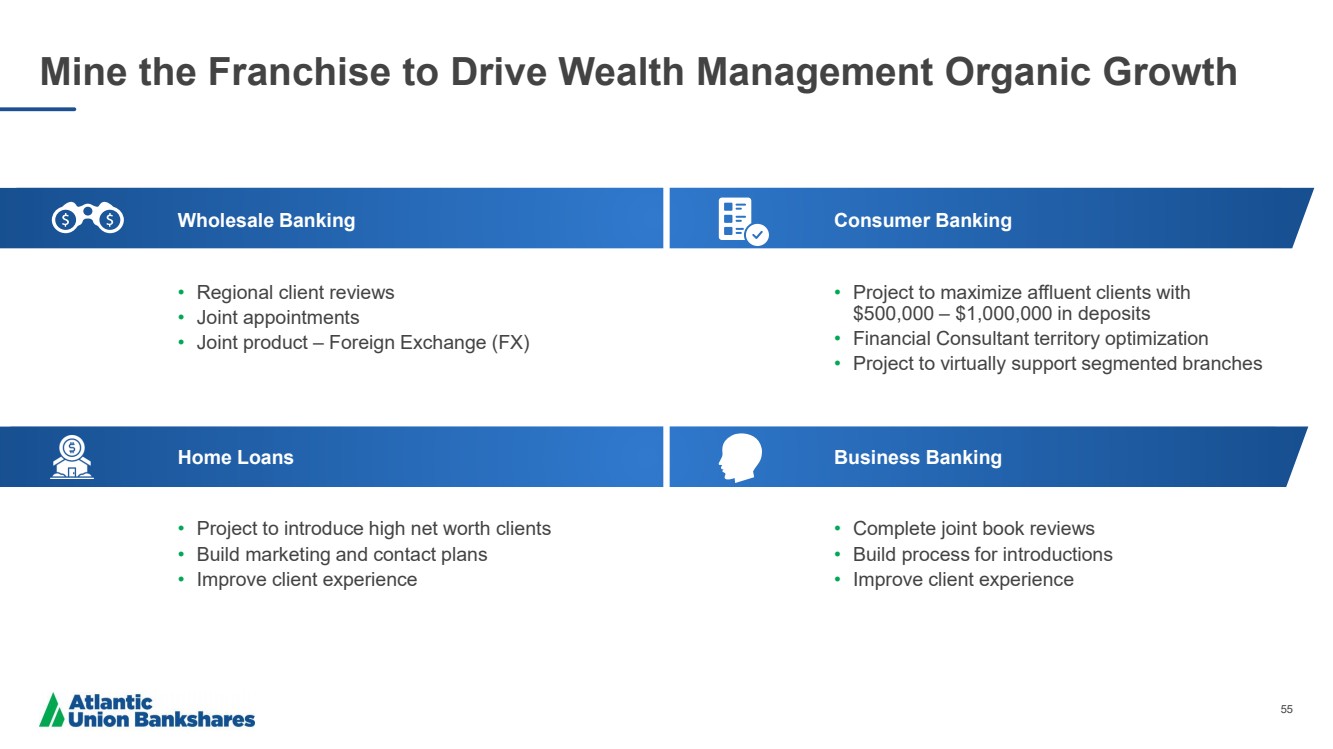
| 55 • Regional client reviews • Joint appointments • Joint product – Foreign Exchange (FX) Mine the Franchise to Drive Wealth Management Organic Growth Wholesale Banking • Project to maximize affluent clients with $500,000 – $1,000,000 in deposits • Financial Consultant territory optimization • Project to virtually support segmented branches • Project to introduce high net worth clients • Build marketing and contact plans • Improve client experience Home Loans Business Banking • Complete joint book reviews • Build process for introductions • Improve client experience Consumer Banking |
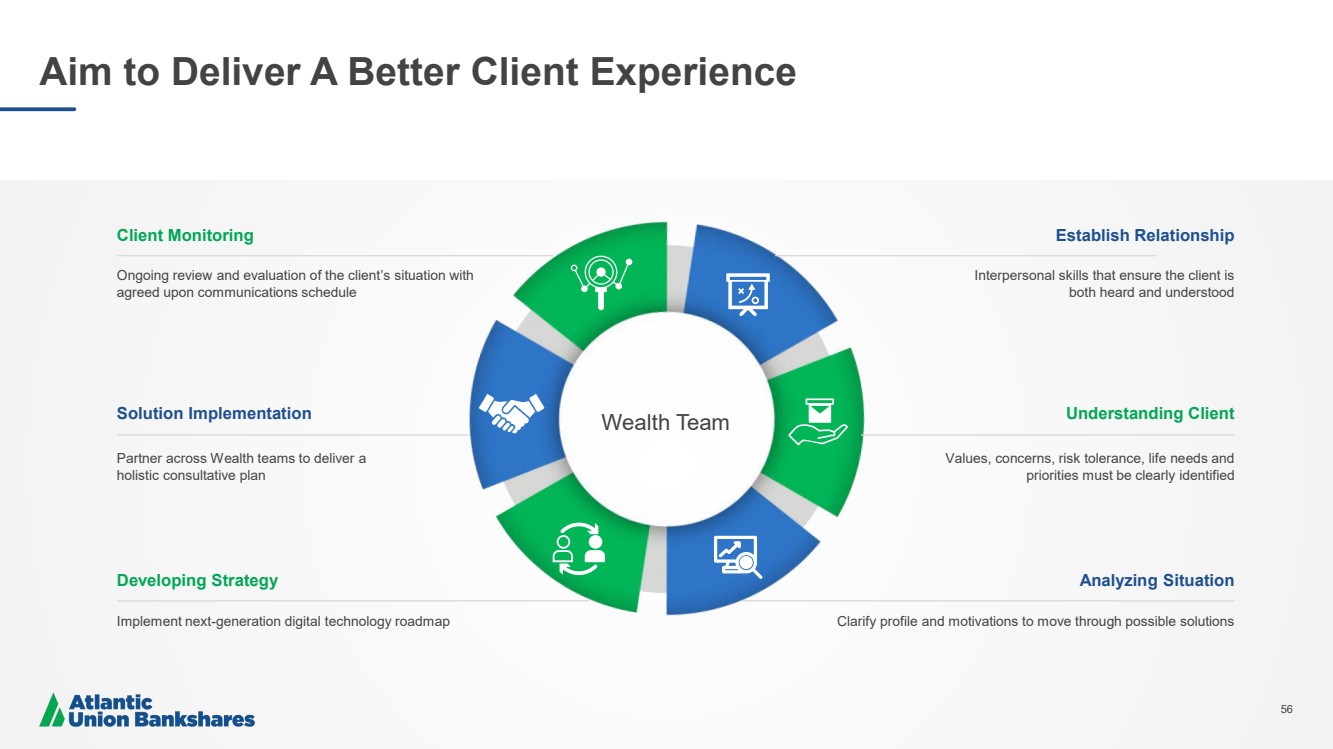
| 56 Aim to Deliver A Better Client Experience Interpersonal skills that ensure the client is both heard and understood Establish Relationship Values, concerns, risk tolerance, life needs and priorities must be clearly identified Understanding Client Clarify profile and motivations to move through possible solutions Analyzing Situation Ongoing review and evaluation of the client’s situation with agreed upon communications schedule Client Monitoring Partner across Wealth teams to deliver a holistic consultative plan Solution Implementation Implement next - generation digital technology roadmap Developing Strategy 56 Wealth Team |
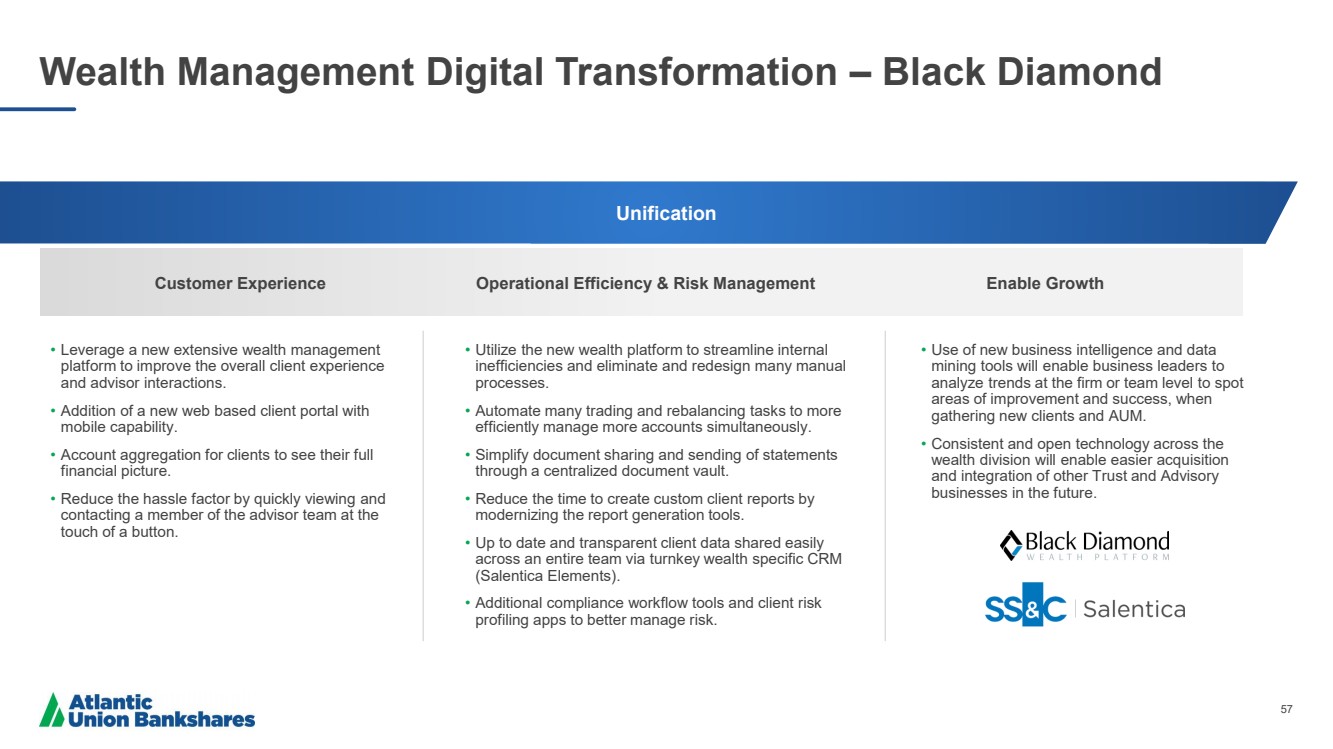
| 57 Wealth Management Digital Transformation – Black Diamond • Leverage a new extensive wealth management platform to improve the overall client experience and advisor interactions. • Addition of a new web based client portal with mobile capability. • Account aggregation for clients to see their full financial picture. • Reduce the hassle factor by quickly viewing and contacting a member of the advisor team at the touch of a button. • Utilize the new wealth platform to streamline internal inefficiencies and eliminate and redesign many manual processes. • Automate many trading and rebalancing tasks to more efficiently manage more accounts simultaneously. • Simplify document sharing and sending of statements through a centralized document vault. • Reduce the time to create custom client reports by modernizing the report generation tools. • Up to date and transparent client data shared easily across an entire team via turnkey wealth specific CRM ( Salentica Elements). • Additional compliance workflow tools and client risk profiling apps to better manage risk. • Use of new business intelligence and data mining tools will enable business leaders to analyze trends at the firm or team level to spot areas of improvement and success, when gathering new clients and AUM. • Consistent and open technology across the wealth division will enable easier acquisition and integration of other Trust and Advisory businesses in the future. Unification Customer Experience Operational Efficiency & Risk Management Enable Growth |
| 58 Shawn O’Brien Consumer & Business Banking Group Executive |
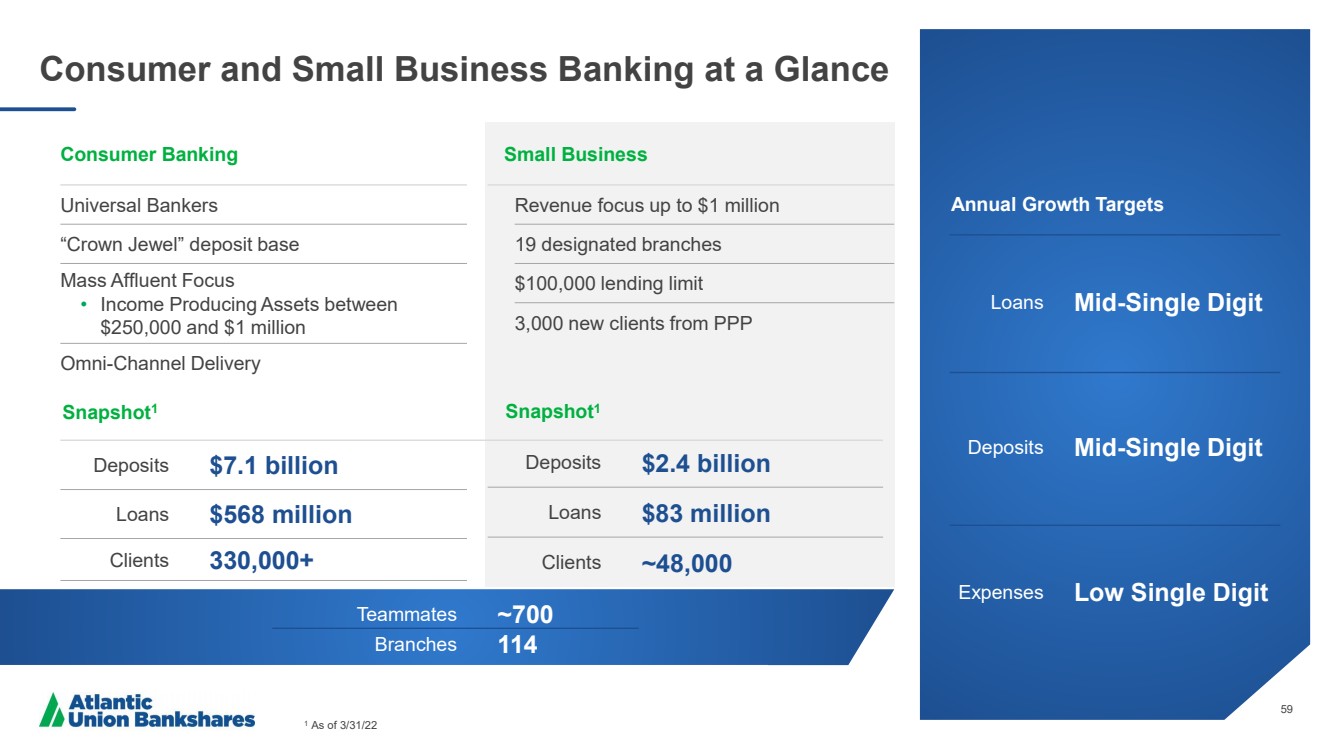
| 59 Consumer and Small Business Banking at a Glance 1 As of 3/31/22 Consumer Banking Small Business Revenue focus up to $1 million 19 designated branches $100,000 lending limit 3,000 new clients from PPP Universal Bankers “Crown Jewel” deposit base Mass Affluent Focus • Income Producing Assets between $250,000 and $1 million Omni - Channel Delivery Snapshot 1 Deposits $2.4 billion Loans $83 million Clients ~48,000 Deposits $7.1 billion Loans $568 million Clients 330,000+ Annual Growth Targets Loans Mid - Single Digit Deposits Mid - Single Digit Expenses Low Single Digit Snapshot 1 Teammates ~700 Branches 114 |
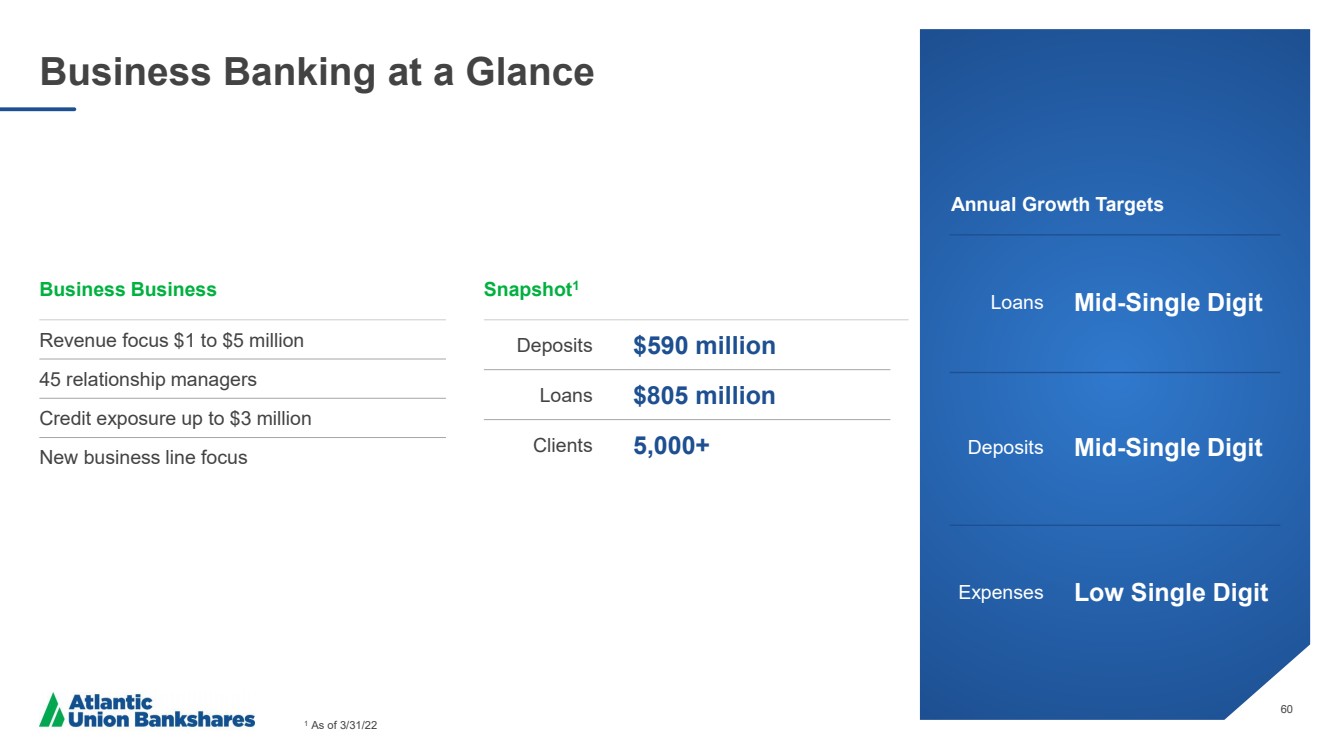
| 60 Business Banking at a Glance 1 As of 3/31/22 Business Business Revenue focus $1 to $5 million 45 relationship managers Credit exposure up to $3 million New business line focus Snapshot 1 Deposits $590 million Loans $805 million Clients 5,000+ Annual Growth Targets Loans Mid - Single Digit Deposits Mid - Single Digit Expenses Low Single Digit |
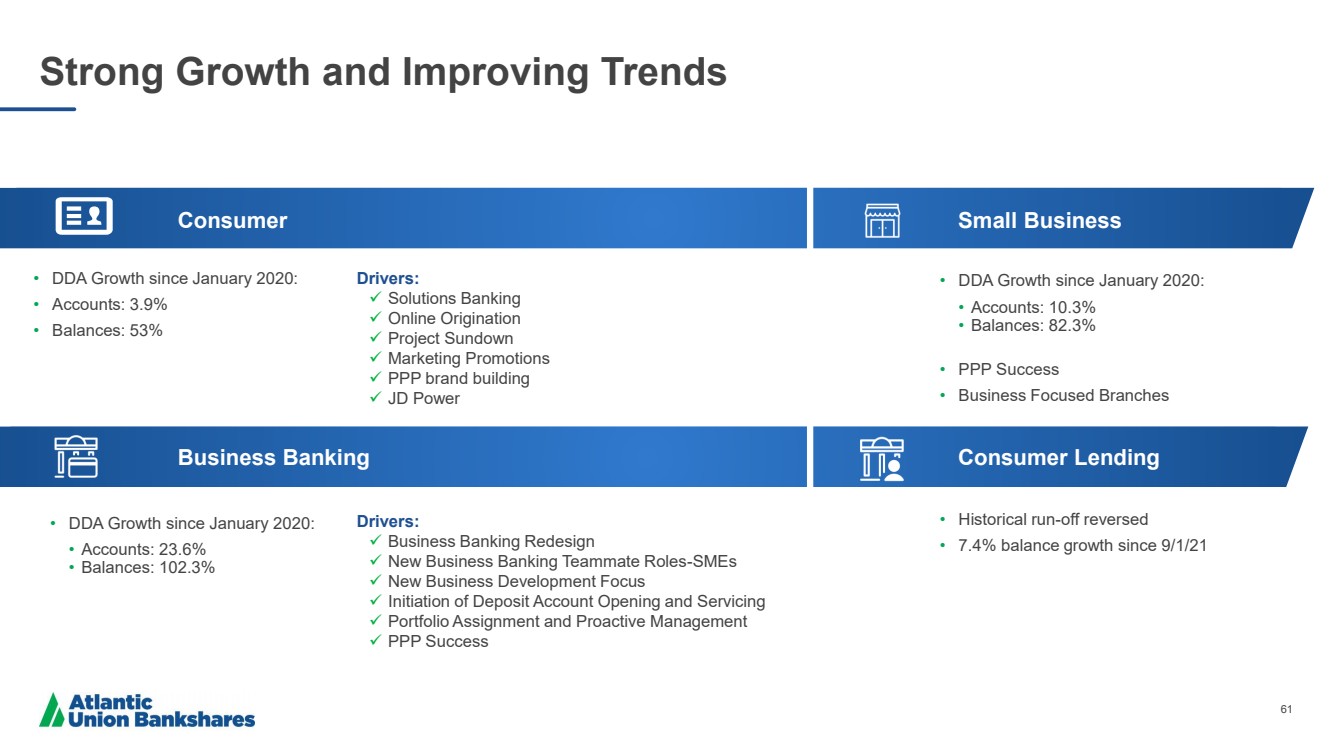
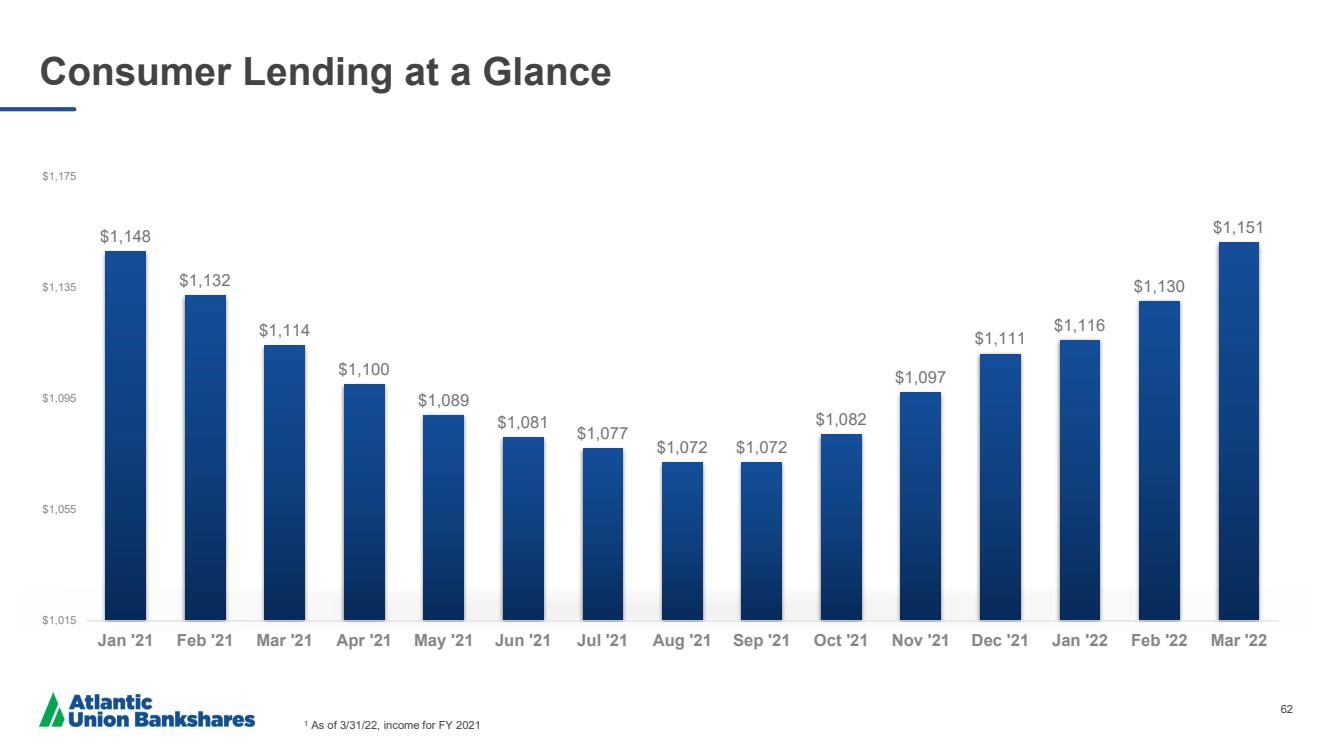
| 61 • DDA Growth since January 2020: • Accounts: 3.9% • Balances: 53% Strong Growth and Improving Trends Consumer Business Banking Consumer Lending Small Business Drivers: Solutions Banking Online Origination Project Sundown Marketing Promotions PPP brand building JD Power • DDA Growth since January 2020: • Accounts: 10.3% • Balances: 82.3% • PPP Success • Business Focused Branches • DDA Growth since January 2020: • Accounts: 23.6% • Balances: 102.3% Drivers: Business Banking Redesign New Business Banking Teammate Roles - SMEs New Business Development Focus Initiation of Deposit Account Opening and Servicing Portfolio Assignment and Proactive Management PPP Success • Historical run - off reversed • 7.4% balance growth since 9/1/21 |
| 62 Consumer Lending at a Glance 1 As of 3/31/22, income for FY 2021 $1,148 $1,132 $1,114 $1,100 $1,089 $1,081 $1,077 $1,072 $1,072 $1,082 $1,097 $1,111 $1,116 $1,130 $1,151 $1,015 $1,055 $1,095 $1,135 $1,175 Jan '21 Feb '21 Mar '21 Apr '21 May '21 Jun '21 Jul '21 Aug '21 Sep '21 Oct '21 Nov '21 Dec '21 Jan '22 Feb '22 Mar '22 |
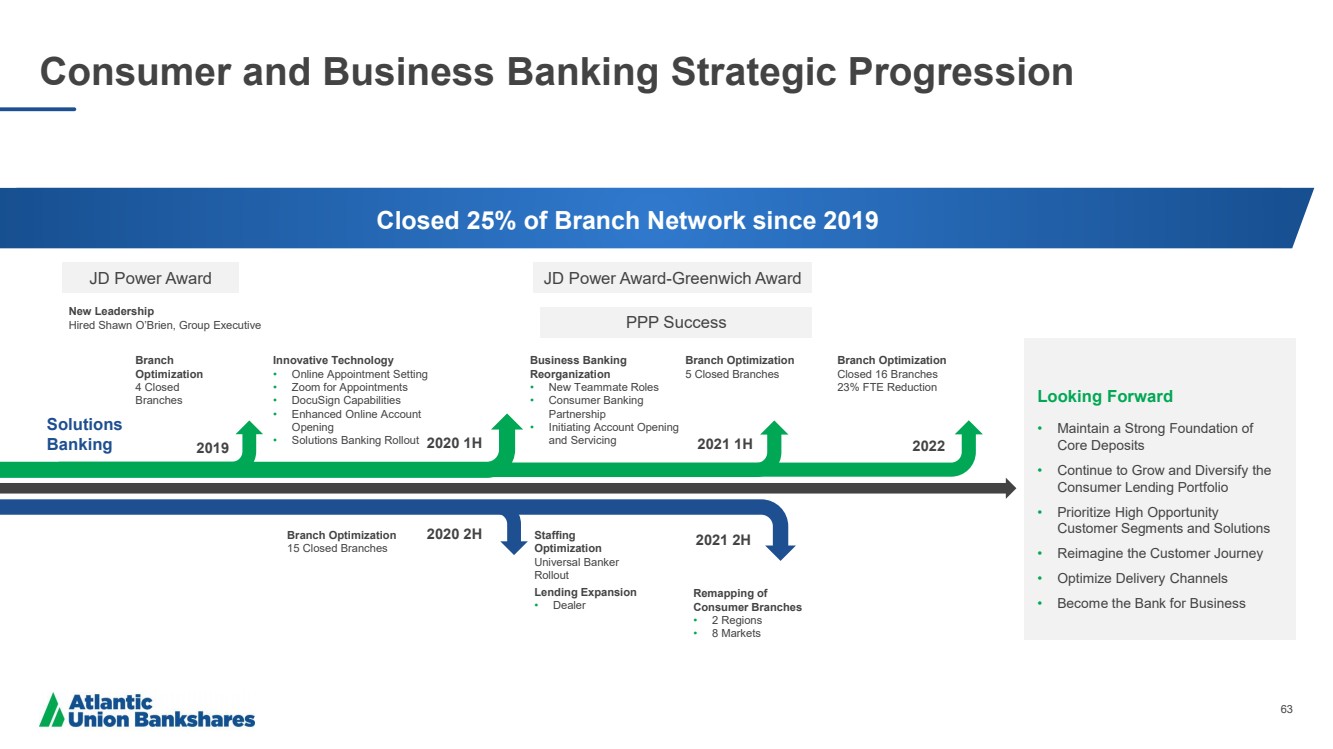
| 63 Consumer and Business Banking Strategic Progression Looking Forward • Maintain a Strong Foundation of Core Deposits • Continue to Grow and Diversify the Consumer Lending Portfolio • Prioritize High Opportunity Customer Segments and Solutions • Reimagine the Customer Journey • Optimize Delivery Channels • Become the Bank for Business 2021 1H 2022 Remapping of Consumer Branches • 2 Regions • 8 Markets Branch Optimization Closed 16 Branches 23% FTE Reduction Innovative Technology • Online Appointment Setting • Zoom for Appointments • DocuSign Capabilities • Enhanced Online Account Opening • Solutions Banking Rollout Staffing Optimization Universal Banker Rollout Business Banking Reorganization • New Teammate Roles • Consumer Banking Partnership • Initiating Account Opening and Servicing Lending Expansion • Dealer JD Power Award - Greenwich Award Solutions Banking 2019 2020 2H 2021 2H 2020 1H JD Power Award Branch Optimization 15 Closed Branches Branch Optimization 4 Closed Branches Branch Optimization 5 Closed Branches New Leadership Hired Shawn O’Brien, Group Executive Closed 25% of Branch Network since 2019 PPP Success |
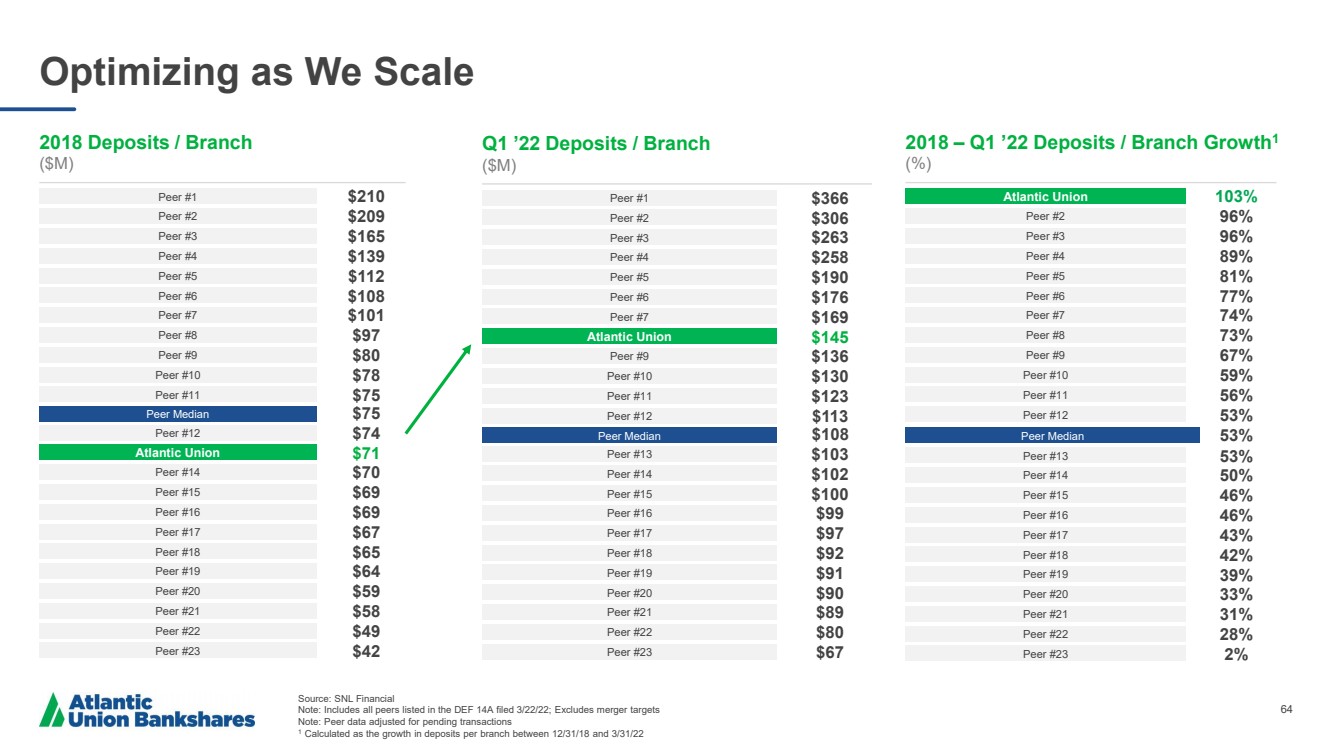
| 64 Optimizing as We Scale Source: SNL Financial Note: Includes all peers listed in the DEF 14A filed 3/22/22; Excludes merger targets Note: Peer data adjusted for pending transactions 1 Calculated as the growth in deposits per branch between 12/31/18 and 3/31/22 2018 Deposits / Branch ($M) Q1 ’22 Deposits / Branch ($M) 2018 – Q1 ’22 Deposits / Branch Growth 1 (%) Peer #1 $210 Peer #2 Peer #3 Peer #4 Peer #5 Peer #6 Peer #7 Peer #8 Peer #9 Peer #10 Peer #11 $209 $165 $139 $112 $108 $101 $97 $80 $78 $75 Peer #12 Atlantic Union Peer #14 Peer #15 Peer #16 Peer #17 Peer #18 Peer #19 Peer #20 Peer #21 Peer #22 $74 $71 $70 $69 $69 $67 $65 $64 $59 $58 $42 Peer #23 $49 Peer #1 $366 Peer #2 Peer #3 Peer #4 Peer #5 Peer #6 Peer #7 Atlantic Union Peer #9 Peer #10 Peer #11 Peer #12 $306 $263 $258 $190 $176 $169 $145 $136 $130 $123 $113 Peer #13 Peer #14 Peer #15 Peer #16 Peer #17 Peer #18 Peer #19 Peer #20 Peer #21 Peer #22 $103 $102 $100 $99 $97 $92 $91 $90 $89 $67 Peer #23 $80 Atlantic Union 103% Peer #2 Peer #3 Peer #4 Peer #5 Peer #6 Peer #7 Peer #8 Peer #9 Peer #10 Peer #11 Peer #12 Peer #13 Peer #14 Peer #15 Peer #16 Peer #17 Peer #18 Peer #19 Peer #20 Peer #21 Peer #22 96% 96% 89% 81% 77% 74% 73% 67% 59% 56% 53% 53% 50% 46% 46% 43% 42% 39% 33% 31% 2% Peer #23 28% Peer Median Peer Median $75 $108 Peer Median 53% |
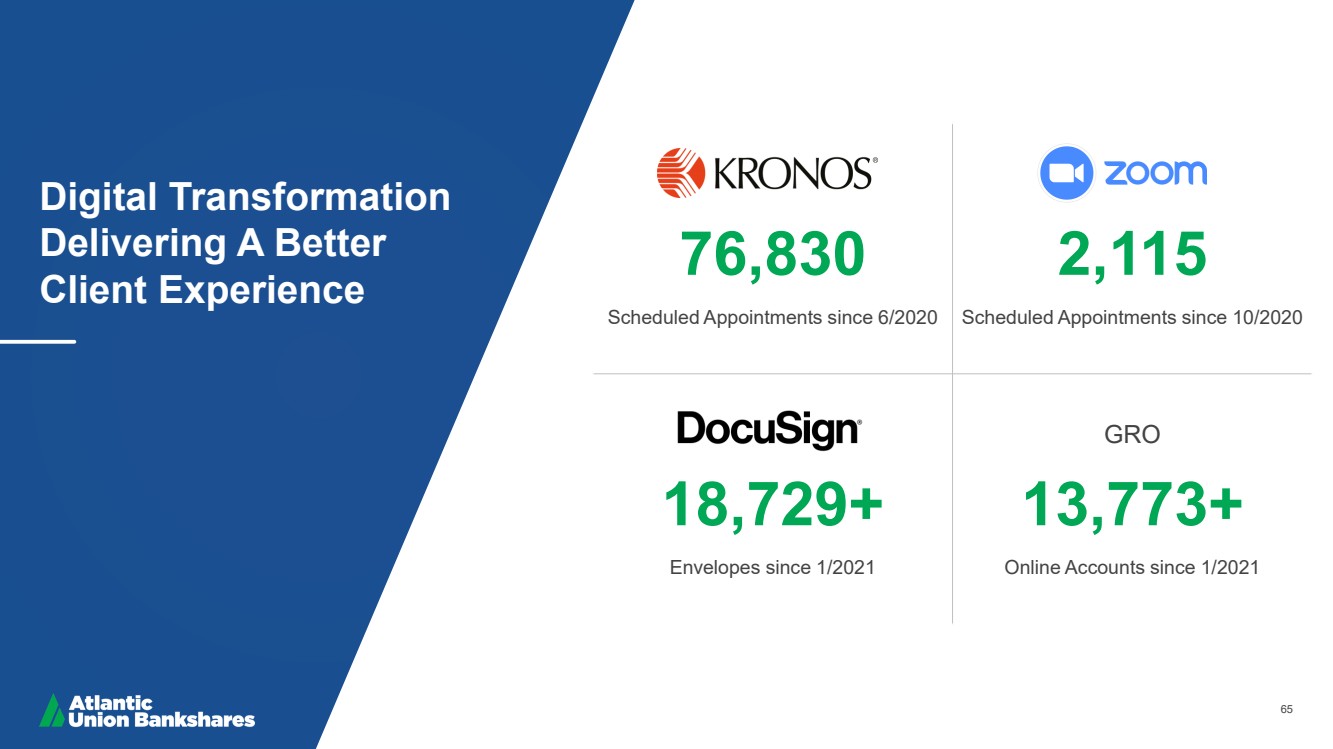
| 65 Digital Transformation Delivering A Better Client Experience 76,830 Scheduled Appointments since 6/2020 2,115 Scheduled Appointments since 10/2020 18,729+ Envelopes since 1/2021 GRO 13,773+ Online Accounts since 1/2021 |
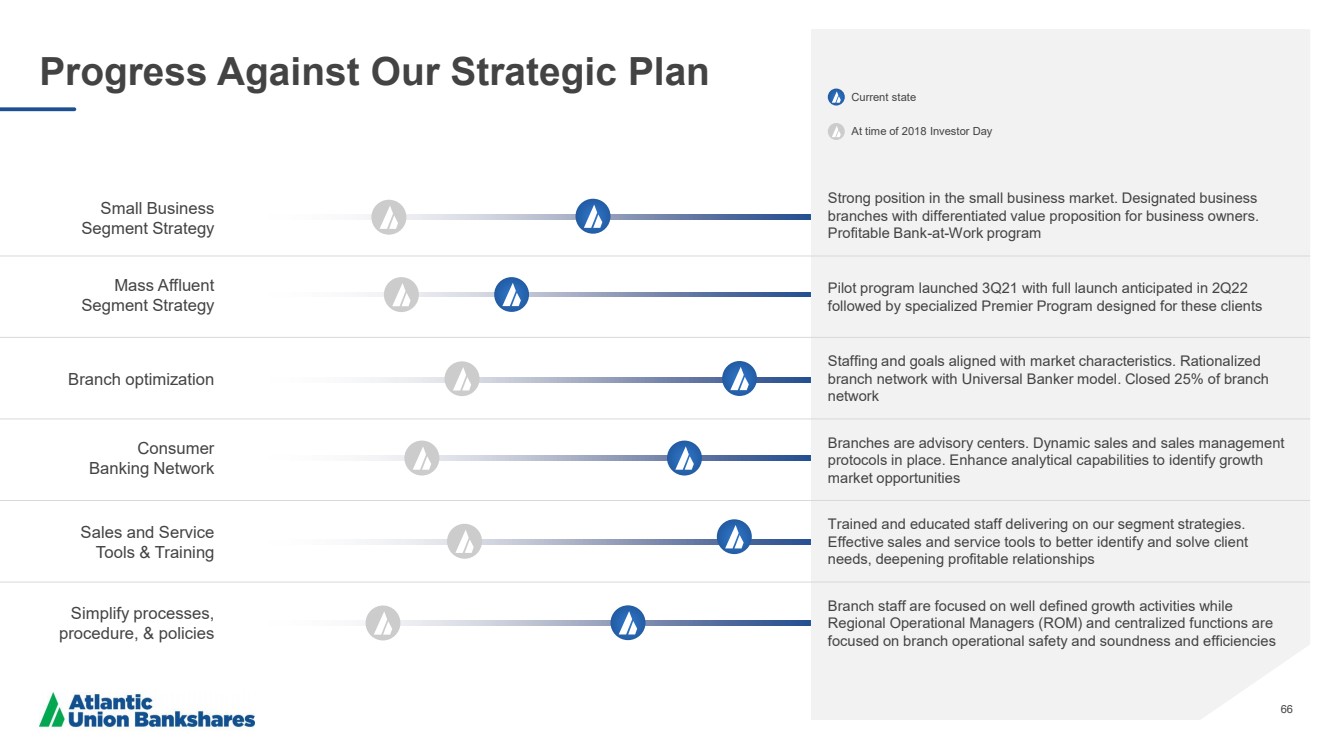
| 66 Progress Against Our Strategic Plan Branch staff are focused on well defined growth activities while Regional Operational Managers (ROM) and centralized functions are focused on branch operational safety and soundness and efficiencies Trained and educated staff delivering on our segment strategies. Effective sales and service tools to better identify and solve client needs, deepening profitable relationships Branches are advisory centers. Dynamic sales and sales management protocols in place. Enhance analytical capabilities to identify growth market opportunities Staffing and goals aligned with market characteristics. Rationalized branch network with Universal Banker model. Closed 25% of branch network Pilot program launched 3Q21 with full launch anticipated in 2Q22 followed by specialized Premier Program designed for these clients Strong position in the small business market. Designated business branches with differentiated value proposition for business owners. Profitable Bank - at - Work program Simplify processes, procedure, & policies Sales and Service Tools & Training Consumer Banking Network Branch optimization Mass Affluent Segment Strategy Small Business Segment Strategy Current state At time of 2018 Investor Day |
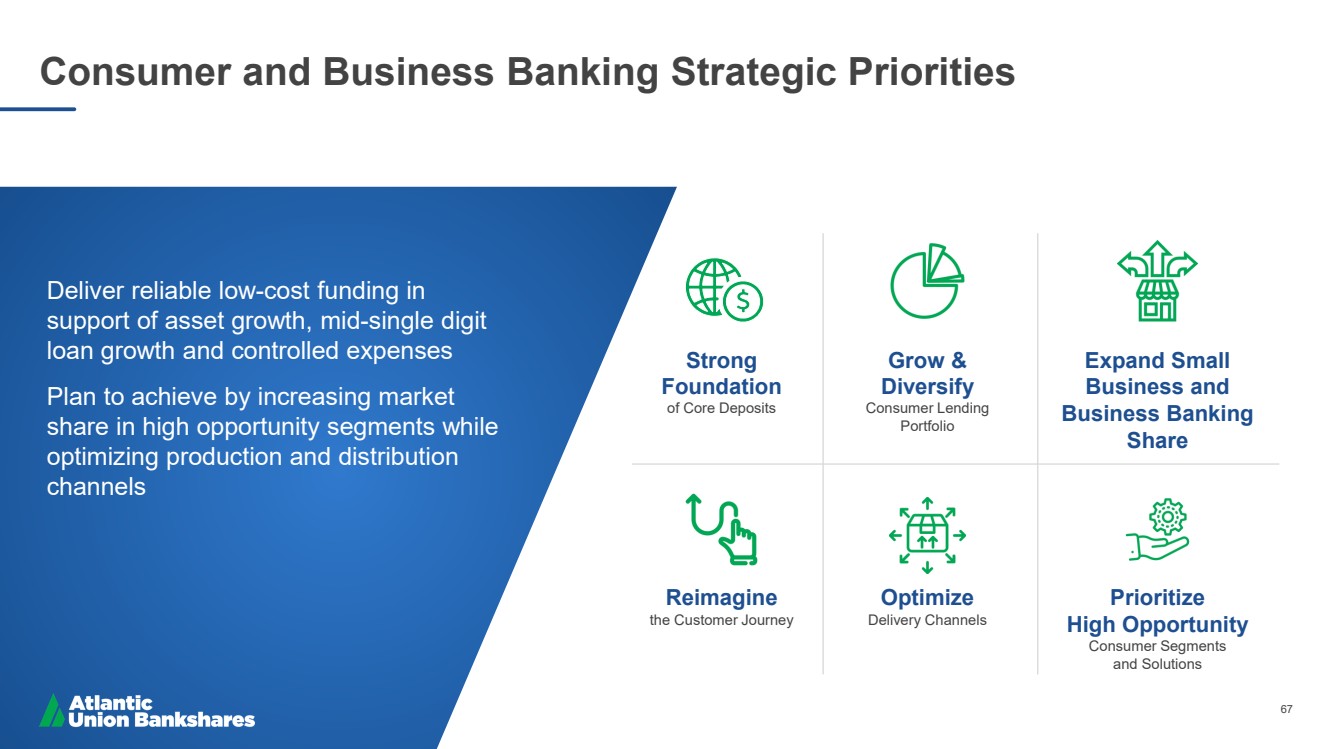
| 67 Consumer and Business Banking Strategic Priorities Deliver reliable low - cost funding in support of asset growth, mid - single digit loan growth and controlled expenses Plan to achieve by increasing market share in high opportunity segments while optimizing production and distribution channels Strong Foundation of Core Deposits Grow & Diversify Consumer Lending Portfolio Expand Small Business and Business Banking Share Reimagine the Customer Journey Optimize Delivery Channels Prioritize High Opportunity Consumer Segments and Solutions |
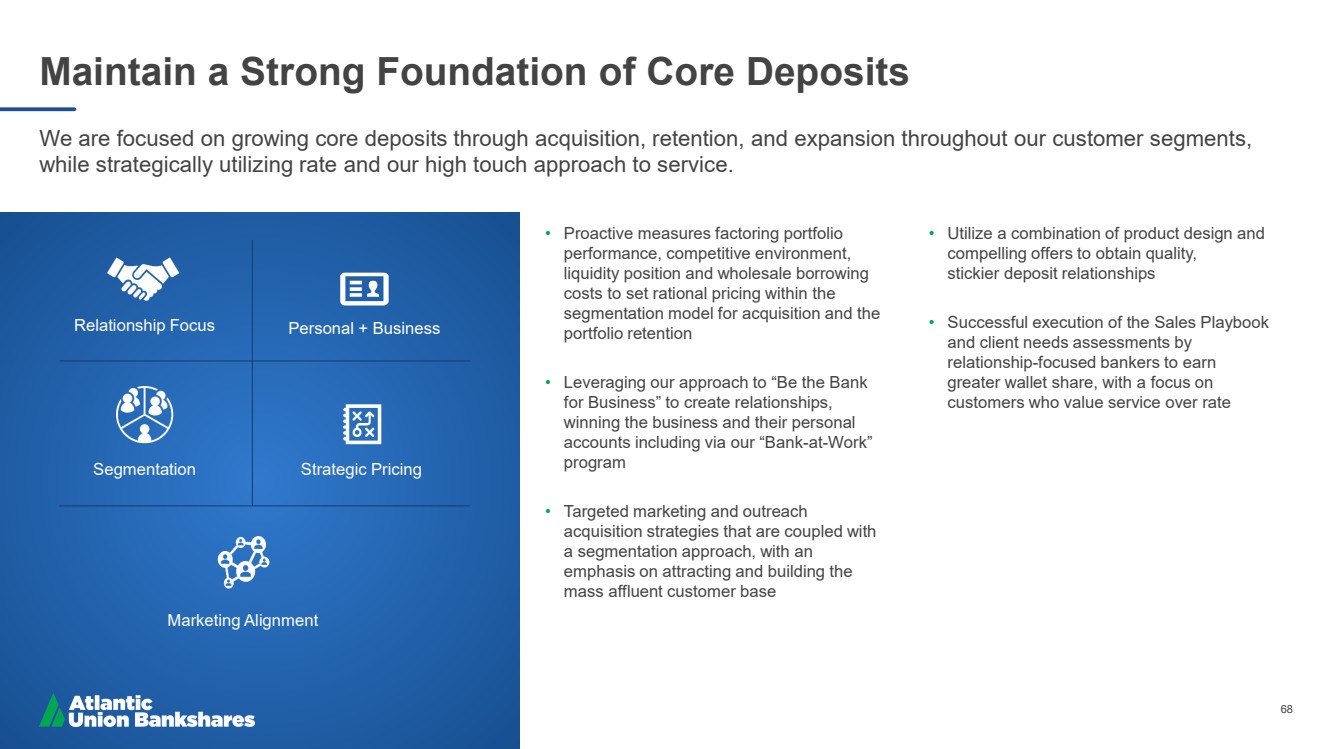
| 68 Maintain a Strong Foundation of Core Deposits • Proactive measures factoring portfolio performance, competitive environment, liquidity position and wholesale borrowing costs to set rational pricing within the segmentation model for acquisition and the portfolio retention • Leveraging our approach to “Be the Bank for Business” to create relationships, winning the business and their personal accounts including via our “Bank - at - Work” program • Targeted marketing and outreach acquisition strategies that are coupled with a segmentation approach, with an emphasis on attracting and building the mass affluent customer base • Utilize a combination of product design and compelling offers to obtain quality, stickier deposit relationships • Successful execution of the Sales Playbook and client needs assessments by relationship - focused bankers to earn greater wallet share, with a focus on customers who value service over rate We are focused on growing core deposits through acquisition, retention, and expansion throughout our customer segments, while strategically utilizing rate and our high touch approach to service. Marketing Alignment Strategic Pricing Segmentation Personal + Business Relationship Focus |
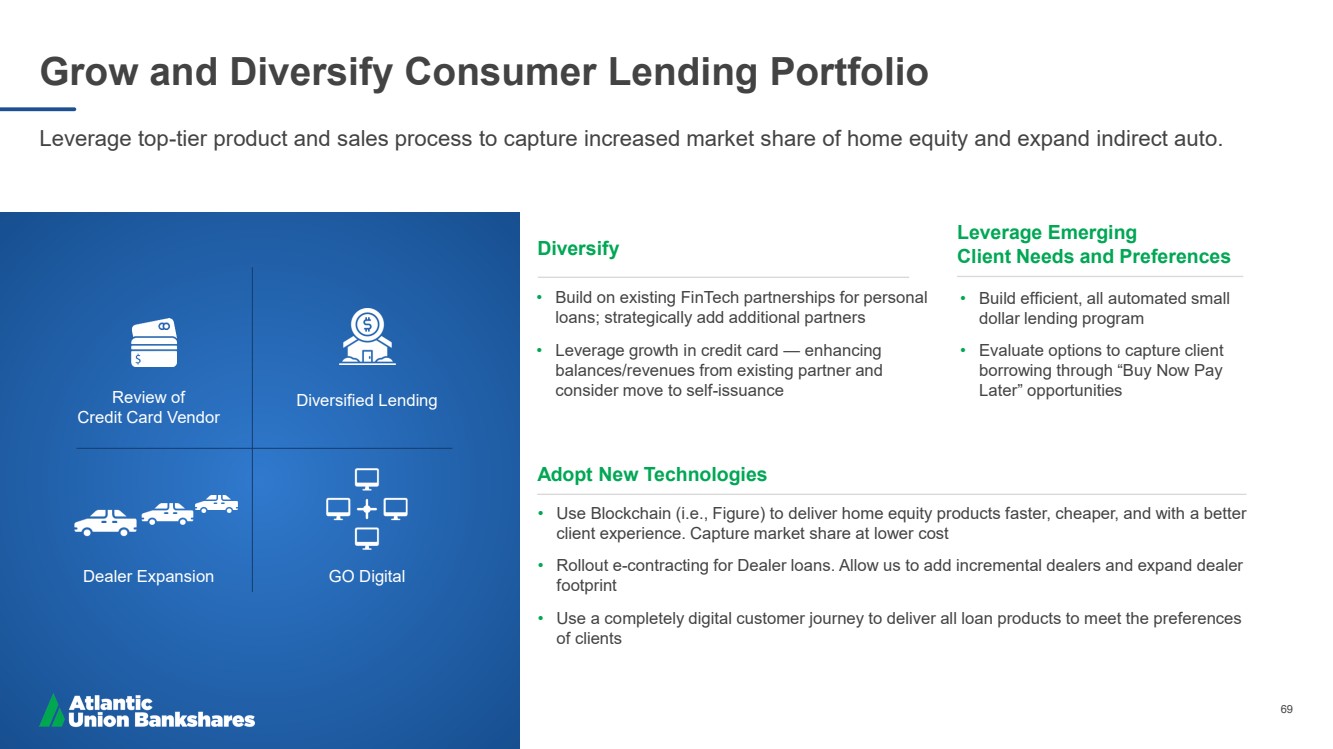
| 69 Grow and Diversify Consumer Lending Portfolio Leverage top - tier product and sales process to capture increased market share of home equity and expand indirect auto. GO Digital Dealer Expansion Diversified Lending Review of Credit Card Vendor • Build on existing FinTech partnerships for personal loans; strategically add additional partners • Leverage growth in credit card — enhancing balances/revenues from existing partner and consider move to self - issuance Diversify • Build efficient, all automated small dollar lending program • Evaluate options to capture client borrowing through “Buy Now Pay Later” opportunities Leverage Emerging Client Needs and Preferences • Use Blockchain (i.e., Figure) to deliver home equity products faster, cheaper, and with a better client experience. Capture market share at lower cost • Rollout e - contracting for Dealer loans. Allow us to add incremental dealers and expand dealer footprint • Use a completely digital customer journey to deliver all loan products to meet the preferences of clients Adopt New Technologies |
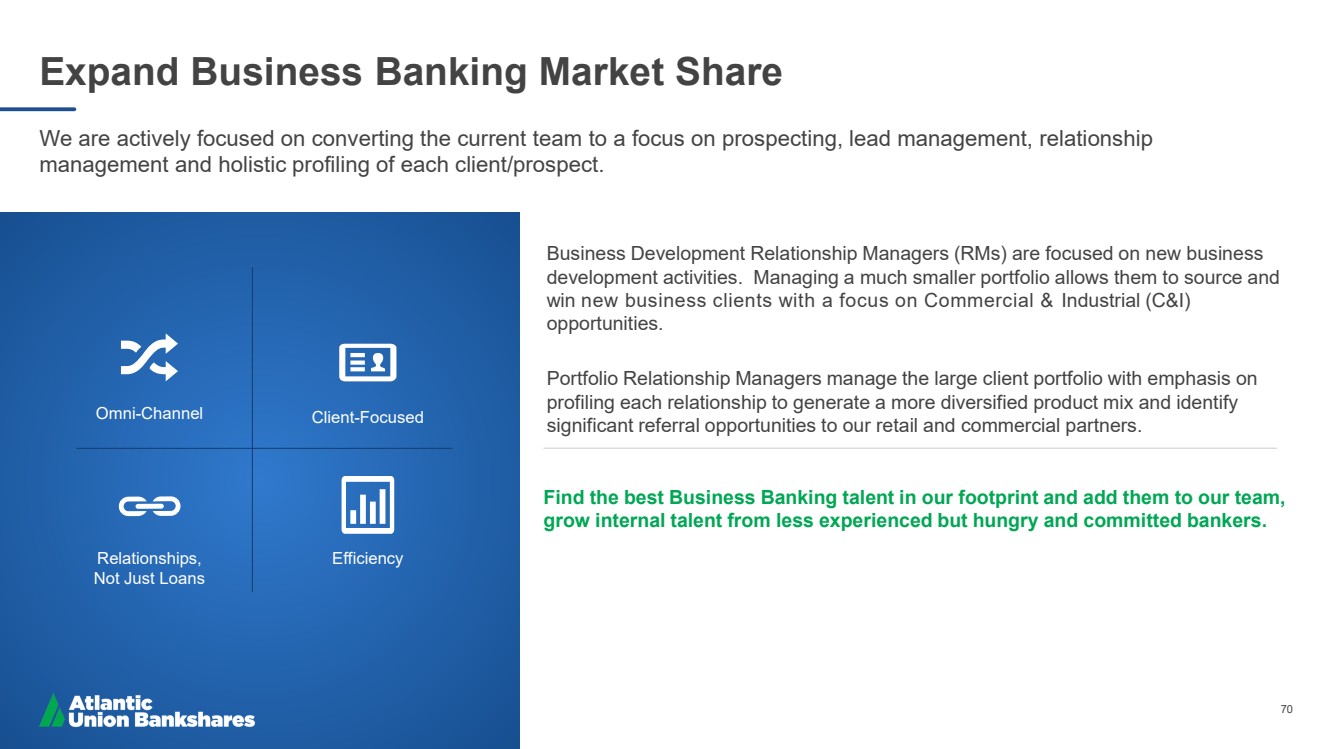
| 70 Business Development Relationship Managers (RMs) are focused on new business development activities. Managing a much smaller portfolio allows them to source and win new business clients with a focus on Commercial & Industrial (C&I) opportunities. Portfolio Relationship Managers manage the large client portfolio with emphasis on profiling each relationship to generate a more diversified product mix and identify significant referral opportunities to our retail and commercial partners. Find the best Business Banking talent in our footprint and add them to our team, grow internal talent from less experienced but hungry and committed bankers. Expand Business Banking Market Share We are actively focused on converting the current team to a focus on prospecting, lead management, relationship management and holistic profiling of each client/prospect. Efficiency Relationships, Not Just Loans Client - Focused Omni - Channel |
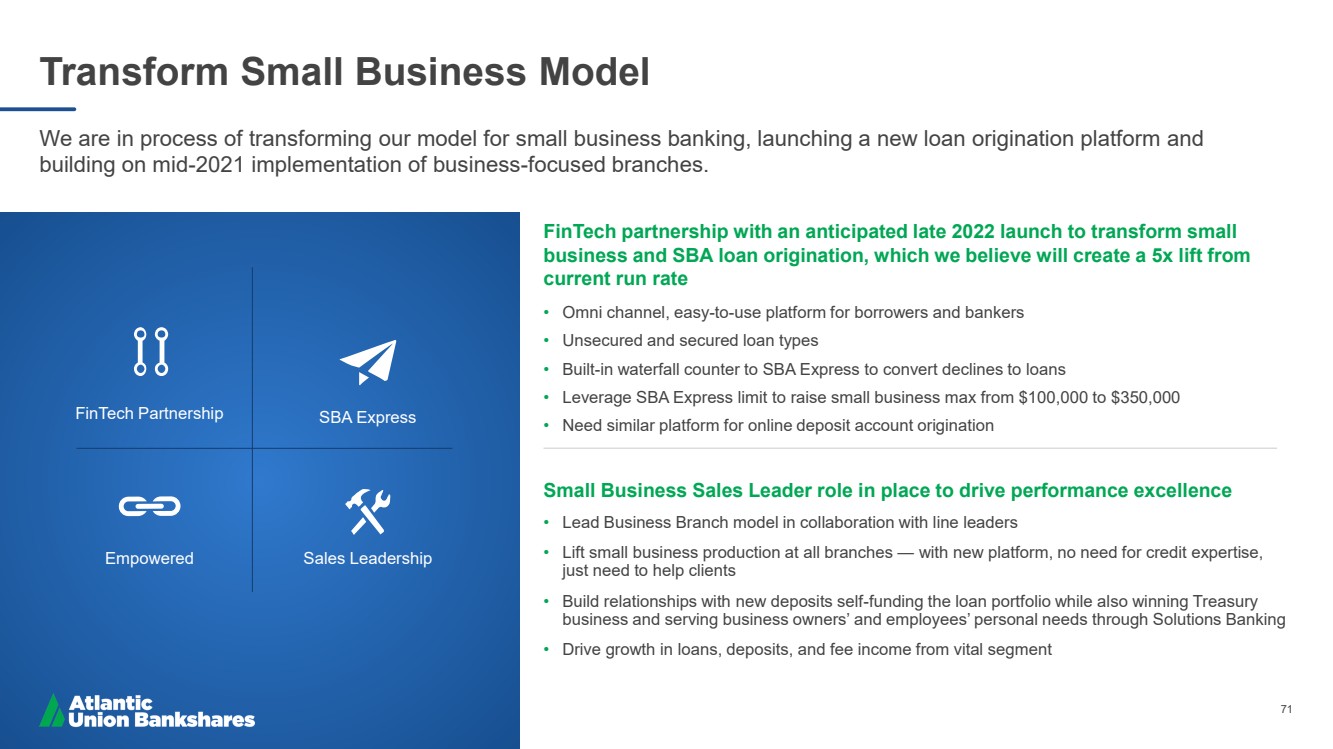
| 71 FinTech partnership with an anticipated late 2022 launch to transform small business and SBA loan origination, which we believe will create a 5x lift from current run rate • Omni channel, easy - to - use platform for borrowers and bankers • Unsecured and secured loan types • Built - in waterfall counter to SBA Express to convert declines to loans • Leverage SBA Express limit to raise small business max from $100,000 to $350,000 • Need similar platform for online deposit account origination Small Business Sales Leader role in place to drive performance excellence • Lead Business Branch model in collaboration with line leaders • Lift small business production at all branches — with new platform, no need for credit expertise, just need to help clients • Build relationships with new deposits self - funding the loan portfolio while also winning Treasury business and serving business owners’ and employees’ personal needs through Solutions Banking • Drive growth in loans, deposits, and fee income from vital segment Transform Small Business Model We are in process of transforming our model for small business banking, launching a new loan origination platform and building on mid - 2021 implementation of business - focused branches. Sales Leadership Empowered SBA Express FinTech Partnership |
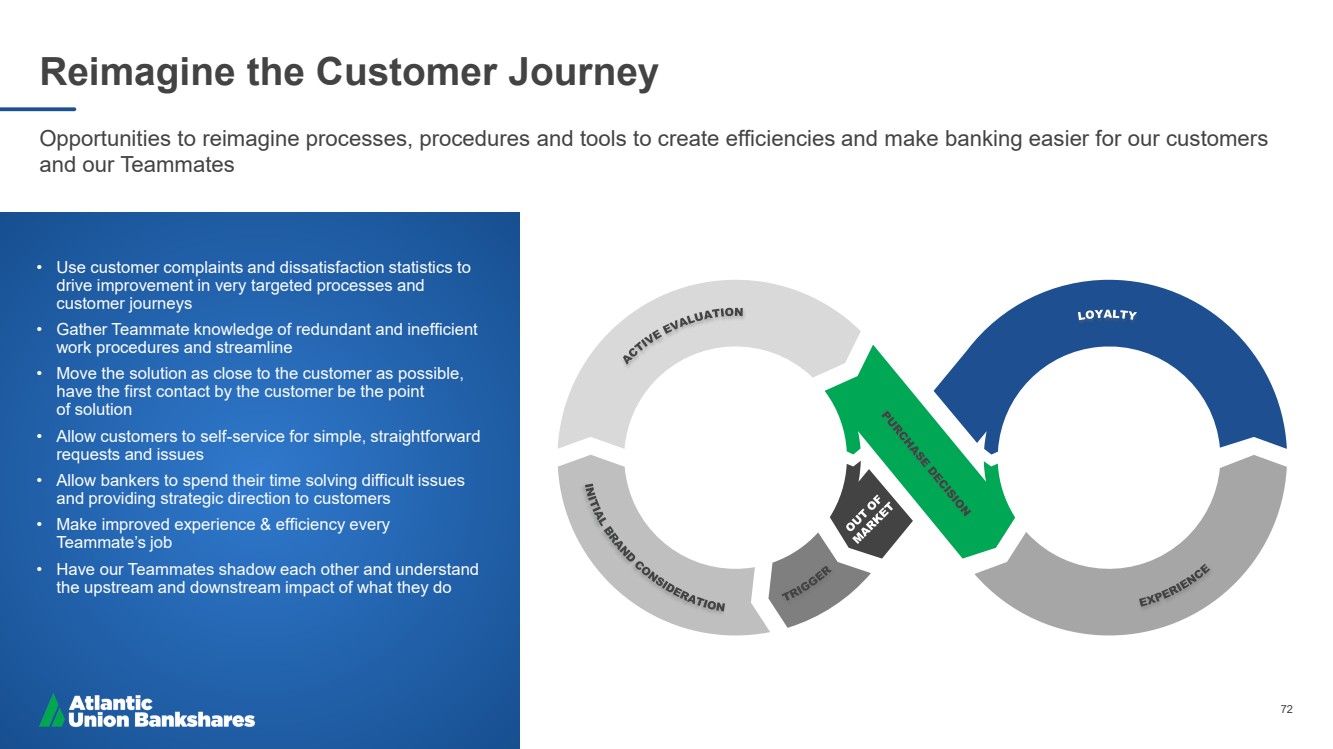
| 72 Reimagine the Customer Journey Opportunities to reimagine processes, procedures and tools to create efficiencies and make banking easier for our customers and our Teammates • Use customer complaints and dissatisfaction statistics to drive improvement in very targeted processes and customer journeys • Gather Teammate knowledge of redundant and inefficient work procedures and streamline • Move the solution as close to the customer as possible, have the first contact by the customer be the point of solution • Allow customers to self - service for simple, straightforward requests and issues • Allow bankers to spend their time solving difficult issues and providing strategic direction to customers • Make improved experience & efficiency every Teammate’s job • Have our Teammates shadow each other and understand the upstream and downstream impact of what they do |
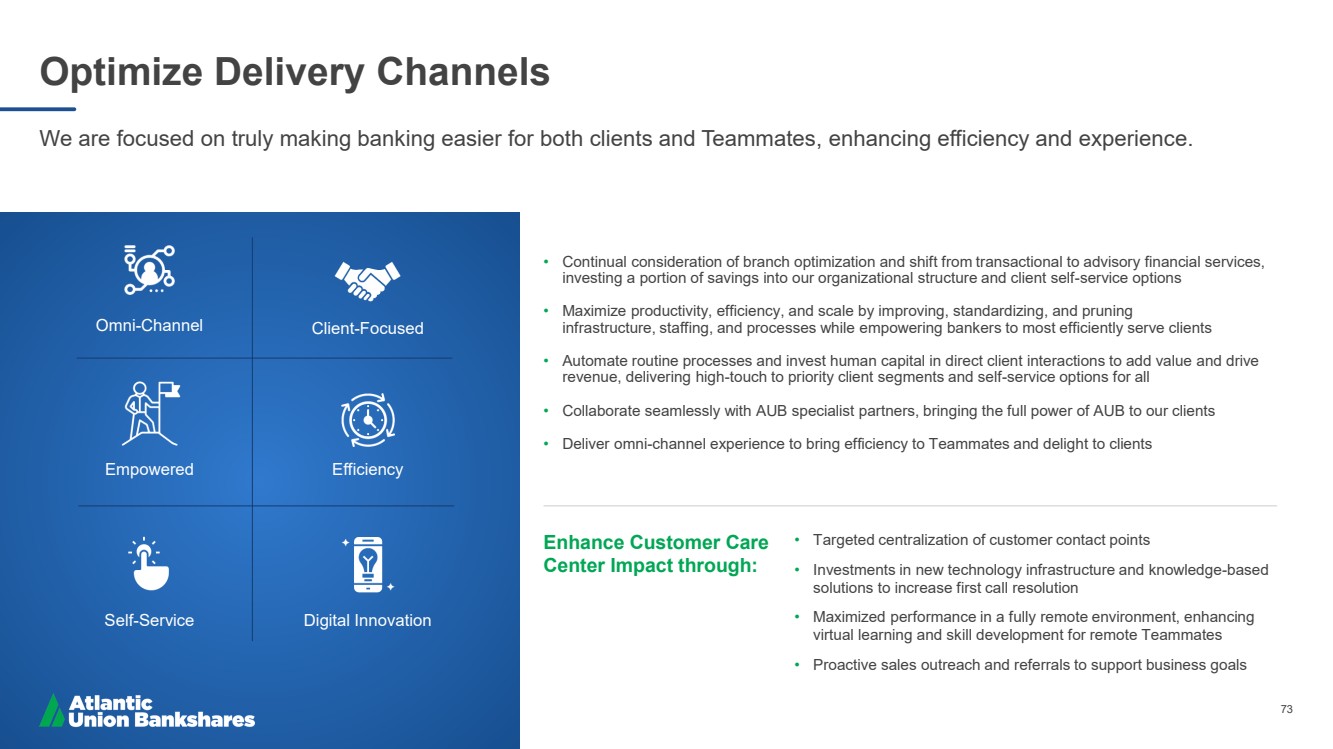
| 73 • Continual consideration of branch optimization and shift from transactional to advisory financial services, investing a portion of savings into our organizational structure and client self - service options • Maximize productivity, efficiency, and scale by improving, standardizing, and pruning infrastructure, staffing, and processes while empowering bankers to most efficiently serve clients • Automate routine processes and invest human capital in direct client interactions to add value and drive revenue, delivering high - touch to priority client segments and self - service options for all • Collaborate seamlessly with AUB specialist partners, bringing the full power of AUB to our clients • Deliver omni - channel experience to bring efficiency to Teammates and delight to clients • Targeted centralization of customer contact points • Investments in new technology infrastructure and knowledge - based solutions to increase first call resolution • Maximized performance in a fully remote environment, enhancing virtual learning and skill development for remote Teammates • Proactive sales outreach and referrals to support business goals Enhance Customer Care Center Impact through: Optimize Delivery Channels We are focused on truly making banking easier for both clients and Teammates, enhancing efficiency and experience. Omni - Channel Self - Service Efficiency Empowered Client - Focused Digital Innovation |
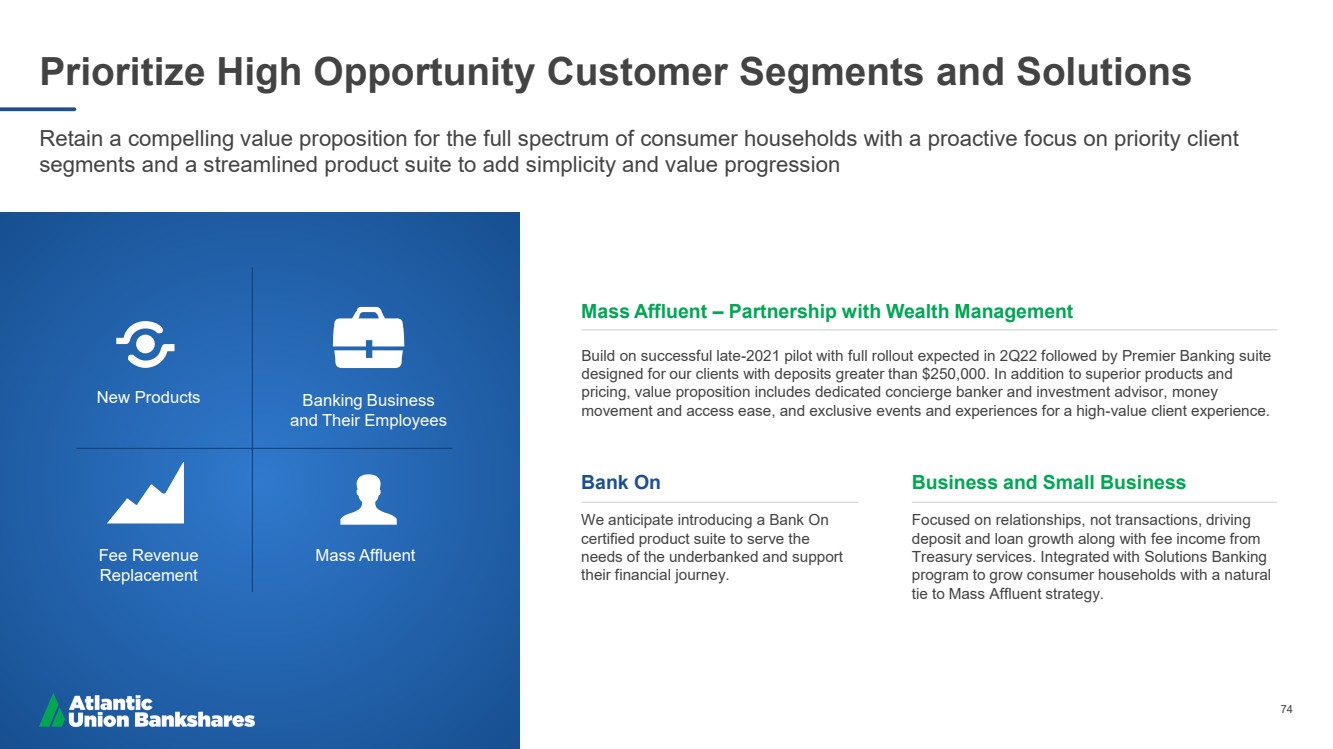
| 74 Prioritize High Opportunity Customer Segments and Solutions Retain a compelling value proposition for the full spectrum of consumer households with a proactive focus on priority client segments and a streamlined product suite to add simplicity and value progression Mass Affluent Fee Revenue Replacement Banking Business and Their Employees New Products Focused on relationships, not transactions, driving deposit and loan growth along with fee income from Treasury services. Integrated with Solutions Banking program to grow consumer households with a natural tie to Mass Affluent strategy. Business and Small Business Build on successful late - 2021 pilot with full rollout expected in 2Q22 followed by Premier Banking suite designed for our clients with deposits greater than $250,000. In addition to superior products and pricing, value proposition includes dedicated concierge banker and investment advisor, money movement and access ease, and exclusive events and experiences for a high - value client experience. Mass Affluent – Partnership with Wealth Management Bank On We anticipate introducing a Bank On certified product suite to serve the needs of the underbanked and support their financial journey. |
| 75 David Ring Wholesale Banking Group Executive |
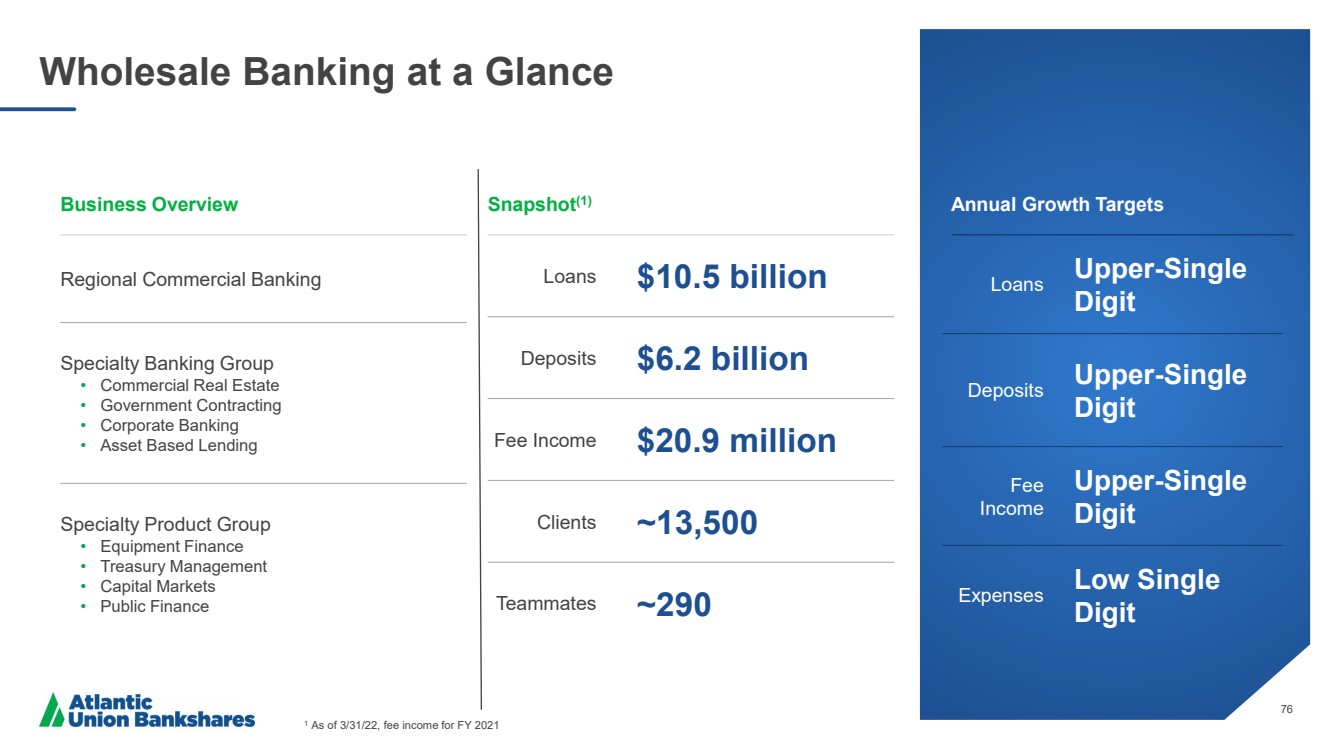
| 76 Wholesale Banking at a Glance 1 As of 3/31/22, fee income for FY 2021 Annual Growth Targets Loans Upper - Single Digit Deposits Upper - Single Digit Fee Income Upper - Single Digit Expenses Low Single Digit Business Overview Snapshot (1) Regional Commercial Banking Specialty Banking Group • Commercial Real Estate • Government Contracting • Corporate Banking • Asset Based Lending Specialty Product Group • Equipment Finance • Treasury Management • Capital Markets • Public Finance Loans $10.5 billion Deposits $6.2 billion Fee Income $20.9 million Clients ~13,500 Teammates ~290 |
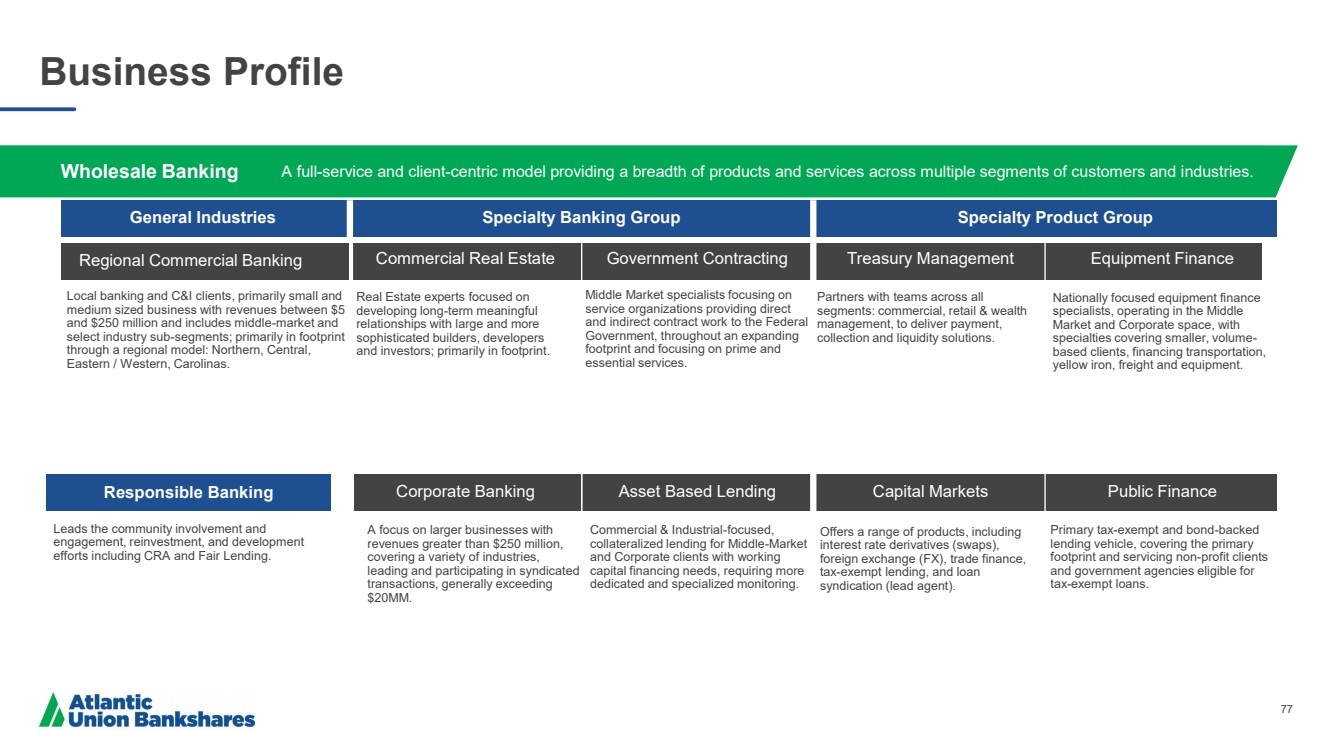
| 77 Business Profile Wholesale Banking A full - service and client - centric model providing a breadth of products and services across multiple segments of customers and i ndustries. Operations and Admin General Industries Operations and Admin Local banking and C&I clients, primarily small and medium sized business with revenues between $5 and $250 million and includes middle - market and select industry sub - segments; primarily in footprint through a regional model: Northern, Central, Eastern / Western, Carolinas. Operations and Admin Leads the community involvement and engagement, reinvestment, and development efforts including CRA and Fair Lending. Responsible Banking Specialty Banking Group Specialty Product Group Commercial Real Estate Government Contracting Real Estate experts focused on developing long - term meaningful relationships with large and more sophisticated builders, developers and investors; primarily in footprint. A focus on larger businesses with revenues greater than $250 million, covering a variety of industries, leading and participating in syndicated transactions, generally exceeding $20MM. Partners with teams across all segments: commercial, retail & wealth management, to deliver payment, collection and liquidity solutions. Offers a range of products, including interest rate derivatives (swaps), foreign exchange (FX), trade finance, tax - exempt lending, and loan syndication (lead agent) .. Treasury Management Equipment Finance Corporate Banking Asset Based Lending Commercial & Industrial - focused, collateralized lending for Middle - Market and Corporate clients with working capital financing needs, requiring more dedicated and specialized monitoring. Nationally focused equipment finance specialists, operating in the Middle Market and Corporate space, with specialties covering smaller, volume - based clients, financing transportation, yellow iron, freight and equipment. Primary tax - exempt and bond - backed lending vehicle, covering the primary footprint and servicing non - profit clients and government agencies eligible for tax - exempt loans. Capital Markets Public Finance Middle Market specialists focusing on service organizations providing direct and indirect contract work to the Federal Government, throughout an expanding footprint and focusing on prime and essential services. Regional Commercial Banking |
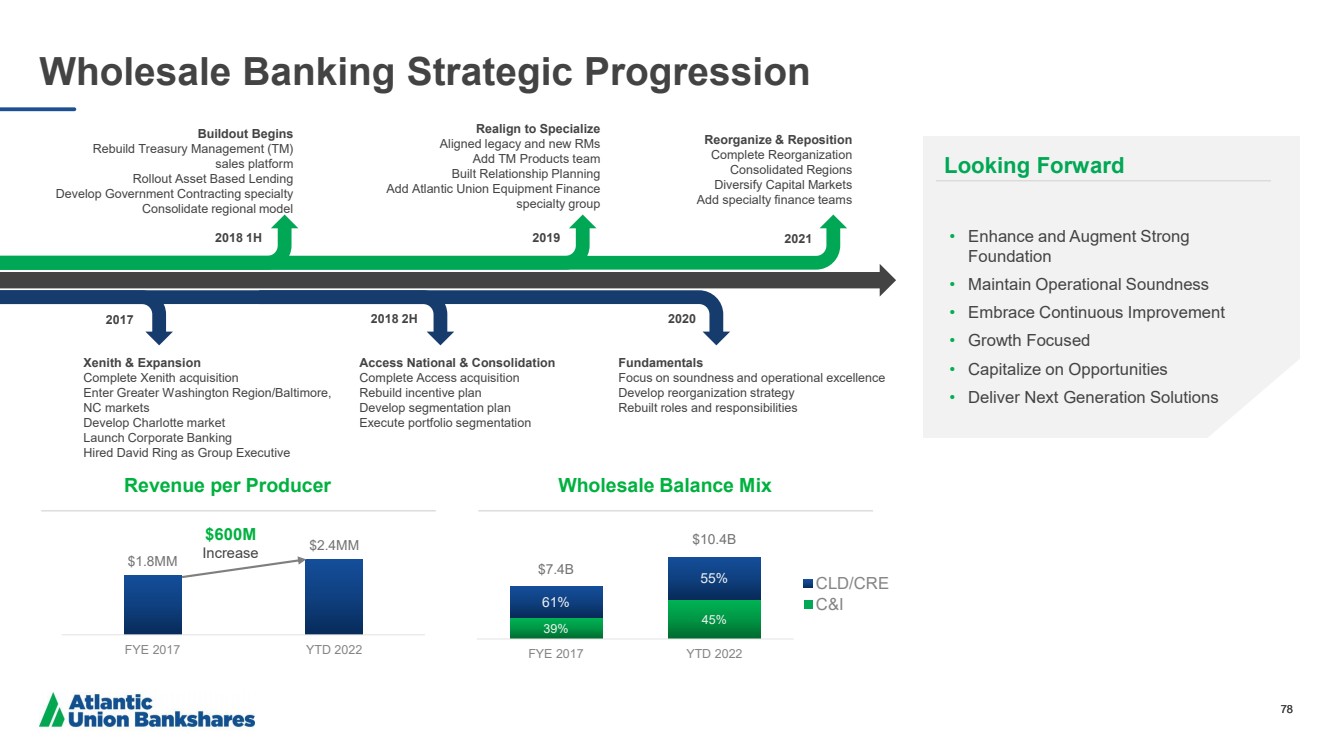
| 78 $1.8MM $2.4MM FYE 2017 YTD 2022 39% 45% 61% 55% $7.4B $10.4B FYE 2017 YTD 2022 CLD/CRE C&I $600M Increase Revenue per Producer Wholesale Banking Strategic Progression Looking Forward • Enhance and Augment Strong Foundation • Maintain Operational Soundness • Embrace Continuous Improvement • Growth Focused • Capitalize on Opportunities • Deliver Next Generation Solutions 78 2018 2H 2017 2018 1H 2021 2019 2020 Xenith & Expansion Complete Xenith acquisition Enter Greater Washington Region/Baltimore, NC markets Develop Charlotte market Launch Corporate Banking Hired David Ring as Group Executive Access National & Consolidation Complete Access acquisition Rebuild incentive plan Develop segmentation plan Execute portfolio segmentation Fundamentals Focus on soundness and operational excellence Develop reorganization strategy Rebuilt roles and responsibilities Buildout Begins Rebuild Treasury Management (TM) sales platform Rollout Asset Based Lending Develop Government Contracting specialty Consolidate regional model Realign to Specialize Aligned legacy and new RMs Add TM Products team Built Relationship Planning Add Atlantic Union Equipment Finance specialty group Reorganize & Reposition Complete Reorganization Consolidated Regions Diversify Capital Markets Add specialty finance teams Wholesale Balance Mix |
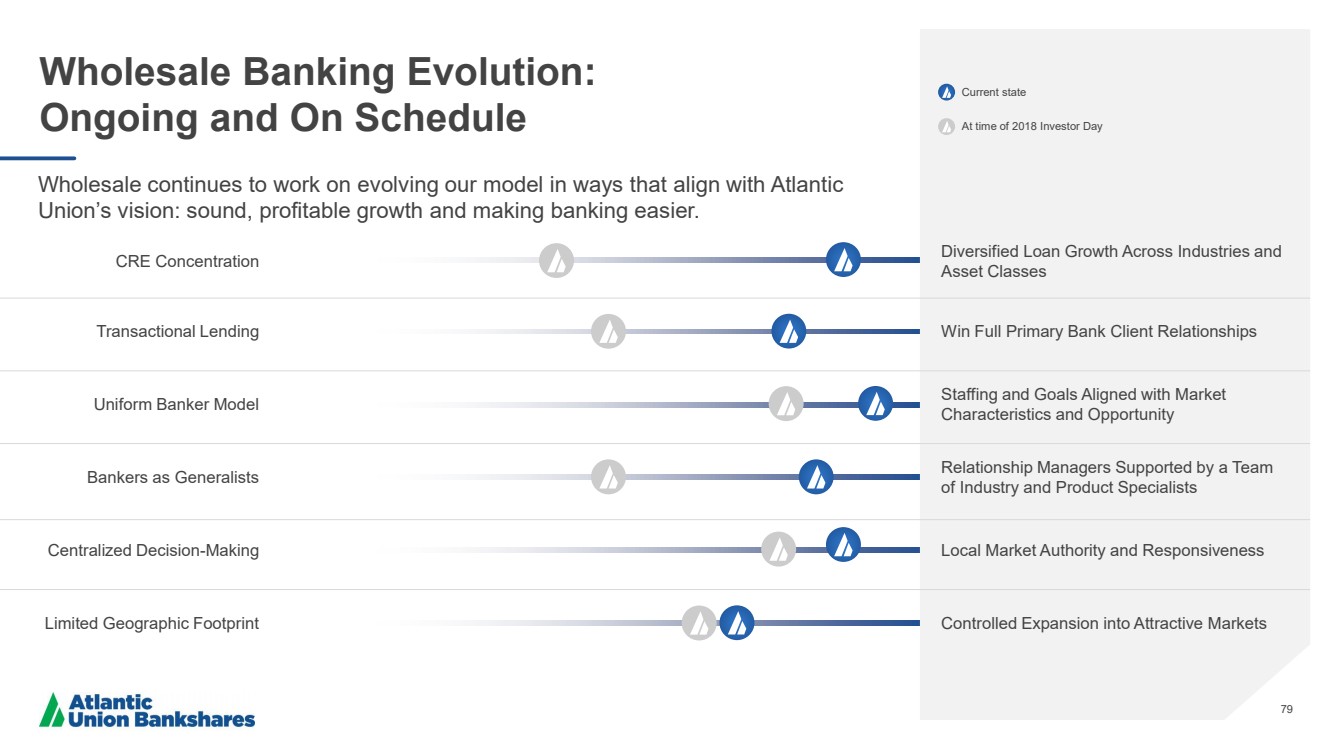
| 79 Wholesale Banking Evolution: Ongoing and On Schedule Controlled Expansion into Attractive Markets Local Market Authority and Responsiveness Relationship Managers Supported by a Team of Industry and Product Specialists Staffing and Goals Aligned with Market Characteristics and Opportunity Win Full Primary Bank Client Relationships Diversified Loan Growth Across Industries and Asset Classes Limited Geographic Footprint Centralized Decision - Making Bankers as Generalists Uniform Banker Model Transactional Lending CRE Concentration Current state At time of 2018 Investor Day Wholesale continues to work on evolving our model in ways that align with Atlantic Union’s vision: sound, profitable growth and making banking easier. |
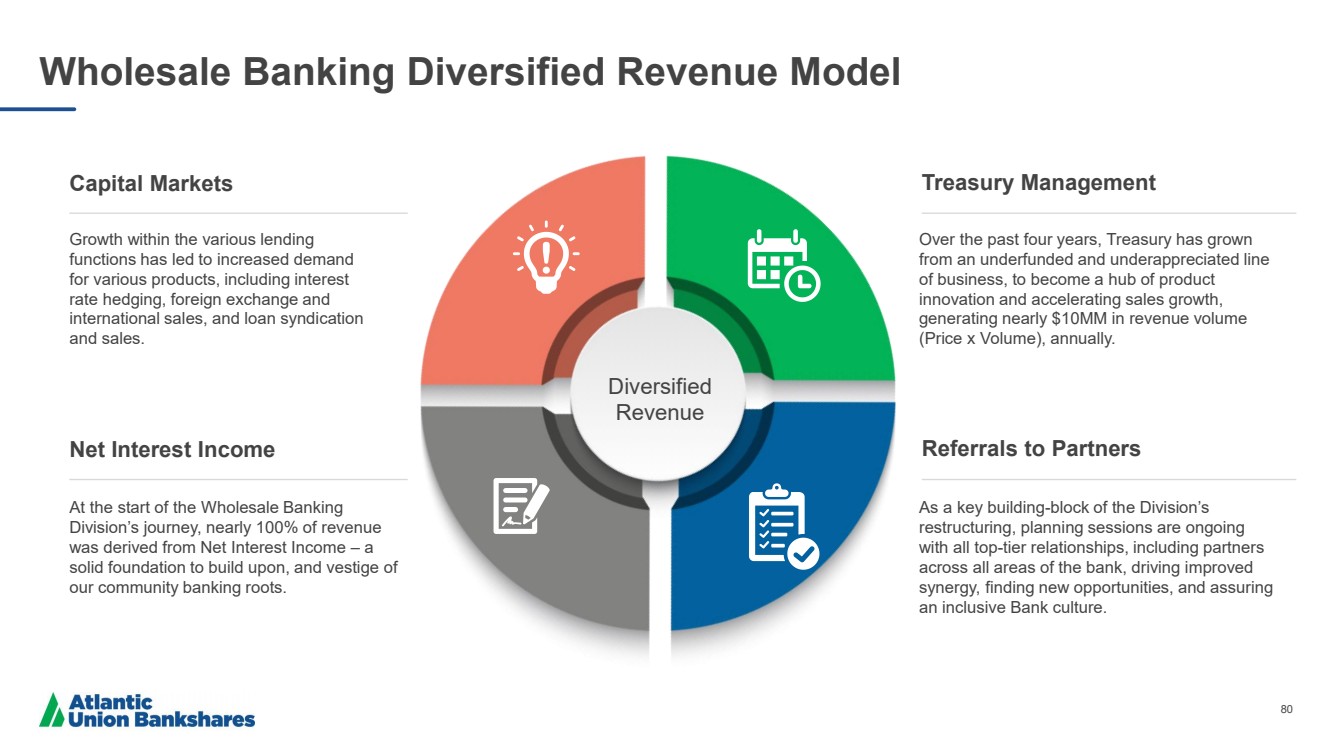
| 80 Wholesale Banking Diversified Revenue Model At the start of the Wholesale Banking Division’s journey, nearly 100% of revenue was derived from Net Interest Income – a solid foundation to build upon, and vestige of our community banking roots. Capital Markets Growth within the various lending functions has led to increased demand for various products, including interest rate hedging, foreign exchange and international sales, and loan syndication and sales. As a key building - block of the Division’s restructuring, planning sessions are ongoing with all top - tier relationships, including partners across all areas of the bank, driving improved synergy, finding new opportunities, and assuring an inclusive Bank culture. Over the past four years, Treasury has grown from an underfunded and underappreciated line of business, to become a hub of product innovation and accelerating sales growth, generating nearly $10MM in revenue volume (Price x Volume), annually. Diversified Revenue Treasury Management Net Interest Income Referrals to Partners |
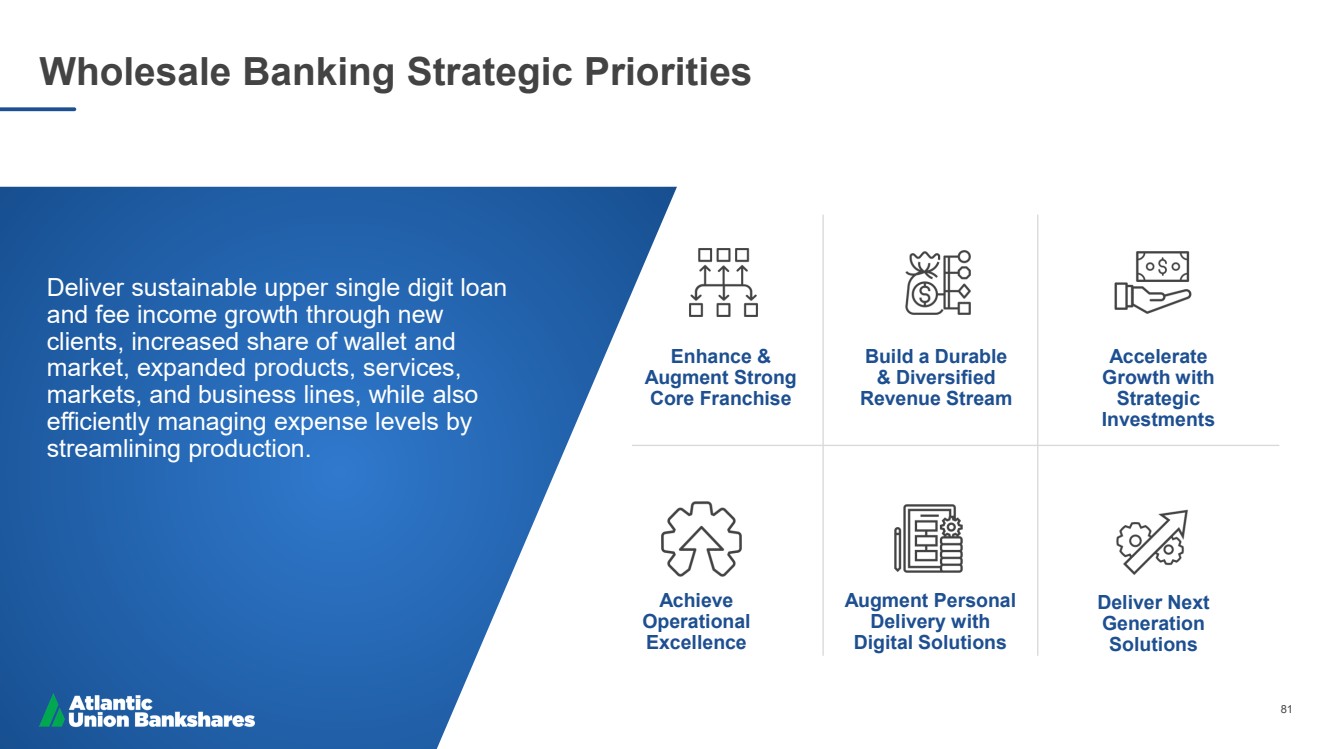
| 81 Wholesale Banking Strategic Priorities Deliver sustainable upper single digit loan and fee income growth through new clients, increased share of wallet and market, expanded products, services, markets, and business lines, while also efficiently managing expense levels by streamlining production. Enhance & Augment Strong Core Franchise Build a Durable & Diversified Revenue Stream Accelerate Growth with Strategic Investments Achieve Operational Excellence Augment Personal Delivery with Digital Solutions Deliver Next Generation Solutions |
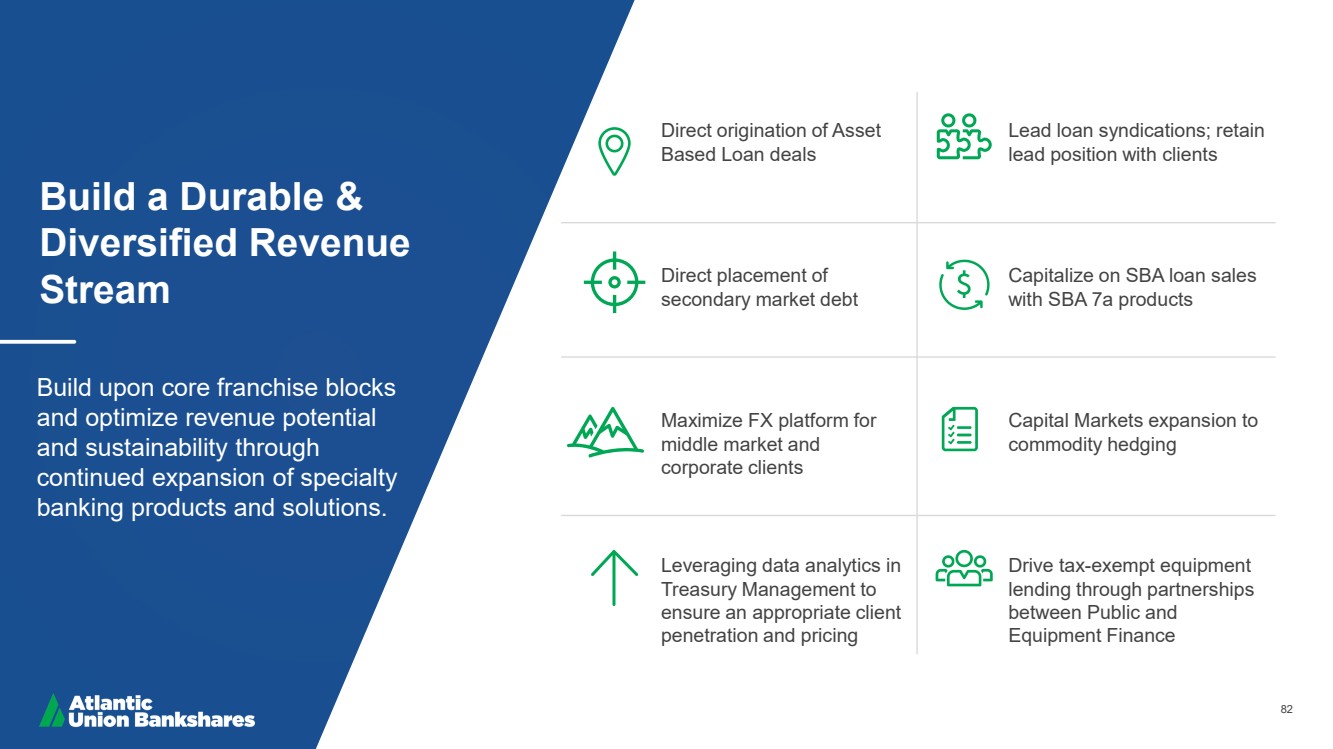
| 82 Build a Durable & Diversified Revenue Stream Build upon core franchise blocks and optimize revenue potential and sustainability through continued expansion of specialty banking products and solutions. Direct origination of Asset Based Loan deals Lead loan syndications; retain lead position with clients Direct placement of secondary market debt Capitalize on SBA loan sales with SBA 7a products Maximize FX platform for middle market and corporate clients Capital Markets expansion to commodity hedging Leveraging data analytics in Treasury Management to ensure an appropriate client penetration and pricing Drive tax - exempt equipment lending through partnerships between Public and Equipment Finance |
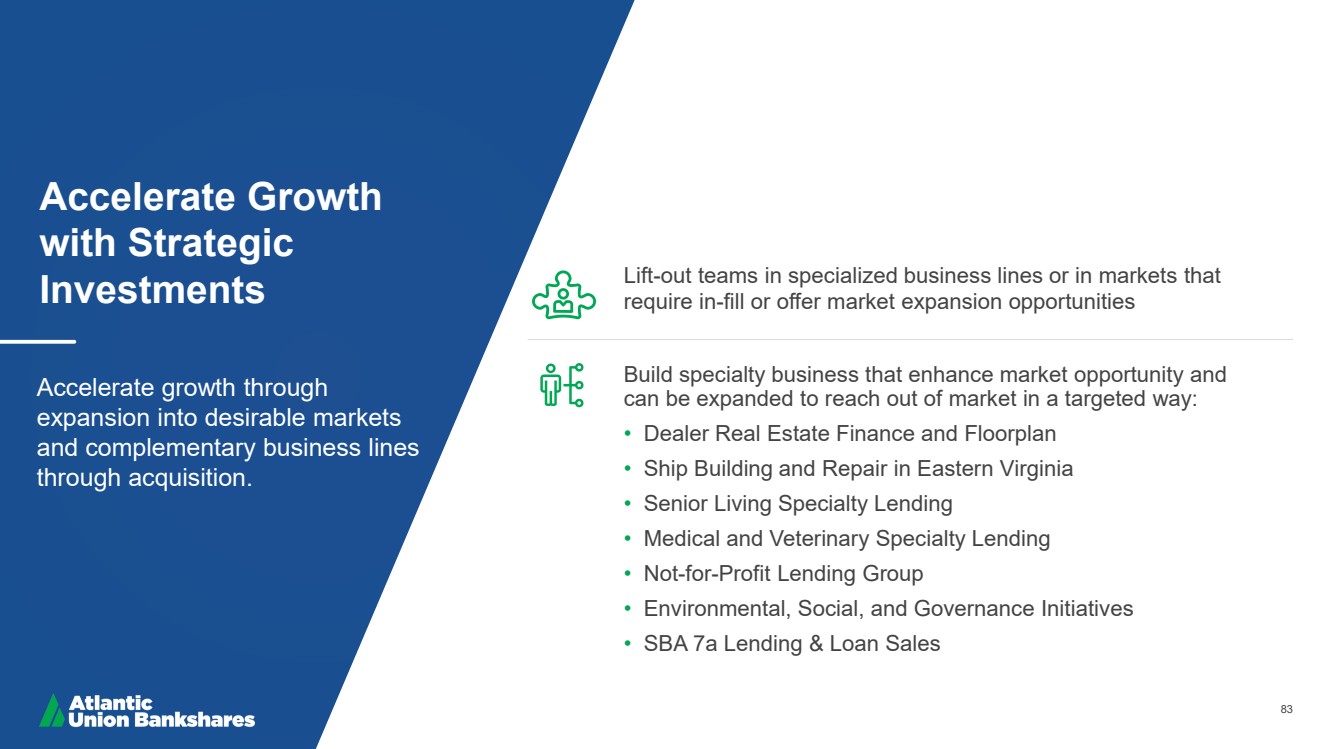
| 83 Accelerate Growth with Strategic Investments Accelerate growth through expansion into desirable markets and complementary business lines through acquisition. Lift - out teams in specialized business lines or in markets that require in - fill or offer market expansion opportunities Build specialty business that enhance market opportunity and can be expanded to reach out of market in a targeted way: • Dealer Real Estate Finance and Floorplan • Ship Building and Repair in Eastern Virginia • Senior Living Specialty Lending • Medical and Veterinary Specialty Lending • Not - for - Profit Lending Group • Environmental, Social, and Governance Initiatives • SBA 7a Lending & Loan Sales |
| 84 Augment Personal Delivery with Digital Solutions Augment local delivery with digital capabilities, where bankers provide advice, form stickier relationships, and allow technology to enable deeper customer relationships. Use data to measure performance against client expectations Refine processes to serve clients using digital solutions, timely problem resolution and smooth product implementation Add sophisticated call center client service support Invest in key technology and process improvements to improve sales, onboarding, service, ease of doing business, operations and problem resolution Continue to improve the clients digital / mobile experience Eliminate customer pain points |
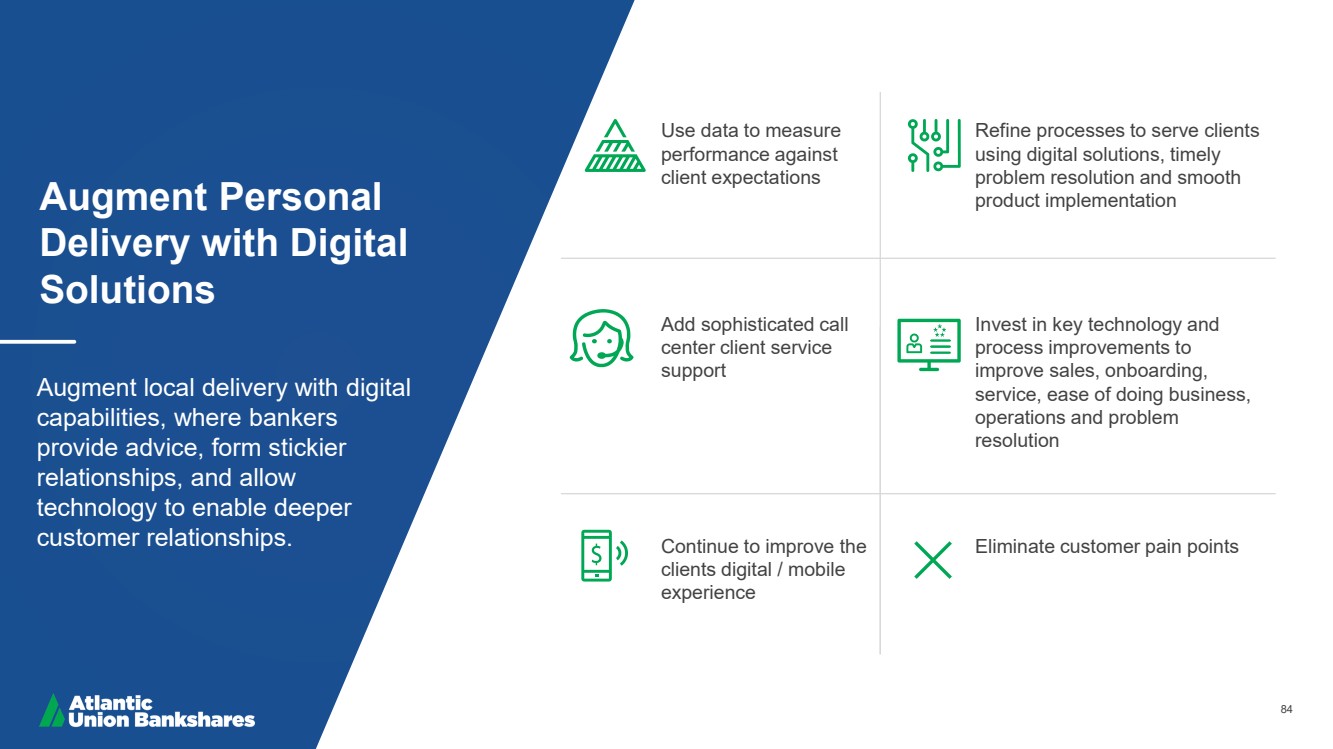
| 85 Deliver Next Generation Solutions Foster continuous product development and improvement with an eye on the future of wholesale banking delivery models and evolving client expectations Continually evaluate and integrate new technology (i.e. Fed Now, Real Time Payments, and Blockchain for loans and payments) Identify strategic partners to deliver enhanced client solutions Invest to maintain competitive products within a chosen set of distinctive areas Complement segment strategies, integrated with product roadmap for scalable growth of Business |
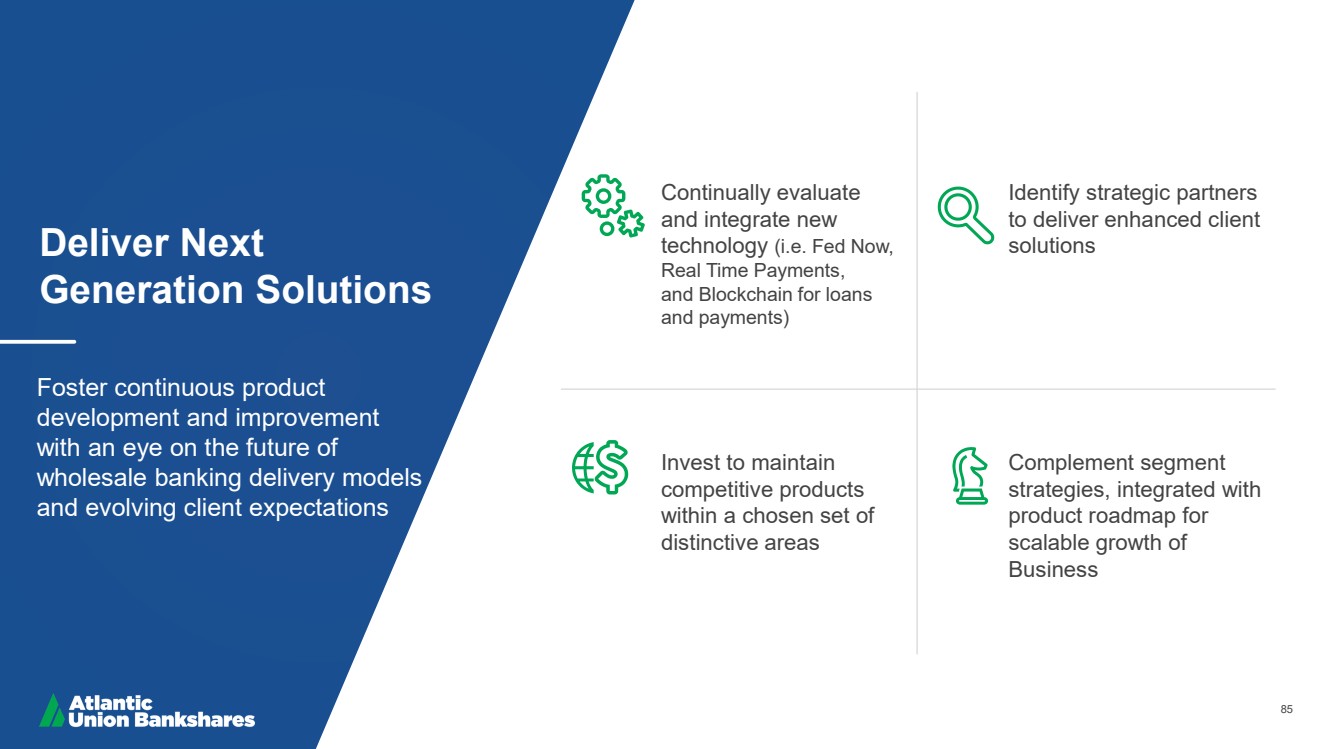
| 86 Wholesale Banking Case Study in New Verticals: Atlantic Union Equipment Finance Strategy • New verticals / lines of business are key to asset growth and diversification • Differentiated product offering, improves geographic reach & middle market penetration, while ensuring alignment to core values • Enable scalable growth in both assets and noninterest income Target • Prioritizes team lifts vs. acquisitions, improving returns & Cross functional integration across AUB’s various lines of business • C&I lending products (e.g. asset based lending and dealer financing) • Non - interest income streams (e.g. capital markets and SBA sales) Case Study: Atlantic Union Equipment Finance (AUEF) Background and Development • During 2018, began searching out potential fits for either a finance company acquisition or team lift out • By 2019, equipment finance was determined to be the most lucrative and suitable target • Heightened multiples within the acquisition space compelled AUB to prioritize a team lift out, leading to secondary benefits of an improved return profit, strategic alignment and credit quality Build and Rolling out an Equipment Finance Subsidiary • The AUEF team came onboard in October of 2019, completing a full buildout in under three months • Starting with three middle market sales directors, AUEF originated its first deal in late 2019, and grew to over $100MM in its first six months A Success Story • Since its inception, the group has grown to six middle market sales directors, three specialty vehicle sales directors, and a stand - alone credit and underwriting team • The group has steadily grown its portfolio through organic production (not purchased books of business) to slightly more than $600MM at the end of Q1 2022 • Poised for continued success, AUEF is now pursuing its own strategy of asset and income diversification, working to improve efficiency and time to market, while building its upstream, middle market book - 100,000 200,000 300,000 400,000 500,000 600,000 700,000 Balances (000s) 86 |
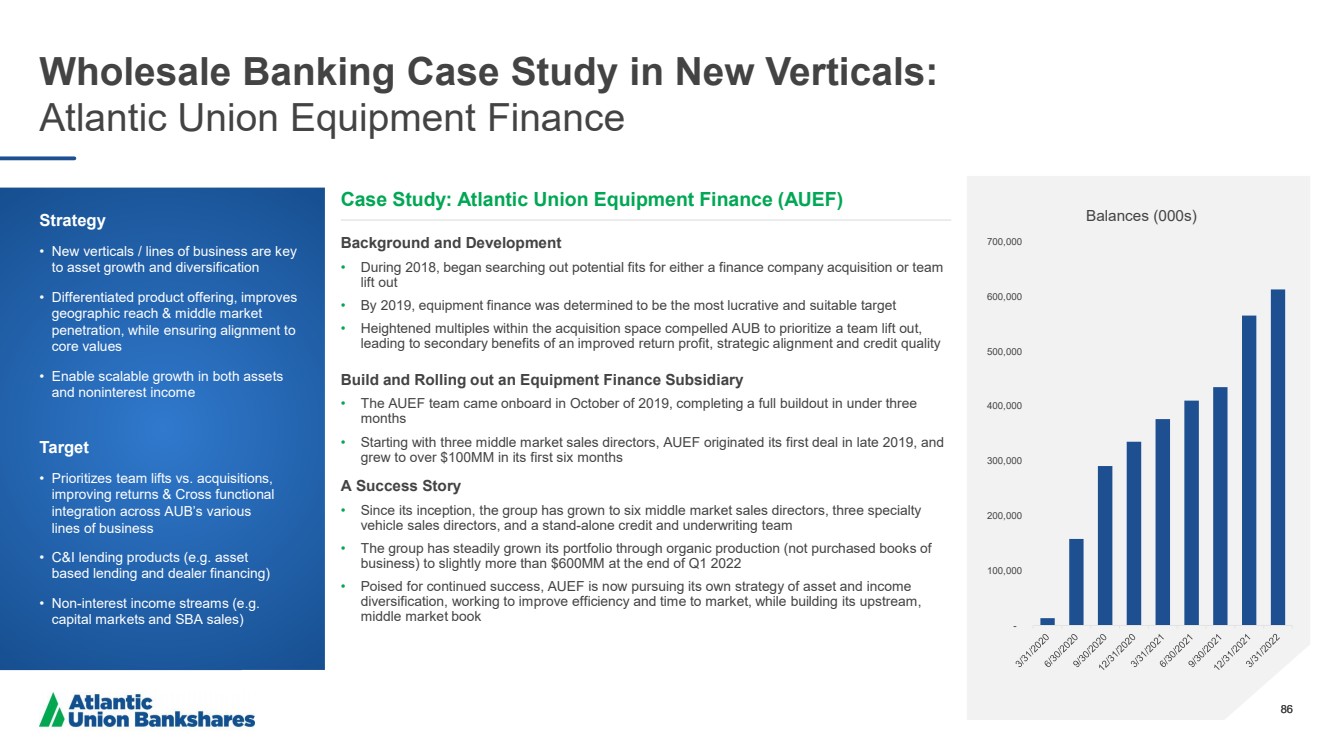
| 87 Rob Gorman Chief Financial Officer |

| 88 Our Value Proposition Leading Regional Presence Dense, uniquely valuable presence across attractive markets Financial Strength Solid balance sheet & capital levels Attractive Financial Profile Solid dividend yield & payout ratio with earnings upside Strong Growth Potential Organic & acquisition opportunities Peer - Leading Performance Committed to top - tier financial performance |
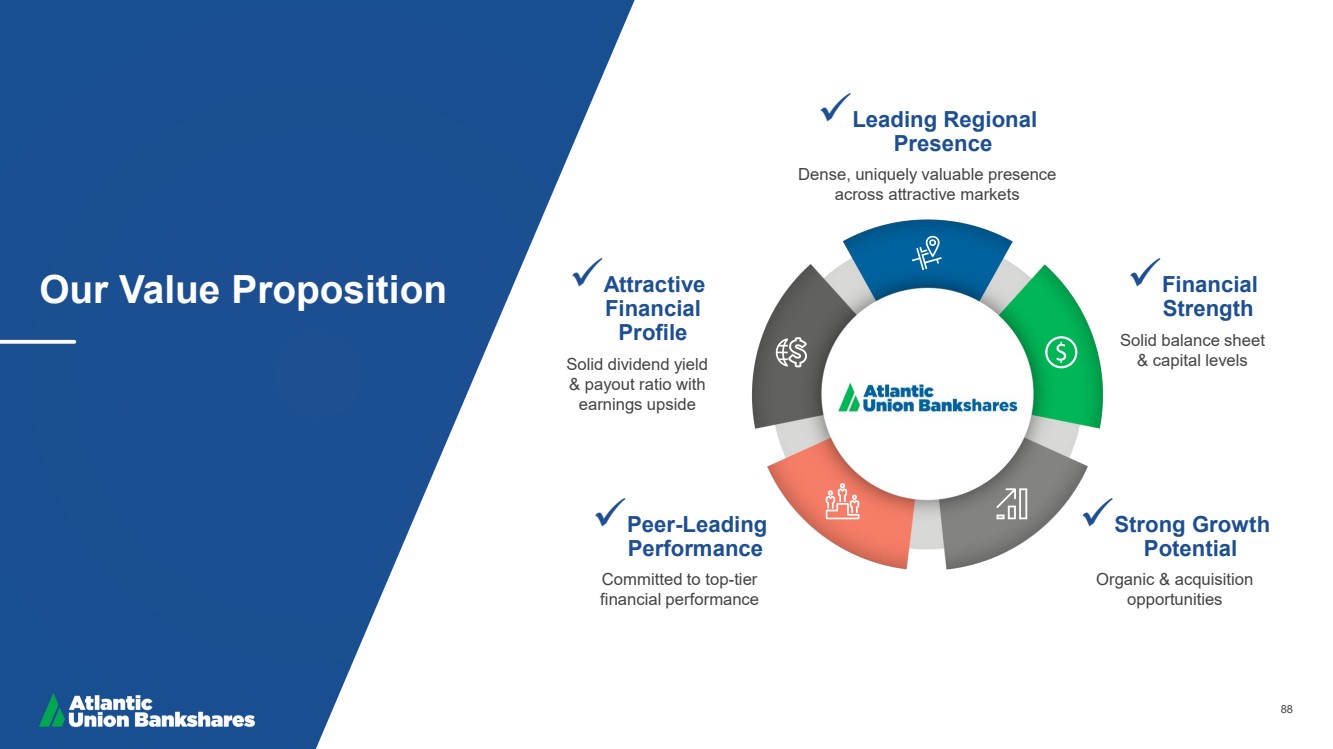
| 89 Balance Sheet and Earnings Growth 1 Data as of or for the twelve months ended each respective year, except for 1Q2022 which is as of or for the three months ende d M arch 31, 2022 1 Non - GAAP financial measure; See reconciliation to most directly comparable GAAP measure in "Appendix -- Reconciliation of Non - G AAP Disclosures” Loans ($mm) Deposits ($mm) Operating Earnings Per Share Available to Common Shareholders ($) 1 $7,142 $13,459 2017 1Q2022 16 % CAGR $6,992 $16,484 2017 1Q2022 22 % CAGR $1.90 $3.53 2017 2021 17 % CAGR |
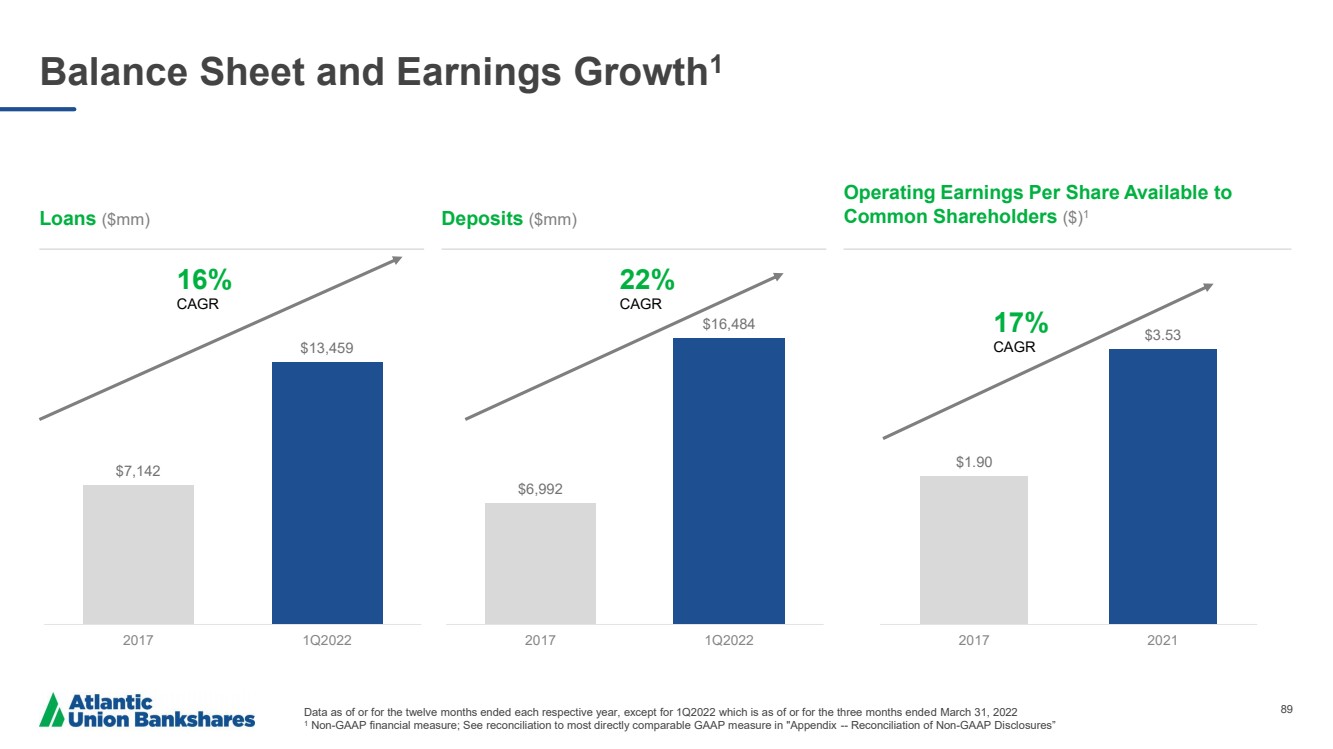
| 90 Strong Track Record of Operating Performance Data for the twelve months ended each respective year, 1 Non - GAAP financial measure; See reconciliation to most directly comparable GAAP measure in "Appendix -- Reconciliation of Non - G AAP Disclosures” Operating Return on Assets (ROA) (%) 1 Operating Return on Tangible Common Equity (%) 1 Operating Efficiency Ratio (FTE) (%) 1 0.94% 1.43% 2017 2021 12.17% 18.07% 2017 2021 60.78% 54.52% 2017 2021 |
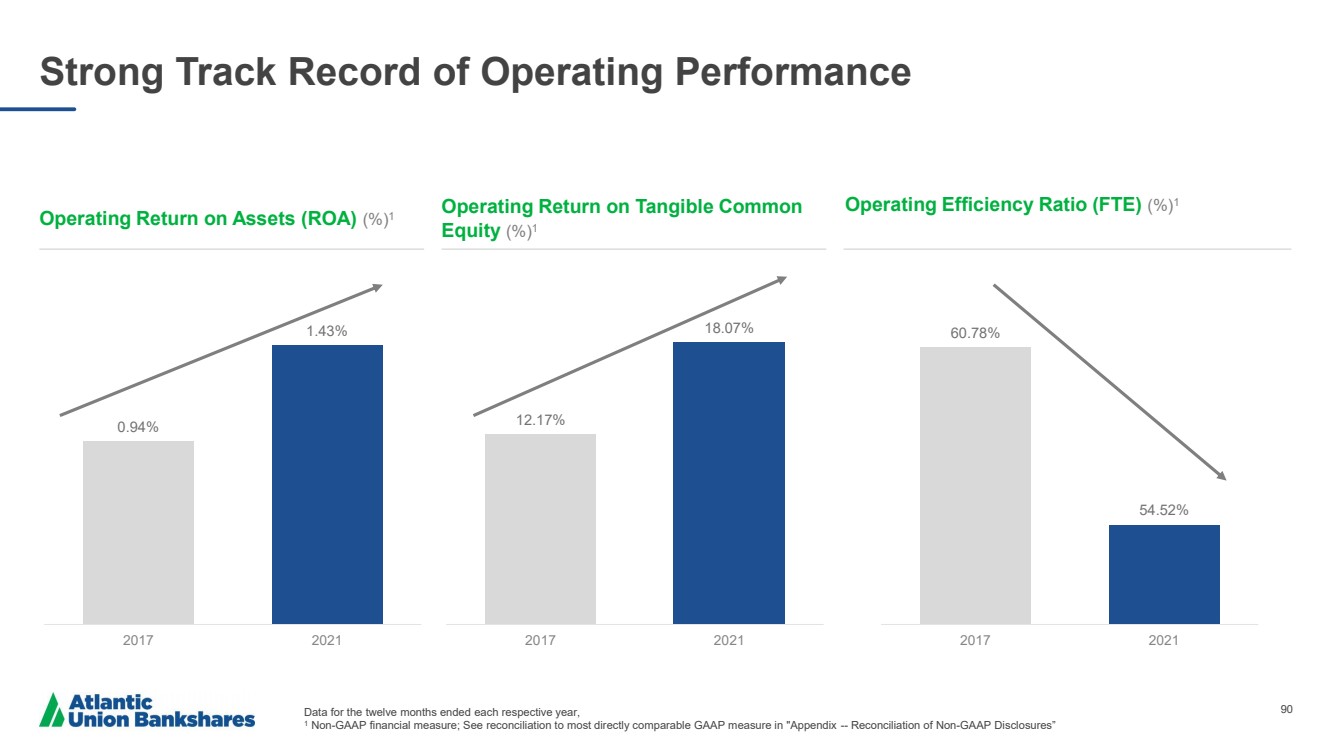
| 91 Strong Capital Position Supports Organic Growth *Capital information presented herein is based on estimates and subject to change pending the Company’s filing of its regulatory reports 1 Non - GAAP financial measure; See reconciliation to most directly comparable GAAP measure in "Appendix -- Reconciliation of Non - GAAP Disclosures” Capital Ratio as of 3/31/2022 Regulatory Well Capitalized Atlantic Union Bankshares* Atlantic Union Bank* Common Equity Tier 1 Ratio (CET1) 7.0% 9.9% 12.9% Tier 1 Capital Ratio 8.5% 10.9% 12.9% Total Risk Based Capital Ratio 10.5% 13.8% 13.3% Leverage Ratio 1 5.0% 9.1% 10.7% Tangible Common Equity Ratio (non - GAAP) 1 - 7.2% 9.7% Capital Management Strategy Atlantic Union capital management objectives are to: • Maintain designation as a “well capitalized” institution. • Ensure capital levels are commensurate with the Company’s risk profile, capital stress test projections, and strategic plan objectives. The Company’s regulatory capital ratios are well above well capitalized levels as of 3/31/2022. |
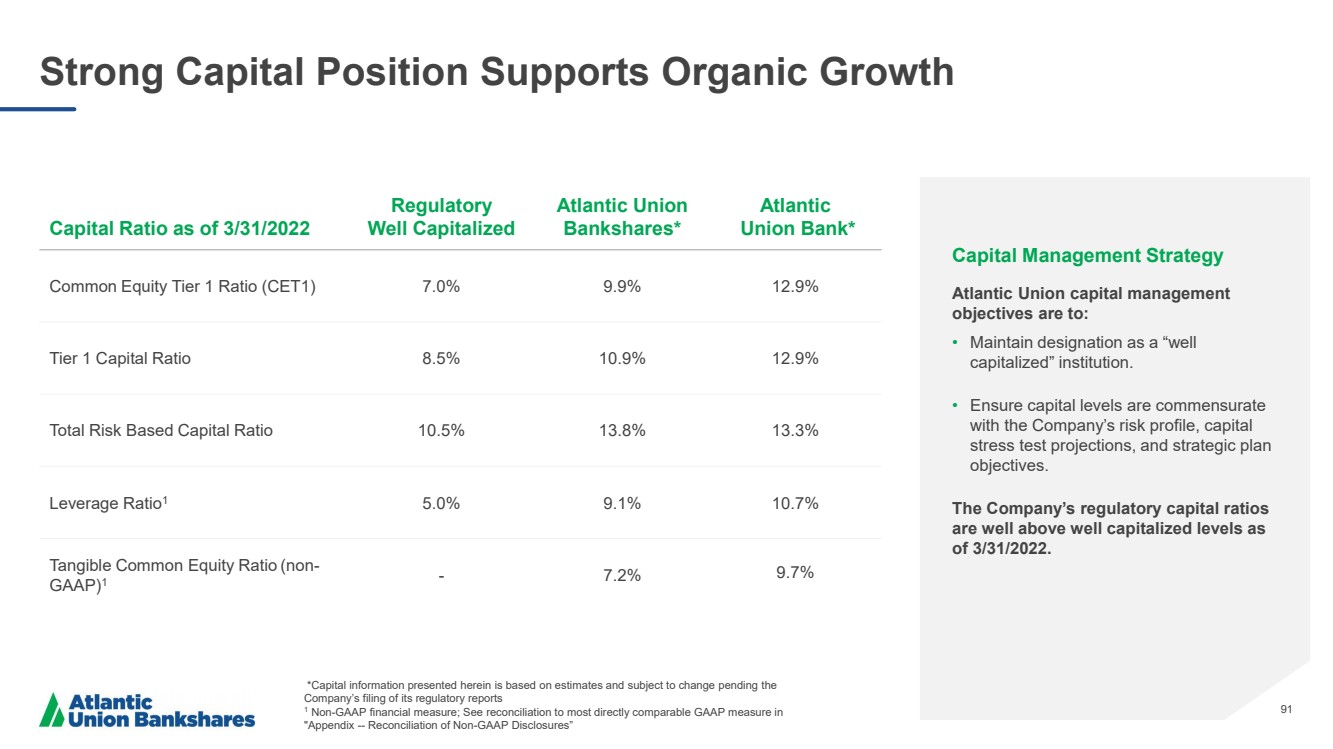
| 92 Capital Management Priorities 1 Total Common shareholder payout; includes common share repurchases, common share dividends and operating net income (Non - GAAP). Adjusted Operating Earnings is a Non - GAAP financial measure; See reconciliation to most directly comparable GAAP measure in "Appendix -- Reconciliation of Non - GA AP Disclosures” Annual Common Stock Dividend Growth 9 % 8 - year CAGR Share Repurchases ~11.7 million common shares have been repurchased since 2013 for ~$367 million at an average share price of $31.21 Capital Priorities Consolidated Common Equity Tier 1 Capital Ratio Operating Earnings Returned to Common Shareholders 1 Supporting Organic Growth Common Dividend Payout Ratio target of 35% - 40% Common Share Repurchases $0.54 $0.58 $0.68 $0.77 $0.81 $0.88 $0.96 $1.00 $1.09 2013 2014 2015 2016 2017 2018 2019 2020 2021 2013 2014 2015 2016 2017 2018 2019 2020 2021 9.0% 9.9% 10.2% 10.3% 10.2% 2017 2018 2019 2020 2021 Target Range 9.0% - 10% 43% 32% 70% 74% 77% 2017 2018 2019 2020 2021 |
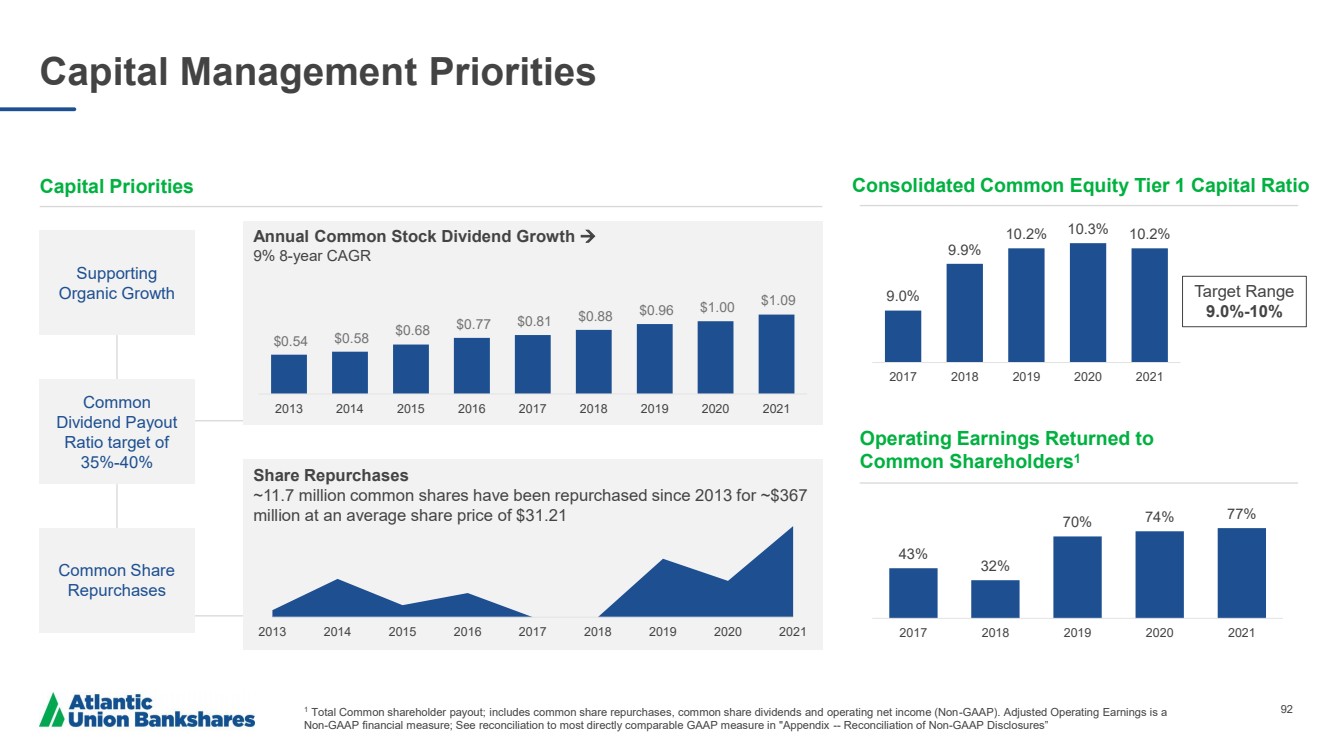
| 93 AUB’s Total Shareholder Return Performance vs. Peer Banks 1 As of May 4, 2022 3 Year Relative TSR 1 4.35% 2.85% Proxy Peers AUB 151.68% 249.71% Proxy Peers AUB 10 Year Relative TSR 1 5 Year Relative TSR 1 3.19% 19.63% Proxy Peers AUB 1 Year Relative TSR 1 - 8.37% - 7.56% Proxy Peers AUB 2 Year Relative TSR 1 61.08% 69.39% Proxy Peers AUB |
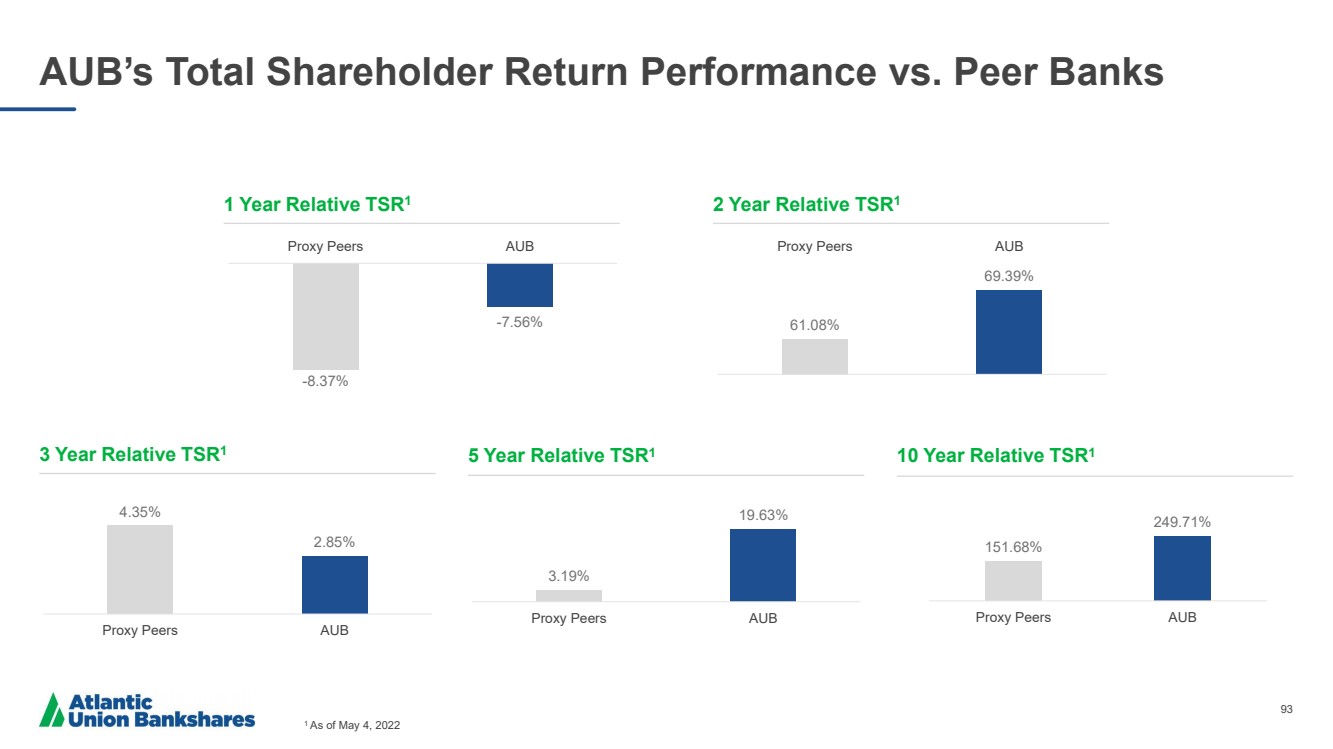
| 94 Top - Tier Financial Targets Committed to top - tier financial performance 16 % – 18 % Return on Tangible Common Equity 1.3 % – 1.5 % Return on Assets ≤ 51 % 1 Efficiency Ratio (FTE) Atlantic Union is committed to achieving top tier financial performance and providing our shareholders with above average returns on their investment regardless of the operating environment Key financial performance operating metrics benchmarked against top quartile peers 94 We expect to achieve these financial targets in the second half of 2022 1 includes the approximately 2.5% efficiency ratio impact of the Virginia franchise tax expense (vs. state income tax). |
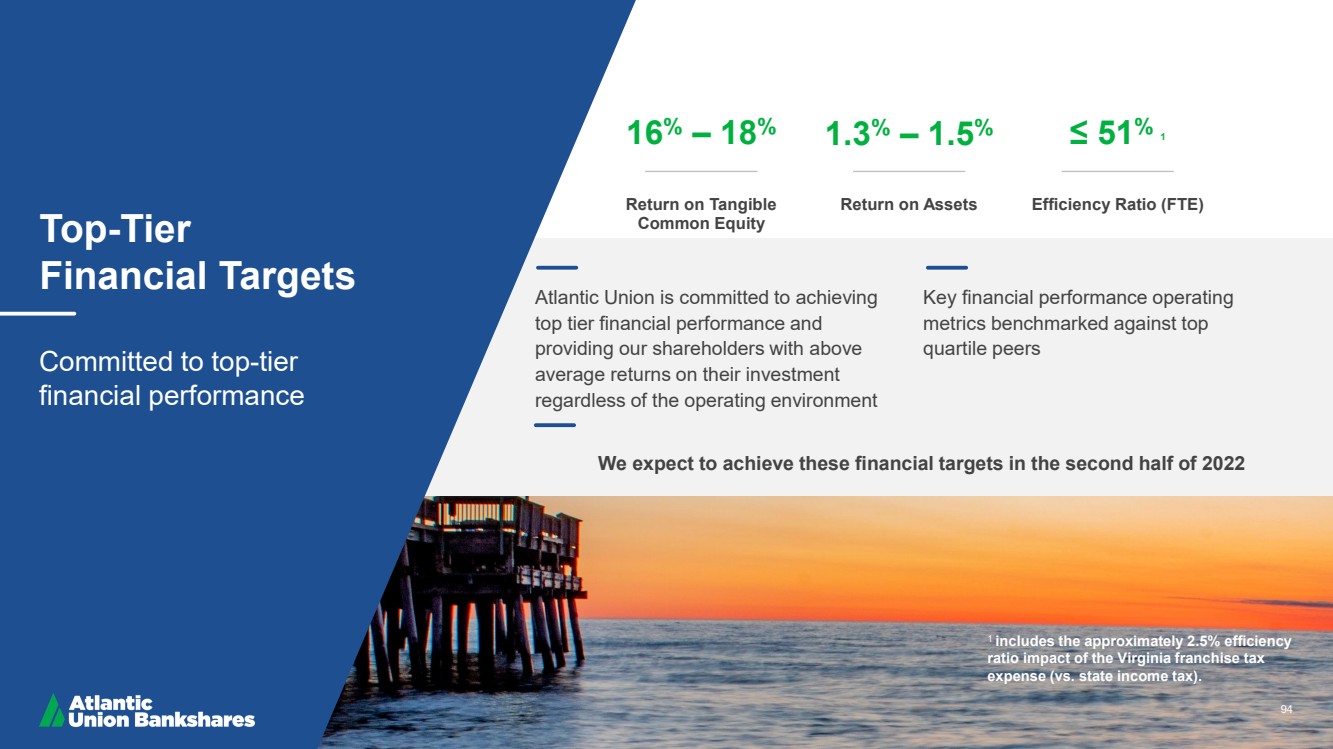
| 95 Financial Outlook 1 1 Key Economic Assumptions • Rising rate environment • The Federal Reserve Bank increases the fed funds rate on an accelerated basis to: • 2.5% by the end of 2022; and • 3.25% at the end of 2023 • Soft landing achieved with real GDP growth of 2.0 - 3.0% over the forecast period • Expect stable economy in AUB’s Virginia footprint • Unemployment remains low at 3.5% - 4% Full Year 2022 Guidance Medium Term Targets Loan Growth Upper single digits (ex PPP) Upper single digits Net Interest Income (FTE) growth ~10% – 15% (ex PPP) Upper single digits Net Interest Margin (FTE) 3.25% – 3.30% (ex PPP) ~3.40% – 3.60% Noninterest Income Growth ~0% – 3% Mid - single digits Noninterest Expense $ Target/Growth $385 – $390 million Mid - single digits Positive Operating Leverage Revenue Growth: Upper single digits (ex PPP) Operating Expense Growth: Low single digits Revenue Growth: Upper single digits Operating Expense Growth: M id - single digits Credit Outlook Allowance for Credit Losses (ACL) to Loans: ~80 – 85 basis points Net charge - off ratio: ~5 - 10 basis points ACL to loans: ~80 – 85 basis points Net charge - off ratio: ~10 - 20 basis points |
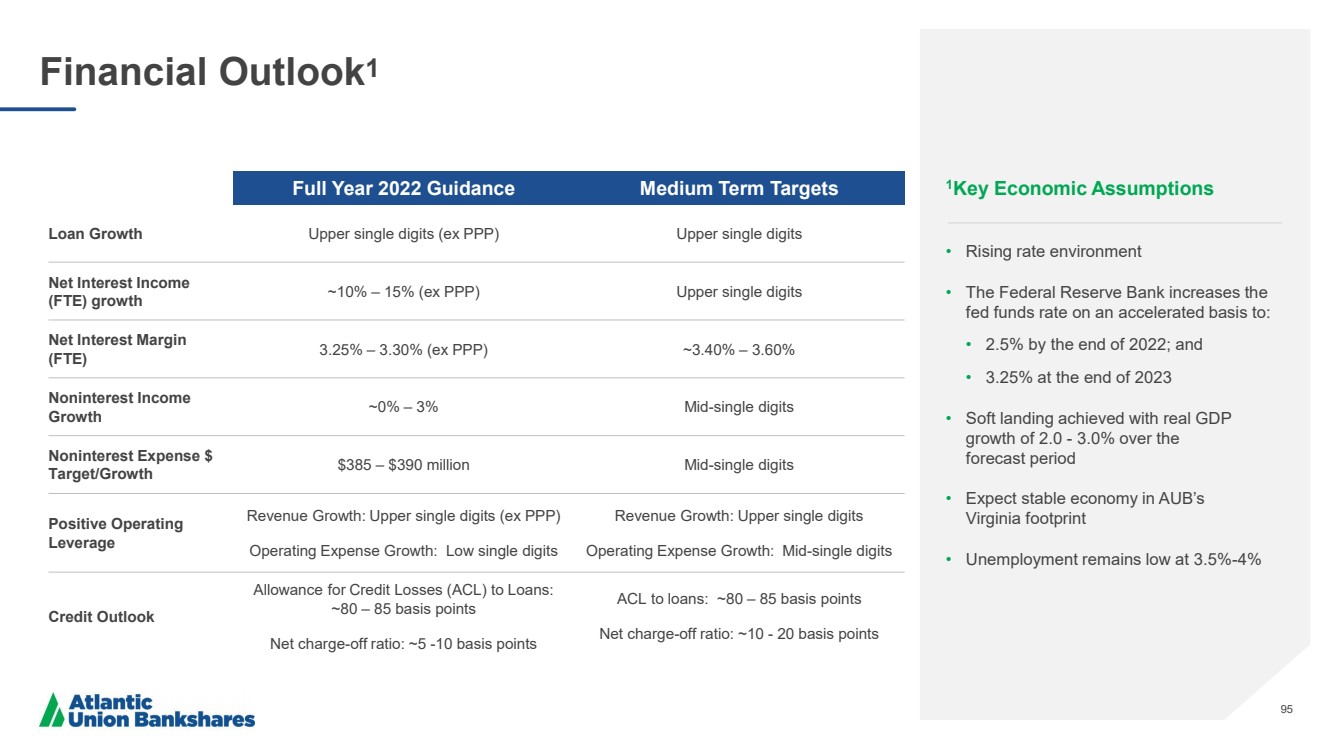
| 96 Final Recap |

| 97 “ Our strategy has been consistent and is working – but is evolving based on our experience and changes in our environment, customer expectations and behaviors ..” - John Asbury, CEO |
| 98 We Are Well Positioned for the Current Environment and Optimistic About Our Future Top Tier Performance Pristine Credit Expense Management Actions Asset Sensitivity Growth Footing |

| 99 Questions |

| 100 Appendix |

| 101 Reconciliation of Non - GAAP Disclosures The Company has provided supplemental performance measures on a tax - equivalent, tangible, operating, adjusted, or pre - tax pre - pr ovision basis. These non - GAAP financial measures are a supplement to GAAP, which is used to prepare the Company’s financial statements, and sho uld not be considered in isolation or as a substitute for comparable measures calculated in accordance with GAAP. In addition, the Compa ny’ s non - GAAP financial measures may not be comparable to non - GAAP financial measures of other companies. The Company uses the non - GAAP financ ial measures discussed herein in its analysis of the Company’s performance. The Company’s management believes that these non - GAAP fi nancial measures provide additional understanding of ongoing operations, enhance comparability of results of operations with prior pe rio ds and show the effects of significant gains and charges in the periods presented without the impact of items or events that may obscure tren ds in the Company’s underlying performance. |
| 102 Reconciliation of Non - GAAP Disclosures Adjusted operating measures exclude merger and rebranding - related costs, nonrecurring tax expenses, the gains or losses related to balance sheet repositioning (principally composed of gains and losses on debt extinguishment), gains or losses on sale of securities, gains on the sale of Visa, Inc. Class B common stock, as well as branch closing and facility consolidation costs (principally composed of real estate, leases and other assets write downs, gains or losses on related real estate sales, as well as severance associated with branch closing and corporate expense reduction initiatives). The Company believes these non - GAAP adjusted measures provide investors with important information about the continuing economic results of the organization’s operations. Prior periods in this presentation have been adjusted for previously announced branch closing and corporate expense reduction initiatives. Tangible assets and tangible common equity are used in the calculation of certain profitability, capital, and per share ratios. The Company believes tangible common equity and the related ratios are meaningful measures of capital adequacy because they provide a meaningful base for period - to - period and company - company comparisons, which the Company believes will assist investors in assessing the capital of the Company and its ability to absorb potential losses. Additionally, the Company believes that return on tangible common equity (ROTCE) is a meaningful supplement to GAAP financial measures and useful to investors because it measures the performance of a business consistently across time without regard to whether components of the business were acquired or developed internally. For the three months ended (Dollars in thousands, except per share amounts) March 31, 2022 2021 2020 2019 2018 2017 2016 2015 2014 2013 Adjusted Operating Earnings Net Income (GAAP) 43,690 $ 263,917 $ 158,228 $ 193,528 $ 146,248 $ 72,923 $ 77,476 $ 67,079 $ 52,164 $ 34,366 $ Plus: Merger and rebranding-related costs, net of tax - - - 27,395 32,065 4,405 - - 13,724 2,042 Plus: Nonrecurring tax expenses - - - - - 6,250 - - - - Plus: Net loss related to balance sheet repositioning, net of tax - 11,609 25,979 12,953 - - - - - - Less: Gain on sale of securities, net of tax - 69 9,712 6,063 303 520 133 1,174 1,339 17 Less: Gain on Visa, Inc. Class B common stock, net of tax - 4,058 - - - - - - - - Plus: Branch closing and facility consolidation costs, net of tax 4,351 13,775 5,343 - 849 - - - - - Adjusted operating earnings (non-GAAP) 48,041 $ 285,174 $ 179,838 $ 227,813 $ 178,859 $ 83,058 $ 77,343 $ 65,905 $ 64,549 $ 36,391 $ Less: Dividends on preferred stock 2,967 11,868 5,658 - - - - - - - Adjusted operating earnings available to common shareholders (non-GAAP) 45,074 $ 273,306 $ 174,180 $ 227,813 $ 178,859 $ 83,058 $ 77,343 $ 65,905 $ 64,549 $ 36,391 $ Earnings per share (EPS) Weighted average common shares outstanding, diluted 75,556,127 77,417,801 78,875,668 80,263,557 65,908,573 43,779,744 EPS available to common shareholders, diluted (GAAP) 0.54 $ 3.26 $ 1.93 $ 2.41 $ 2.22 $ 1.67 $ Adjusted operating EPS available to common shareholders, diluted (non-GAAP) 0.60 $ 3.53 $ 2.21 $ 2.84 $ 2.71 $ 1.90 $ Return on assets (ROA) Average assets 19,920,368 $ 19,977,551 $ 19,083,853 $ 16,840,310 $ 13,181,609 $ 8,820,142 $ ROA (GAAP) 0.89% 1.32% 0.83% 1.15% 1.11% 0.83% Adjusted operating ROA (non-GAAP) 0.98% 1.43% 0.94% 1.35% 1.36% 0.94% Return on equity (ROE) Adjusted operating earnings available to common shareholders (non-GAAP) 45,074 $ 273,306 $ 174,180 $ 227,813 $ 178,859 $ 83,058 $ Plus: Amortization of intangibles, tax effected 2,401 10,984 13,093 14,632 10,143 3,957 Adjusted operating earnings available to common shareholders before amortization of intangibles (non-GAAP) 47,475 $ 284,290 $ 187,273 $ 242,445 $ 189,002 $ 87,015 $ Average common equity (GAAP) 2,660,984 $ 2,725,330 $ 2,576,372 $ 2,451,435 $ 1,863,216 $ 1,030,847 $ Less: Average intangible assets 977,303 985,559 1,000,654 991,926 776,944 315,722 Less: Average perpetual preferred stock 166,356 166,356 93,658 - - - Average tangible common equity (non-GAAP) 1,517,325 $ 1,573,415 $ 1,482,060 $ 1,459,509 $ 1,086,272 $ 715,125 $ ROE (GAAP) 6.66% 9.68% 6.14% 7.89% 7.85% 7.07% Return on tangible common equity (ROTCE) Net Income available to common shareholders (GAAP) 40,723 $ 252,049 $ 152,570 $ 193,528 $ 146,248 $ 72,923 $ Plus: Amortization of intangibles, tax effected 2,401 10,984 13,093 14,632 10,143 3,957 Net Income available to common shareholders before amortization of intangibles (non-GAAP) 43,124 $ 263,033 $ 165,663 $ 208,160 $ 156,391 $ 76,880 $ ROTCE 11.53% 16.72% 11.18% 14.26% 14.40% 10.75% Adjusted operating ROTCE (non-GAAP) 12.69% 18.07% 12.64% 16.61% 17.40% 12.17% ADJUSTED OPERATING EARNINGS & FINANCIAL METRICS For the years ended December 31, |
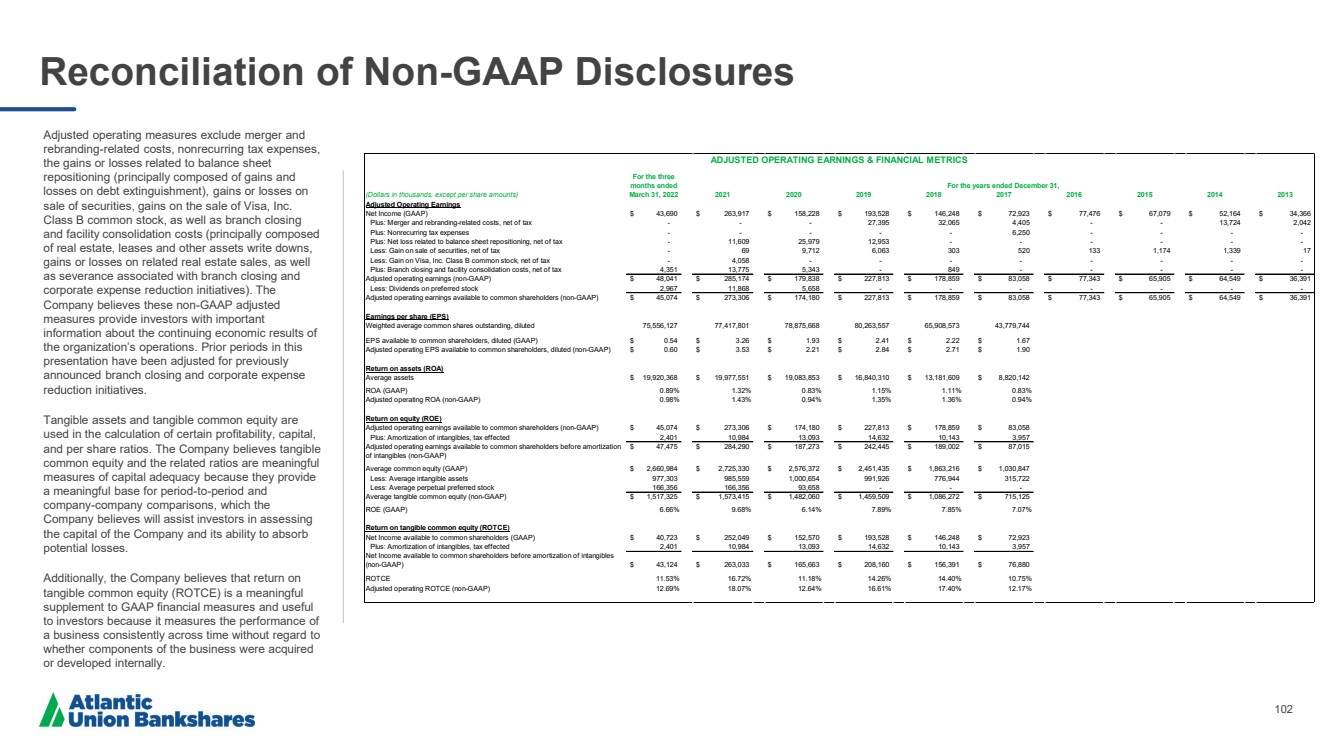
| 103 Reconciliation of Non - GAAP Disclosures The adjusted operating efficiency ratio (FTE) excludes merger - related costs, rebranding costs, the amortization of intangible assets, gains or losses on sale of securities, gains on the sale of Visa, Inc. Class B common stock, gains or losses related to balance sheet repositioning (principally composed of gains and losses on debt extinguishment), as well as branch closing and facility consolidation costs. This measure is similar to the measure utilized by the Company when analyzing corporate performance and is also similar to the measure utilized for incentive compensation. The Company believes this adjusted measure provides investors with important information about the combined economic results of the organization’s operations. Prior periods in this presentation have been adjusted for previously announced branch closing and corporate expense reduction initiatives. For the three months ended (Dollars in thousands) March 31, 2022 2021 2020 2019 2018 2017 Noninterest expense (GAAP) 105,321 $ 419,195 $ 413,349 $ 418,340 $ 337,767 $ 225,668 $ Less: Merger-related costs - - - 27,824 39,728 5,393 Less: Rebranding costs - - - 6,455 - - Less: Amortization of intangible assets 3,039 13,904 16,574 18,521 12,839 6,088 Less: Losses related to balance sheet repositioning - 14,695 31,116 16,397 - - Less: Branch closing and facility consolidation costs 5,508 17,437 6,764 - 1,075 - Adjusted operating noninterest expense (non-GAAP) 96,774 $ 373,159 $ 358,895 $ 349,143 $ 284,125 $ 214,187 $ Net interest income (GAAP) 130,931 $ 551,260 $ 555,298 $ 537,872 $ 426,691 $ 279,007 $ Net interest income (FTE) (non-GAAP) 134,267 563,851 566,845 548,993 434,886 290,774 Noninterest income (GAAP) 30,153 $ 125,806 $ 131,486 $ 132,815 $ 104,241 $ 62,429 $ Plus: Losses related to balance sheet repositioning - - (1,769) - - - Less: Gain on sale of securities - 87 12,294 7,675 383 800 Less: Gain on Visa, Inc. Class B common stock - 5,137 - - - - Adjusted operating noninterest income (non-GAAP) 30,153 $ 120,582 $ 120,961 $ 125,140 $ 103,858 $ 61,629 $ Efficiency ratio (GAAP) 65.38% 61.91% 60.19% 62.37% 63.62% 66.09% Adjusted operating efficiency ratio (FTE) (non-GAAP) 58.86% 54.52% 52.18% 51.79% 52.74% 60.78% ADJUSTED OPERATING EFFICIENCY RATIO For the years ended December 31, |
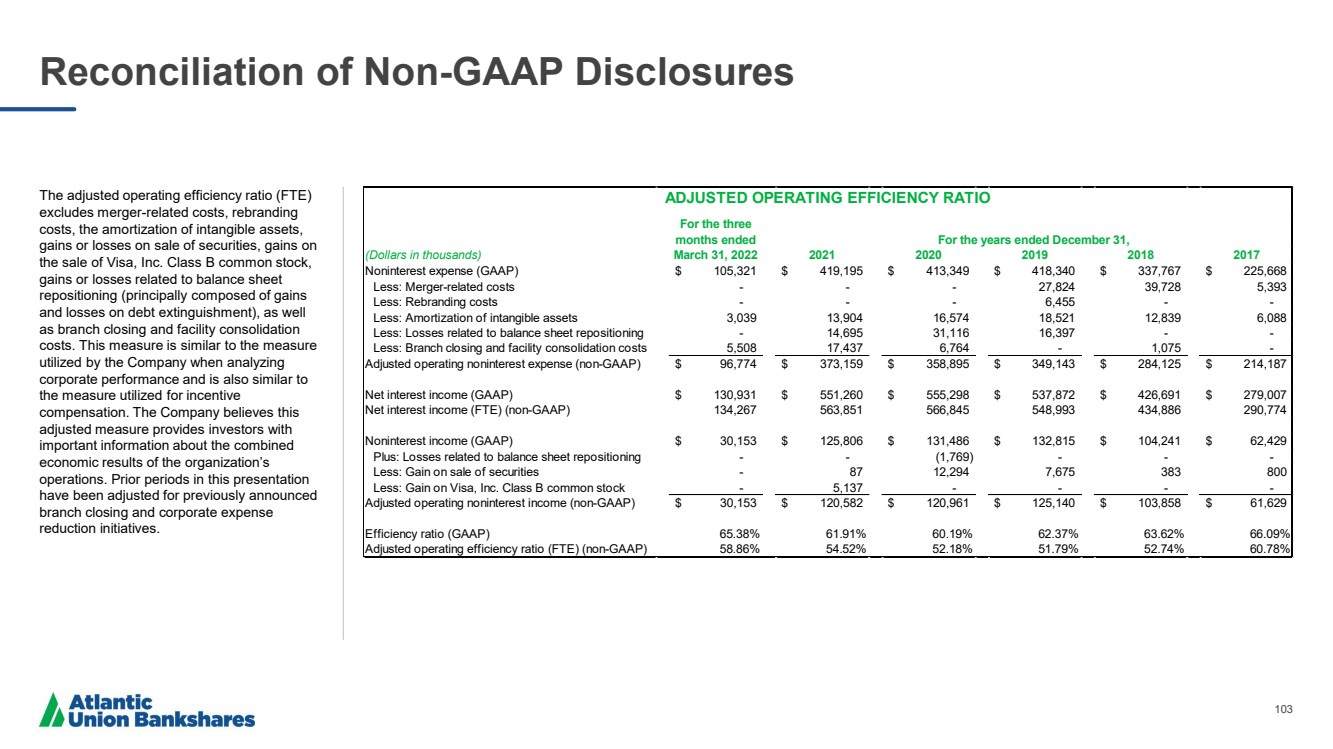
| 104 Reconciliation of Non - GAAP Disclosures Tangible assets, tangible common equity, and adjusted leverage ratio are used in the calculation of certain profitability, capital, and per share ratios. The Company believes tangible assets, tangible common equity, adjusted leverage ratio and the related ratios are meaningful measures of capital adequacy because they provide a meaningful base for period - to - period and company - to - company comparisons, which the Company believes will assist investors in assessing the capital of the Company and its ability to absorb potential losses. (Dollars in thousands, except per share amounts) Atlantic Union Bankshares Atlantic Union Bank Tangible Assets Ending Assets (GAAP) 19,782,430 $ 19,690,628 $ Less: Ending goodwill 935,560 935,560 Less: Ending amortizable intangibles 40,273 40,273 Ending tangible assets (non-GAAP) 18,806,597 $ 18,714,795 $ Less: PPP loans 67,444 67,444 Tangible assets, excl PPP (non-GAAP) 18,739,153 $ 18,647,351 $ Tangible Common Equity Ending equity (GAAP) 2,498,335 $ 2,794,350 $ Less: Ending goodwill 935,560 935,560 Less: Ending amortizable intangibles 40,273 40,273 Less: Perpetual preferred stock 166,357 - Ending tangible common equity (non-GAAP) 1,356,145 $ 1,818,517 $ Average common equity (GAAP) 2,660,984 $ 2,928,010 $ Less: Average goodwill 935,560 935,560 Less: Average amortizable intangibles 41,743 41,743 Less: Average perpetual preferred stock 166,356 - Average tangible common equity (non-GAAP) 1,517,325 $ 1,950,707 $ Common equity to assets (GAAP) 11.8% 14.2% Tangible common equity to tangible assets (non-GAAP) 7.2% 9.7% Tangible common equity to tangible assets, excl PPP (non-GAAP) 7.2% 9.8% Book value per common share (GAAP) 31.12 $ Tangible book value per common share (non-GAAP) 18.10 $ Adjusted Leverage Ratio Tier 1 Capital 1,723,491 $ 2,027,193 $ Total average assets for leverage ratio 18,990,428 $ 18,925,912 $ Less: Average PPP loans 103,041 103,041 Adjusted average assets for leverage ratio 18,887,387 $ 18,822,871 $ Leverage Ratio 9.1% 10.7% Leverage Ratio, excl PPP 9.1% 10.8% TANGIBLE ASSETS, TANGIBLE COMMON EQUITY, AND ADJUSTED LEVERAGE RATIO As of March 31, 2022 |