| 2022 Annual Shareholders Meeting Nasdaq: AUB May 3, 2022 |

| 2 Forward Looking Statements Certain statements in this presentation may constitute “forward - looking statements” within the meaning of the Private Securities Litigation Reform Act of 1995. Forward - looking statements are statements that include, without limitation, statements regarding the Company’s outlook on future economic conditions and the impacts of the COVID - 19 pandemic, and statements that incl ude, projections, predictions, expectations, or beliefs about future events or results or otherwise are not statements of historical fact. Such forward - looking statements are based on certain assumptions as of the time they are made, and are inherent ly subject to known and unknown risks, uncertainties, and other factors, some of which cannot be predicted or quantified, that may cause actual results, performance, or achievements to be materially different from those expressed or implied by suc h f orward - looking statements. Such statements are often characterized by the use of qualified words (and their derivatives) such as “expect,” “believe,” “estimate,” “plan,” “project,” “anticipate,” “intend,” “will,” “may,” “view,” “opportunity,” “po ten tial,” or words of similar meaning or other statements concerning opinions or judgment of the Company and its management abou t future events. Although the Company believes that its expectations with respect to forward - looking statements are based upon rea sonable assumptions within the bounds of its existing knowledge of its business and operations, there can be no assurance that actual future results, performance, or achievements of, or trends affecting, the Company will not differ materially from an y projected future results, performance, achievements or trends expressed or implied by such forward - looking statements. Actual future results, performance, achievements or trends may differ materially from historical results or those anticipated depend ing on a variety of factors, including, but not limited to the effects of or changes in: • market interest rates and the impacts on macroeconomic conditions, customer and client behavior and the Company’s funding costs; • higher inflation and its impacts; • general economic and financial market conditions, in the United States generally and particularly in the markets in which the Company operates and which its loans are concentrated, including the effects of declines in real estate values, an increase in unemployment levels and slowdowns in economic growth, including as a result of COVID - 19; • the quality or composition of the loan or investment portfolios and changes therein; • demand for loan products and financial services in the Company’s market area; • the Company’s ability to manage its growth or implement its growth strategy; • the effectiveness of expense reduction plans; • the introduction of new lines of business or new products and services; • the Company’s ability to recruit and retain key employees; • real estate values in the Bank’s lending area; • an insufficient ACL; • changes in accounting principles, including , without limitation, relating to the CECL methodology ; • the Company’s liquidity and capital positions; • concentrations of loans secured by real estate, particularly commercial real estate; • the effectiveness of the Company’s credit processes and management of the Company’s credit risk; • the Company’s ability to compete in the market for financial services and increased competition from fintech companies; • technological risks and developments, and cyber threats, attacks, or events; • the potential adverse effects of unusual and infrequently occurring events, such as weather - related disasters, terrorist acts, geopolitical conflicts (such as the ongoing conflict between Russia and Ukraine) or public health events (such as COVID - 19), and of governmental and societal responses thereto; these potential adverse effects may include, without limitation, adverse effects on the ability of the Company's borrowers to satisfy their obligations to the Company, on the val ue of collateral securing loans, on the demand for the Company's loans or its other products and services, on supply chains and methods used to distribute products and services, on incidents of cyberattack and fraud, on the Company’s liquidity or capital positions, on risks posed by reliance on third - party service providers, on other aspects of the Company's business operations and on financial markets and economic growth; • the effect of steps the Company takes in response to COVID - 19, the severity and duration of the pandemic, the uncertainty regarding new variants of COVID - 19 that have emerged, the speed and efficacy of vaccine and treatment developments, the impact of loosening or tightening of government restrictions, the pace of recovery when the pandemic subsides and the heightened impact it has on many of the risks described herein; • the discontinuation of LIBOR and its impact on the financial markets, and the Company’s ability to manage operational, legal and compliance risks related to the discontinuation of LIBOR and implementation of one or more alternate reference rates, • performance by the Company’s counterparties or vendors; • deposit flows; • the availability of financing and the terms thereof; • the level of prepayments on loans and mortgage - backed securities; • legislative or regulatory changes and requirements, including the impact of the Coronavirus Aid, Relief, and Economic Security ("CARES") Act, as amended by the Consolidated Appropriations Act, 2021, and other legislative and regulatory reactions to COVID - 19; • potential claims, damages, and fines related to litigation or government actions, including litigation or actions arising from the Company’s participation in and administration of programs related to COVID - 19, including, among other things, under the CARES Act, as amended by the CAA ; • the effects of changes in federal, state or local tax laws and regulations; • monetary and fiscal policies of the U.S. government, including policies of the U.S. Department of the Treasury and the Federal Reserve; • changes to applicable accounting principles and guidelines; and • other factors, many of which are beyond the control of the Company. Please refer to the “Risk Factors” and “Management’s Discussion and Analysis of Financial Condition and Results of Operations ” s ections of the Company’s Annual Report on Form 10 - K for the year ended December 31, 2021 and related disclosures in other filings, which have been filed with the SEC and are available on the SEC’s website at www.sec.gov. All risk factors and un certainties described herein should be considered in evaluating forward - looking statements, all forward - looking statements made in this presentation are expressly qualified by the cautionary statements contained or referred to herein, and undue rel ian ce should not be placed on such forward - looking statements. The actual results or developments anticipated may not be realized or, even if substantially realized, they may not have the expected consequences to or effects on the Company or its bus inesses or operations. Forward - looking statements speak only as of the date they are made. The Company does not intend or assume any obligation to update, revise or clarify any forward - looking statements that may be made from time to time by or on be half of the Company, whether as a result of new information, future events or otherwise. |
| 3 Additional Information Non - GAAP Financial Measures This presentation contains certain financial information determined by methods other than in accordance with generally accepted accounting principles in the United States (“GAAP”). These non - GAAP financial measures are a supplement to GAAP, which is used to prepare the Company’s financial statements, and should not be considered in isolation or as a substitute for comparable measures calculated in accordance with GAAP. In addition, the Company’s non - GAAP financial measures may not be comparable to non - GAAP financial measures of other companies. The Company uses the non - GAAP financial measures discussed herein in its analysis of the Company’s performance. The Company’s management believes that these non - GAAP financial measures provide additional understanding of ongoing operations, enhance comparability of results of operations with prior periods and show the effects of significant gains and charges in the periods presented without the impact of items or events that may obscure trends in the Company’s underlying performance. Please see “Reconciliation of Non - GAAP Disclosures” at the end of this presentation for a reconciliation to the nearest GAAP financial measure. No Offer or Solicitation This presentation does not constitute an offer to sell or a solicitation of an offer to buy any securities. No offer of securities shall be made except by means of a prospectus meeting the requirements of the Securities Act of 1933, as amended, and no offer to sell or solicitation of an offer to buy shall be made in any jurisdiction in which such offer, solicitation or sale would be unlawful. About Atlantic Union Bankshares Corporation Headquartered in Richmond, Virginia, Atlantic Union Bankshares Corporation (Nasdaq: AUB) is the holding company for Atlantic Union Bank. Atlantic Union Bank has 114 branches and approximately 130 ATMs located throughout Virginia, and in portions of Maryland and North Carolina. Certain non - bank financial services affiliates of Atlantic Union Bank include: Atlantic Union Equipment Finance, Inc., which provides equipment financing; Dixon, Hubard , Feinour & Brown, Inc., which provides investment advisory services; Atlantic Union Financial Consultants, LLC, which provides brokerage services; and Union Insurance Group, LLC, which offers various lines of insurance products. |
| 4 CEO Update John Asbury |

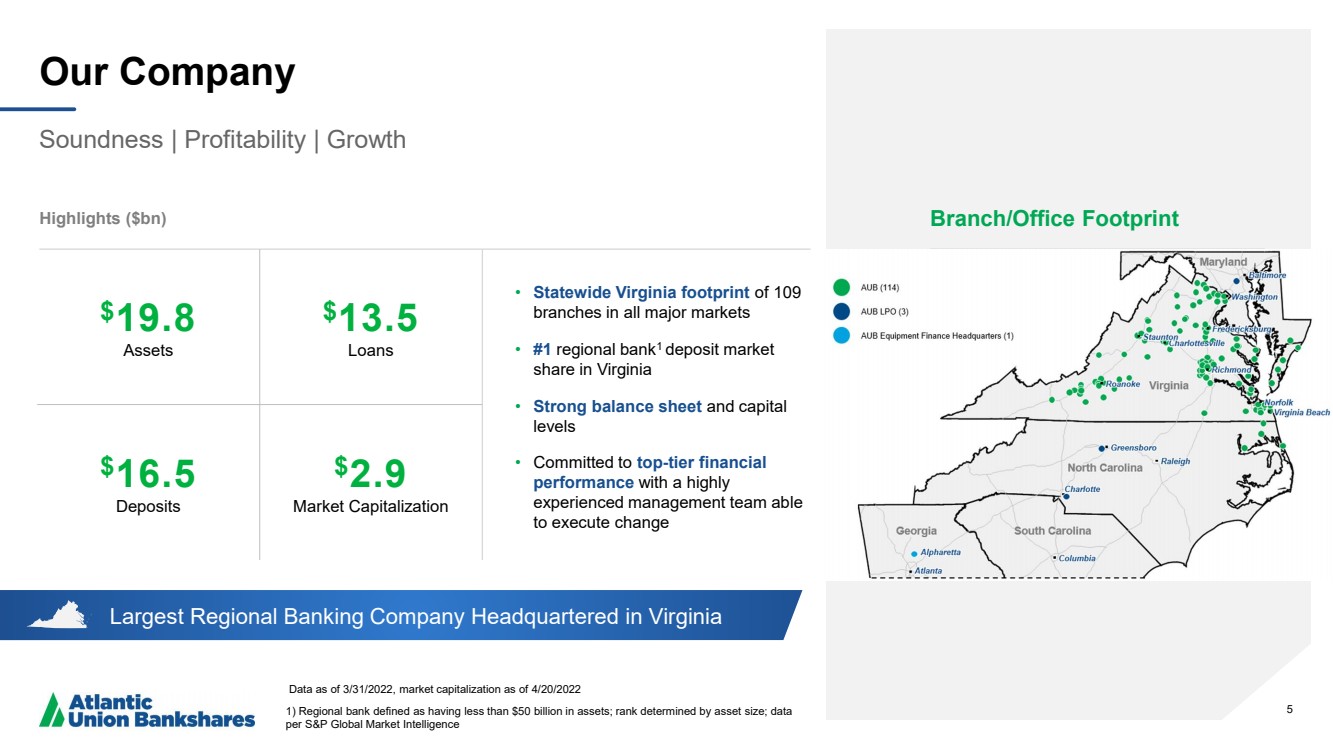
| 5 Largest Regional Banking Company Headquartered in Virginia Our Company Soundness | Profitability | Growth Data as of 3/31/2022, market capitalization as of 4/20/2022 1) Regional bank defined as having less than $50 billion in assets; rank determined by asset size; data per S&P Global Market Intelligence Highlights ($bn) Branch/Office Footprint • Statewide Virginia footprint of 109 branches in all major markets • #1 regional bank 1 deposit market share in Virginia • Strong balance sheet and capital levels • Committed to top - tier financial performance with a highly experienced management team able to execute change 5 $ 19 ..8 Assets $ 13.5 Loans $ 16.5 Deposits $ 2 ..9 Market Capitalization |
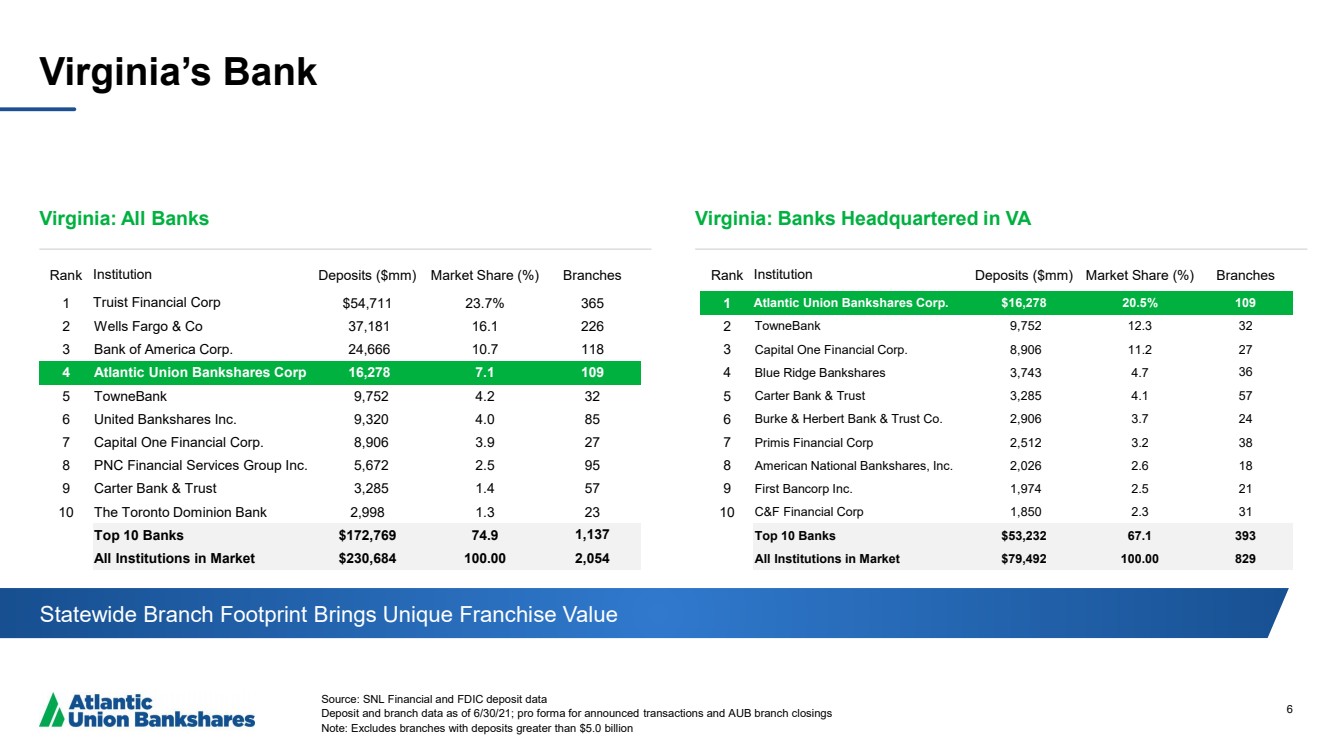
| 6 Virginia’s Bank Source: SNL Financial and FDIC deposit data Deposit and branch data as of 6/30/21; pro forma for announced transactions and AUB branch closings Note: Excludes branches with deposits greater than $5.0 billion Virginia: All Banks Virginia: Banks Headquartered in VA Statewide Branch Footprint Brings Unique Franchise Value Rank Institution Deposits ($mm) Market Share (%) Branches 1 Truist Financial Corp $54,711 23.7% 365 2 Wells Fargo & Co 37,181 16.1 226 3 Bank of America Corp. 24,666 10.7 118 4 Atlantic Union Bankshares Corp 16,278 7.1 109 5 TowneBank 9,752 4.2 32 6 United Bankshares Inc. 9,320 4.0 85 7 Capital One Financial Corp. 8,906 3.9 27 8 PNC Financial Services Group Inc. 5,672 2.5 95 9 Carter Bank & Trust 3,285 1.4 57 10 The Toronto Dominion Bank 2,998 1.3 23 Top 10 Banks $ 172,769 74.9 1,137 All Institutions in Market $230,684 100.00 2,054 Rank Institution Deposits ($mm) Market Share (%) Branches 1 Atlantic Union Bankshares Corp. $16,278 20.5% 109 2 TowneBank 9,752 12.3 32 3 Capital One Financial Corp. 8,906 11.2 27 4 Blue Ridge Bankshares 3,743 4.7 36 5 Carter Bank & Trust 3,285 4.1 57 6 Burke & Herbert Bank & Trust Co. 2,906 3.7 24 7 Primis Financial Corp 2,512 3.2 38 8 American National Bankshares, Inc. 2,026 2.6 18 9 First Bancorp Inc. 1,974 2.5 21 10 C&F Financial Corp 1,850 2.3 31 Top 10 Banks $53,232 67.1 393 All Institutions in Market $79,492 100.00 829 |
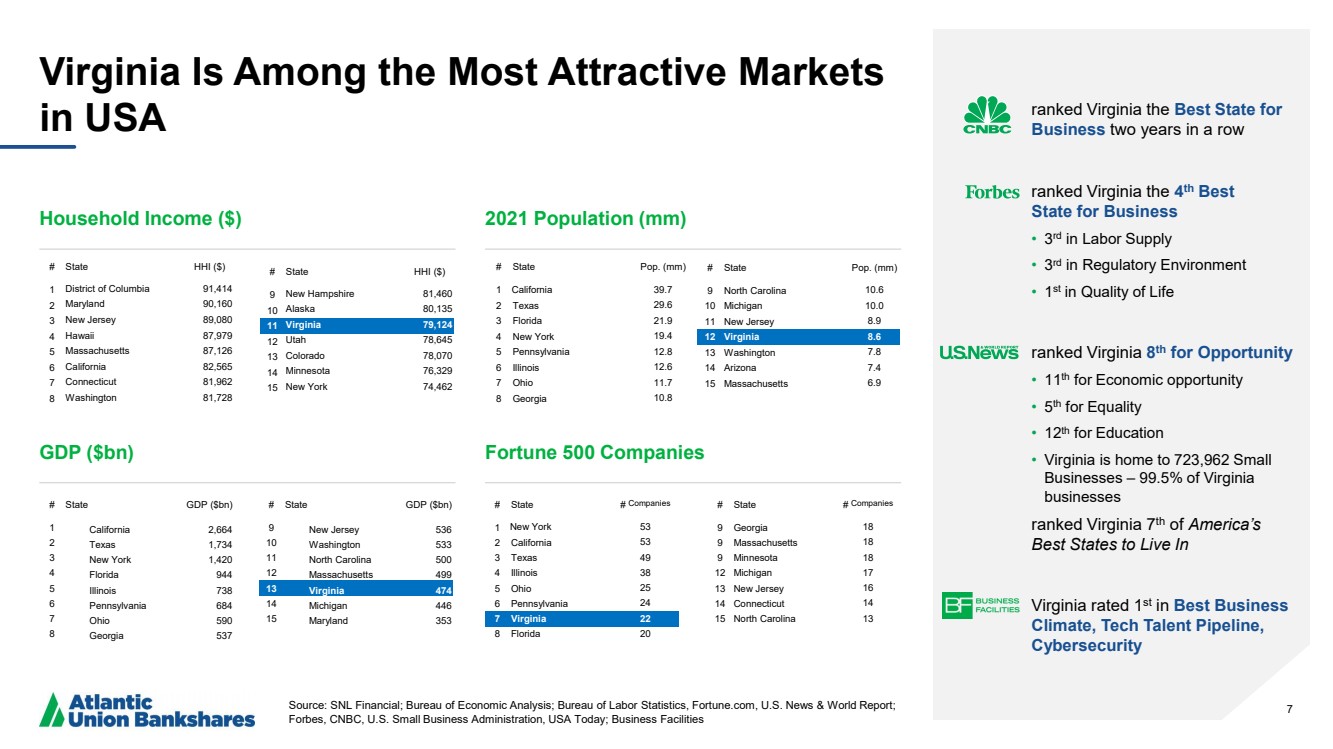
| 7 Virginia Is Among the Most Attractive Markets in USA Source: SNL Financial; Bureau of Economic Analysis; Bureau of Labor Statistics, Fortune.com , U.S. News & World Report; Forbes, CNBC, U.S. Small Business Administration, USA Today; Business Facilities 7 ranked Virginia the Best State for Business two years in a row ranked Virginia the 4 th Best State for Business • 3 rd in Labor Supply • 3 rd in Regulatory Environment • 1 st in Quality of Life ranked Virginia 8 th for Opportunity • 11 th for Economic opportunity • 5 th for Equality • 12 th for Education • Virginia is home to 723,962 Small Businesses – 99.5% of Virginia businesses ranked Virginia 7 th of America’s Best States to Live In Virginia rated 1 st in Best Business Climate, Tech Talent Pipeline, Cybersecurity # State # Companies 1 New York 53 2 California 53 3 Texas 49 4 Illinois 38 5 Ohio 25 6 Pennsylvania 24 7 Virginia 22 8 Florida 20 # State Pop. (mm) 1 California 39.7 2 Texas 29.6 3 Florida 21.9 4 New York 19.4 5 Pennsylvania 12.8 6 Illinois 12.6 7 Ohio 11.7 8 Georgia 10.8 # State HHI ($) 1 District of Columbia 91,414 2 Maryland 90,160 3 New Jersey 89,080 4 Hawaii 87,979 5 Massachusetts 87,126 6 California 82,565 7 Connecticut 81,962 8 Washington 81,728 # State GDP ($bn) 1 California 2,664 2 Texas 1,734 3 New York 1,420 4 Florida 944 5 Illinois 738 6 Pennsylvania 684 7 Ohio 590 8 Georgia 537 Household Income ($) 2021 Population (mm) # State Pop. (mm) 9 North Carolina 10.6 10 Michigan 10.0 11 New Jersey 8.9 12 Virginia 8.6 13 Washington 7.8 14 Arizona 7.4 15 Massachusetts 6.9 # State HHI ($) 9 New Hampshire 81,460 10 Alaska 80,135 11 Virginia 79,124 12 Utah 78,645 13 Colorado 78,070 14 Minnesota 76,329 15 New York 74,462 GDP ($bn) Fortune 500 Companies # State # Companies 9 Georgia 18 9 Massachusetts 18 9 Minnesota 18 12 Michigan 17 13 New Jersey 16 14 Connecticut 14 15 North Carolina 13 # State GDP ($bn) 9 New Jersey 536 10 Washington 533 11 North Carolina 500 12 Massachusetts 499 13 Virginia 474 14 Michigan 446 15 Maryland 353 |
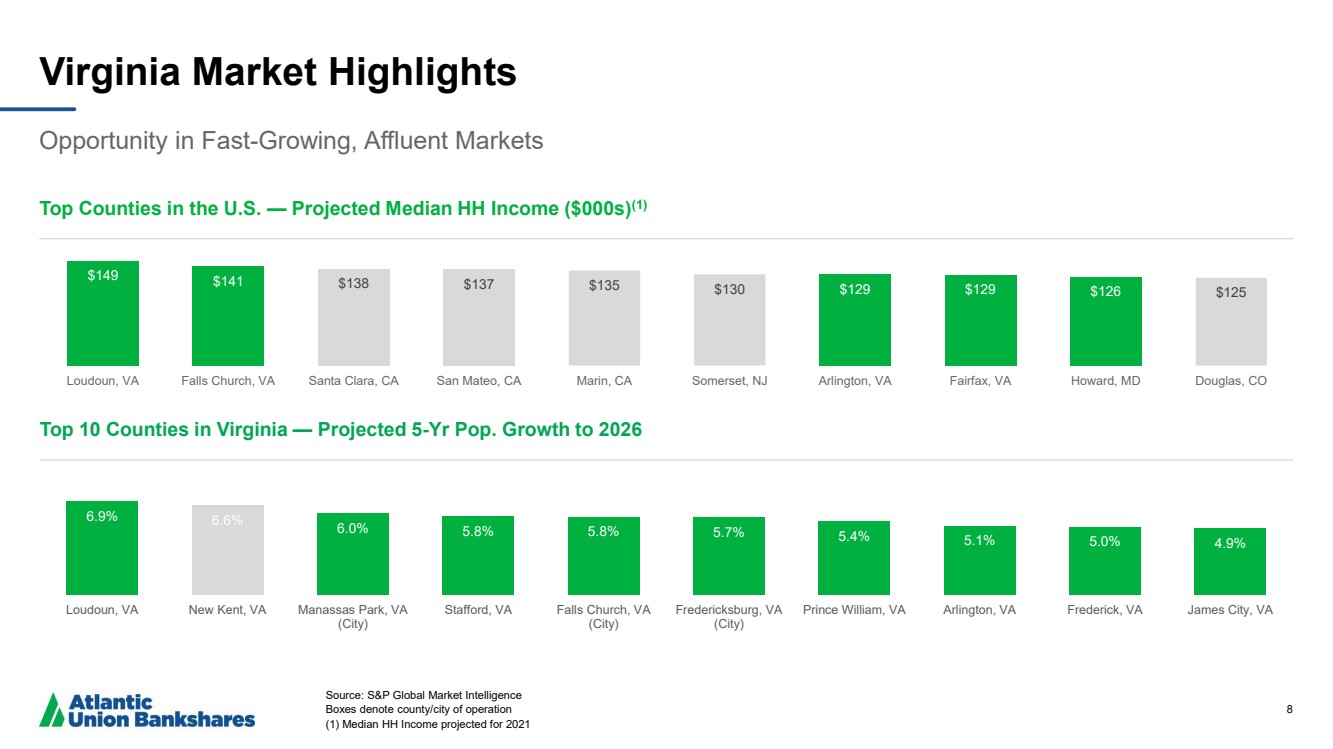
| 8 Virginia Market Highlights Opportunity in Fast - Growing, Affluent Markets Source: S&P Global Market Intelligence Boxes denote county/city of operation (1) Median HH Income projected for 2021 Top Counties in the U.S. — Projected Median HH Income ($000s) (1) Top 10 Counties in Virginia — Projected 5 - Yr Pop. Growth to 2026 $149 $141 $138 $137 $135 $130 $ 129 $129 $126 $125 Loudoun, VA Falls Church, VA Santa Clara, CA San Mateo, CA Marin, CA Somerset, NJ Arlington, VA Fairfax, VA Howard, MD Douglas, CO 6.9% 6.6% 6.0% 5.8% 5.8% 5.7% 5.4% 5.1% 5.0% 4.9% Loudoun, VA New Kent, VA Manassas Park, VA (City) Stafford, VA Falls Church, VA (City) Fredericksburg, VA (City) Prince William, VA Arlington, VA Frederick, VA James City, VA |
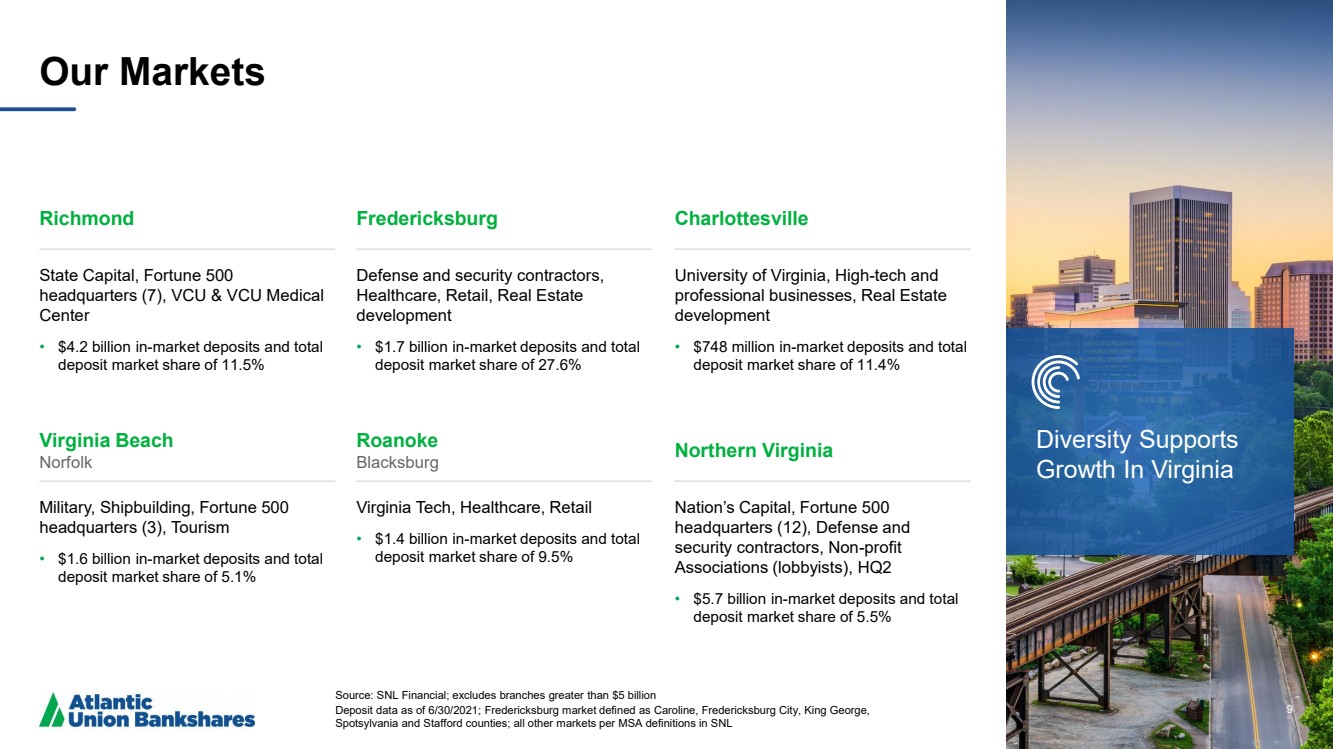
| 9 Our Markets Source: SNL Financial; excludes branches greater than $5 billion Deposit data as of 6/30/2021; Fredericksburg market defined as Caroline, Fredericksburg City, King George, Spotsylvania and Stafford counties; all other markets per MSA definitions in SNL 9 Richmond State Capital, Fortune 500 headquarters (7), VCU & VCU Medical Center • $4.2 billion in - market deposits and total deposit market share of 11.5% Fredericksburg Defense and security contractors, Healthcare, Retail, Real Estate development • $1.7 billion in - market deposits and total deposit market share of 27.6% Charlottesville University of Virginia, High - tech and professional businesses, Real Estate development • $748 million in - market deposits and total deposit market share of 11.4% Virginia Beach Norfolk Military, Shipbuilding, Fortune 500 headquarters (3), Tourism • $1.6 billion in - market deposits and total deposit market share of 5.1% Roanoke Blacksburg Virginia Tech, Healthcare, Retail • $1.4 billion in - market deposits and total deposit market share of 9.5% Northern Virginia Nation’s Capital, Fortune 500 headquarters (12), Defense and security contractors, Non - profit Associations (lobbyists), HQ2 • $5.7 billion in - market deposits and total deposit market share of 5.5% Diversity Supports Growth In Virginia |
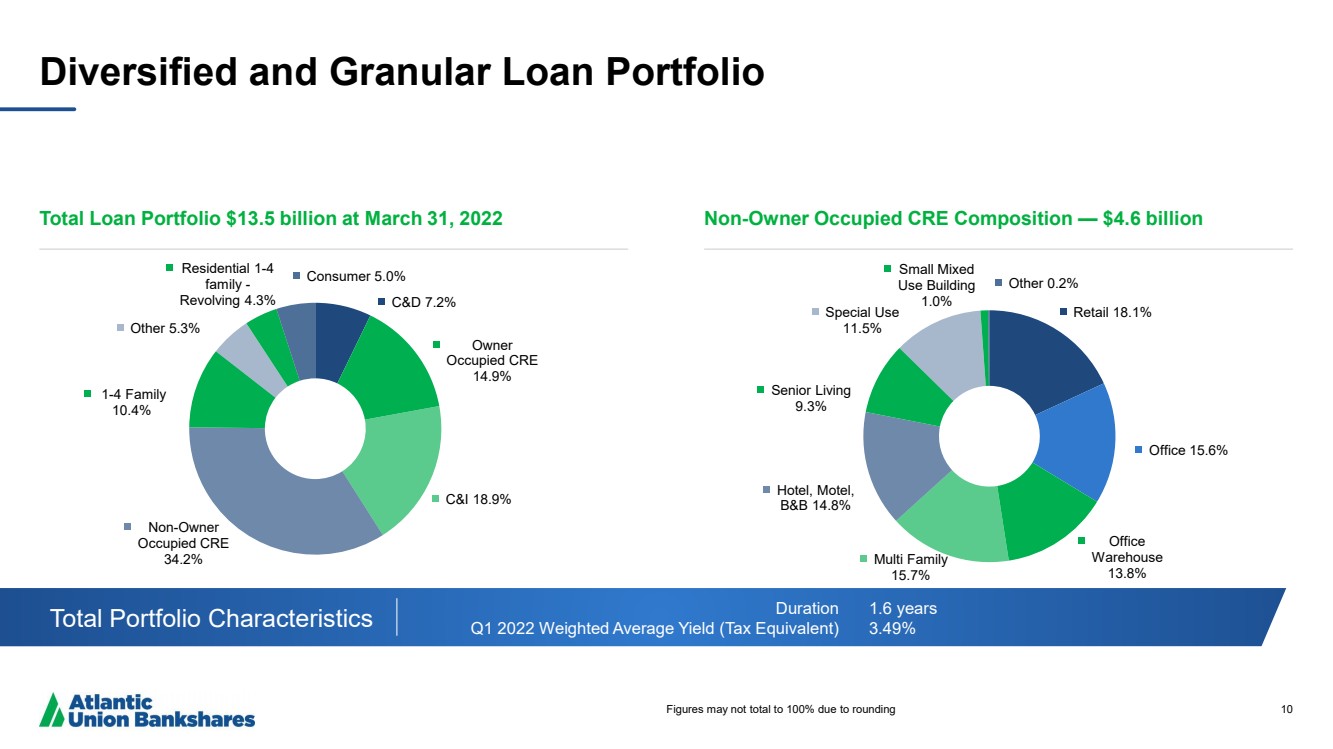
| 10 Diversified and Granular Loan Portfolio Total Loan Portfolio $ 13.5 billion at March 31, 2022 Non - Owner Occupied CRE Composition — $ 4.6 billion Total Portfolio Characteristics Duration Q1 2022 Weighted Average Yield (Tax Equivalent) 1.6 years 3.49% Figures may not total to 100% due to rounding C&D 7.2% Owner Occupied CRE 14.9% C&I 18.9% Non - Owner Occupied CRE 34.2% 1 - 4 Family 10.4% Other 5.3% Residential 1 - 4 family - Revolving 4.3% Consumer 5.0% Retail 18.1% Office 15.6% Office Warehouse 13.8% Multi Family 15.7% Hotel, Motel, B&B 14.8% Senior Living 9.3% Special Use 11.5% Small Mixed Use Building 1.0% Other 0.2% |
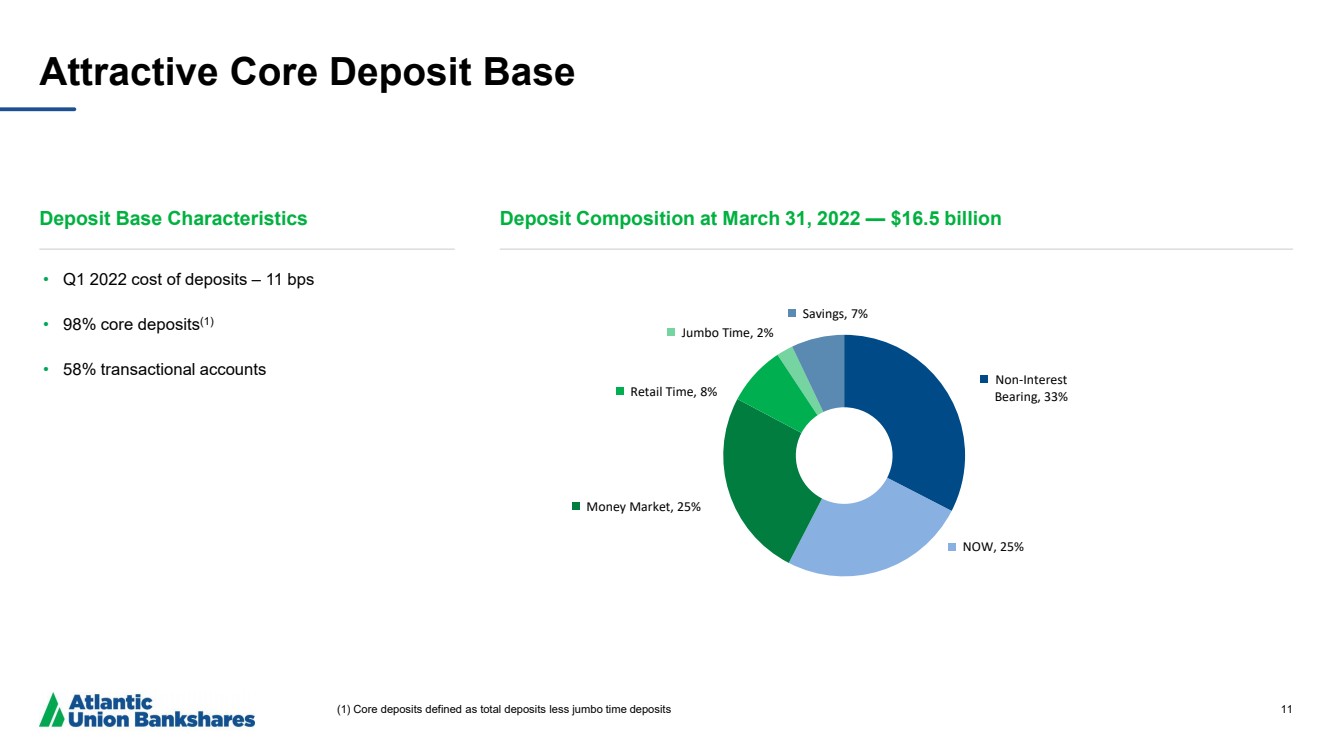
| 11 Attractive Core Deposit Base Deposit Base Characteristics Deposit Composition at March 31, 2022 — $ 16.5 billion (1) Core deposits defined as total deposits less jumbo time deposits • Q1 2022 cost of deposits – 11 bps • 98% core deposits (1) • 58% transactional accounts Non - Interest Bearing , 33% NOW , 25% Money Market , 25% Retail Time , 8% Jumbo Time , 2% Savings , 7% |
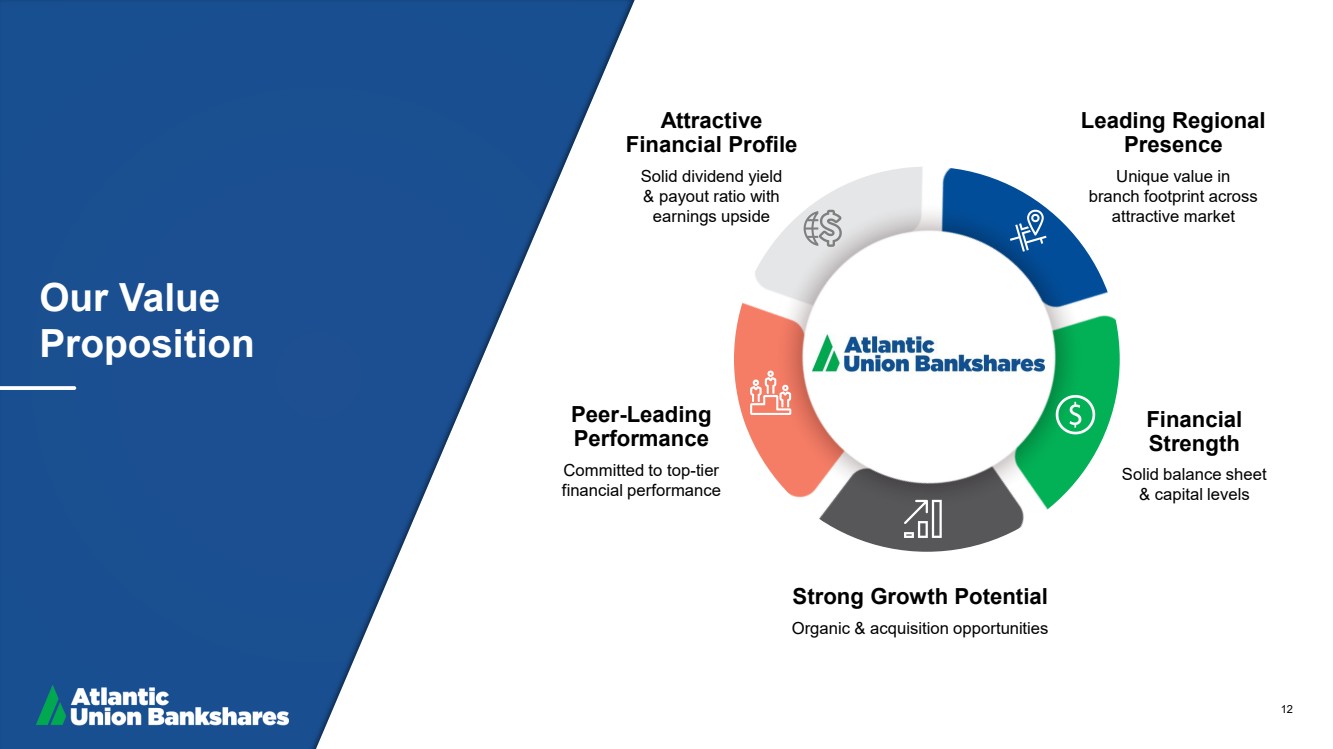
| 12 Our Value Proposition Strong Growth Potential Organic & acquisition opportunities Financial Strength Solid balance sheet & capital levels Leading Regional Presence Unique value in branch footprint across attractive market Attractive Financial Profile Solid dividend yield & payout ratio with earnings upside Peer - Leading Performance Committed to top - tier financial performance |
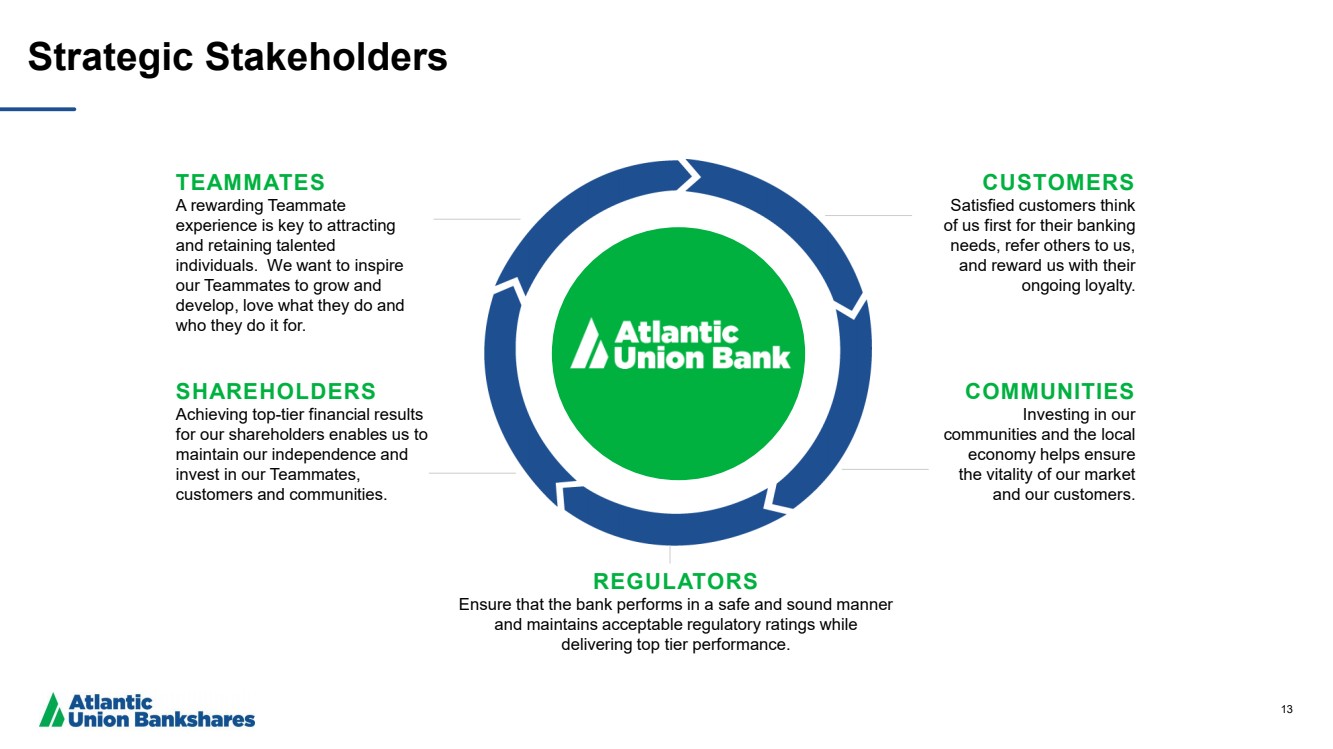
| 13 Strategic Stakeholders TEAMMATES A rewarding Teammate experience is key to attracting and retaining talented individuals. We want to inspire our Teammates to grow and develop, love what they do and who they do it for. COMMERCIAL RETAIL CUSTOMERS Satisfied customers think of us first for their banking needs, refer others to us, and reward us with their ongoing loyalty. COMMUNITIES Investing in our communities and the local economy helps ensure the vitality of our market and our customers. SHAREHOLDERS Achieving top - tier financial results for our shareholders enables us to maintain our independence and invest in our Teammates, customers and communities. REGULATORS Ensure that the bank performs in a safe and sound manner and maintains acceptable regulatory ratings while delivering top tier performance. |
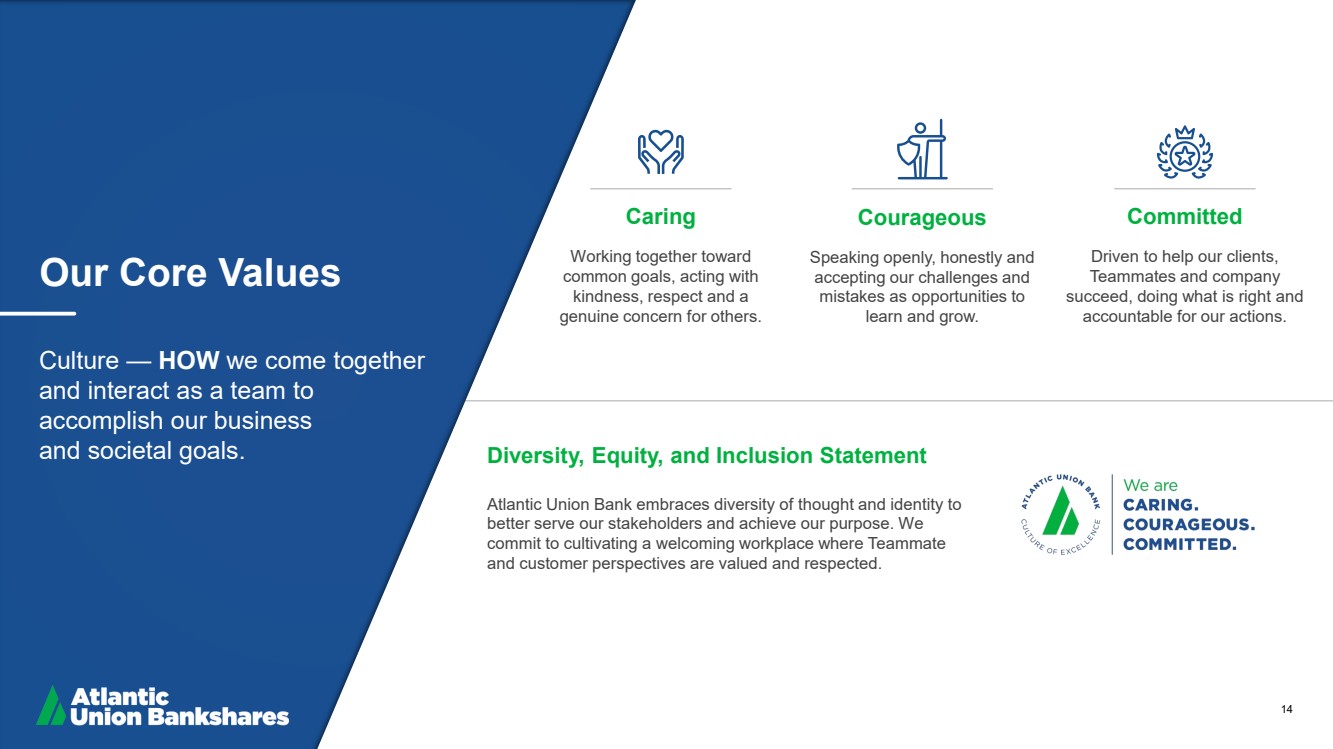
| 14 Caring Working together toward common goals, acting with kindness, respect and a genuine concern for others. Courageous Speaking openly, honestly and accepting our challenges and mistakes as opportunities to learn and grow. Committed Driven to help our clients, Teammates and company succeed, doing what is right and accountable for our actions. Our Core Values Culture — HOW we come together and interact as a team to accomplish our business and societal goals. Diversity, Equity, and Inclusion Statement Atlantic Union Bank embraces diversity of thought and identity to better serve our stakeholders and achieve our purpose. We commit to cultivating a welcoming workplace where Teammate and customer perspectives are valued and respected. |
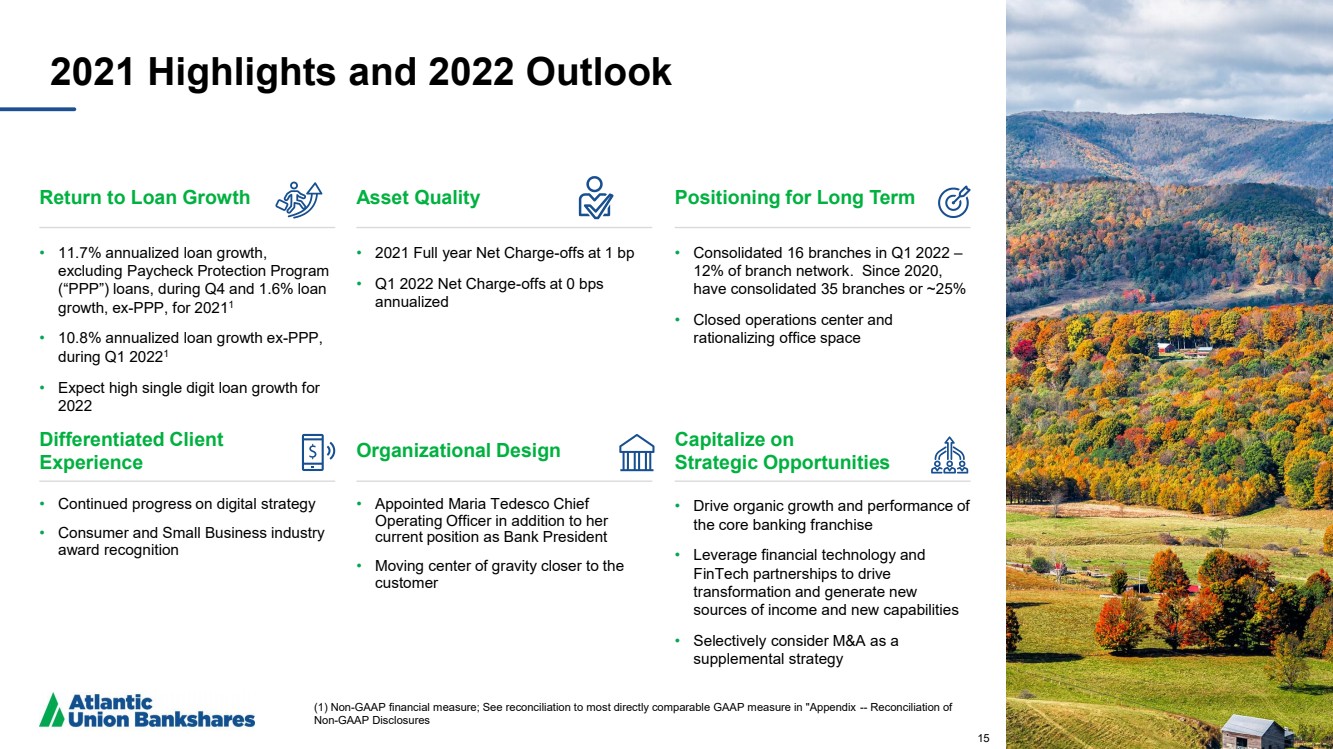
| 15 2021 Highlights and 2022 Outlook Return to Loan Growth • 11.7% annualized loan growth, excluding Paycheck Protection Program (“PPP”) loans, during Q4 and 1.6% loan growth, ex - PPP, for 2021 1 • 10.8% annualized loan growth ex - PPP, during Q1 2022 1 • Expect high single digit loan growth for 2022 Asset Quality • 2021 Full year Net Charge - offs at 1 bp • Q1 2022 Net Charge - offs at 0 bps annualized Positioning for Long Term • Consolidated 16 branches in Q1 2022 – 12% of branch network. Since 2020, have consolidated 35 branches or ~25% • Closed operations center and rationalizing office space Differentiated Client Experience • Continued progress on digital strategy • Consumer and Small Business industry award recognition Organizational Design • Appointed Maria Tedesco Chief Operating Officer in addition to her current position as Bank President • Moving center of gravity closer to the customer Capitalize on Strategic Opportunities • Drive organic growth and performance of the core banking franchise • Leverage financial technology and FinTech partnerships to drive transformation and generate new sources of income and new capabilities • Selectively consider M&A as a supplemental strategy 15 (1) Non - GAAP financial measure; See reconciliation to most directly comparable GAAP measure in "Appendix -- Reconciliation of Non - GAAP Disclosures |
| 16 Operating Group President and COO Maria Tedesco |

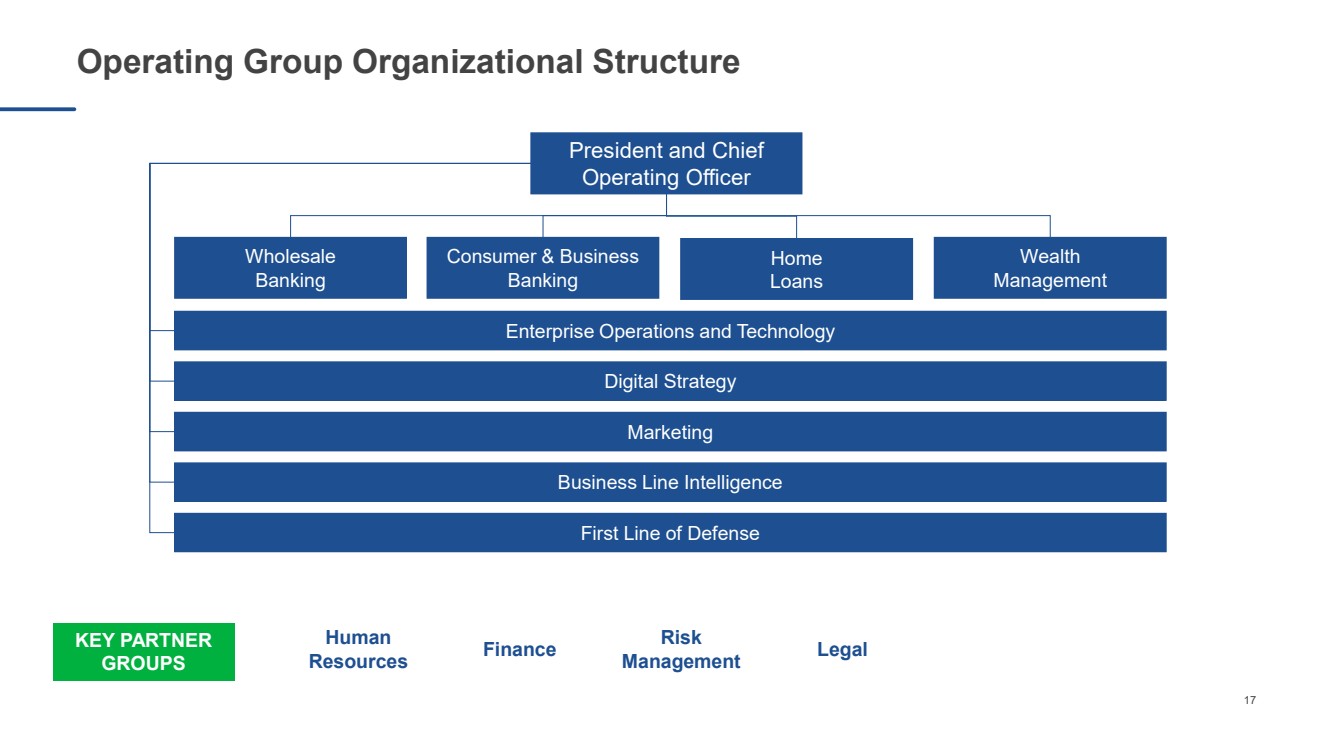
| 17 Operating Group Organizational Structure President and Chief Operating Officer Wholesale Banking Consumer & Business Banking Home Loans Wealth Management Digital Strategy Marketing Business Line Intelligence Enterprise Operations and Technology First Line of Defense KEY PARTNER GROUPS Human Resources Finance Risk Management Legal |
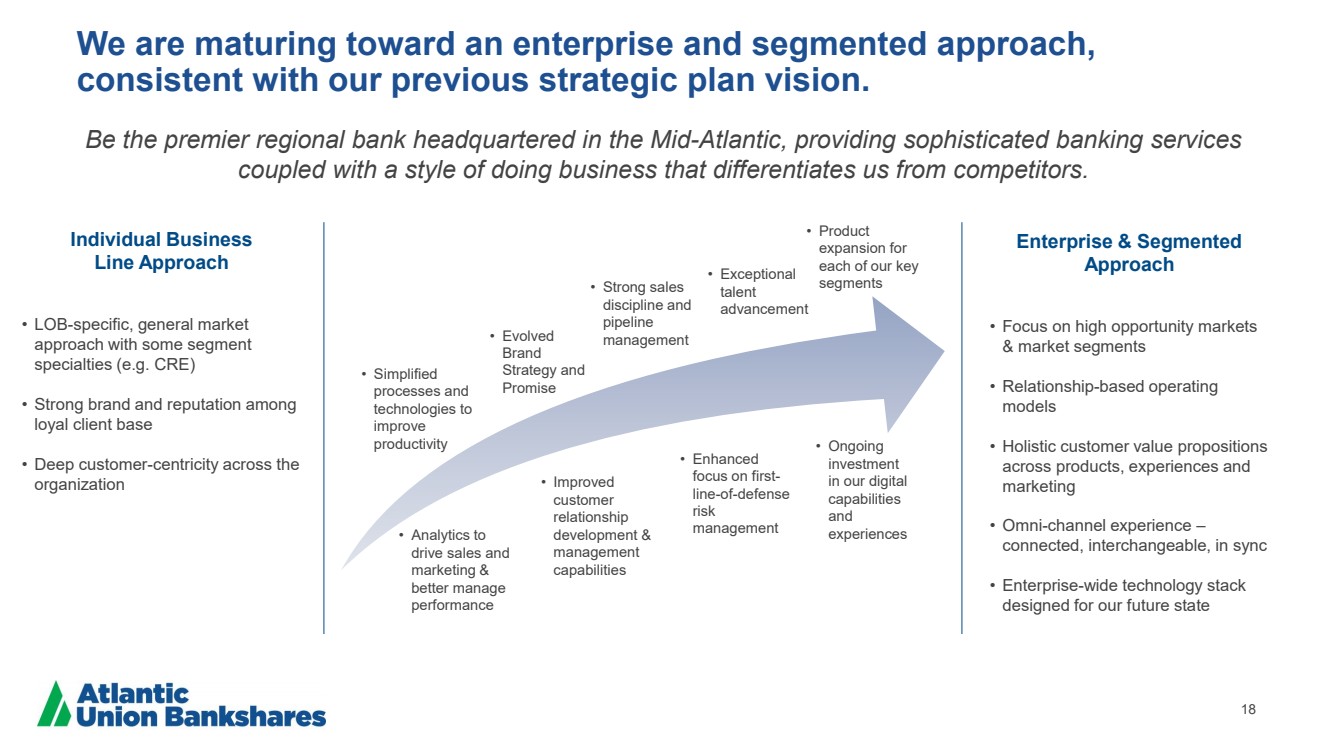
| 18 We are maturing toward an enterprise and segmented approach, consistent with our previous strategic plan vision. Be the premier regional bank headquartered in the Mid - Atlantic, providing sophisticated banking services coupled with a style of doing business that differentiates us from competitors. • Simplified processes and technologies to improve productivity • Analytics to drive sales and marketing & better manage performance • Evolved Brand Strategy and Promise • Improved customer relationship development & management capabilities • Product expansion for each of our key segments Enterprise & Segmented Approach • Focus on high opportunity markets & market segments • Relationship - based operating models • Holistic customer value propositions across products, experiences and marketing • Omni - channel experience – connected, interchangeable, in sync • Enterprise - wide technology stack designed for our future state • Ongoing investment in our digital capabilities and experiences Individual Business Line Approach • LOB - specific, general market approach with some segment specialties (e.g. CRE) • Strong brand and reputation among loyal client base • Deep customer - centricity across the organization • Enhanced focus on first - line - of - defense risk management • Strong sales discipline and pipeline management • Exceptional talent advancement |
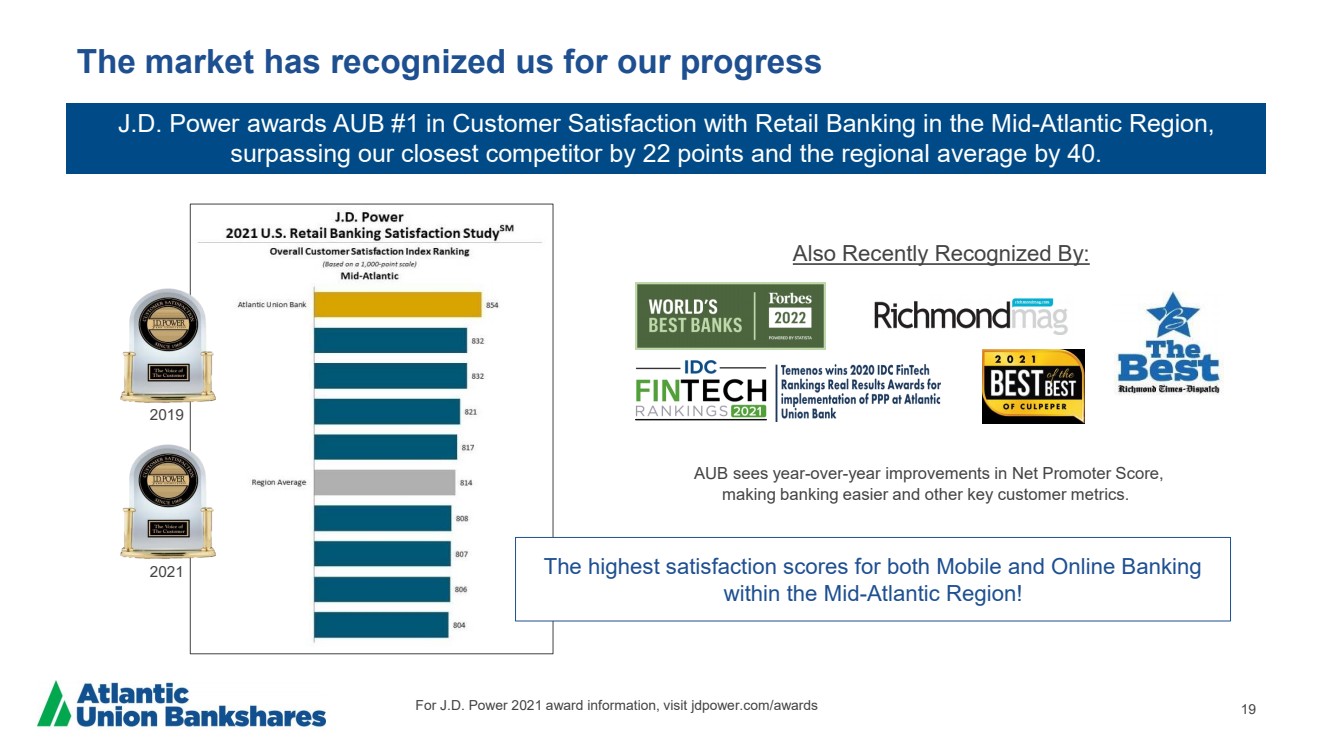
| 19 The market has recognized us for our progress J.D. Power awards AUB #1 in Customer Satisfaction with Retail Banking in the Mid - Atlantic Region, surpassing our closest competitor by 22 points and the regional average by 40. AUB sees year - over - year improvements in Net Promoter Score, making banking easier and other key customer metrics. Also Recently Recognized By: For J.D. Power 2021 award information, visit jdpower.com/awards 2019 2021 The highest satisfaction scores for both Mobile and Online Banking within the Mid - Atlantic Region! |
| 20 Excellence in Business Banking 2020 & 2021 Greenwich Excellence Award Winner In Greenwich’s annual study, AUB leads each of the big banks among small businesses in the South Region with $1 - $10mm in revenue. Successful launch of PPP and support of the small business community during the pandemic likely contributed to this accolade .. 95 74 70 69 0 10 20 30 40 50 60 70 80 90 100 Overall Satisfaction AUB Big Bank #1 Big Bank #2 Big Bank #3 First Draw PPP Lending Position : • #1 in 22 VA counties • #2 in 13 VA counties • #3 in 15 VA counties • Across Virginia, AUB effectively tied Truist in total PPP loans, yet we represent approximately 30% of their size in market share. PPP1 : 11,300 loans for $1.76b PPP2 : 5,700 loans for $555m Total : 17,000 loans for $ 2.3b Virginia PPP Clients Disproportionately Chose Atlantic Union Bank Source: SBA, PPP first draw data, as of 6/30/20. The SBA did not provide this detail for subsequent rounds. Source: Greenwich Annual Survey, 2020 (2021 data not yet released) |

| 21 • The right business leaders in place, as we build the business with more great talent every day. The partnership between our leaders is strong and will lead to synergies that will propel us. • A reputation that resonates with consumers and businesses alike. High brand consideration and great satisfaction scores are the foundation for our expansion to new segments and new product categories. • Our widest - ever selection of product and service offerings, enabling us to surround our best clients with strong consumer products, a home loan, a wealth relationship, and most anything they’d need for their business. • An emerging technology roadmap that will shore - up our foundational infrastructure, increase the velocity of our innovation, and enable better experiences for our customers and Teammates. • A culture of excellence – Courageous enough to do what must be done to succeed, Caring for each other and our customers, with a desire to do good things in our community, and Committed to being the best possible bank we can, remaining at the top of our game and delivering our top - tier financial performance. Looking ahead, we’re optimistic of our future |
| 22 CFO Update Rob Gorman |

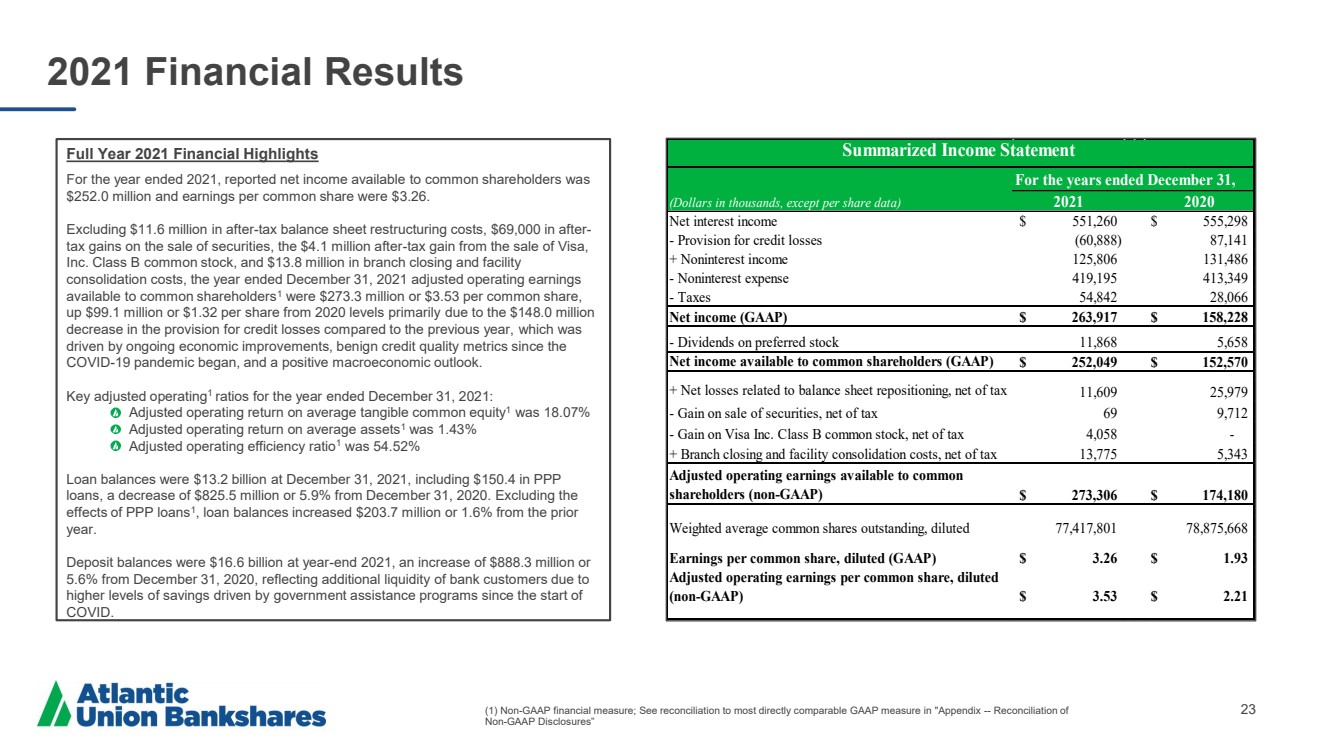
| 23 2021 Financial Results Full Year 2021 Financial Highlights For the year ended 2021, reported net income available to common shareholders was $252.0 million and earnings per common share were $ 3.26. Excluding $11.6 million in after - tax balance sheet restructuring costs, $69,000 in after - tax gains on the sale of securities, the $4.1 million after - tax gain from the sale of Visa, Inc. Class B common stock, and $13.8 million in branch closing and facility consolidation costs, the year ended December 31, 2021 adjusted operating earnings available to common shareholders 1 were $273.3 million or $3.53 per common share, up $99.1 million or $1.32 per share from 2020 levels primarily due to the $148.0 million decrease in the provision for credit losses compared to the previous year, which was driven by ongoing economic improvements, benign credit quality metrics since the COVID - 19 pandemic began, and a positive macroeconomic outlook. Key adjusted operating 1 ratios for the year ended December 31, 2021: Adjusted operating return on average tangible common equity 1 was 18.07% Adjusted operating return on average assets 1 was 1.43% Adjusted operating efficiency ratio 1 was 54.52% Loan balances were $13.2 billion at December 31, 2021, including $150.4 in PPP loans, a decrease of $825.5 million or 5.9% from December 31, 2020. Excluding the effects of PPP loans 1 , loan balances increased $203.7 million or 1.6% from the prior year. Deposit balances were $16.6 billion at year - end 2021, an increase of $888.3 million or 5.6% from December 31, 2020, reflecting additional liquidity of bank customers due to higher levels of savings driven by government assistance programs since the start of COVID. (1) Non - GAAP financial measure; See reconciliation to most directly comparable GAAP measure in "Appendix -- Reconciliation of Non - GAAP Disclosures” For the years ended December 31, (Dollars in thousands, except per share data) 2021 2020 Net interest income 551,260 $ 555,298 $ - Provision for credit losses (60,888) 87,141 + Noninterest income 125,806 131,486 - Noninterest expense 419,195 413,349 - Taxes 54,842 28,066 Net income (GAAP) 263,917 $ 158,228 $ - Dividends on preferred stock 11,868 5,658 Net income available to common shareholders (GAAP) 252,049 $ 152,570 $ + Net losses related to balance sheet repositioning, net of tax 11,609 25,979 - Gain on sale of securities, net of tax 69 9,712 - Gain on Visa Inc. Class B common stock, net of tax 4,058 - + Branch closing and facility consolidation costs, net of tax 13,775 5,343 Adjusted operating earnings available to common shareholders (non-GAAP) 273,306 $ 174,180 $ Weighted average common shares outstanding, diluted 77,417,801 78,875,668 Earnings per common share, diluted (GAAP) 3.26 $ 1.93 $ Adjusted operating earnings per common share, diluted (non-GAAP) 3.53 $ 2.21 $ Summarized Income Statement |
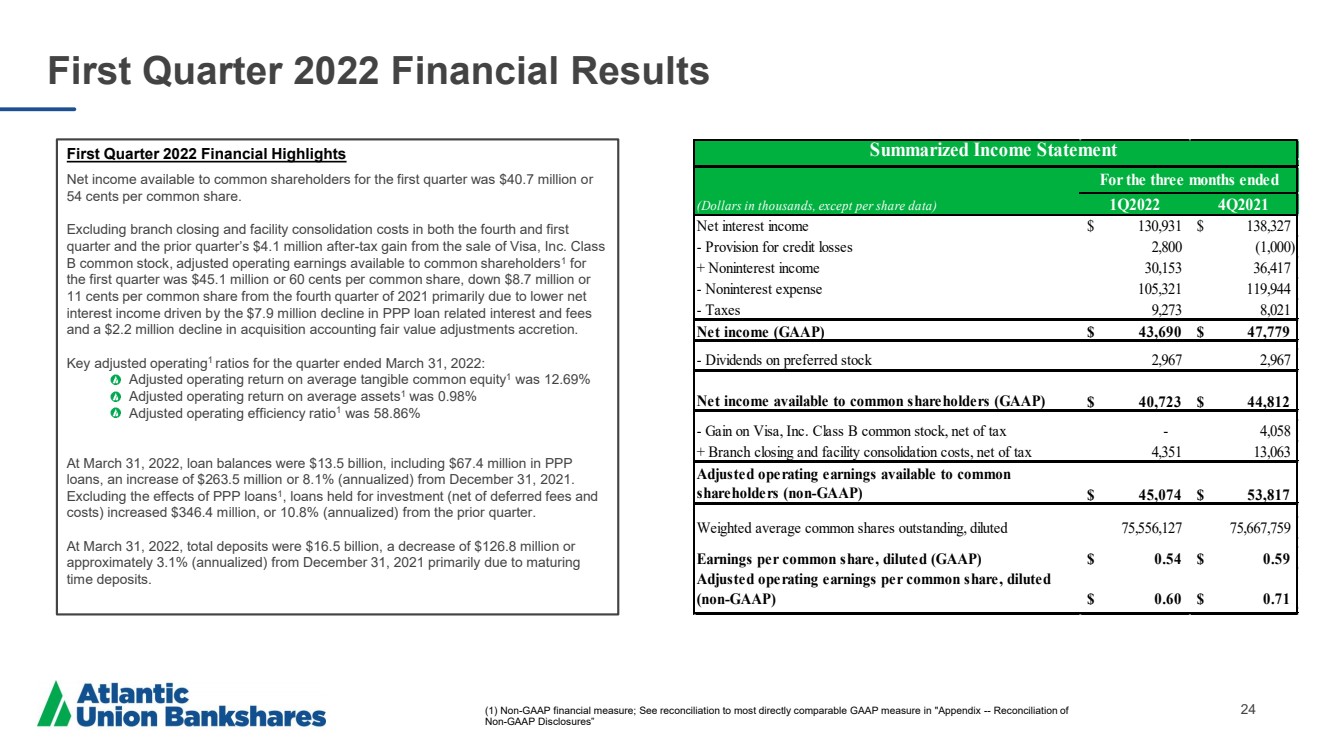
| 24 First Quarter 2022 Financial Highlights Net income available to common shareholders for the first quarter was $40.7 million or 54 cents per common share. Excluding branch closing and facility consolidation costs in both the fourth and first quarter and the prior quarter’s $4.1 million after - tax gain from the sale of Visa, Inc. Class B common stock, adjusted operating earnings available to common shareholders 1 for the first quarter was $45.1 million or 60 cents per common share, down $8.7 million or 11 cents per common share from the fourth quarter of 2021 primarily due to lower net interest income driven by the $7.9 million decline in PPP loan related interest and fees and a $2.2 million decline in acquisition accounting fair value adjustments accretion. Key adjusted operating 1 ratios for the quarter ended March 31 , 2022: Adjusted operating return on average tangible common equity 1 was 12.69% Adjusted operating return on average assets 1 was 0.98% Adjusted operating efficiency ratio 1 was 58.86% At March 31, 2022, loan balances were $13.5 billion, including $67.4 million in PPP loans, an increase of $263.5 million or 8.1% (annualized) from December 31, 2021. Excluding the effects of PPP loans 1 , loans held for investment (net of deferred fees and costs) increased $346.4 million, or 10.8% (annualized) from the prior quarter. At March 31, 2022, total deposits were $16.5 billion, a decrease of $126.8 million or approximately 3.1% (annualized) from December 31, 2021 primarily due to maturing time deposits. First Quarter 2022 Financial Results (1) Non - GAAP financial measure; See reconciliation to most directly comparable GAAP measure in "Appendix -- Reconciliation of Non - GAAP Disclosures” (Dollars in thousands, except per share data) 1Q2022 4Q2021 Net interest income 130,931 $ 138,327 $ - Provision for credit losses 2,800 (1,000) + Noninterest income 30,153 36,417 - Noninterest expense 105,321 119,944 - Taxes 9,273 8,021 Net income (GAAP) 43,690 $ 47,779 $ - Dividends on preferred stock 2,967 2,967 Net income available to common shareholders (GAAP) 40,723 $ 44,812 $ - Gain on Visa, Inc. Class B common stock, net of tax - 4,058 + Branch closing and facility consolidation costs, net of tax 4,351 13,063 Adjusted operating earnings available to common shareholders (non-GAAP) 45,074 $ 53,817 $ Weighted average common shares outstanding, diluted 75,556,127 75,667,759 Earnings per common share, diluted (GAAP) 0.54 $ 0.59 $ Adjusted operating earnings per common share, diluted (non-GAAP) 0.60 $ 0.71 $ For the three months ended Summarized Income Statement |
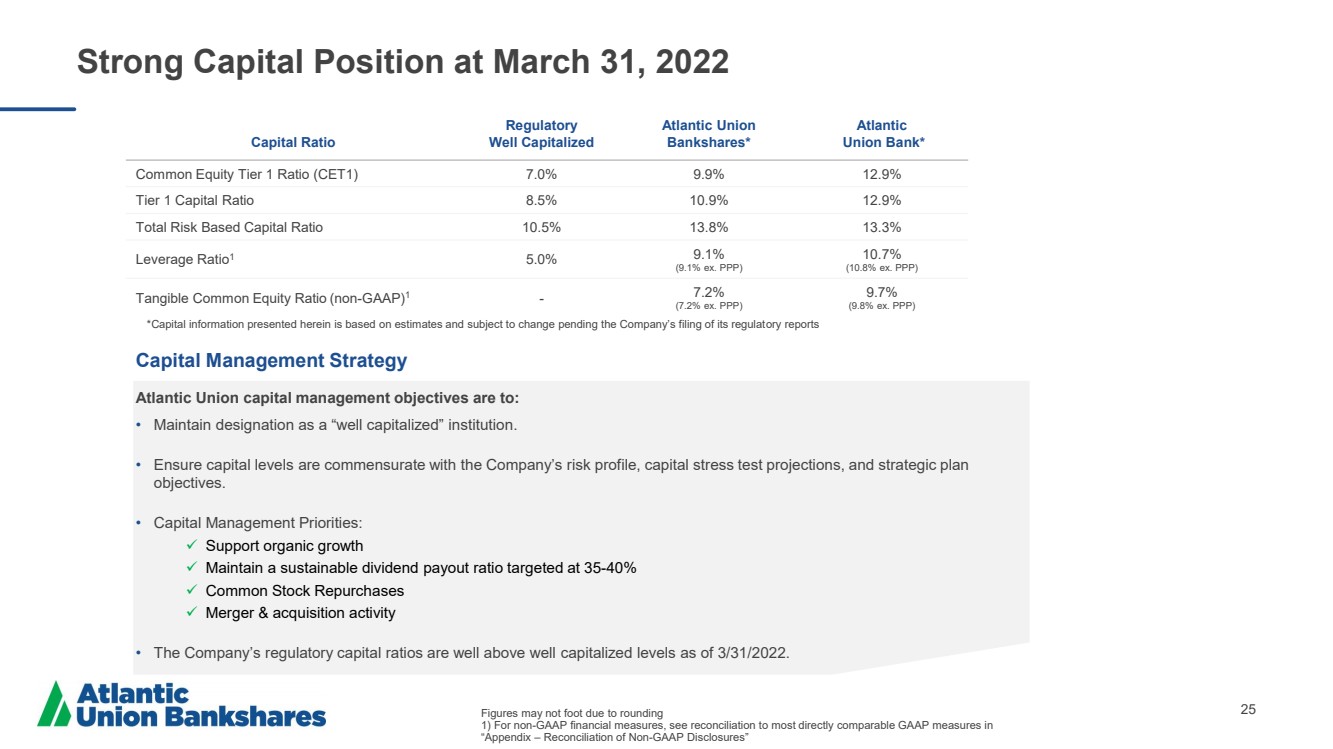
| 25 Strong Capital Position at March 31, 2022 Capital Ratio Regulatory Well Capitalized Atlantic Union Bankshares* Atlantic Union Bank* Common Equity Tier 1 Ratio (CET1) 7.0% 9.9% 12.9% Tier 1 Capital Ratio 8.5% 10.9% 12.9% Total Risk Based Capital Ratio 10.5% 13.8% 13.3% Leverage Ratio 1 5.0% 9.1% ( 9.1% ex. PPP) 10.7% ( 10.8% ex. PPP) Tangible Common Equity Ratio ( non - GAAP) 1 - 7 ..2 % (7.2% ex. PPP) 9.7% (9.8% ex. PPP) Figures may not foot due to rounding 1 ) For non - GAAP financial measures, see reconciliation to most directly comparable GAAP measures in “Appendix – Reconciliation of Non - GAAP Disclosures” Capital Management Strategy Atlantic Union capital management objectives are to: • Maintain designation as a “well capitalized” institution .. • Ensure capital levels are commensurate with the Company’s risk profile, capital stress test projections, and strategic plan objectives. • Capital Management Priorities: Support organic growth Maintain a sustainable dividend payout ratio targeted at 35 - 40% Common Stock Repurchases Merger & acquisition activity • The Company’s regulatory capital ratios are well above well capitalized levels as of 3/31/2022. *Capital information presented herein is based on estimates and subject to change pending the Company’s filing of its regulat or y reports |
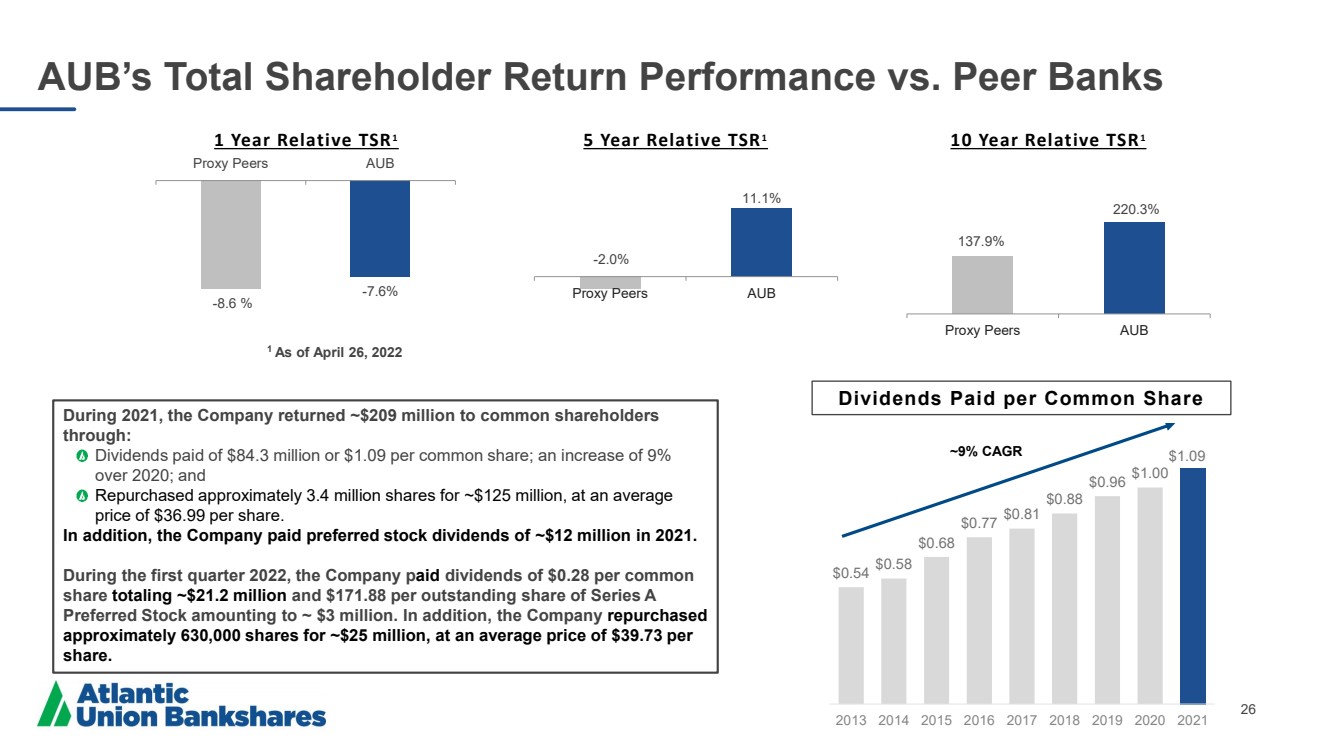
| 26 $0.54 $0.58 $0.68 $0.77 $0.81 $0.88 $0.96 $1.00 $1.09 2013 2014 2015 2016 2017 2018 2019 2020 2021 - 2.0% 11.1% Proxy Peers AUB 5 Year Relative TSR 1 1 As of April 26, 2022 1 Year Relative TSR 1 - 8.6 % - 7.6% Proxy Peers AUB 137.9% 220.3% Proxy Peers AUB 10 Year Relative TSR 1 Dividends Paid per Common Share ~ 9 % CAGR AUB’s Total Shareholder Return Performance vs. Peer Banks During 2021, the Company returned ~$209 million to common shareholders through: Dividends paid of $84.3 million or $ 1.09 per common share; an increase of 9% over 2020; and Repurchased approximately 3.4 million shares for ~$125 million, at an average price of $ 36.99 per share .. In addition, the Company paid preferred stock dividends of ~$12 million in 2021. During the first quarter 2022, the Company p aid dividends of $ 0.28 per common share totaling ~$ 21.2 million and $171.88 per outstanding share of Series A Preferred Stock amounting to ~ $3 million. In addition, the Company repurchased approximately 630,000 shares for ~$25 million, at an average price of $ 39.73 per share. |
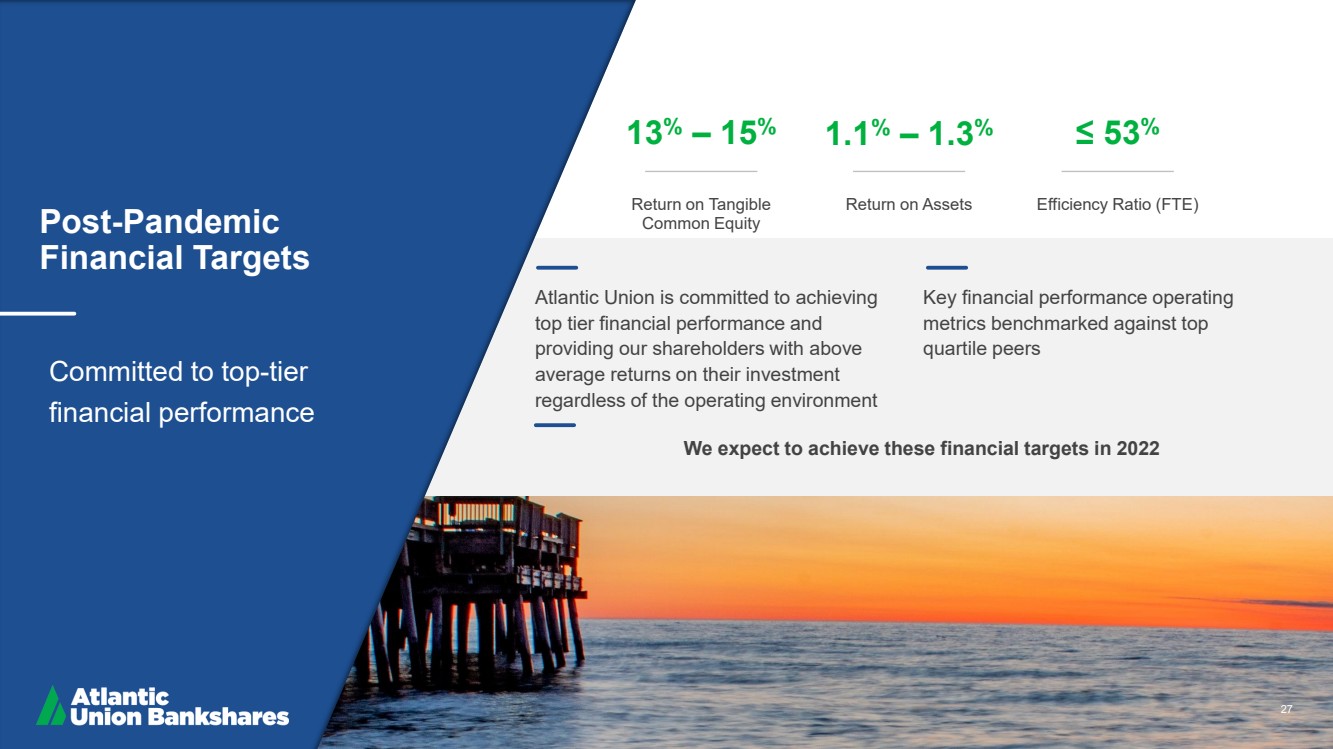
| Post - Pandemic Financial Targets Committed to top - tier financial performance 13 % – 15 % Return on Tangible Common Equity 1.1 % – 1.3 % Return on Assets ≤ 53 % Efficiency Ratio (FTE) Atlantic Union is committed to achieving top tier financial performance and providing our shareholders with above average returns on their investment regardless of the operating environment Key financial performance operating metrics benchmarked against top quartile peers 27 We expect to achieve these financial targets in 2022 |
| 28 Questions? |

| 29 Appendix |

| 30 Reconciliation of Non - GAAP Disclosures The Company has provided supplemental performance measures on a tax - equivalent, tangible, operating, adjusted, or pre - tax pre - pr ovision basis. These non - GAAP financial measures are a supplement to GAAP, which is used to prepare the Company’s financial statements, and sho uld not be considered in isolation or as a substitute for comparable measures calculated according with GAAP. In addition, the Company’s no n - GAAP financial measures may not be comparable to non - GAAP financial measures of other companies. The Company uses the non - GAAP financ ial measures discussed herein in its analysis of the Company’s performance. The Company’s management believes that these non - GAAP fi nancial measures provide additional understanding of ongoing operations, enhance comparability of results of operations with prior pe rio ds and show the effects of significant gains and charges in the periods presented without the impact of items or events that may obscure tren ds in the Company’s underlying performance. |
| 31 Reconciliation of Non - GAAP Disclosures Adjusted operating measures exclude merger and rebranding - related costs, nonrecurring tax expenses, the gains or losses related to balance sheet repositioning (principally composed of gains and losses on debt extinguishment), gains or losses on sale of securities, gains on the sale of Visa, Inc. Class B common stock, as well as branch closing and facility consolidation costs (principally composed of real estate, leases and other assets write downs, gains or losses on related real estate sales, as well as severance associated with branch closing and corporate expense reduction initiatives). The Company believes these non - GAAP adjusted measures provide investors with important information about the continuing economic results of the organization’s operations. Prior periods in this presentation have been adjusted for previously announced branch closing and corporate expense reduction initiatives. Tangible assets and tangible common equity are used in the calculation of certain profitability, capital, and per share ratios. The Company believes tangible common equity and the related ratios are meaningful measures of capital adequacy because they provide a meaningful base for period - to - period and company - to - company comparisons, which the Company believes will assist investors in assessing the capital of the Company and its ability to absorb potential losses. Additionally, the Company believes that return on tangible common equity (ROTCE) is a meaningful supplement to GAAP financial measures and useful to investors because it measures the performance of a business consistently across time without regard to whether components of the business were acquired or developed internally. For the three months ended (Dollars in thousands, except per share amounts) March 31, 2022 2021 2020 2019 2018 2017 Adjusted Operating Earnings Net Income (GAAP) 43,690 $ 263,917 $ 158,228 $ 193,528 $ 146,248 $ 72,923 $ Plus: Merger and rebranding-related costs, net of tax - - - 27,395 32,065 4,405 Plus: Nonrecurring tax expenses - - - - - 6,250 Plus: Net loss related to balance sheet repositioning, net of tax - 11,609 25,979 12,953 - - Less: Gain on sale of securities, net of tax - 69 9,712 6,063 303 520 Less: Gain on Visa, Inc. Class B common stock, net of tax - 4,058 - - - - Plus: Branch closing and facility consolidation costs, net of tax 4,351 13,775 5,343 - 849 - Adjusted operating earnings (non-GAAP) 48,041 $ 285,174 $ 179,838 $ 227,813 $ 178,859 $ 83,058 $ Less: Dividends on preferred stock 2,967 11,868 5,658 - - - Adjusted operating earnings available to common shareholders (non-GAAP) 45,074 $ 273,306 $ 174,180 $ 227,813 $ 178,859 $ 83,058 $ Earnings per share (EPS) Weighted average common shares outstanding, diluted 75,556,127 77,417,801 78,875,668 80,263,557 65,908,573 43,779,744 EPS available to common shareholders, diluted (GAAP) 0.54 $ 3.26 $ 1.93 $ 2.41 $ 2.22 $ 1.67 $ Adjusted operating EPS available to common shareholders, diluted (non-GAAP) 0.60 $ 3.53 $ 2.21 $ 2.84 $ 2.71 $ 1.90 $ Return on assets (ROA) Average assets 19,920,368 $ 19,977,551 $ 19,083,853 $ 16,840,310 $ 13,181,609 $ 8,820,142 $ ROA (GAAP) 0.89% 1.32% 0.83% 1.15% 1.11% 0.83% Adjusted operating ROA (non-GAAP) 0.98% 1.43% 0.94% 1.35% 1.36% 0.94% Return on equity (ROE) Adjusted operating earnings available to common shareholders (non-GAAP) 45,074 $ 273,306 $ 174,180 $ 227,813 $ 178,859 $ 83,058 $ Plus: Amortization of intangibles, tax effected 2,401 10,984 13,093 14,632 10,143 3,957 Adjusted operating earnings available to common shareholders before amortization of intangibles (non-GAAP) 47,475 $ 284,290 $ 187,273 $ 242,445 $ 189,002 $ 87,015 $ Average common equity (GAAP) 2,660,984 $ 2,725,330 $ 2,576,372 $ 2,451,435 $ 1,863,216 $ 1,030,847 $ Less: Average intangible assets 977,303 985,559 1,000,654 991,926 776,944 315,722 Less: Average perpetual preferred stock 166,356 166,356 93,658 - - - Average tangible common equity (non-GAAP) 1,517,325 $ 1,573,415 $ 1,482,060 $ 1,459,509 $ 1,086,272 $ 715,125 $ ROE (GAAP) 6.66% 9.68% 6.14% 7.89% 7.85% 7.07% Return on tangible common equity (ROTCE) Net Income available to common shareholders (GAAP) 40,723 $ 252,049 $ 152,570 $ 193,528 $ 146,248 $ 72,923 $ Plus: Amortization of intangibles, tax effected 2,401 10,984 13,093 14,632 10,143 3,957 Net Income available to common shareholders before amortization of intangibles (non-GAAP) 43,124 $ 263,033 $ 165,663 $ 208,160 $ 156,391 $ 76,880 $ ROTCE 11.53% 16.72% 11.18% 14.26% 14.40% 10.75% Adjusted operating ROTCE (non-GAAP) 12.69% 18.07% 12.64% 16.61% 17.40% 12.17% ADJUSTED OPERATING EARNINGS & FINANCIAL METRICS For the years ended December 31, |
| 32 Reconciliation of Non - GAAP Disclosures The adjusted operating efficiency ratio (FTE) excludes merger - related costs, rebranding costs , the amortization of intangible assets, gains or losses on sale of securities, gains on the sale of Visa, Inc. Class B common stock, gains or losses related to balance sheet repositioning (principally composed of gains and losses on debt extinguishment), as well as branch closing and facility consolidation costs. This measure is similar to the measure utilized by the Company when analyzing corporate performance and is also similar to the measure utilized for incentive compensation. The Company believes this adjusted measure provides investors with important information about the combined economic results of the organization’s operations. Prior periods in this presentation have been adjusted for previously announced branch closing and corporate expense reduction initiatives. For the three months ended (Dollars in thousands) March 31, 2022 2021 2020 2019 2018 2017 Noninterest expense (GAAP) 105,321 $ 419,195 $ 413,349 $ 418,340 $ 337,767 $ 225,668 $ Less: Merger-related costs - - - 27,824 39,728 5,393 Less: Rebranding costs - - - 6,455 - - Less: Amortization of intangible assets 3,039 13,904 16,574 18,521 12,839 6,088 Less: Losses related to balance sheet repositioning - 14,695 31,116 16,397 - - Less: Branch closing and facility consolidation costs 5,508 17,437 6,764 - 1,075 - Adjusted operating noninterest expense (non-GAAP) 96,774 $ 373,159 $ 358,895 $ 349,143 $ 284,125 $ 214,187 $ Net interest income (GAAP) 130,931 $ 551,260 $ 555,298 $ 537,872 $ 426,691 $ 279,007 $ Net interest income (FTE) (non-GAAP) 134,267 563,851 566,845 548,993 434,886 290,774 Noninterest income (GAAP) 30,153 $ 125,806 $ 131,486 $ 132,815 $ 104,241 $ 62,429 $ Plus: Losses related to balance sheet repositioning - - (1,769) - - - Less: Gain on sale of securities - 87 12,294 7,675 383 800 Less: Gain on Visa, Inc. Class B common stock - 5,137 - - - - Adjusted operating noninterest income (non-GAAP) 30,153 $ 120,582 $ 120,961 $ 125,140 $ 103,858 $ 61,629 $ Efficiency ratio (GAAP) 65.38% 61.91% 60.19% 62.37% 63.62% 66.09% Adjusted operating efficiency ratio (FTE) (non-GAAP) 58.86% 54.52% 52.18% 51.79% 52.74% 60.78% ADJUSTED OPERATING EFFICIENCY RATIO For the years ended December 31, |
| 33 Reconciliation of Non - GAAP Disclosures Tangible assets, tangible common equity, and adjusted leverage ratio are used in the calculation of certain profitability, capital, and per share ratios. The Company believes tangible assets, tangible common equity, adjusted leverage ratio and the related ratios are meaningful measures of capital adequacy because they provide a meaningful base for period - to - period and company - to - company comparisons, which the Company believes will assist investors in assessing the capital of the Company and its ability to absorb potential losses. (Dollars in thousands, except per share amounts) Atlantic Union Bankshares Atlantic Union Bank Tangible Assets Ending Assets (GAAP) 19,782,430 $ 19,690,628 $ Less: Ending goodwill 935,560 935,560 Less: Ending amortizable intangibles 40,273 40,273 Ending tangible assets (non-GAAP) 18,806,597 $ 18,714,795 $ Less: PPP loans 67,444 67,444 Tangible assets, excl PPP (non-GAAP) 18,739,153 $ 18,647,351 $ Tangible Common Equity Ending equity (GAAP) 2,498,335 $ 2,794,350 $ Less: Ending goodwill 935,560 935,560 Less: Ending amortizable intangibles 40,273 40,273 Less: Perpetual preferred stock 166,357 - Ending tangible common equity (non-GAAP) 1,356,145 $ 1,818,517 $ Average common equity (GAAP) 2,660,984 $ 2,928,010 $ Less: Average goodwill 935,560 935,560 Less: Average amortizable intangibles 41,743 41,743 Less: Average perpetual preferred stock 166,356 - Average tangible common equity (non-GAAP) 1,517,325 $ 1,950,707 $ Common equity to assets (GAAP) 11.8% 14.2% Tangible common equity to tangible assets (non-GAAP) 7.2% 9.7% Tangible common equity to tangible assets, excl PPP (non-GAAP) 7.2% 9.8% Book value per common share (GAAP) 31.12 $ Tangible book value per common share (non-GAAP) 18.10 $ Adjusted Leverage Ratio Tier 1 Capital 1,723,491 $ 2,027,193 $ Total average assets for leverage ratio 18,990,428 $ 18,925,912 $ Less: Average PPP loans 103,041 103,041 Adjusted average assets for leverage ratio 18,887,387 $ 18,822,871 $ Leverage Ratio 9.1% 10.7% Leverage Ratio, excl PPP 9.1% 10.8% TANGIBLE ASSETS, TANGIBLE COMMON EQUITY, AND ADJUSTED LEVERAGE RATIO As of March 31, 2022 |
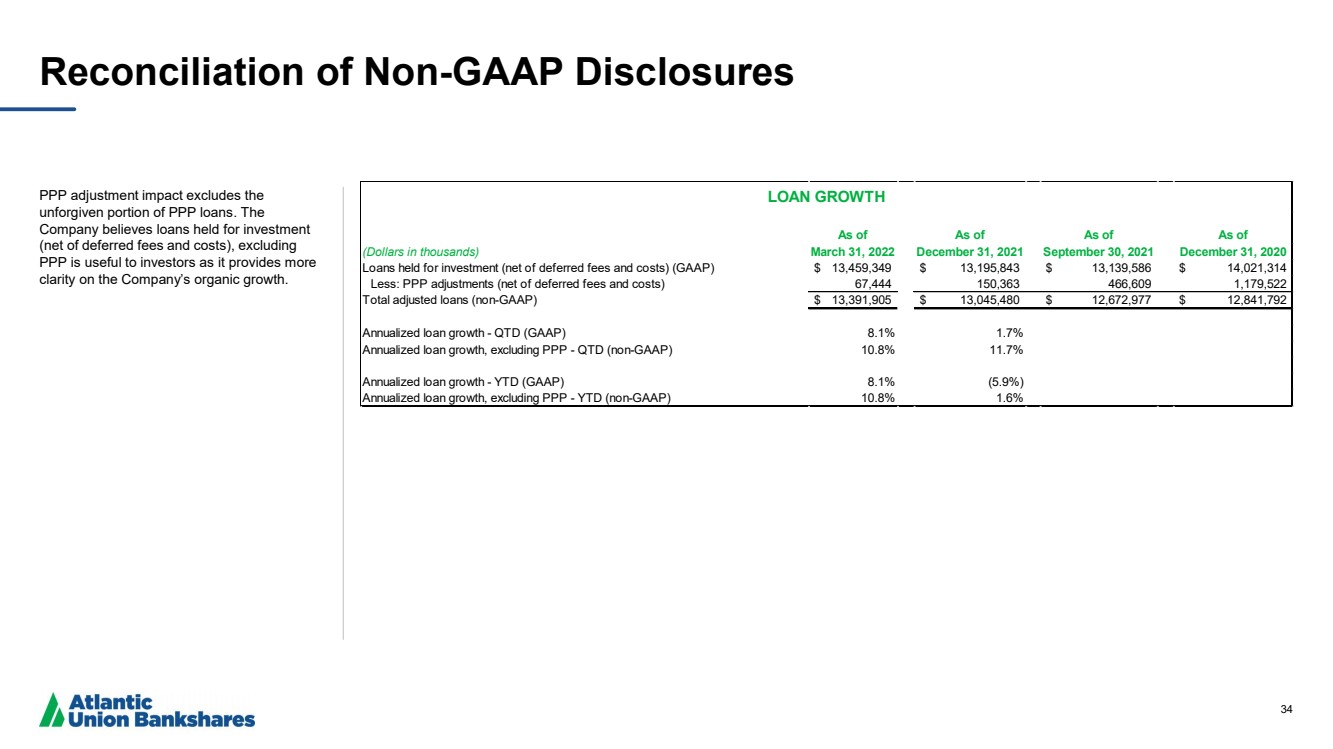
| 34 Reconciliation of Non - GAAP Disclosures PPP adjustment impact excludes the unforgiven portion of PPP loans .. The Company believes loans held for investment (net of deferred fees and costs), excluding PPP is useful to investors as it provides more clarity on the Company’s organic growth. As of As of As of As of (Dollars in thousands) March 31, 2022 December 31, 2021 September 30, 2021 December 31, 2020 Loans held for investment (net of deferred fees and costs) (GAAP) 13,459,349 $ 13,195,843 $ 13,139,586 $ 14,021,314 $ Less: PPP adjustments (net of deferred fees and costs) 67,444 150,363 466,609 1,179,522 Total adjusted loans (non-GAAP) 13,391,905 $ 13,045,480 $ 12,672,977 $ 12,841,792 $ Annualized loan growth - QTD (GAAP) 8.1% 1.7% Annualized loan growth, excluding PPP - QTD (non-GAAP) 10.8% 11.7% Annualized loan growth - YTD (GAAP) 8.1% (5.9%) Annualized loan growth, excluding PPP - YTD (non-GAAP) 10.8% 1.6% LOAN GROWTH |