| 1 st Quarter FY2022 Earnings Presentation Nasdaq: AUB April 21, 2022 |

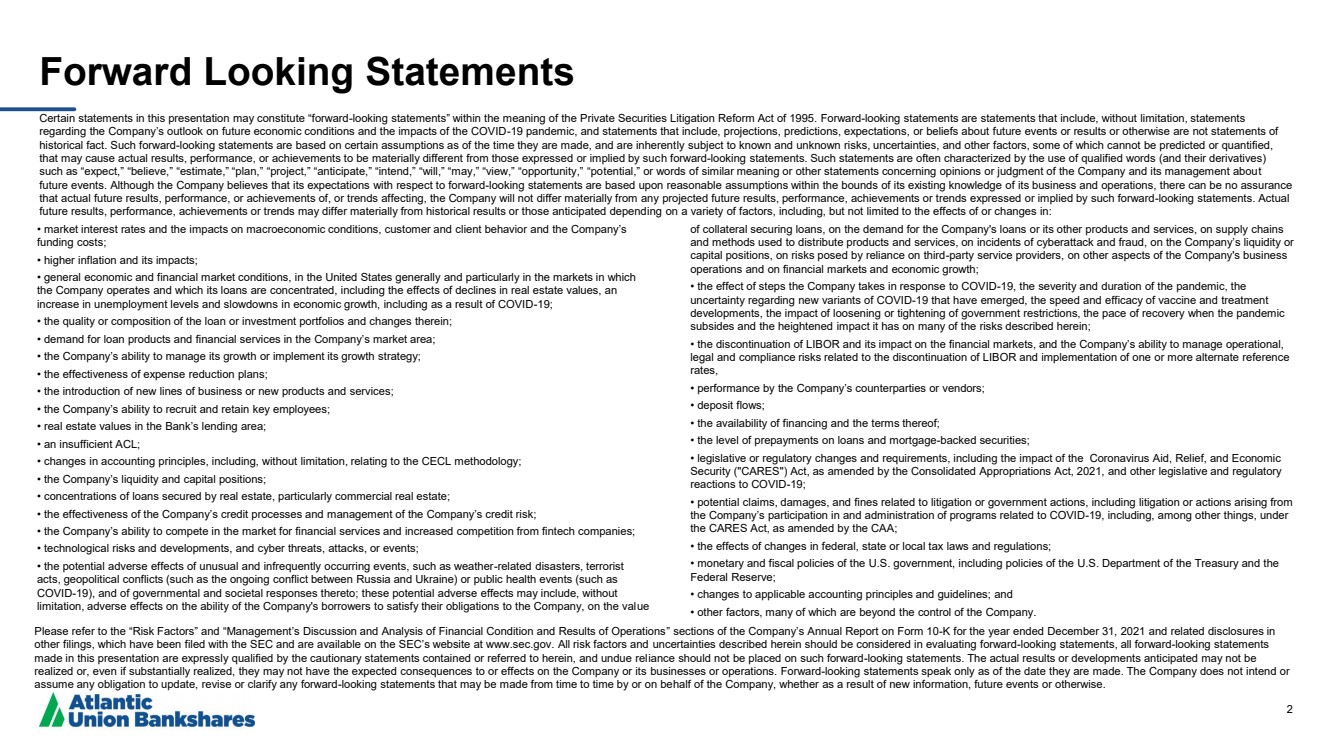
| 2 Forward Looking Statements Certain statements in this presentation may constitute “forward - looking statements” within the meaning of the Private Securities Litigation Reform Act of 1995. Forward - looking statements are statements that include, without limitation, statements regarding the Company’s outlook on future economic conditions and the impacts of the COVID - 19 pandemic, and statements that incl ude, projections, predictions, expectations, or beliefs about future events or results or otherwise are not statements of historical fact. Such forward - looking statements are based on certain assumptions as of the time they are made, and are inherent ly subject to known and unknown risks, uncertainties, and other factors, some of which cannot be predicted or quantified, that may cause actual results, performance, or achievements to be materially different from those expressed or implied by suc h f orward - looking statements. Such statements are often characterized by the use of qualified words (and their derivatives) such as “expect,” “believe,” “estimate,” “plan,” “project,” “anticipate,” “intend,” “will,” “may,” “view,” “opportunity,” “po ten tial,” or words of similar meaning or other statements concerning opinions or judgment of the Company and its management abou t future events. Although the Company believes that its expectations with respect to forward - looking statements are based upon rea sonable assumptions within the bounds of its existing knowledge of its business and operations, there can be no assurance that actual future results, performance, or achievements of, or trends affecting, the Company will not differ materially from an y projected future results, performance, achievements or trends expressed or implied by such forward - looking statements. Actual future results, performance, achievements or trends may differ materially from historical results or those anticipated depend ing on a variety of factors, including, but not limited to the effects of or changes in: • market interest rates and the impacts on macroeconomic conditions, customer and client behavior and the Company’s funding costs; • higher inflation and its impacts; • general economic and financial market conditions, in the United States generally and particularly in the markets in which the Company operates and which its loans are concentrated, including the effects of declines in real estate values, an increase in unemployment levels and slowdowns in economic growth, including as a result of COVID - 19; • the quality or composition of the loan or investment portfolios and changes therein; • demand for loan products and financial services in the Company’s market area; • the Company’s ability to manage its growth or implement its growth strategy; • the effectiveness of expense reduction plans; • the introduction of new lines of business or new products and services; • the Company’s ability to recruit and retain key employees; • real estate values in the Bank’s lending area; • an insufficient ACL; • changes in accounting principles, including , without limitation, relating to the CECL methodology ; • the Company’s liquidity and capital positions; • concentrations of loans secured by real estate, particularly commercial real estate; • the effectiveness of the Company’s credit processes and management of the Company’s credit risk; • the Company’s ability to compete in the market for financial services and increased competition from fintech companies; • technological risks and developments, and cyber threats, attacks, or events; • the potential adverse effects of unusual and infrequently occurring events, such as weather - related disasters, terrorist acts, geopolitical conflicts (such as the ongoing conflict between Russia and Ukraine) or public health events (such as COVID - 19), and of governmental and societal responses thereto; these potential adverse effects may include, without limitation, adverse effects on the ability of the Company's borrowers to satisfy their obligations to the Company, on the val ue of collateral securing loans, on the demand for the Company's loans or its other products and services, on supply chains and methods used to distribute products and services, on incidents of cyberattack and fraud, on the Company’s liquidity or capital positions, on risks posed by reliance on third - party service providers, on other aspects of the Company's business operations and on financial markets and economic growth; • the effect of steps the Company takes in response to COVID - 19, the severity and duration of the pandemic, the uncertainty regarding new variants of COVID - 19 that have emerged, the speed and efficacy of vaccine and treatment developments, the impact of loosening or tightening of government restrictions, the pace of recovery when the pandemic subsides and the heightened impact it has on many of the risks described herein; • the discontinuation of LIBOR and its impact on the financial markets, and the Company’s ability to manage operational, legal and compliance risks related to the discontinuation of LIBOR and implementation of one or more alternate reference rates, • performance by the Company’s counterparties or vendors; • deposit flows; • the availability of financing and the terms thereof; • the level of prepayments on loans and mortgage - backed securities; • legislative or regulatory changes and requirements, including the impact of the Coronavirus Aid, Relief, and Economic Security ("CARES") Act, as amended by the Consolidated Appropriations Act, 2021, and other legislative and regulatory reactions to COVID - 19; • potential claims, damages, and fines related to litigation or government actions, including litigation or actions arising from the Company’s participation in and administration of programs related to COVID - 19, including, among other things, under the CARES Act, as amended by the CAA ; • the effects of changes in federal, state or local tax laws and regulations; • monetary and fiscal policies of the U.S. government, including policies of the U.S. Department of the Treasury and the Federal Reserve; • changes to applicable accounting principles and guidelines; and • other factors, many of which are beyond the control of the Company. Please refer to the “Risk Factors” and “Management’s Discussion and Analysis of Financial Condition and Results of Operations ” s ections of the Company’s Annual Report on Form 10 - K for the year ended December 31, 2021 and related disclosures in other filings, which have been filed with the SEC and are available on the SEC’s website at www.sec.gov. All risk factors and un certainties described herein should be considered in evaluating forward - looking statements, all forward - looking statements made in this presentation are expressly qualified by the cautionary statements contained or referred to herein, and undue rel ian ce should not be placed on such forward - looking statements. The actual results or developments anticipated may not be realized or, even if substantially realized, they may not have the expected consequences to or effects on the Company or its bus inesses or operations. Forward - looking statements speak only as of the date they are made. The Company does not intend or assume any obligation to update, revise or clarify any forward - looking statements that may be made from time to time by or on be half of the Company, whether as a result of new information, future events or otherwise. |
| 3 Additional Information Non - GAAP Financial Measures This presentation contains certain financial information determined by methods other than in accordance with generally accepted accounting principles in the United States (“GAAP”). These non - GAAP financial measures are a supplement to GAAP, which is used to prepare the Company’s financial statements, and should not be considered in isolation or as a substitute for comparable measures calculated in accordance with GAAP. In addition, the Company’s non - GAAP financial measures may not be comparable to non - GAAP financial measures of other companies. The Company uses the non - GAAP financial measures discussed herein in its analysis of the Company’s performance. The Company’s management believes that these non - GAAP financial measures provide additional understanding of ongoing operations, enhance comparability of results of operations with prior periods and show the effects of significant gains and charges in the periods presented without the impact of items or events that may obscure trends in the Company’s underlying performance. Please see “Reconciliation of Non - GAAP Disclosures” at the end of this presentation for a reconciliation to the nearest GAAP financial measure. No Offer or Solicitation This presentation does not constitute an offer to sell or a solicitation of an offer to buy any securities. No offer of securities shall be made except by means of a prospectus meeting the requirements of the Securities Act of 1933, as amended, and no offer to sell or solicitation of an offer to buy shall be made in any jurisdiction in which such offer, solicitation or sale would be unlawful. About Atlantic Union Bankshares Corporation Headquartered in Richmond, Virginia, Atlantic Union Bankshares Corporation (Nasdaq: AUB) is the holding company for Atlantic Union Bank. Atlantic Union Bank has 114 branches and approximately 130 ATMs located throughout Virginia, and in portions of Maryland and North Carolina. Certain non - bank financial services affiliates of Atlantic Union Bank include: Atlantic Union Equipment Finance, Inc., which provides equipment financing; Dixon, Hubard , Feinour & Brown, Inc., which provides investment advisory services; Atlantic Union Financial Consultants, LLC, which provides brokerage services; and Union Insurance Group, LLC, which offers various lines of insurance products. |
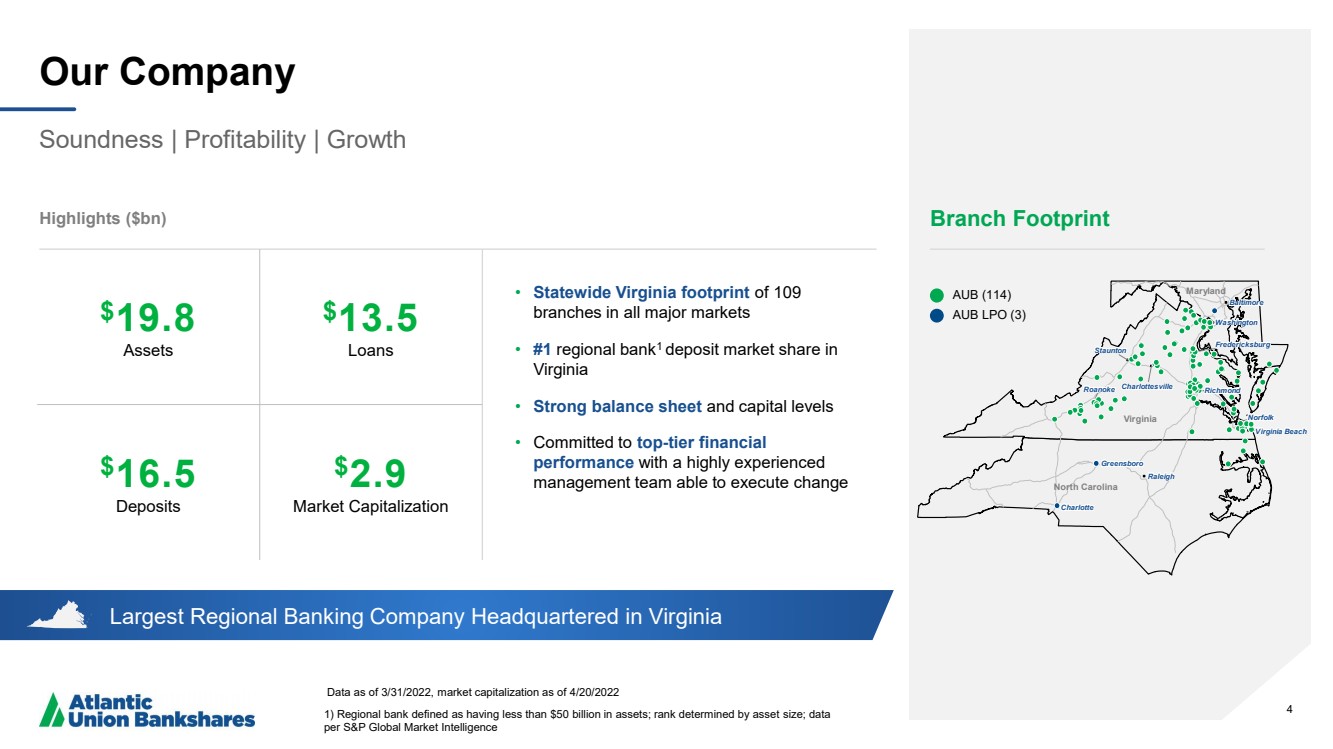
| 4 Largest Regional Banking Company Headquartered in Virginia Our Company Soundness | Profitability | Growth Data as of 3/31/2022, market capitalization as of 4/20/2022 1) Regional bank defined as having less than $50 billion in assets; rank determined by asset size; data per S&P Global Market Intelligence Highlights ($bn) Branch Footprint AUB ( 114) AUB LPO (3) • Statewide Virginia footprint of 109 branches in all major markets • #1 regional bank 1 deposit market share in Virginia • Strong balance sheet and capital levels • Committed to top - tier financial performance with a highly experienced management team able to execute change 4 $ 19 ..8 Assets $ 13.5 Loans $ 16.5 Deposits $ 2 ..9 Market Capitalization Virginia Maryland North Carolina Washington Washington Washington Washington Washington Washington Washington Washington Washington Washington Washington Washington Washington Washington Washington Washington Washington Washington Washington Washington Washington Washington Washington Washington Washington Washington Washington Washington Washington Washington Washington Washington Washington Washington Washington Washington Washington Washington Washington Washington Washington Washington Washington Washington Washington Washington Washington Washington Washington Fredericksburg Fredericksburg Fredericksburg Fredericksburg Fredericksburg Fredericksburg Fredericksburg Fredericksburg Fredericksburg Fredericksburg Fredericksburg Fredericksburg Fredericksburg Fredericksburg Fredericksburg Fredericksburg Fredericksburg Fredericksburg Fredericksburg Fredericksburg Fredericksburg Fredericksburg Fredericksburg Fredericksburg Fredericksburg Fredericksburg Fredericksburg Fredericksburg Fredericksburg Fredericksburg Fredericksburg Fredericksburg Fredericksburg Fredericksburg Fredericksburg Fredericksburg Fredericksburg Fredericksburg Fredericksburg Fredericksburg Fredericksburg Fredericksburg Fredericksburg Fredericksburg Fredericksburg Fredericksburg Fredericksburg Fredericksburg Fredericksburg Virginia Beach Virginia Beach Virginia Beach Virginia Beach Virginia Beach Virginia Beach Virginia Beach Virginia Beach Virginia Beach Virginia Beach Virginia Beach Virginia Beach Virginia Beach Virginia Beach Virginia Beach Virginia Beach Virginia Beach Virginia Beach Virginia Beach Virginia Beach Virginia Beach Virginia Beach Virginia Beach Virginia Beach Virginia Beach Virginia Beach Virginia Beach Virginia Beach Virginia Beach Virginia Beach Virginia Beach Virginia Beach Virginia Beach Virginia Beach Virginia Beach Virginia Beach Virginia Beach Virginia Beach Virginia Beach Virginia Beach Virginia Beach Virginia Beach Virginia Beach Virginia Beach Virginia Beach Virginia Beach Virginia Beach Virginia Beach Virginia Beach Norfolk Norfolk Norfolk Norfolk Norfolk Norfolk Norfolk Norfolk Norfolk Norfolk Norfolk Norfolk Norfolk Norfolk Norfolk Norfolk Norfolk Norfolk Norfolk Norfolk Norfolk Norfolk Norfolk Norfolk Norfolk Norfolk Norfolk Norfolk Norfolk Norfolk Norfolk Norfolk Norfolk Norfolk Norfolk Norfolk Norfolk Norfolk Norfolk Norfolk Norfolk Norfolk Norfolk Norfolk Norfolk Norfolk Norfolk Norfolk Norfolk Richmond Richmond Richmond Richmond Richmond Richmond Richmond Richmond Richmond Richmond Richmond Richmond Richmond Richmond Richmond Richmond Richmond Richmond Richmond Richmond Richmond Richmond Richmond Richmond Richmond Richmond Richmond Richmond Richmond Richmond Richmond Richmond Richmond Richmond Richmond Richmond Richmond Richmond Richmond Richmond Richmond Richmond Richmond Richmond Richmond Richmond Richmond Richmond Richmond Charlottesville Charlottesville Charlottesville Charlottesville Charlottesville Charlottesville Charlottesville Charlottesville Charlottesville Charlottesville Charlottesville Charlottesville Charlottesville Charlottesville Charlottesville Charlottesville Charlottesville Charlottesville Charlottesville Charlottesville Charlottesville Charlottesville Charlottesville Charlottesville Charlottesville Charlottesville Charlottesville Charlottesville Charlottesville Charlottesville Charlottesville Charlottesville Charlottesville Charlottesville Charlottesville Charlottesville Charlottesville Charlottesville Charlottesville Charlottesville Charlottesville Charlottesville Charlottesville Charlottesville Charlottesville Charlottesville Charlottesville Charlottesville Charlottesville Roanoke Roanoke Roanoke Roanoke Roanoke Roanoke Roanoke Roanoke Roanoke Roanoke Roanoke Roanoke Roanoke Roanoke Roanoke Roanoke Roanoke Roanoke Roanoke Roanoke Roanoke Roanoke Roanoke Roanoke Roanoke Roanoke Roanoke Roanoke Roanoke Roanoke Roanoke Roanoke Roanoke Roanoke Roanoke Roanoke Roanoke Roanoke Roanoke Roanoke Roanoke Roanoke Roanoke Roanoke Roanoke Roanoke Roanoke Roanoke Roanoke Staunton Staunton Staunton Staunton Staunton Staunton Staunton Staunton Staunton Staunton Staunton Staunton Staunton Staunton Staunton Staunton Staunton Staunton Staunton Staunton Staunton Staunton Staunton Staunton Staunton Staunton Staunton Staunton Staunton Staunton Staunton Staunton Staunton Staunton Staunton Staunton Staunton Staunton Staunton Staunton Staunton Staunton Staunton Staunton Staunton Staunton Staunton Staunton Staunton Baltimore Baltimore Baltimore Baltimore Baltimore Baltimore Baltimore Baltimore Baltimore Baltimore Baltimore Baltimore Baltimore Baltimore Baltimore Baltimore Baltimore Baltimore Baltimore Baltimore Baltimore Baltimore Baltimore Baltimore Baltimore Baltimore Baltimore Baltimore Baltimore Baltimore Baltimore Baltimore Baltimore Baltimore Baltimore Baltimore Baltimore Baltimore Baltimore Baltimore Baltimore Baltimore Baltimore Baltimore Baltimore Baltimore Baltimore Baltimore Baltimore Charlotte Charlotte Charlotte Charlotte Charlotte Charlotte Charlotte Charlotte Charlotte Charlotte Charlotte Charlotte Charlotte Charlotte Charlotte Charlotte Charlotte Charlotte Charlotte Charlotte Charlotte Charlotte Charlotte Charlotte Charlotte Charlotte Charlotte Charlotte Charlotte Charlotte Charlotte Charlotte Charlotte Charlotte Charlotte Charlotte Charlotte Charlotte Charlotte Charlotte Charlotte Charlotte Charlotte Charlotte Charlotte Charlotte Charlotte Charlotte Charlotte Greensboro Greensboro Greensboro Greensboro Greensboro Greensboro Greensboro Greensboro Greensboro Greensboro Greensboro Greensboro Greensboro Greensboro Greensboro Greensboro Greensboro Greensboro Greensboro Greensboro Greensboro Greensboro Greensboro Greensboro Greensboro Greensboro Greensboro Greensboro Greensboro Greensboro Greensboro Greensboro Greensboro Greensboro Greensboro Greensboro Greensboro Greensboro Greensboro Greensboro Greensboro Greensboro Greensboro Greensboro Greensboro Greensboro Greensboro Greensboro Greensboro Raleigh Raleigh Raleigh Raleigh Raleigh Raleigh Raleigh Raleigh Raleigh Raleigh Raleigh Raleigh Raleigh Raleigh Raleigh Raleigh Raleigh Raleigh Raleigh Raleigh Raleigh Raleigh Raleigh Raleigh Raleigh Raleigh Raleigh Raleigh Raleigh Raleigh Raleigh Raleigh Raleigh Raleigh Raleigh Raleigh Raleigh Raleigh Raleigh Raleigh Raleigh Raleigh Raleigh Raleigh Raleigh Raleigh Raleigh Raleigh Raleigh |
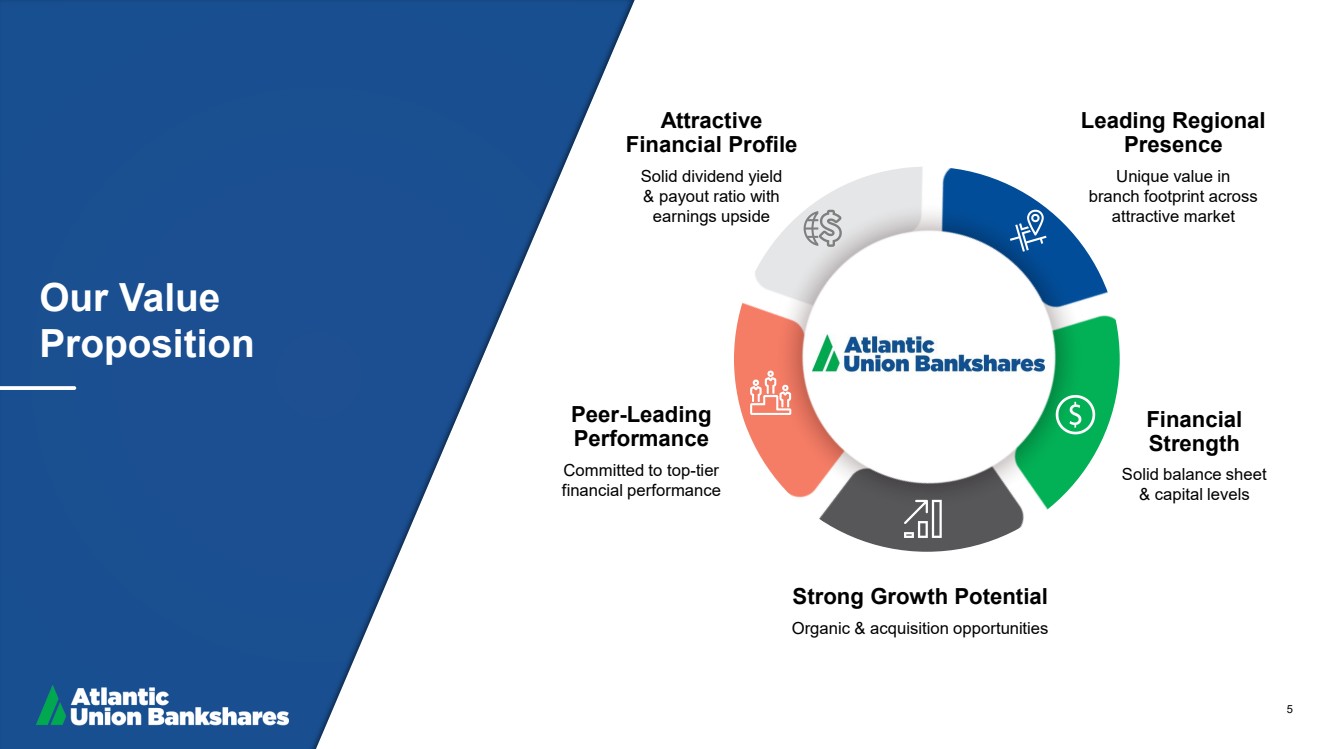
| 5 Our Value Proposition Strong Growth Potential Organic & acquisition opportunities Financial Strength Solid balance sheet & capital levels Leading Regional Presence Unique value in branch footprint across attractive market Attractive Financial Profile Solid dividend yield & payout ratio with earnings upside Peer - Leading Performance Committed to top - tier financial performance |
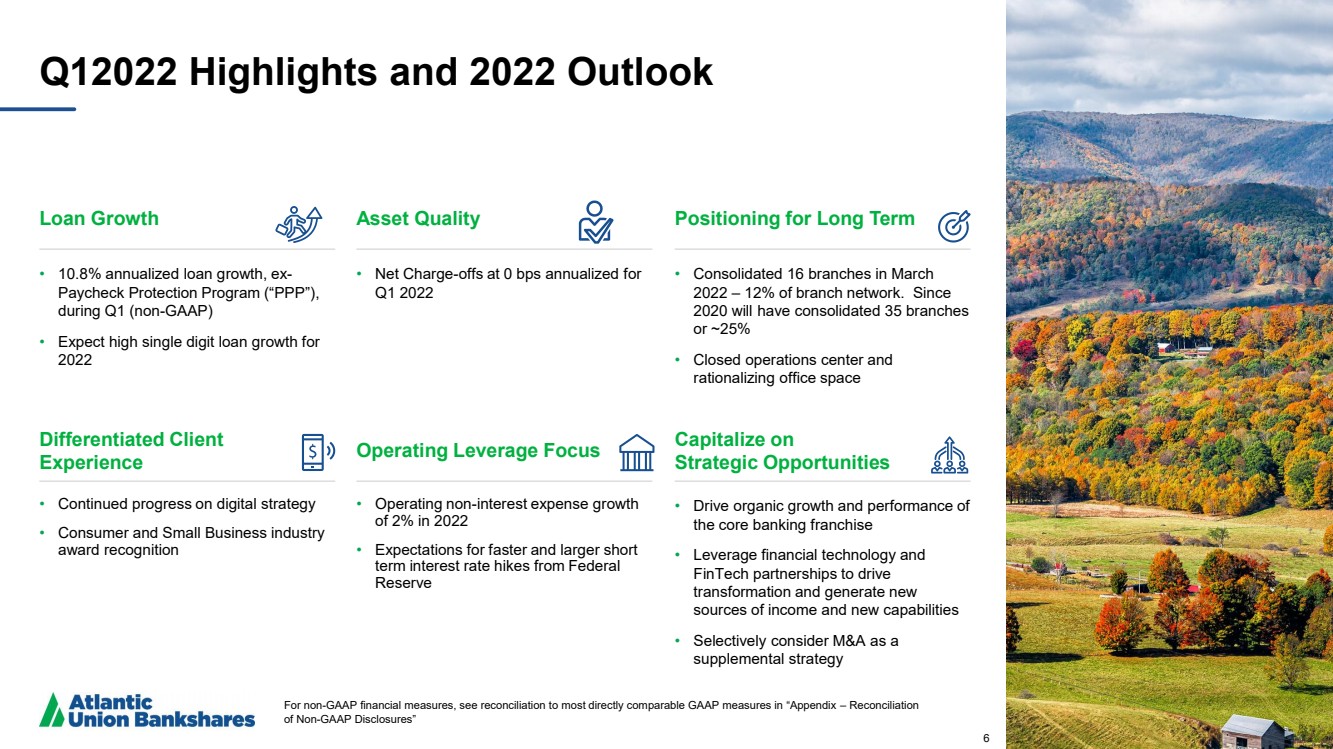
| 6 Q12022 Highlights and 2022 Outlook Loan Growth • 10.8% annualized loan growth, ex - Paycheck Protection Program (“PPP ”), during Q1 (non - GAAP) • Expect high single digit loan growth for 2022 Asset Quality • Net Charge - offs at 0 bps annualized for Q1 2022 Positioning for Long Term • Consolidated 16 branches in March 2022 – 12% of branch network. Since 2020 will have consolidated 35 branches or ~25% • Closed operations center and rationalizing office space Differentiated Client Experience • Continued progress on digital strategy • Consumer and Small Business industry award recognition Operating Leverage Focus • Operating non - interest expense growth of 2% in 2022 • Expectations for faster and larger short term interest rate hikes from Federal Reserve Capitalize on Strategic Opportunities • Drive organic growth and performance of the core banking franchise • Leverage financial technology and FinTech partnerships to drive transformation and generate new sources of income and new capabilities • Selectively consider M&A as a supplemental strategy 6 For non - GAAP financial measures, see reconciliation to most directly comparable GAAP measures in “Appendix – Reconciliation of Non - GAAP Disclosures” |
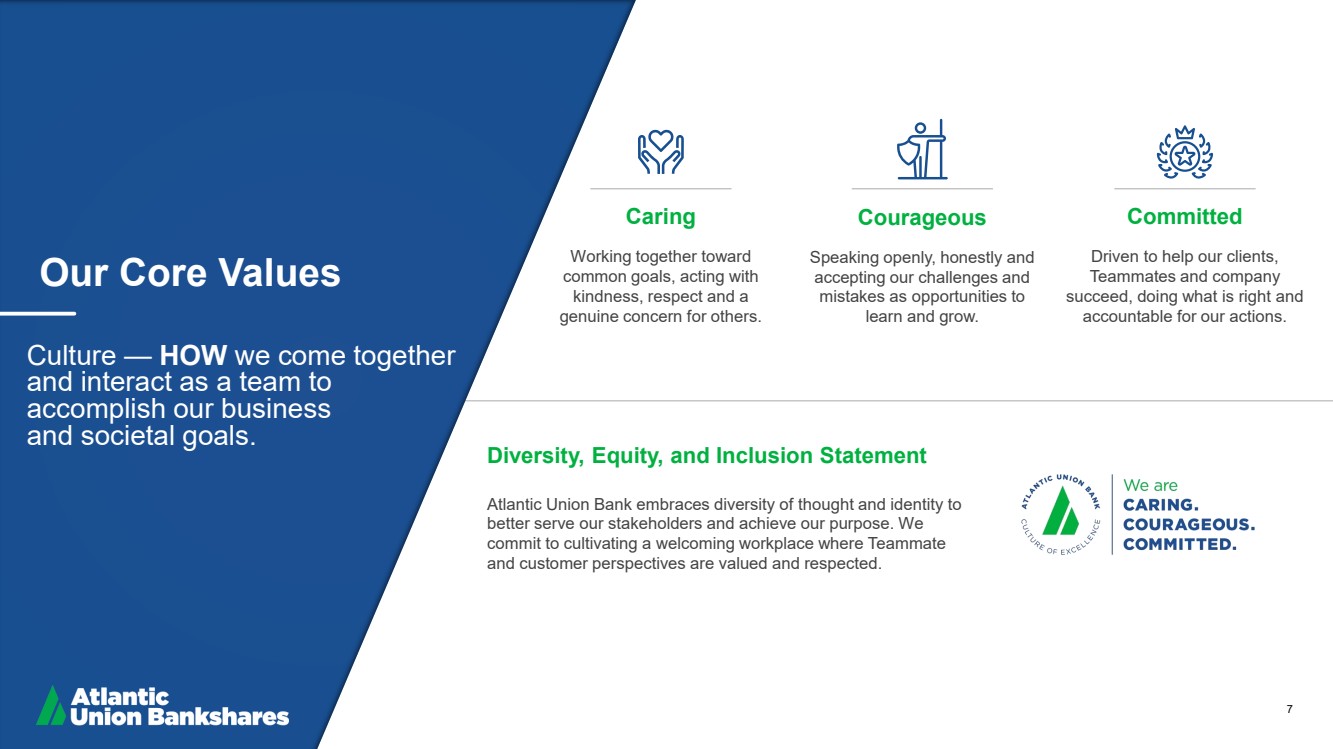
| 7 Caring Working together toward common goals, acting with kindness, respect and a genuine concern for others. Courageous Speaking openly, honestly and accepting our challenges and mistakes as opportunities to learn and grow. Committed Driven to help our clients, Teammates and company succeed, doing what is right and accountable for our actions. Our Core Values Culture — HOW we come together and interact as a team to accomplish our business and societal goals .. Diversity, Equity, and Inclusion Statement Atlantic Union Bank embraces diversity of thought and identity to better serve our stakeholders and achieve our purpose. We commit to cultivating a welcoming workplace where Teammate and customer perspectives are valued and respected. |
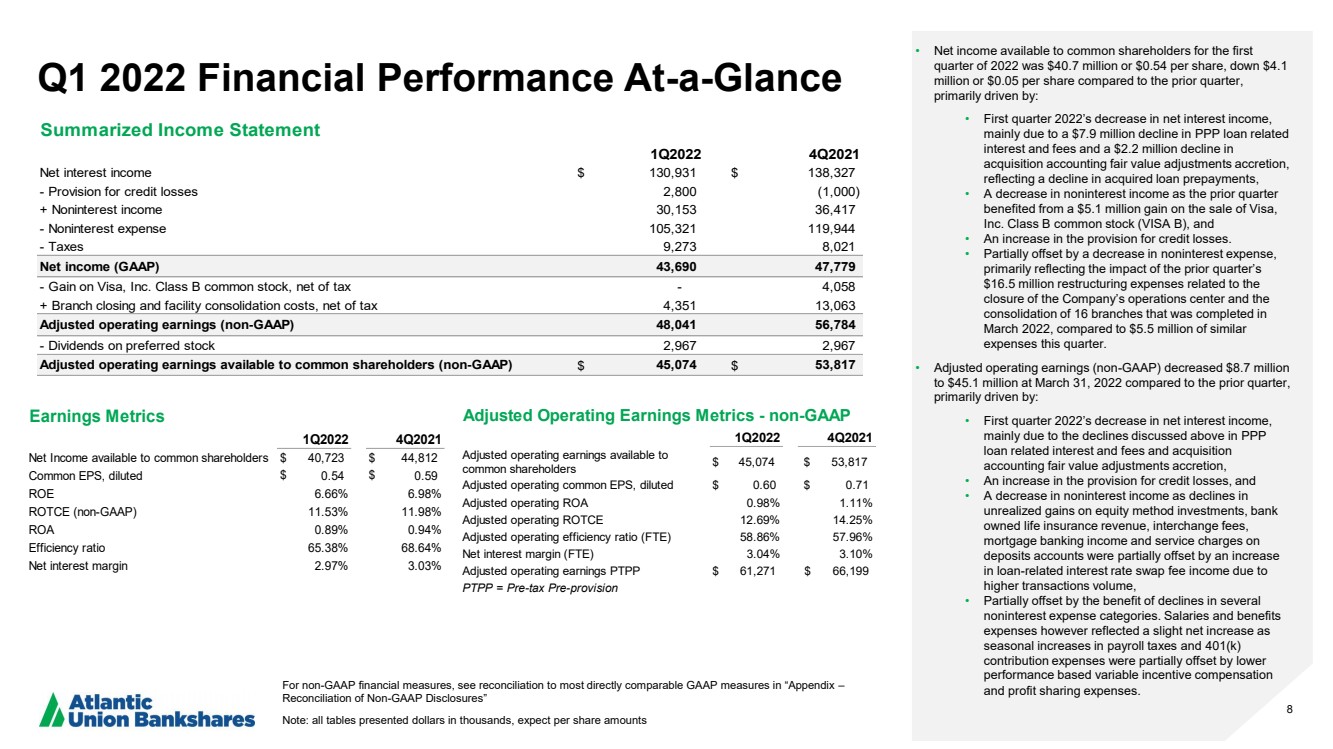
| 8 Q1 2022 Financial Performance At - a - Glance For non - GAAP financial measures, see reconciliation to most directly comparable GAAP measures in “Appendix – Reconciliation of Non - GAAP Disclosures” Note: all tables presented dollars in thousands, expect per share amounts • Net income available to common shareholders for the first quarter of 2022 was $40.7 million or $0.54 per share, down $4.1 million or $0.05 per share compared to the prior quarter, primarily driven by: • First quarter 2022’s decrease in net interest income, mainly due to a $7.9 million decline in PPP loan related interest and fees and a $2.2 million decline in acquisition accounting fair value adjustments accretion, reflecting a decline in acquired loan prepayments, • A decrease in noninterest income as the prior quarter benefited from a $5.1 million gain on the sale of Visa, Inc. Class B common stock (VISA B), and • An increase in the provision for credit losses. • Partially offset by a decrease in noninterest expense, primarily reflecting the impact of the prior quarter’s $16.5 million restructuring expenses related to the closure of the Company’s operations center and the consolidation of 16 branches that was completed in March 2022, compared to $5.5 million of similar expenses this quarter. • Adjusted operating earnings (non - GAAP) decreased $8.7 million to $45.1 million at March 31, 2022 compared to the prior quarter, primarily driven by: • First quarter 2022’s decrease in net interest income, mainly due to the declines discussed above in PPP loan related interest and fees and acquisition accounting fair value adjustments accretion, • An increase in the provision for credit losses, and • A decrease in noninterest income as declines in unrealized gains on equity method investments, bank owned life insurance revenue, interchange fees, mortgage banking income and service charges on deposits accounts were partially offset by an increase in loan - related interest rate swap fee income due to higher transactions volume, • Partially offset by the benefit of declines in several noninterest expense categories. Salaries and benefits expenses however reflected a slight net increase as seasonal increases in payroll taxes and 401(k) contribution expenses were partially offset by lower performance based variable incentive compensation and profit sharing expenses. 1Q2022 4Q2021 Net interest income $ 130,931 $ 138,327 - Provision for credit losses 2,800 (1,000) + Noninterest income 30,153 36,417 - Noninterest expense 105,321 119,944 - Taxes 9,273 8,021 Net income (GAAP) 43,690 47,779 - Gain on Visa, Inc. Class B common stock, net of tax - 4,058 + Branch closing and facility consolidation costs, net of tax 4,351 13,063 Adjusted operating earnings (non-GAAP) 48,041 56,784 - Dividends on preferred stock 2,967 2,967 Adjusted operating earnings available to common shareholders (non-GAAP) $ 45,074 $ 53,817 Summarized Income Statement 1Q2022 4Q2021 Adjusted operating earnings available to common shareholders $ 45,074 $ 53,817 Adjusted operating common EPS, diluted $ 0.60 $ 0.71 Adjusted operating ROA 0.98% 1.11% Adjusted operating ROTCE 12.69% 14.25% Adjusted operating efficiency ratio (FTE) 58.86% 57.96% Net interest margin (FTE) 3.04% 3.10% Adjusted operating earnings PTPP $ 61,271 $ 66,199 PTPP = Pre-tax Pre-provision Adjusted Operating Earnings Metrics - non-GAAP 1Q2022 4Q2021 Net Income available to common shareholders $ 40,723 $ 44,812 Common EPS, diluted $ 0.54 $ 0.59 ROE 6.66% 6.98% ROTCE (non-GAAP) 11.53% 11.98% ROA 0.89% 0.94% Efficiency ratio 65.38% 68.64% Net interest margin 2.97% 3.03% Earnings Metrics |
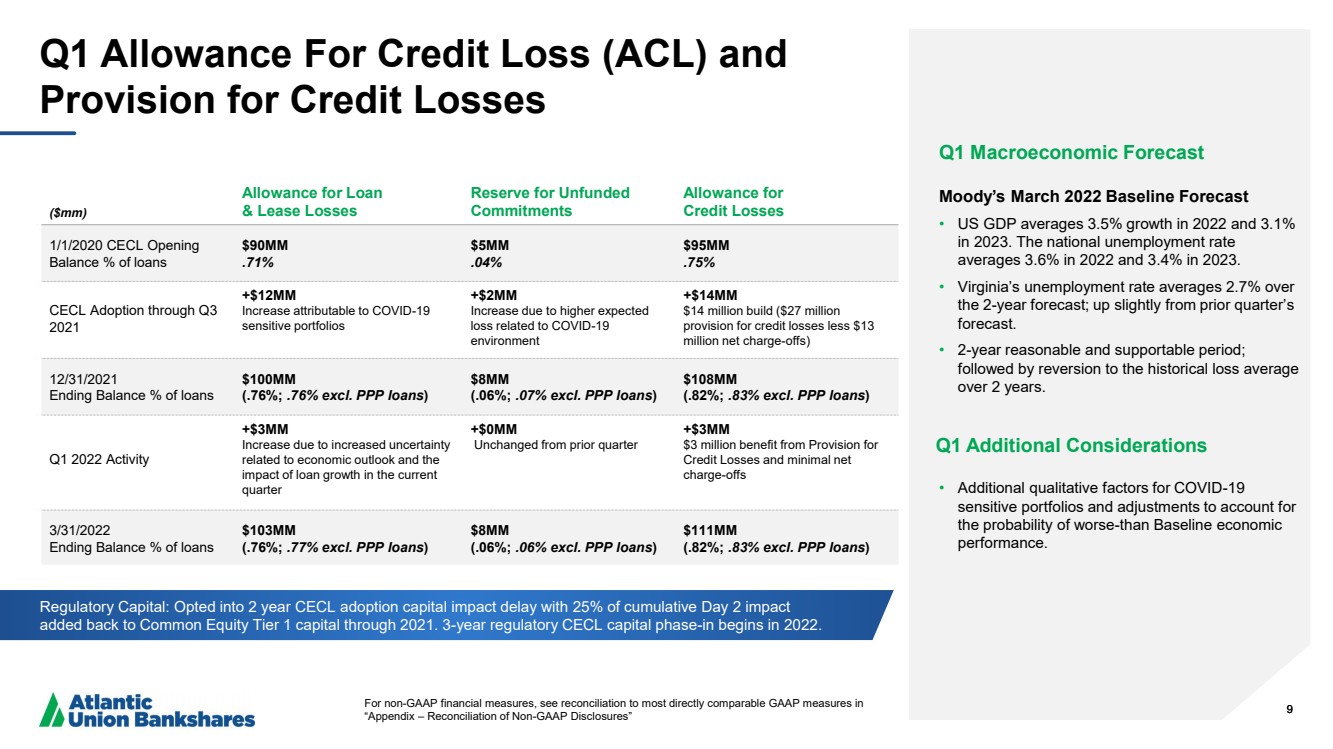
| 9 Q1 Allowance For Credit Loss (ACL) and Provision for Credit Losses 9 Q1 Macroeconomic Forecast Moody’s March 2022 Baseline Forecast • US GDP averages 3.5% growth in 2022 and 3.1 % in 2023. The national unemployment rate averages 3.6 % in 2022 and 3.4% in 2023. • Virginia’s unemployment rate averages 2.7% over the 2 - year forecast; up slightly from prior quarter’s forecast. • 2 - year reasonable and supportable period; followed by reversion to the historical loss average over 2 years. Q1 Additional Considerations • Additional qualitative factors for COVID - 19 sensitive portfolios and adjustments to account for the probability of worse - than Baseline economic performance. Regulatory Capital: Opted into 2 year CECL adoption capital impact delay with 25% of cumulative Day 2 impact added back to Common Equity Tier 1 capital through 2021. 3 - year regulatory CECL capital phase - in begins in 2022. ($mm) Allowance for Loan & Lease Losses Reserve for Unfunded Commitments Allowance for Credit Losses 1/1/2020 CECL Opening Balance % of loans $90MM ..71% $5MM ..04% $95MM ..75% CECL Adoption through Q3 2021 +$12MM Increase attributable to COVID - 19 sensitive portfolios +$2MM Increase due to higher expected loss related to COVID - 19 environment +$14MM $14 million build ($27 million provision for credit losses less $13 million net charge - offs) 12/31/2021 Ending Balance % of loans $ 100MM (. 76%; ..76% excl. PPP loans ) $8MM (.06 %; ..07% excl. PPP loans ) $ 108MM (. 82 %; ..83% excl. PPP loans ) Q1 2022 Activity +$3MM Increase due to increased uncertainty related to economic outlook and the impact of loan growth in the current quarter +$0MM Unchanged from prior quarter +$3MM $3 million benefit from Provision for Credit Losses and minimal net charge - offs 3/31/2022 Ending Balance % of loans $ 103MM (. 76%; ..77% excl. PPP loans ) $8MM (.06 %; ..06% excl. PPP loans ) $ 111MM (. 82 %; ..83% excl. PPP loans ) For non - GAAP financial measures, see reconciliation to most directly comparable GAAP measures in “Appendix – Reconciliation of Non - GAAP Disclosures” |
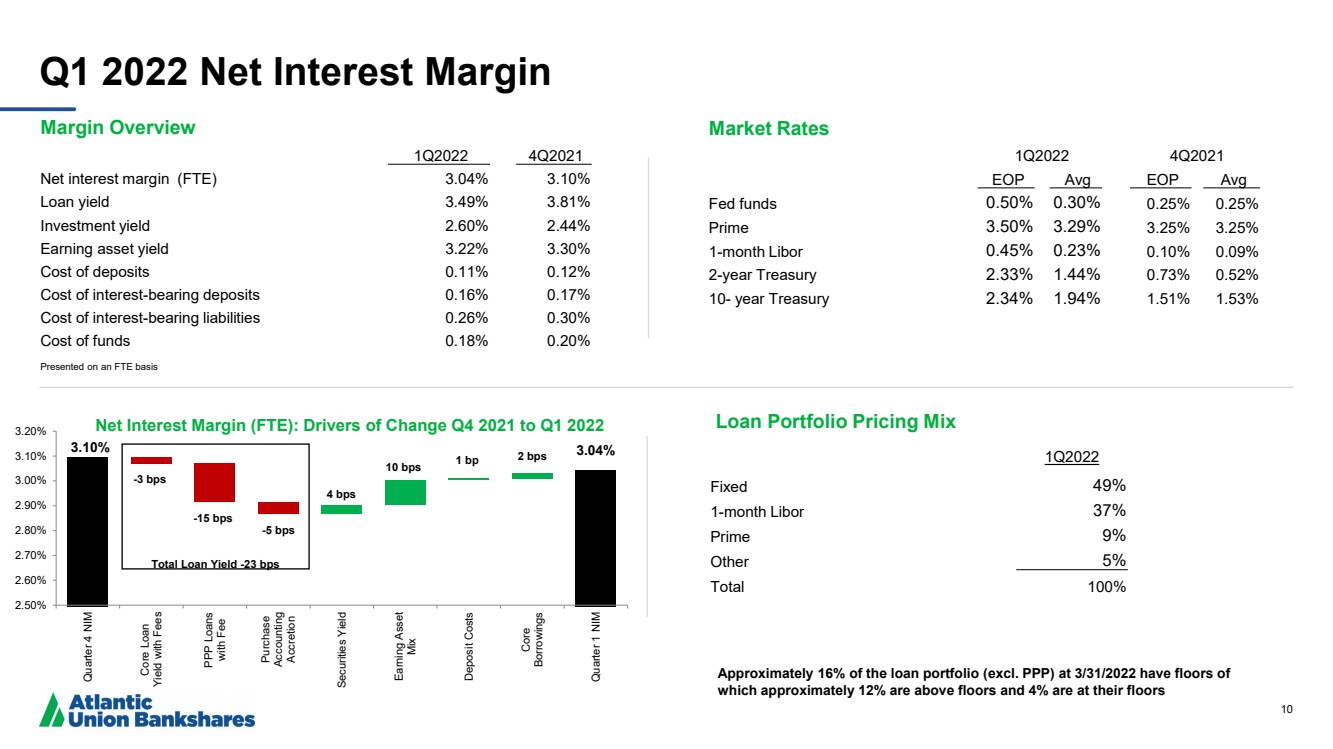
| 10 3.10% 3.04% 2 bps 2.50% 2.60% 2.70% 2.80% 2.90% 3.00% 3.10% 3.20% Quarter 4 NIM Core Loan Yield with Fees PPP Loans with Fee Purchase Accounting Accretion Securities Yield Earning Asset Mix Deposit Costs Core Borrowings Quarter 1 NIM Net Interest Margin (FTE): Drivers of Change Q4 2021 to Q1 2022 - 3 bps - 5 bps 10 bps - 15 bps 1 bp Q1 2022 Net Interest Margin Market Rates 1Q2022 4Q2021 EOP Avg EOP Avg Fed funds 0.50% 0.30% 0.25% 0.25% Prime 3.50% 3.29% 3.25% 3.25% 1 - month Libor 0.45% 0.23% 0.10% 0.09% 2 - year Treasury 2.33% 1.44% 0.73% 0.52% 10 - year Treasury 2.34% 1.94% 1.51% 1.53% Margin Overview 1Q2022 4Q2021 Net interest margin (FTE) 3.04% 3.10% Loan yield 3.49% 3.81% Investment yield 2.60% 2.44% Earning asset yield 3.22% 3.30% Cost of deposits 0.11% 0.12% Cost of interest - bearing deposits 0.16% 0.17% Cost of interest - bearing liabilities 0.26% 0.30% Cost of funds 0.18% 0.20% Presented on an FTE basis Approximately 16% of the loan portfolio ( excl. PPP) at 3/31/2022 have floors of which approximately 12% are above floors and 4% are at their floors Loan Portfolio Pricing Mix 1Q2022 Fixed 49% 1 - month Libor 37% Prime 9% Other 5% Total 100% Total Loan Yield - 23 bps 4 bps |
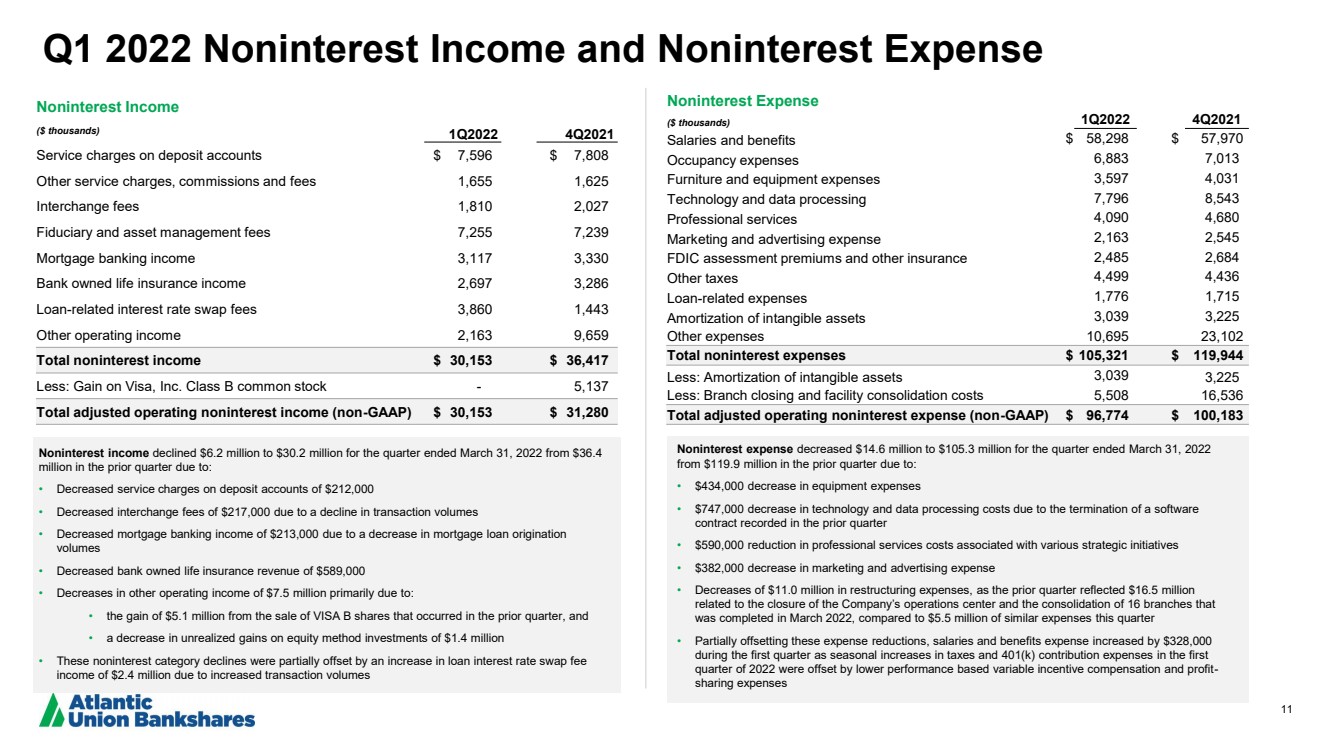
| 11 Q1 2022 Noninterest Income and Noninterest Expense Noninterest income declined $6.2 million to $30.2 million for the quarter ended March 31, 2022 from $36.4 million in the prior quarter due to: • Decreased service charges on deposit accounts of $212,000 • Decreased interchange fees of $217,000 due to a decline in transaction volumes • Decreased mortgage banking income of $213,000 due to a decrease in mortgage loan origination volumes • Decreased bank owned life insurance revenue of $589,000 • Decreases in other operating income of $7.5 million primarily due to: • the gain of $5.1 million from the sale of VISA B shares that occurred in the prior quarter, and • a decrease in unrealized gains on equity method investments of $1.4 million • These noninterest category declines were partially offset by an increase in loan interest rate swap fee income of $2.4 million due to increased transaction volumes Noninterest expense decreased $14.6 million to $105.3 million for the quarter ended March 31, 2022 from $119.9 million in the prior quarter due to: • $434,000 decrease in equipment expenses • $747,000 decrease in technology and data processing costs due to the termination of a software contract recorded in the prior quarter • $590,000 reduction in professional services costs associated with various strategic initiatives • $382,000 decrease in marketing and advertising expense • Decreases of $11.0 million in restructuring expenses, as the prior quarter reflected $16.5 million related to the closure of the Company’s operations center and the consolidation of 16 branches that was completed in March 2022, compared to $5.5 million of similar expenses this quarter • Partially offsetting these expense reductions, salaries and benefits expense increased by $328,000 during the first quarter as seasonal increases in taxes and 401(k) contribution expenses in the first quarter of 2022 were offset by lower performance based variable incentive compensation and profit - sharing expenses Noninterest Expense ($ thousands) 1Q2022 4Q2021 Salaries and benefits $ 58,298 $ 57,970 Occupancy expenses 6,883 7,013 Furniture and equipment expenses 3,597 4,031 Technology and data processing 7,796 8,543 Professional services 4,090 4,680 Marketing and advertising expense 2,163 2,545 FDIC assessment premiums and other insurance 2,485 2,684 Other taxes 4,499 4,436 Loan - related expenses 1,776 1,715 Amortization of intangible assets 3,039 3,225 Other expenses 10,695 23,102 Total noninterest expenses $ 105,321 $ 119,944 Less: Amortization of intangible assets 3,039 3,225 Less: Branch closing and facility consolidation costs 5,508 16,536 Total adjusted operating noninterest expense (non - GAAP) $ 96,774 $ 100,183 Noninterest Income ($ thousands) 1Q2022 4Q2021 Service charges on deposit accounts $ 7,596 $ 7,808 Other service charges, commissions and fees 1,655 1,625 Interchange fees 1,810 2,027 Fiduciary and asset management fees 7,255 7,239 Mortgage banking income 3,117 3,330 Bank owned life insurance income 2,697 3,286 Loan - related interest rate swap fees 3,860 1,443 Other operating income 2,163 9,659 Total noninterest income $ 30,153 $ 36,417 Less: Gain on Visa, Inc. Class B common stock - 5,137 Total adjusted operating noninterest income (non - GAAP) $ 30,153 $ 31,280 |
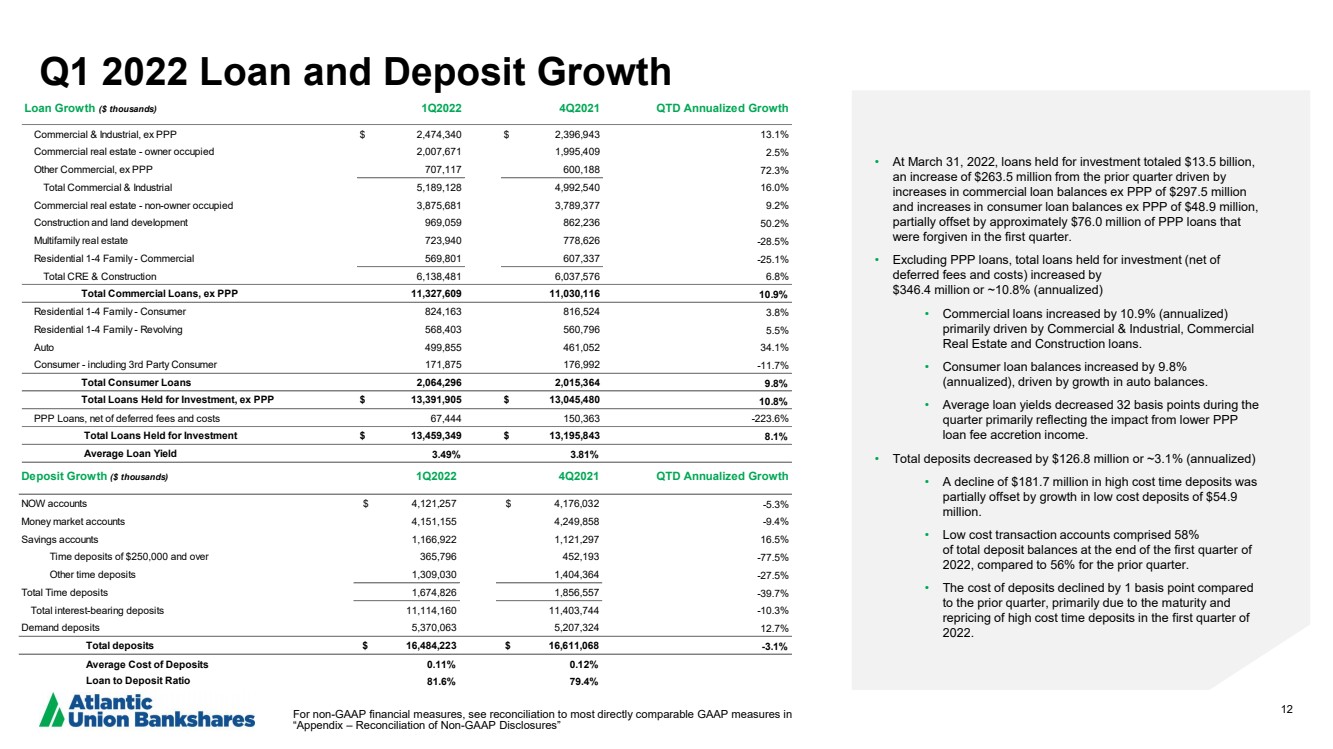
| 12 Q1 2022 Loan and Deposit Growth • At March 31, 2022, loans held for investment totaled $13.5 billion, an increase of $263.5 million from the prior quarter driven by increases in commercial loan balances ex PPP of $297.5 million and increases in consumer loan balances ex PPP of $48.9 million, partially offset by approximately $76.0 million of PPP loans that were forgiven in the first quarter. • Excluding PPP loans, total loans held for investment (net of deferred fees and costs) increased by $346.4 million or ~10.8% (annualized) • Commercial loans increased by 10.9% (annualized) primarily driven by Commercial & Industrial, Commercial Real Estate and Construction loans. • Consumer loan balances increased by 9.8% (annualized), driven by growth in auto balances. • Average loan yields decreased 32 basis points during the quarter primarily reflecting the impact from lower PPP loan fee accretion income. • Total deposits decreased by $126.8 million or ~3.1% (annualized) • A decline of $181.7 million in high cost time deposits was partially offset by growth in low cost deposits of $54.9 million. • Low cost transaction accounts comprised 58% of total deposit balances at the end of the first quarter of 2022, compared to 56% for the prior quarter. • The cost of deposits declined by 1 basis point compared to the prior quarter, primarily due to the maturity and repricing of high cost time deposits in the first quarter of 2022. For non - GAAP financial measures, see reconciliation to most directly comparable GAAP measures in “Appendix – Reconciliation of Non - GAAP Disclosures” Loan Growth ($ thousands) 1Q2022 4Q2021 QTD Annualized Growth Commercial & Industrial, ex PPP $ 2,474,340 $ 2,396,943 13.1% Commercial real estate - owner occupied 2,007,671 1,995,409 2.5% Other Commercial, ex PPP 707,117 600,188 72.3% Total Commercial & Industrial 5,189,128 4,992,540 16.0% Commercial real estate - non-owner occupied 3,875,681 3,789,377 9.2% Construction and land development 969,059 862,236 50.2% Multifamily real estate 723,940 778,626 -28.5% Residential 1-4 Family - Commercial 569,801 607,337 -25.1% Total CRE & Construction 6,138,481 6,037,576 6.8% Total Commercial Loans, ex PPP 11,327,609 11,030,116 10.9% Residential 1-4 Family - Consumer 824,163 816,524 3.8% Residential 1-4 Family - Revolving 568,403 560,796 5.5% Auto 499,855 461,052 34.1% Consumer - including 3rd Party Consumer 171,875 176,992 -11.7% Total Consumer Loans 2,064,296 2,015,364 9.8% Total Loans Held for Investment, ex PPP $ 13,391,905 $ 13,045,480 10.8% PPP Loans, net of deferred fees and costs 67,444 150,363 -223.6% Total Loans Held for Investment $ 13,459,349 $ 13,195,843 8.1% Average Loan Yield 3.49% 3.81% Deposit Growth ($ thousands) 1Q2022 4Q2021 QTD Annualized Growth NOW accounts $ 4,121,257 $ 4,176,032 -5.3% Money market accounts 4,151,155 4,249,858 -9.4% Savings accounts 1,166,922 1,121,297 16.5% Time deposits of $250,000 and over 365,796 452,193 -77.5% Other time deposits 1,309,030 1,404,364 -27.5% Total Time deposits 1,674,826 1,856,557 -39.7% Total interest-bearing deposits 11,114,160 11,403,744 -10.3% Demand deposits 5,370,063 5,207,324 12.7% Total deposits $ 16,484,223 $ 16,611,068 -3.1% Average Cost of Deposits 0.11% 0.12% Loan to Deposit Ratio 81.6% 79.4% |
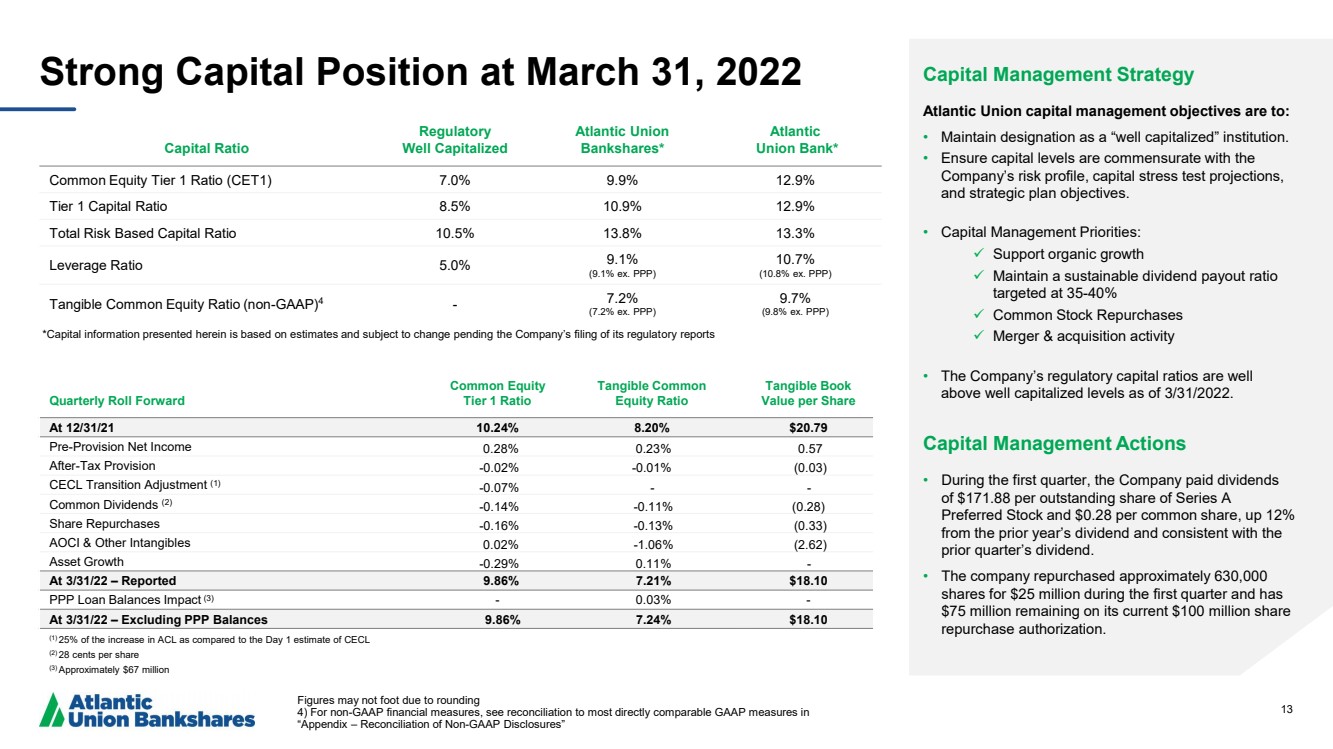
| 13 Strong Capital Position at March 31, 2022 Capital Ratio Regulatory Well Capitalized Atlantic Union Bankshares* Atlantic Union Bank* Common Equity Tier 1 Ratio (CET1) 7.0% 9.9% 12.9% Tier 1 Capital Ratio 8.5% 10.9% 12.9% Total Risk Based Capital Ratio 10.5% 13.8% 13.3% Leverage Ratio 5.0% 9.1% ( 9.1% ex. PPP) 10.7% ( 10.8% ex. PPP) Tangible Common Equity Ratio (non - GAAP) 4 - 7 ..2 % (7.2% ex. PPP) 9.7% (9.8% ex. PPP) Figures may not foot due to rounding 4) For non - GAAP financial measures, see reconciliation to most directly comparable GAAP measures in “Appendix – Reconciliation of Non - GAAP Disclosures” Capital Management Strategy Atlantic Union capital management objectives are to: • Maintain designation as a “well capitalized” institution. • Ensure capital levels are commensurate with the Company’s risk profile, capital stress test projections, and strategic plan objectives. • Capital Management Priorities: Support organic growth Maintain a sustainable dividend payout ratio targeted at 35 - 40% Common Stock Repurchases Merger & acquisition activity • The Company’s regulatory capital ratios are well above well capitalized levels as of 3/31/2022. Capital Management Actions • During the first quarter , the Company paid dividends of $171.88 per outstanding share of Series A Preferred Stock and $0.28 per common share, up 12% from the prior year’s dividend and consistent with the prior quarter’s dividend .. • The company repurchased approximately 630,000 shares for $25 million during the first quarter and has $75 million remaining on its current $100 million share repurchase authorization. Quarterly Roll Forward Common Equity Tier 1 Ratio Tangible Common Equity Ratio Tangible Book Value per Share At 12/31/21 10.24% 8.20% $ 20.79 Pre - Provision Net Income 0.28% 0.23 % 0.57 After - Tax Provision - 0.02% - 0.01% ( 0.03) CECL Transition Adjustment (1) - 0.07% - - Common Dividends (2) - 0.14% - 0.11% ( 0.28) Share Repurchases - 0.16% - 0.13% ( 0.33) AOCI & Other Intangibles 0.02 % - 1.06 % ( 2.62) Asset Growth - 0.29 % 0.11 % - At 3/31/22 – Reported 9.86% 7.21% $18.10 PPP Loan Balances Impact (3) - 0.03% - At 3/31/22 – Excluding PPP Balances 9.86% 7.24% $18.10 (1) 25% of the increase in ACL as compared to the Day 1 estimate of CECL (2) 28 cents per share (3) Approximately $67 million *Capital information presented herein is based on estimates and subject to change pending the Company’s filing of its regulat or y reports |
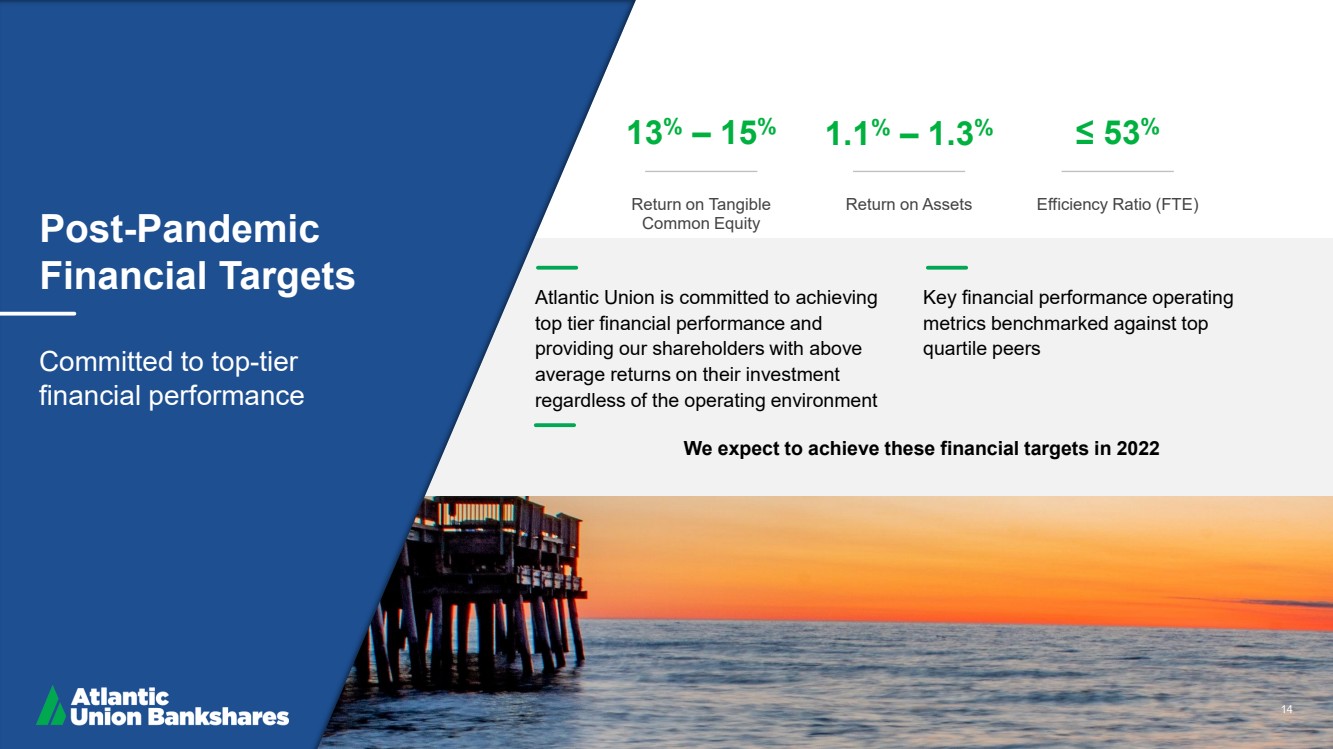
| 14 Post - Pandemic Financial Targets Committed to top - tier financial performance 13 % – 15 % Return on Tangible Common Equity 1.1 % – 1.3 % Return on Assets ≤ 53 % Efficiency Ratio (FTE) Atlantic Union is committed to achieving top tier financial performance and providing our shareholders with above average returns on their investment regardless of the operating environment Key financial performance operating metrics benchmarked against top quartile peers 14 We expect to achieve these financial targets in 2022 |
| 15 Appendix |

| 16 Reconciliation of Non - GAAP Disclosures The Company has provided supplemental performance measures on a tax - equivalent, tangible, operating, adjusted, or pre - tax pre - pr ovision basis. These non - GAAP financial measures are a supplement to GAAP, which is used to prepare the Company’s financial statements, and sho uld not be considered in isolation or as a substitute for comparable measures calculated according with GAAP .. In addition, the Company’s non - GAAP financial measures may not be comparable to non - GAAP financial measures of other companies. The Company uses the non - GAAP financ ial measures discussed herein in its analysis of the Company’s performance. The Company’s management believes that these non - GAAP fi nancial measures provide additional understanding of ongoing operations, enhance comparability of results of operations with prior pe rio ds and show the effects of significant gains and charges in the periods presented without the impact of items or events that may obscure tren ds in the Company’s underlying performance. |
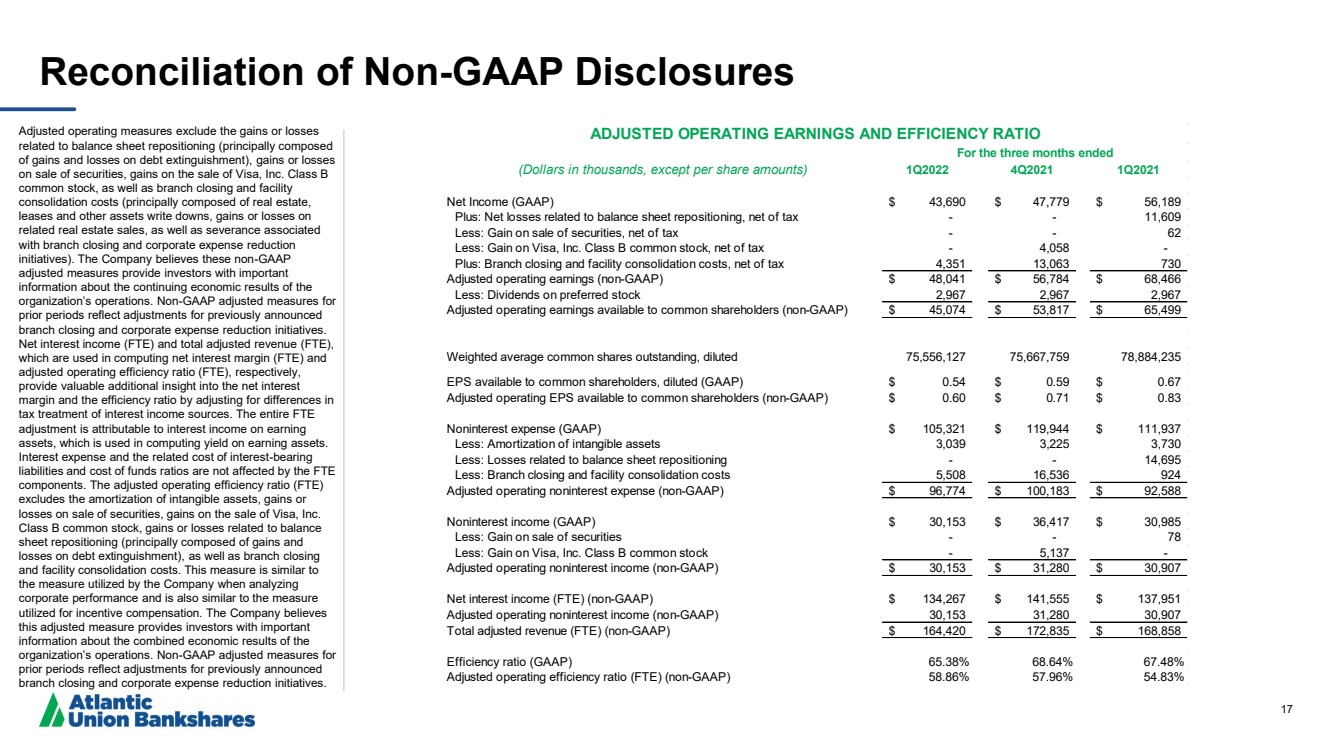
| 17 Reconciliation of Non - GAAP Disclosures Adjusted operating measures exclude the gains or losses related to balance sheet repositioning (principally composed of gains and losses on debt extinguishment), gains or losses on sale of securities, gains on the sale of Visa, Inc. Class B common stock, as well as branch closing and facility consolidation costs (principally composed of real estate, leases and other assets write downs, gains or losses on related real estate sales, as well as severance associated with branch closing and corporate expense reduction initiatives). The Company believes these non - GAAP adjusted measures provide investors with important information about the continuing economic results of the organization’s operations. Non - GAAP adjusted measures for prior periods reflect adjustments for previously announced branch closing and corporate expense reduction initiatives. Net interest income (FTE) and total adjusted revenue (FTE), which are used in computing net interest margin (FTE) and adjusted operating efficiency ratio (FTE), respectively, provide valuable additional insight into the net interest margin and the efficiency ratio by adjusting for differences in tax treatment of interest income sources. The entire FTE adjustment is attributable to interest income on earning assets, which is used in computing yield on earning assets. Interest expense and the related cost of interest - bearing liabilities and cost of funds ratios are not affected by the FTE components. The adjusted operating efficiency ratio (FTE) excludes the amortization of intangible assets, gains or losses on sale of securities, gains on the sale of Visa, Inc. Class B common stock, gains or losses related to balance sheet repositioning (principally composed of gains and losses on debt extinguishment), as well as branch closing and facility consolidation costs. This measure is similar to the measure utilized by the Company when analyzing corporate performance and is also similar to the measure utilized for incentive compensation. The Company believes this adjusted measure provides investors with important information about the combined economic results of the organization’s operations. Non - GAAP adjusted measures for prior periods reflect adjustments for previously announced branch closing and corporate expense reduction initiatives. (Dollars in thousands, except per share amounts) 1Q2022 4Q2021 1Q2021 Net Income (GAAP) 43,690 $ 47,779 $ 56,189 $ Plus: Net losses related to balance sheet repositioning, net of tax - - 11,609 Less: Gain on sale of securities, net of tax - - 62 Less: Gain on Visa, Inc. Class B common stock, net of tax - 4,058 - Plus: Branch closing and facility consolidation costs, net of tax 4,351 13,063 730 Adjusted operating earnings (non-GAAP) 48,041 $ 56,784 $ 68,466 $ Less: Dividends on preferred stock 2,967 2,967 2,967 Adjusted operating earnings available to common shareholders (non-GAAP) 45,074 $ 53,817 $ 65,499 $ Weighted average common shares outstanding, diluted 75,556,127 75,667,759 78,884,235 EPS available to common shareholders, diluted (GAAP) 0.54 $ 0.59 $ 0.67 $ Adjusted operating EPS available to common shareholders (non-GAAP) 0.60 $ 0.71 $ 0.83 $ Noninterest expense (GAAP) 105,321 $ 119,944 $ 111,937 $ Less: Amortization of intangible assets 3,039 3,225 3,730 Less: Losses related to balance sheet repositioning - - 14,695 Less: Branch closing and facility consolidation costs 5,508 16,536 924 Adjusted operating noninterest expense (non-GAAP) 96,774 $ 100,183 $ 92,588 $ Noninterest income (GAAP) 30,153 $ 36,417 $ 30,985 $ Less: Gain on sale of securities - - 78 Less: Gain on Visa, Inc. Class B common stock - 5,137 - Adjusted operating noninterest income (non-GAAP) 30,153 $ 31,280 $ 30,907 $ Net interest income (FTE) (non-GAAP) 134,267 $ 141,555 $ 137,951 $ Adjusted operating noninterest income (non-GAAP) 30,153 31,280 30,907 Total adjusted revenue (FTE) (non-GAAP) 164,420 $ 172,835 $ 168,858 $ Efficiency ratio (GAAP) 65.38% 68.64% 67.48% Adjusted operating efficiency ratio (FTE) (non-GAAP) 58.86% 57.96% 54.83% ADJUSTED OPERATING EARNINGS AND EFFICIENCY RATIO For the three months ended |
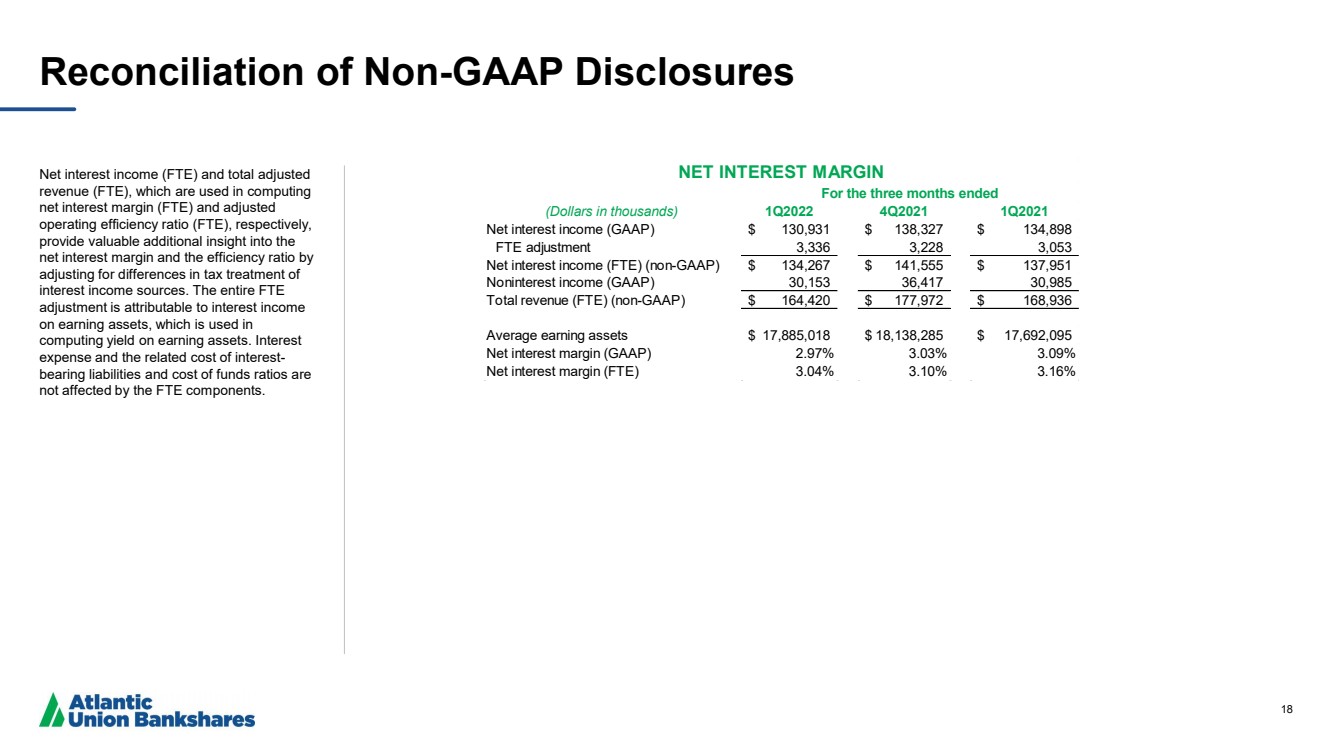
| 18 Reconciliation of Non - GAAP Disclosures Net interest income (FTE) and total adjusted revenue (FTE), which are used in computing net interest margin (FTE) and adjusted operating efficiency ratio (FTE), respectively, provide valuable additional insight into the net interest margin and the efficiency ratio by adjusting for differences in tax treatment of interest income sources. The entire FTE adjustment is attributable to interest income on earning assets, which is used in computing yield on earning assets. Interest expense and the related cost of interest - bearing liabilities and cost of funds ratios are not affected by the FTE components. (Dollars in thousands) 1Q2022 4Q2021 1Q2021 Net interest income (GAAP) 130,931 $ 138,327 $ 134,898 $ FTE adjustment 3,336 3,228 3,053 Net interest income (FTE) (non-GAAP) 134,267 $ 141,555 $ 137,951 $ Noninterest income (GAAP) 30,153 36,417 30,985 Total revenue (FTE) (non-GAAP) 164,420 $ 177,972 $ 168,936 $ Average earning assets 17,885,018 $ 18,138,285 $ 17,692,095 $ Net interest margin (GAAP) 2.97% 3.03% 3.09% Net interest margin (FTE) 3.04% 3.10% 3.16% NET INTEREST MARGIN For the three months ended |
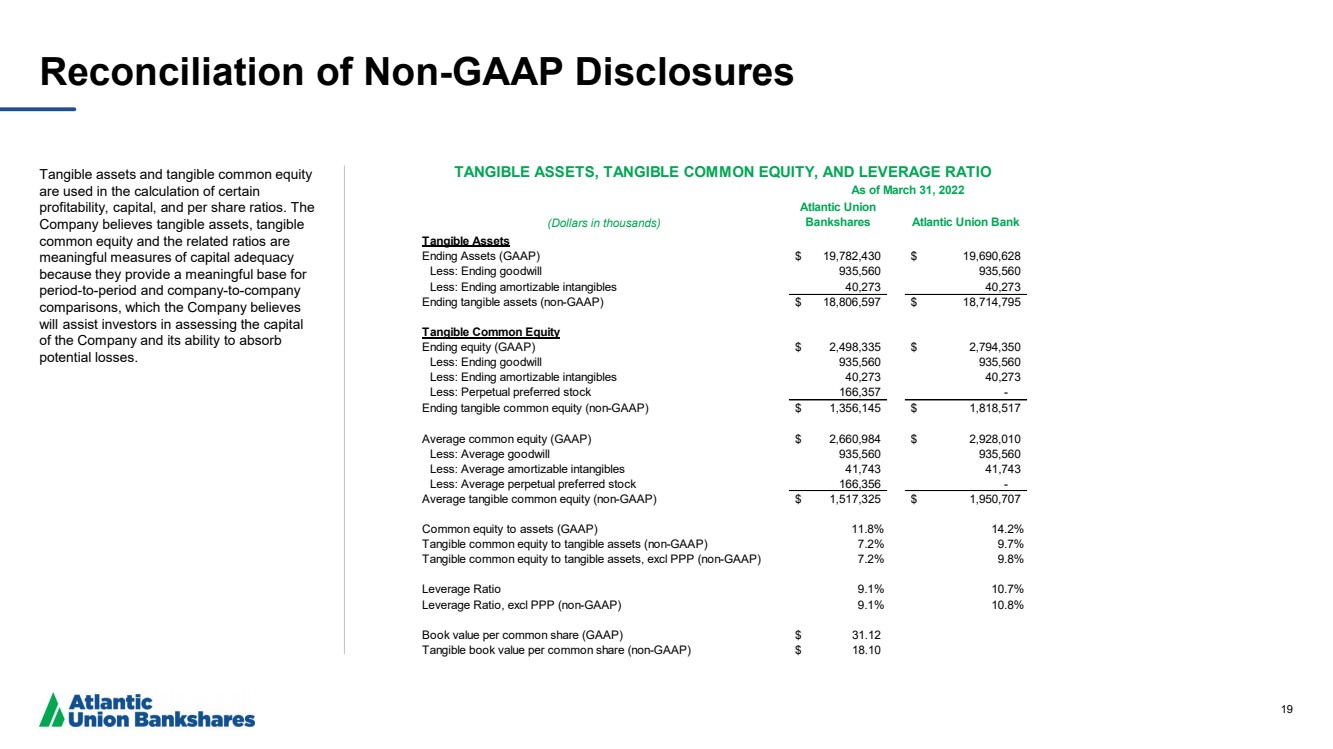
| 19 Reconciliation of Non - GAAP Disclosures Tangible assets and tangible common equity are used in the calculation of certain profitability, capital, and per share ratios. The Company believes tangible assets, tangible common equity and the related ratios are meaningful measures of capital adequacy because they provide a meaningful base for period - to - period and company - to - company comparisons, which the Company believes will assist investors in assessing the capital of the Company and its ability to absorb potential losses. (Dollars in thousands) Atlantic Union Bankshares Atlantic Union Bank Tangible Assets Ending Assets (GAAP) 19,782,430 $ 19,690,628 $ Less: Ending goodwill 935,560 935,560 Less: Ending amortizable intangibles 40,273 40,273 Ending tangible assets (non-GAAP) 18,806,597 $ 18,714,795 $ Tangible Common Equity Ending equity (GAAP) 2,498,335 $ 2,794,350 $ Less: Ending goodwill 935,560 935,560 Less: Ending amortizable intangibles 40,273 40,273 Less: Perpetual preferred stock 166,357 - Ending tangible common equity (non-GAAP) 1,356,145 $ 1,818,517 $ Average common equity (GAAP) 2,660,984 $ 2,928,010 $ Less: Average goodwill 935,560 935,560 Less: Average amortizable intangibles 41,743 41,743 Less: Average perpetual preferred stock 166,356 - Average tangible common equity (non-GAAP) 1,517,325 $ 1,950,707 $ Less: Perpetual preferred stock Common equity to assets (GAAP) 11.8% 14.2% Tangible common equity to tangible assets (non-GAAP) 7.2% 9.7% Tangible common equity to tangible assets, excl PPP (non-GAAP) 7.2% 9.8% Leverage Ratio 9.1% 10.7% Leverage Ratio, excl PPP (non-GAAP) 9.1% 10.8% Book value per common share (GAAP) 31.12 $ Tangible book value per common share (non-GAAP) 18.10 $ TANGIBLE ASSETS, TANGIBLE COMMON EQUITY, AND LEVERAGE RATIO As of March 31, 2022 |
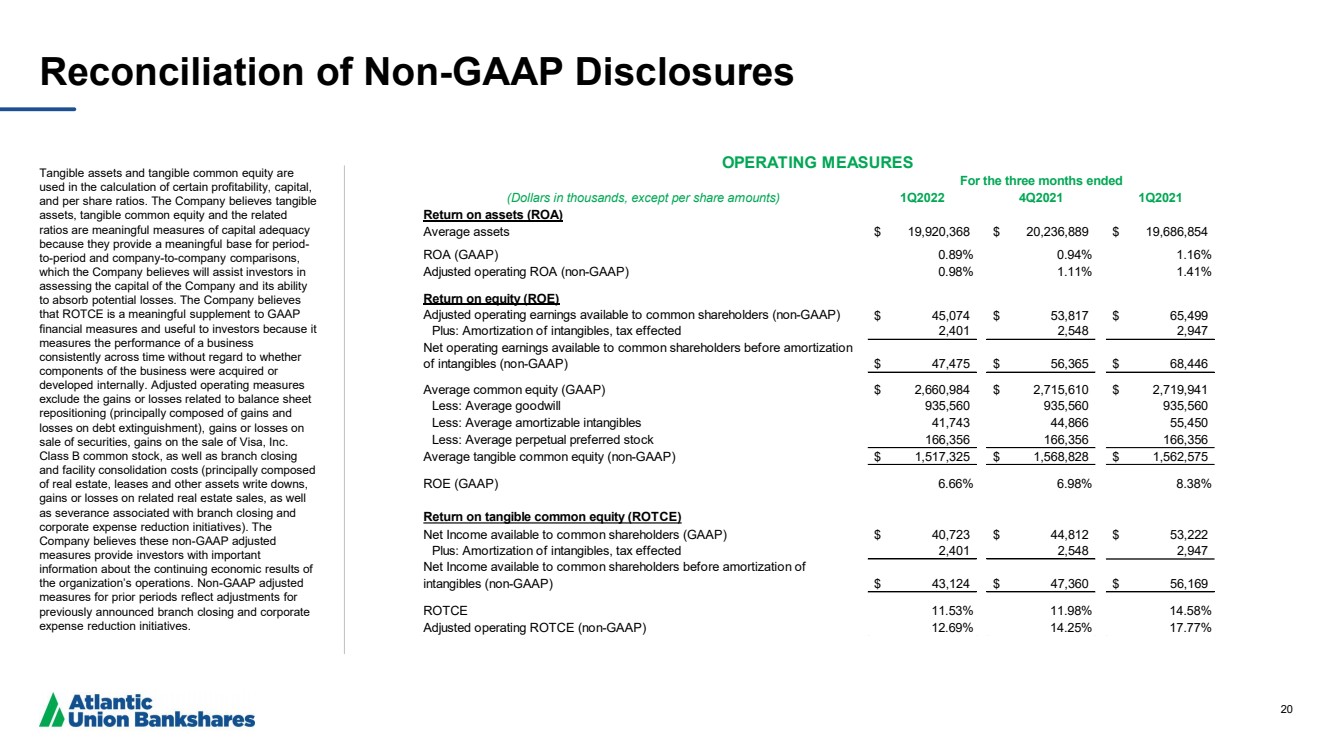
| 20 Reconciliation of Non - GAAP Disclosures Tangible assets and tangible common equity are used in the calculation of certain profitability, capital, and per share ratios. The Company believes tangible assets, tangible common equity and the related ratios are meaningful measures of capital adequacy because they provide a meaningful base for period - to - period and company - to - company comparisons, which the Company believes will assist investors in assessing the capital of the Company and its ability to absorb potential losses. The Company believes that ROTCE is a meaningful supplement to GAAP financial measures and useful to investors because it measures the performance of a business consistently across time without regard to whether components of the business were acquired or developed internally. Adjusted operating measures exclude the gains or losses related to balance sheet repositioning (principally composed of gains and losses on debt extinguishment), gains or losses on sale of securities, gains on the sale of Visa, Inc. Class B common stock, as well as branch closing and facility consolidation costs (principally composed of real estate, leases and other assets write downs, gains or losses on related real estate sales, as well as severance associated with branch closing and corporate expense reduction initiatives). The Company believes these non - GAAP adjusted measures provide investors with important information about the continuing economic results of the organization’s operations. Non - GAAP adjusted measures for prior periods reflect adjustments for previously announced branch closing and corporate expense reduction initiatives. (Dollars in thousands, except per share amounts) 1Q2022 4Q2021 1Q2021 Return on assets (ROA) Average assets 19,920,368 $ 20,236,889 $ 19,686,854 $ ROA (GAAP) 0.89% 0.94% 1.16% Adjusted operating ROA (non-GAAP) 0.98% 1.11% 1.41% Return on equity (ROE) Adjusted operating earnings available to common shareholders (non-GAAP) 45,074 $ 53,817 $ 65,499 $ Plus: Amortization of intangibles, tax effected 2,401 2,548 2,947 Net operating earnings available to common shareholders before amortization of intangibles (non-GAAP) 47,475 $ 56,365 $ 68,446 $ Average common equity (GAAP) 2,660,984 $ 2,715,610 $ 2,719,941 $ Less: Average goodwill 935,560 935,560 935,560 Less: Average amortizable intangibles 41,743 44,866 55,450 Less: Average perpetual preferred stock 166,356 166,356 166,356 Average tangible common equity (non-GAAP) 1,517,325 $ 1,568,828 $ 1,562,575 $ ROE (GAAP) 6.66% 6.98% 8.38% Return on tangible common equity (ROTCE) Net Income available to common shareholders (GAAP) 40,723 $ 44,812 $ 53,222 $ Plus: Amortization of intangibles, tax effected 2,401 2,548 2,947 Net Income available to common shareholders before amortization of intangibles (non-GAAP) 43,124 $ 47,360 $ 56,169 $ ROTCE 11.53% 11.98% 14.58% Adjusted operating ROTCE (non-GAAP) 12.69% 14.25% 17.77% OPERATING MEASURES For the three months ended |
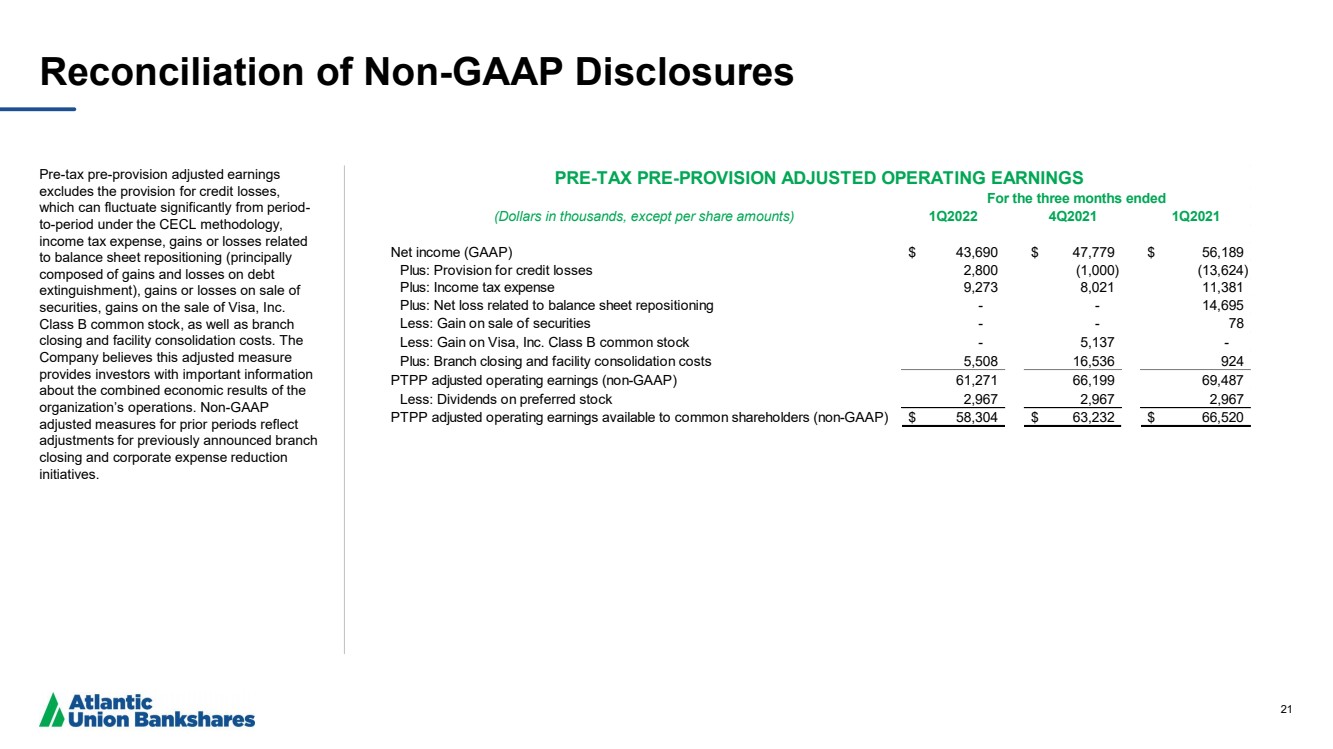
| 21 Reconciliation of Non - GAAP Disclosures Pre - tax pre - provision adjusted earnings excludes the provision for credit losses, which can fluctuate significantly from period - to - period under the CECL methodology, income tax expense, gains or losses related to balance sheet repositioning (principally composed of gains and losses on debt extinguishment), gains or losses on sale of securities, gains on the sale of Visa, Inc. Class B common stock, as well as branch closing and facility consolidation costs. The Company believes this adjusted measure provides investors with important information about the combined economic results of the organization’s operations. Non - GAAP adjusted measures for prior periods reflect adjustments for previously announced branch closing and corporate expense reduction initiatives. (Dollars in thousands, except per share amounts) 1Q2022 4Q2021 1Q2021 Net income (GAAP) 43,690 $ 47,779 $ 56,189 $ Plus: Provision for credit losses 2,800 (1,000) (13,624) Plus: Income tax expense 9,273 8,021 11,381 Plus: Net loss related to balance sheet repositioning - - 14,695 Less: Gain on sale of securities - - 78 Less: Gain on Visa, Inc. Class B common stock - 5,137 - Plus: Branch closing and facility consolidation costs 5,508 16,536 924 PTPP adjusted operating earnings (non-GAAP) 61,271 66,199 69,487 Less: Dividends on preferred stock 2,967 2,967 2,967 PTPP adjusted operating earnings available to common shareholders (non-GAAP) 58,304 $ 63,232 $ 66,520 $ PRE-TAX PRE-PROVISION ADJUSTED OPERATING EARNINGS For the three months ended |
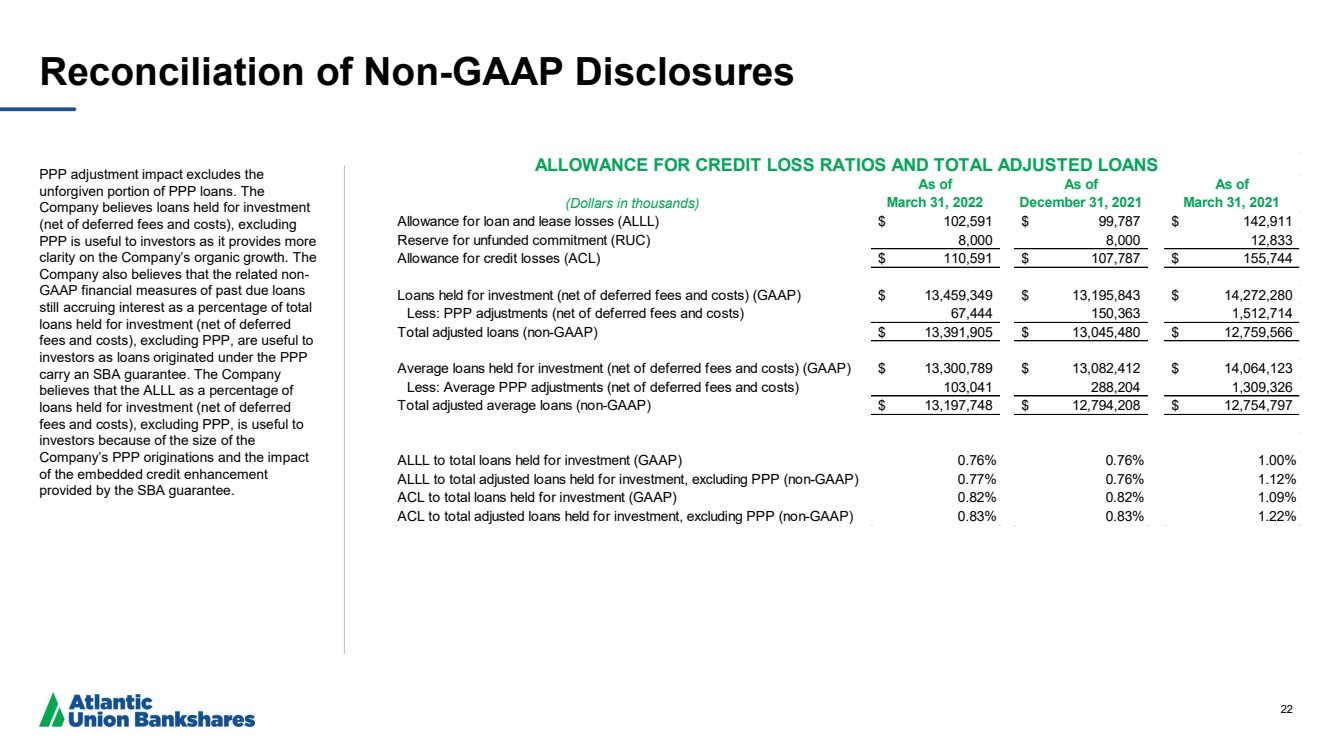
| 22 Reconciliation of Non - GAAP Disclosures PPP adjustment impact excludes the unforgiven portion of PPP loans. The Company believes loans held for investment (net of deferred fees and costs), excluding PPP is useful to investors as it provides more clarity on the Company’s organic growth. The Company also believes that the related non - GAAP financial measures of past due loans still accruing interest as a percentage of total loans held for investment (net of deferred fees and costs), excluding PPP, are useful to investors as loans originated under the PPP carry an SBA guarantee. The Company believes that the ALLL as a percentage of loans held for investment (net of deferred fees and costs), excluding PPP, is useful to investors because of the size of the Company’s PPP originations and the impact of the embedded credit enhancement provided by the SBA guarantee. (Dollars in thousands) As of March 31, 2022 As of December 31, 2021 As of March 31, 2021 Allowance for loan and lease losses (ALLL) 102,591 $ 99,787 $ 142,911 $ Reserve for unfunded commitment (RUC) 8,000 8,000 12,833 Allowance for credit losses (ACL) 110,591 $ 107,787 $ 155,744 $ Loans held for investment (net of deferred fees and costs) (GAAP) 13,459,349 $ 13,195,843 $ 14,272,280 $ Less: PPP adjustments (net of deferred fees and costs) 67,444 150,363 1,512,714 Total adjusted loans (non-GAAP) 13,391,905 $ 13,045,480 $ 12,759,566 $ Average loans held for investment (net of deferred fees and costs) (GAAP) 13,300,789 $ 13,082,412 $ 14,064,123 $ Less: Average PPP adjustments (net of deferred fees and costs) 103,041 288,204 1,309,326 Total adjusted average loans (non-GAAP) 13,197,748 $ 12,794,208 $ 12,754,797 $ ALLL to total loans held for investment (GAAP) 0.76% 0.76% 1.00% ALLL to total adjusted loans held for investment, excluding PPP (non-GAAP) 0.77% 0.76% 1.12% ACL to total loans held for investment (GAAP) 0.82% 0.82% 1.09% ACL to total adjusted loans held for investment, excluding PPP (non-GAAP) 0.83% 0.83% 1.22% ALLOWANCE FOR CREDIT LOSS RATIOS AND TOTAL ADJUSTED LOANS |