| Investor Presentation Nasdaq: AUB February - March 2022 |

| 2 Forward Looking Statements Certain statements in this presentation may constitute “forward - looking statements” within the meaning of the Private Securities Litigation Reform Act of 1995. Forward - looking statements, including without limitation, statements regarding Atlantic Union Bankshares Corporation’s (“Atlantic Union” or the “Company”) outlook on future economic conditions and the impact of the COVID - 19 pandemic, are statements that include, projections, predictions, expectations, or beliefs about future events or results that ar e not statements of historical fact. Such forward - looking statements are based on various assumptions as of the time they are made, and are inherent ly subject to known and unknown risks, uncertainties, and other factors, some of which cannot be predicted or quantified, tha t m ay cause actual results, performance, or achievements to be materially different from those expressed or implied by such forward - looking stateme nts. Forward - looking statements are often accompanied by words that convey projected future events or outcomes such as “expect,” “believe,” “estimate,” “plan,” “project,” “anticipate,” “intend,” “will,” “may,” “view,” “opportunity,” “potential,” or words of similar me aning or other statements concerning opinions or judgment of the Company and its management about future events. Although the Co mpany believes that its expectations with respect to forward - looking statements are based upon reasonable assumptions within the bounds of its exist ing knowledge of its business and operations, there can be no assurance that actual results, performance, or achievements of, or trends affecting, the Company will not differ materially from any projected future results, performance, or achievements expressed o r i mplied by such forward - looking statements. Actual future results, performance, achievements or trends may differ materially from historical results or those anticipated depending on a variety of factors, including, but not limited to the effects of or changes in: • changes in interest rates; • general economic and financial market conditions, in the United States generally and particularly in the markets in which t he Company operates and which its loans are concentrated, including the effects of declines in real estate values, an increase i n unemployment levels and slowdowns in economic growth, including as a result of COVID - 19; • the quality or composition of the loan or investment portfolios and changes therein; • demand for loan products and financial services in the Company’s market area; • the Company’s ability to manage its growth or implement its growth strategy; • the effectiveness of expense reduction plans; • the introduction of new lines of business or new products and services; • the Company’s ability to recruit and retain key employees; • the incremental cost and/or decreased revenues associated with exceeding $10 billion in assets; • real estate values in the Bank’s lending area; • an insufficient ACL; • changes in accounting principles; • the Company’s liquidity and capital positions; • concentrations of loans secured by real estate, particularly commercial real estate; • the effectiveness of the Company’s credit processes and management of the Company’s credit risk; • the Company’s ability to compete in the market for financial services and increased competition from fintech companies; • technological risks and developments, and cyber threats, attacks, or events; • the potential adverse effects of unusual and infrequently occurring events, such as weather - related disasters, terrorist acts or public health events (such as COVID - 19), and of governmental and societal responses thereto; these potential adverse effects may include, without limitation, adverse effects on the ability of the Company's borrowers to satisfy their obligations to the Co mpa ny, on the value of collateral securing loans, on the demand for the Company's loans or its other products and services, on supply c hai ns and methods used to distribute products and services, on incidents of cyberattack and fraud, on the Company’s liquidity or ca pit al positions, on risks posed by reliance on third - party service providers, on other aspects of the Company's business operations an d on financial markets and economic growth; • the effect of steps the Company takes in response to COVID - 19, the severity and duration of the pandemic, the uncertainty regarding new variants of COVID - 19 that have emerged, the speed and efficacy of vaccine and treatment developments, the impact of loosening or tightening of government restrictions, the pace of recovery when the pandemic subsides and the heightened imp act it has on many of the risks described herein; • the discontinuation of LIBOR and its impact on the financial markets, and the Company’s ability to manage operational, lega l a nd compliance risks related to the discontinuation of LIBOR and implementation of one or more alternate reference rates, • performance by the Company’s counterparties or vendors; • deposit flows; • the availability of financing and the terms thereof; • the level of prepayments on loans and mortgage - backed securities; • legislative or regulatory changes and requirements, including the impact of the CARES Act, as amended by the CAA, and other legislative and regulatory reactions to COVID - 19; • potential claims, damages, and fines related to litigation or government actions, including litigation or actions arising f rom the Company’s participation in and administration of programs related to COVID - 19, including, among other things, the CARES Act, as amended by the CAA; • the effects of changes in federal, state or local tax laws and regulations; • monetary and fiscal policies of the U.S. government, including policies of the U.S. Department of the Treasury and the Fede ral Reserve; • changes to applicable accounting principles and guidelines; and • other factors, many of which are beyond the control of the Company. Please refer to the “Risk Factors” and “Management’s Discussion and Analysis of Financial Condition and Results of Operations ” s ections of the Company’s Annual Report on Form 10 - K for the year ended December 31, 2020 and related disclosures in other filings, which have been filed with the SEC and are available on the SEC’s website at www.sec.gov. All of the forward - look ing statements made in this presentation are expressly qualified by the cautionary statements contained or referred to herein. The actual results or developments anticipated may not be realized or, even if substantially realized, they may not h ave the expected consequences to or effects on the Company or its businesses or operations. Readers are cautioned not to rely too heavily on the forward - looking statements contained in this presentation. Forward - looking statements speak only as of the da te they are made and the Company does not undertake any obligation to update, revise or clarify these forward - looking statements, whether as a result of new information, future events or otherwise. |
| 3 Additional Information Non - GAAP Financial Measures This presentation contains certain financial information determined by methods other than in accordance with generally accepted accounting principles in the United States (“GAAP”). These non - GAAP financial measures are a supplement to GAAP, which is used to prepare the Company’s financial statements, and should not be considered in isolation or as a substitute for comparable measures calculated in accordance with GAAP. In addition, the Company’s non - GAAP financial measures may not be comparable to non - GAAP financial measures of other companies. The Company uses the non - GAAP financial measures discussed herein in its analysis of the Company’s performance. The Company’s management believes that these non - GAAP financial measures provide additional understanding of ongoing operations, enhance comparability of results of operations with prior periods and show the effects of significant gains and charges in the periods presented without the impact of items or events that may obscure trends in the Company’s underlying performance. Please see “Reconciliation of Non - GAAP Disclosures” at the end of this presentation for a reconciliation to the nearest GAAP financial measure. No Offer or Solicitation This presentation does not constitute an offer to sell or a solicitation of an offer to buy any securities. No offer of securities shall be made except by means of a prospectus meeting the requirements of the Securities Act of 1933, as amended, and no offer to sell or solicitation of an offer to buy shall be made in any jurisdiction in which such offer, solicitation or sale would be unlawful. About Atlantic Union Bankshares Corporation Headquartered in Richmond, Virginia, Atlantic Union Bankshares Corporation (Nasdaq: AUB) is the holding company for Atlantic Union Bank. Atlantic Union Bank has 130 branches and approximately 150 ATMs located throughout Virginia, and in portions of Maryland and North Carolina. Certain non - bank financial services affiliates of Atlantic Union Bank include: Atlantic Union Equipment Finance, Inc., which provides equipment financing; Dixon, Hubard , Feinour & Brown, Inc., which provides investment advisory services; Atlantic Union Financial Consultants, LLC, which provides brokerage services; and Union Insurance Group, LLC, which offers various lines of insurance products. |
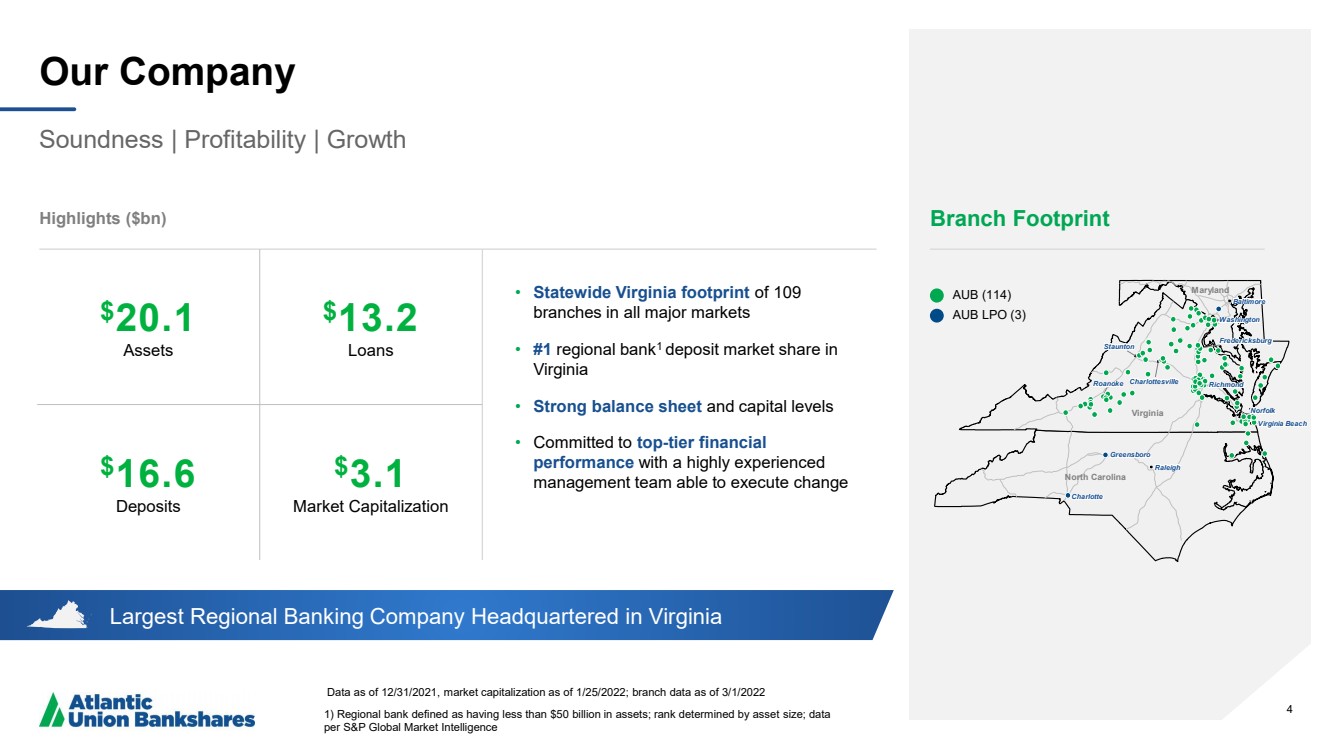
| 4 Largest Regional Banking Company Headquartered in Virginia Our Company Soundness | Profitability | Growth Data as of 12/31/2021 , market capitalization as of 1/25/2022; branch data as of 3/1/2022 1) Regional bank defined as having less than $50 billion in assets; rank determined by asset size; data per S&P Global Market Intelligence Highlights ($bn) Branch Footprint AUB ( 114) AUB LPO (3) • Statewide Virginia footprint of 109 branches in all major markets • #1 regional bank 1 deposit market share in Virginia • Strong balance sheet and capital levels • Committed to top - tier financial performance with a highly experienced management team able to execute change 4 $ 20.1 Assets $ 13.2 Loans $ 16.6 Deposits $ 3 ..1 Market Capitalization Virginia Maryland North Carolina Washington Washington Washington Washington Washington Washington Washington Washington Washington Washington Washington Washington Washington Washington Washington Washington Washington Washington Washington Washington Washington Washington Washington Washington Washington Washington Washington Washington Washington Washington Washington Washington Washington Washington Washington Washington Washington Washington Washington Washington Washington Washington Washington Washington Washington Washington Washington Washington Washington Fredericksburg Fredericksburg Fredericksburg Fredericksburg Fredericksburg Fredericksburg Fredericksburg Fredericksburg Fredericksburg Fredericksburg Fredericksburg Fredericksburg Fredericksburg Fredericksburg Fredericksburg Fredericksburg Fredericksburg Fredericksburg Fredericksburg Fredericksburg Fredericksburg Fredericksburg Fredericksburg Fredericksburg Fredericksburg Fredericksburg Fredericksburg Fredericksburg Fredericksburg Fredericksburg Fredericksburg Fredericksburg Fredericksburg Fredericksburg Fredericksburg Fredericksburg Fredericksburg Fredericksburg Fredericksburg Fredericksburg Fredericksburg Fredericksburg Fredericksburg Fredericksburg Fredericksburg Fredericksburg Fredericksburg Fredericksburg Fredericksburg Virginia Beach Virginia Beach Virginia Beach Virginia Beach Virginia Beach Virginia Beach Virginia Beach Virginia Beach Virginia Beach Virginia Beach Virginia Beach Virginia Beach Virginia Beach Virginia Beach Virginia Beach Virginia Beach Virginia Beach Virginia Beach Virginia Beach Virginia Beach Virginia Beach Virginia Beach Virginia Beach Virginia Beach Virginia Beach Virginia Beach Virginia Beach Virginia Beach Virginia Beach Virginia Beach Virginia Beach Virginia Beach Virginia Beach Virginia Beach Virginia Beach Virginia Beach Virginia Beach Virginia Beach Virginia Beach Virginia Beach Virginia Beach Virginia Beach Virginia Beach Virginia Beach Virginia Beach Virginia Beach Virginia Beach Virginia Beach Virginia Beach Norfolk Norfolk Norfolk Norfolk Norfolk Norfolk Norfolk Norfolk Norfolk Norfolk Norfolk Norfolk Norfolk Norfolk Norfolk Norfolk Norfolk Norfolk Norfolk Norfolk Norfolk Norfolk Norfolk Norfolk Norfolk Norfolk Norfolk Norfolk Norfolk Norfolk Norfolk Norfolk Norfolk Norfolk Norfolk Norfolk Norfolk Norfolk Norfolk Norfolk Norfolk Norfolk Norfolk Norfolk Norfolk Norfolk Norfolk Norfolk Norfolk Richmond Richmond Richmond Richmond Richmond Richmond Richmond Richmond Richmond Richmond Richmond Richmond Richmond Richmond Richmond Richmond Richmond Richmond Richmond Richmond Richmond Richmond Richmond Richmond Richmond Richmond Richmond Richmond Richmond Richmond Richmond Richmond Richmond Richmond Richmond Richmond Richmond Richmond Richmond Richmond Richmond Richmond Richmond Richmond Richmond Richmond Richmond Richmond Richmond Charlottesville Charlottesville Charlottesville Charlottesville Charlottesville Charlottesville Charlottesville Charlottesville Charlottesville Charlottesville Charlottesville Charlottesville Charlottesville Charlottesville Charlottesville Charlottesville Charlottesville Charlottesville Charlottesville Charlottesville Charlottesville Charlottesville Charlottesville Charlottesville Charlottesville Charlottesville Charlottesville Charlottesville Charlottesville Charlottesville Charlottesville Charlottesville Charlottesville Charlottesville Charlottesville Charlottesville Charlottesville Charlottesville Charlottesville Charlottesville Charlottesville Charlottesville Charlottesville Charlottesville Charlottesville Charlottesville Charlottesville Charlottesville Charlottesville Roanoke Roanoke Roanoke Roanoke Roanoke Roanoke Roanoke Roanoke Roanoke Roanoke Roanoke Roanoke Roanoke Roanoke Roanoke Roanoke Roanoke Roanoke Roanoke Roanoke Roanoke Roanoke Roanoke Roanoke Roanoke Roanoke Roanoke Roanoke Roanoke Roanoke Roanoke Roanoke Roanoke Roanoke Roanoke Roanoke Roanoke Roanoke Roanoke Roanoke Roanoke Roanoke Roanoke Roanoke Roanoke Roanoke Roanoke Roanoke Roanoke Staunton Staunton Staunton Staunton Staunton Staunton Staunton Staunton Staunton Staunton Staunton Staunton Staunton Staunton Staunton Staunton Staunton Staunton Staunton Staunton Staunton Staunton Staunton Staunton Staunton Staunton Staunton Staunton Staunton Staunton Staunton Staunton Staunton Staunton Staunton Staunton Staunton Staunton Staunton Staunton Staunton Staunton Staunton Staunton Staunton Staunton Staunton Staunton Staunton Baltimore Baltimore Baltimore Baltimore Baltimore Baltimore Baltimore Baltimore Baltimore Baltimore Baltimore Baltimore Baltimore Baltimore Baltimore Baltimore Baltimore Baltimore Baltimore Baltimore Baltimore Baltimore Baltimore Baltimore Baltimore Baltimore Baltimore Baltimore Baltimore Baltimore Baltimore Baltimore Baltimore Baltimore Baltimore Baltimore Baltimore Baltimore Baltimore Baltimore Baltimore Baltimore Baltimore Baltimore Baltimore Baltimore Baltimore Baltimore Baltimore Charlotte Charlotte Charlotte Charlotte Charlotte Charlotte Charlotte Charlotte Charlotte Charlotte Charlotte Charlotte Charlotte Charlotte Charlotte Charlotte Charlotte Charlotte Charlotte Charlotte Charlotte Charlotte Charlotte Charlotte Charlotte Charlotte Charlotte Charlotte Charlotte Charlotte Charlotte Charlotte Charlotte Charlotte Charlotte Charlotte Charlotte Charlotte Charlotte Charlotte Charlotte Charlotte Charlotte Charlotte Charlotte Charlotte Charlotte Charlotte Charlotte Greensboro Greensboro Greensboro Greensboro Greensboro Greensboro Greensboro Greensboro Greensboro Greensboro Greensboro Greensboro Greensboro Greensboro Greensboro Greensboro Greensboro Greensboro Greensboro Greensboro Greensboro Greensboro Greensboro Greensboro Greensboro Greensboro Greensboro Greensboro Greensboro Greensboro Greensboro Greensboro Greensboro Greensboro Greensboro Greensboro Greensboro Greensboro Greensboro Greensboro Greensboro Greensboro Greensboro Greensboro Greensboro Greensboro Greensboro Greensboro Greensboro Raleigh Raleigh Raleigh Raleigh Raleigh Raleigh Raleigh Raleigh Raleigh Raleigh Raleigh Raleigh Raleigh Raleigh Raleigh Raleigh Raleigh Raleigh Raleigh Raleigh Raleigh Raleigh Raleigh Raleigh Raleigh Raleigh Raleigh Raleigh Raleigh Raleigh Raleigh Raleigh Raleigh Raleigh Raleigh Raleigh Raleigh Raleigh Raleigh Raleigh Raleigh Raleigh Raleigh Raleigh Raleigh Raleigh Raleigh Raleigh Raleigh |
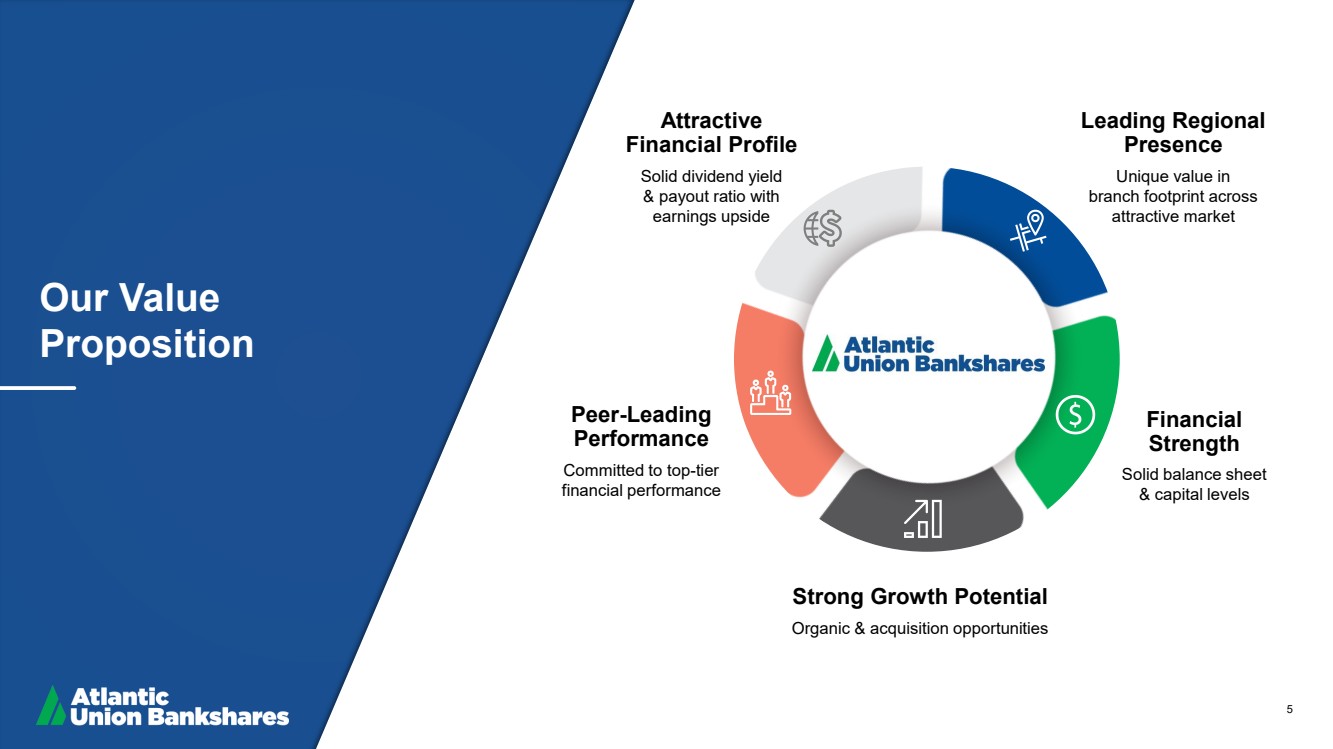
| 5 Our Value Proposition Strong Growth Potential Organic & acquisition opportunities Financial Strength Solid balance sheet & capital levels Leading Regional Presence Unique value in branch footprint across attractive market Attractive Financial Profile Solid dividend yield & payout ratio with earnings upside Peer - Leading Performance Committed to top - tier financial performance |
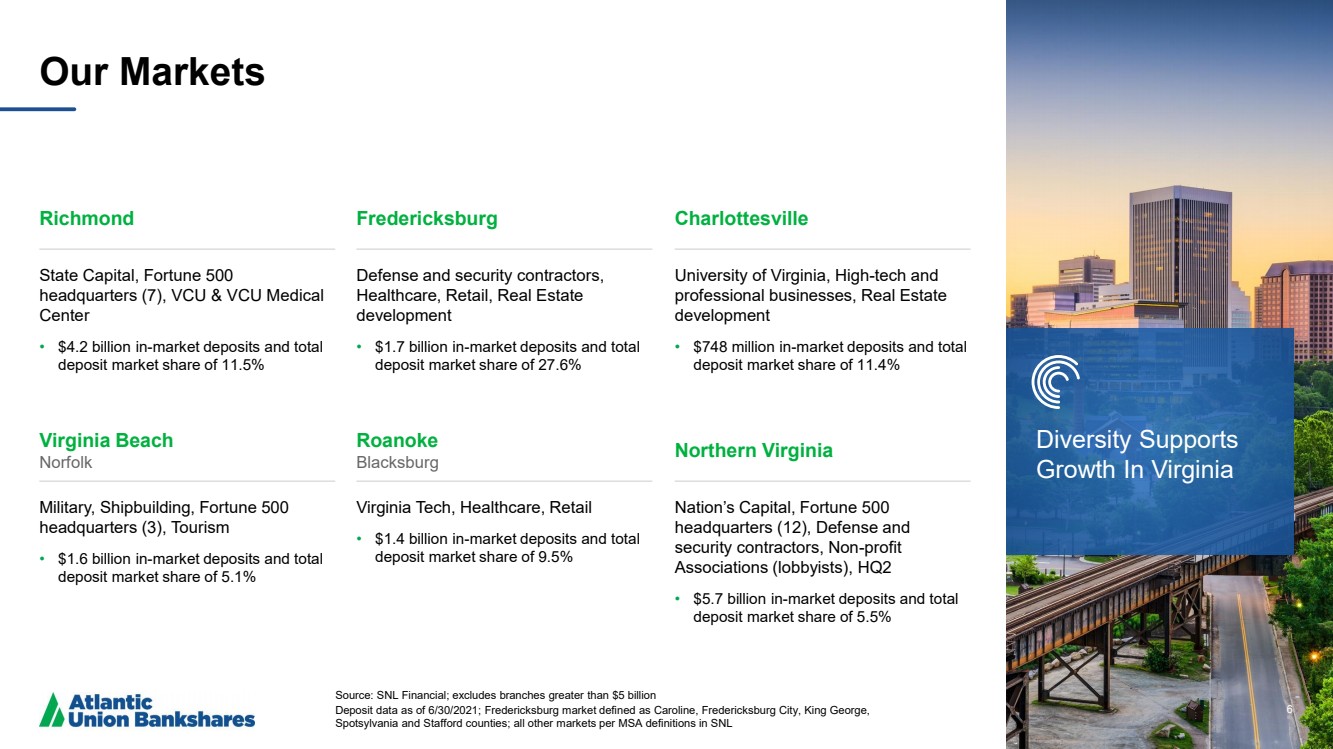
| 6 Our Markets Source: SNL Financial; excludes branches greater than $5 billion Deposit data as of 6/30/2021; Fredericksburg market defined as Caroline, Fredericksburg City, King George, Spotsylvania and Stafford counties; all other markets per MSA definitions in SNL 6 Richmond State Capital, Fortune 500 headquarters (7), VCU & VCU Medical Center • $4.2 billion in - market deposits and total deposit market share of 11.5% Fredericksburg Defense and security contractors, Healthcare, Retail, Real Estate development • $1.7 billion in - market deposits and total deposit market share of 27.6% Charlottesville University of Virginia, High - tech and professional businesses, Real Estate development • $748 million in - market deposits and total deposit market share of 11.4% Virginia Beach Norfolk Military, Shipbuilding, Fortune 500 headquarters (3), Tourism • $1.6 billion in - market deposits and total deposit market share of 5.1% Roanoke Blacksburg Virginia Tech, Healthcare, Retail • $1.4 billion in - market deposits and total deposit market share of 9.5% Northern Virginia Nation’s Capital, Fortune 500 headquarters (12), Defense and security contractors, Non - profit Associations (lobbyists), HQ2 • $5.7 billion in - market deposits and total deposit market share of 5.5% Diversity Supports Growth In Virginia |
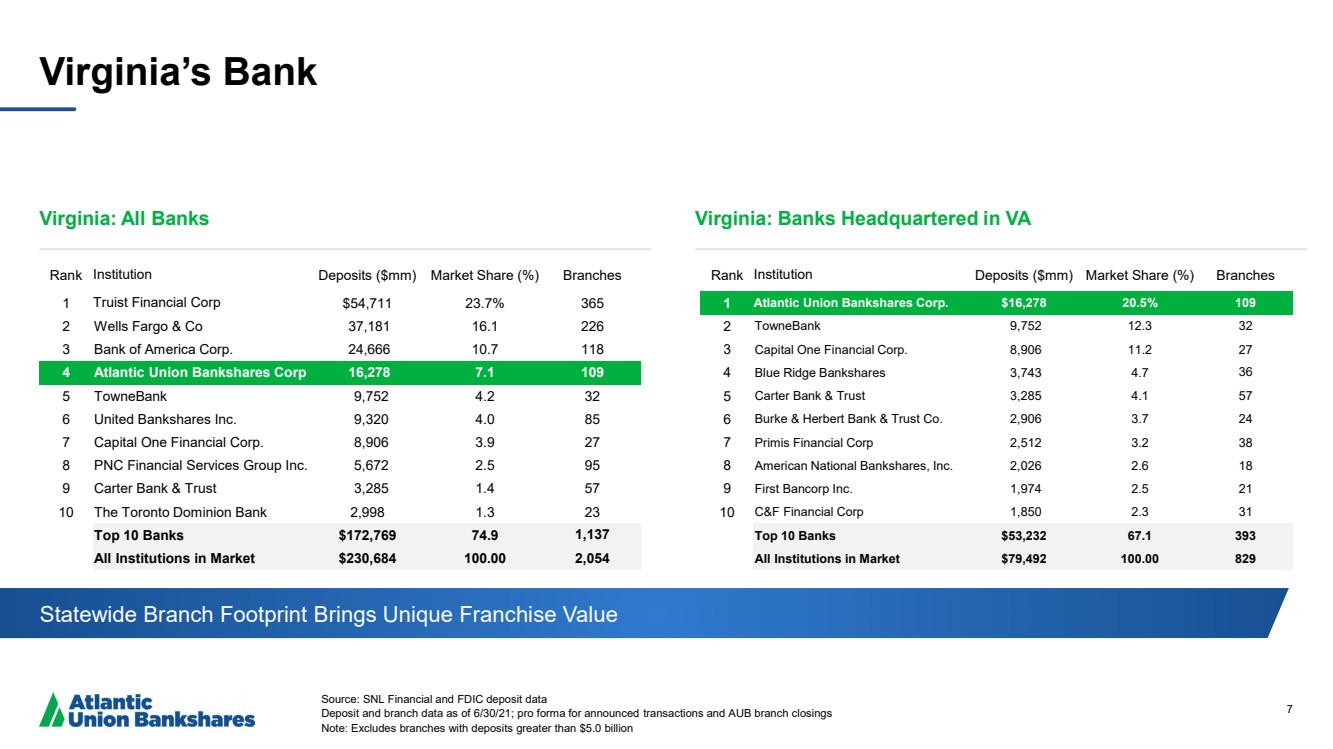
| 7 Virginia’s Bank Source: SNL Financial and FDIC deposit data Deposit and branch data as of 6/30/21; pro forma for announced transactions and AUB branch closings Note: Excludes branches with deposits greater than $5.0 billion Virginia: All Banks Virginia: Banks Headquartered in VA Statewide Branch Footprint Brings Unique Franchise Value Rank Institution Deposits ($mm) Market Share (%) Branches 1 Truist Financial Corp $54,711 23.7% 365 2 Wells Fargo & Co 37,181 16.1 226 3 Bank of America Corp. 24,666 10.7 118 4 Atlantic Union Bankshares Corp 16,278 7.1 109 5 TowneBank 9,752 4.2 32 6 United Bankshares Inc. 9,320 4.0 85 7 Capital One Financial Corp. 8,906 3.9 27 8 PNC Financial Services Group Inc. 5,672 2.5 95 9 Carter Bank & Trust 3,285 1.4 57 10 The Toronto Dominion Bank 2,998 1.3 23 Top 10 Banks $ 172,769 74.9 1,137 All Institutions in Market $230,684 100.00 2,054 Rank Institution Deposits ($mm) Market Share (%) Branches 1 Atlantic Union Bankshares Corp. $16,278 20.5% 109 2 TowneBank 9,752 12.3 32 3 Capital One Financial Corp. 8,906 11.2 27 4 Blue Ridge Bankshares 3,743 4.7 36 5 Carter Bank & Trust 3,285 4.1 57 6 Burke & Herbert Bank & Trust Co. 2,906 3.7 24 7 Primis Financial Corp 2,512 3.2 38 8 American National Bankshares, Inc. 2,026 2.6 18 9 First Bancorp Inc. 1,974 2.5 21 10 C&F Financial Corp 1,850 2.3 31 Top 10 Banks $53,232 67.1 393 All Institutions in Market $79,492 100.00 829 |
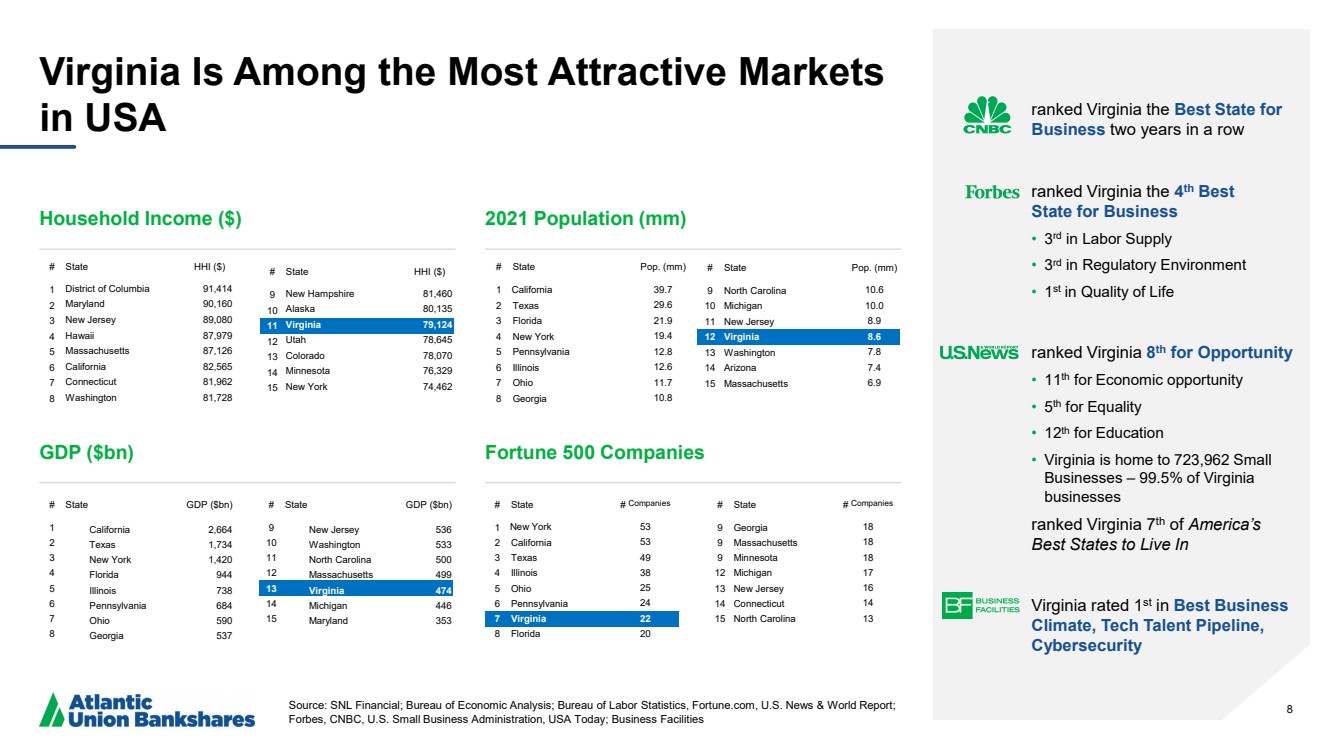
| 8 Virginia Is Among the Most Attractive Markets in USA Source: SNL Financial; Bureau of Economic Analysis; Bureau of Labor Statistics, Fortune.com , U.S. News & World Report; Forbes, CNBC, U.S. Small Business Administration, USA Today; Business Facilities 8 ranked Virginia the Best State for Business two years in a row ranked Virginia the 4 th Best State for Business • 3 rd in Labor Supply • 3 rd in Regulatory Environment • 1 st in Quality of Life ranked Virginia 8 th for Opportunity • 11 th for Economic opportunity • 5 th for Equality • 12 th for Education • Virginia is home to 723,962 Small Businesses – 99.5% of Virginia businesses ranked Virginia 7 th of America’s Best States to Live In Virginia rated 1 st in Best Business Climate, Tech Talent Pipeline, Cybersecurity # State # Companies 1 New York 53 2 California 53 3 Texas 49 4 Illinois 38 5 Ohio 25 6 Pennsylvania 24 7 Virginia 22 8 Florida 20 # State Pop. (mm) 1 California 39.7 2 Texas 29.6 3 Florida 21.9 4 New York 19.4 5 Pennsylvania 12.8 6 Illinois 12.6 7 Ohio 11.7 8 Georgia 10.8 # State HHI ($) 1 District of Columbia 91,414 2 Maryland 90,160 3 New Jersey 89,080 4 Hawaii 87,979 5 Massachusetts 87,126 6 California 82,565 7 Connecticut 81,962 8 Washington 81,728 # State GDP ($bn) 1 California 2,664 2 Texas 1,734 3 New York 1,420 4 Florida 944 5 Illinois 738 6 Pennsylvania 684 7 Ohio 590 8 Georgia 537 Household Income ($) 2021 Population (mm) # State Pop. (mm) 9 North Carolina 10.6 10 Michigan 10.0 11 New Jersey 8.9 12 Virginia 8.6 13 Washington 7.8 14 Arizona 7.4 15 Massachusetts 6.9 # State HHI ($) 9 New Hampshire 81,460 10 Alaska 80,135 11 Virginia 79,124 12 Utah 78,645 13 Colorado 78,070 14 Minnesota 76,329 15 New York 74,462 GDP ($bn) Fortune 500 Companies # State # Companies 9 Georgia 18 9 Massachusetts 18 9 Minnesota 18 12 Michigan 17 13 New Jersey 16 14 Connecticut 14 15 North Carolina 13 # State GDP ($bn) 9 New Jersey 536 10 Washington 533 11 North Carolina 500 12 Massachusetts 499 13 Virginia 474 14 Michigan 446 15 Maryland 353 |
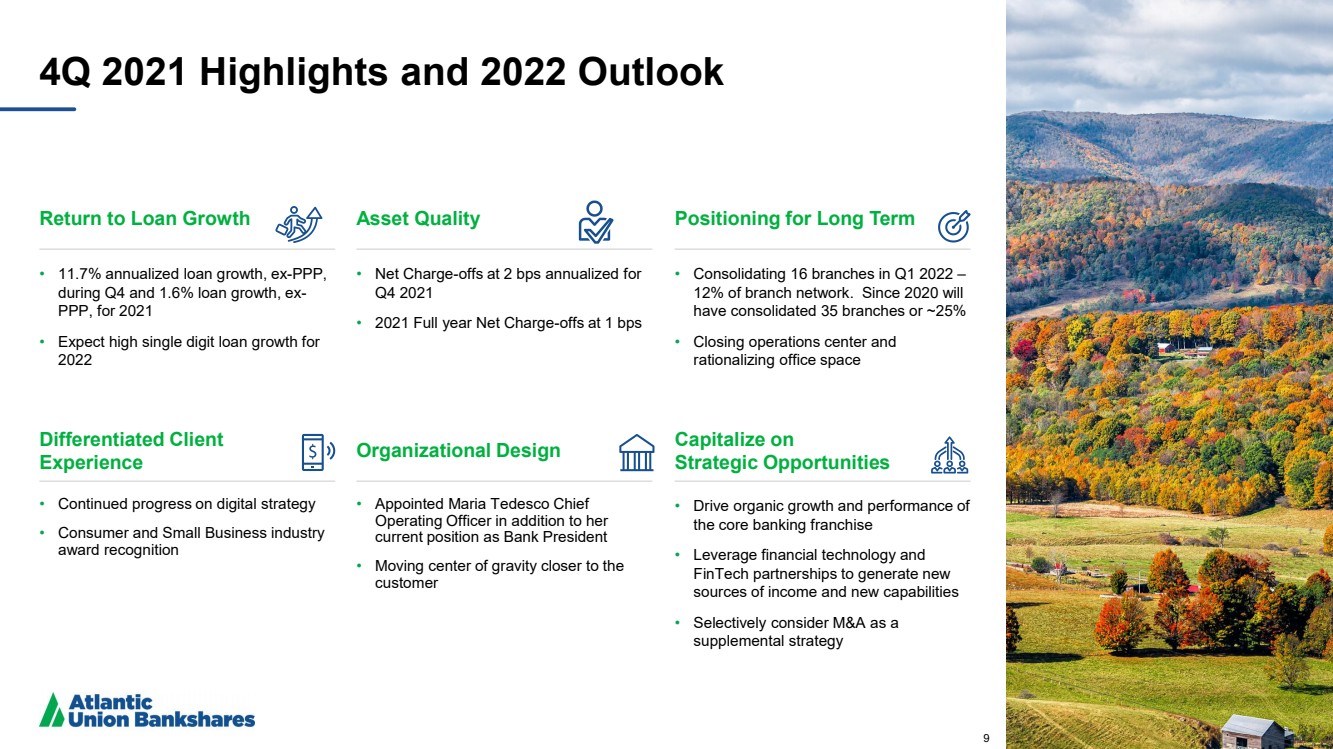
| 9 4Q 2021 Highlights and 2022 Outlook Return to Loan Growth • 11.7% annualized loan growth, ex - PPP, during Q4 and 1.6% loan growth, ex - PPP, for 2021 • Expect high single digit loan growth for 2022 Asset Quality • Net Charge - offs at 2 bps annualized for Q4 2021 • 2021 Full year Net Charge - offs at 1 bps Positioning for Long Term • Consolidating 16 branches in Q1 2022 – 12% of branch network. Since 2020 will have consolidated 35 branches or ~25% • Closing operations center and rationalizing office space Differentiated Client Experience • Continued progress on digital strategy • Consumer and Small Business industry award recognition Organizational Design • Appointed Maria Tedesco Chief Operating Officer in addition to her current position as Bank President • Moving center of gravity closer to the customer Capitalize on Strategic Opportunities • Drive organic growth and performance of the core banking franchise • Leverage financial technology and FinTech partnerships to generate new sources of income and new capabilities • Selectively consider M&A as a supplemental strategy 9 |
| 10 Caring Working together toward common goals, acting with kindness, respect and a genuine concern for others. Courageous Speaking openly, honestly and accepting our challenges and mistakes as opportunities to learn and grow. Committed Driven to help our clients, Teammates and company succeed, doing what is right and accountable for our actions. Our Core Values Culture — HOW we come together and interact as a team to accomplish our business and societal goals. Diversity, Equity, and Inclusion Statement Atlantic Union Bank embraces diversity of thought and identity to better serve our stakeholders and achieve our purpose. We commit to cultivating a welcoming workplace where Teammate and customer perspectives are valued and respected. |
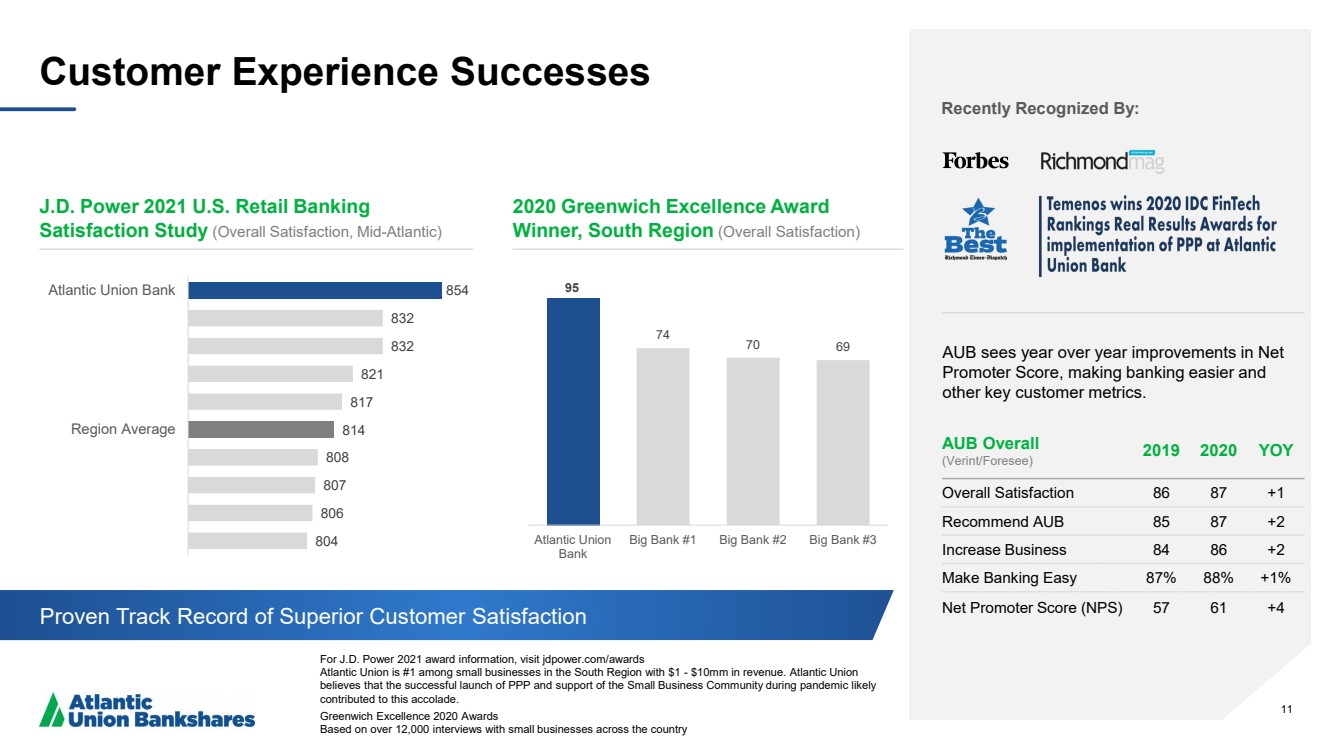
| 11 11 Customer Experience Successes For J.D. Power 2021 award information, visit jdpower.com /awards Atlantic Union is #1 among small businesses in the South Region with $1 - $10mm in revenue. Atlantic Union believes that the successful launch of PPP and support of the Small Business Community during pandemic likely contributed to this accolade. Greenwich Excellence 2020 Awards Based on over 12,000 interviews with small businesses across the country 2020 Greenwich Excellence Award Winner, South Region (Overall Satisfaction) 95 74 70 69 Atlantic Union Bank Big Bank #1 Big Bank #2 Big Bank #3 J.D. Power 2021 U.S. Retail Banking Satisfaction Study (Overall Satisfaction, Mid - Atlantic) AUB Overall ( Verint /Foresee) 2019 2020 YOY Overall Satisfaction 86 87 +1 Recommend AUB 85 87 +2 Increase Business 84 86 +2 Make Banking Easy 87% 88% +1% Net Promoter Score (NPS) 57 61 +4 AUB sees year over year improvements in Net Promoter Score, making banking easier and other key customer metrics. Recently Recognized By: 854 832 832 821 817 814 808 807 806 804 Atlantic Union Bank Region Average Proven Track Record of Superior Customer Satisfaction |
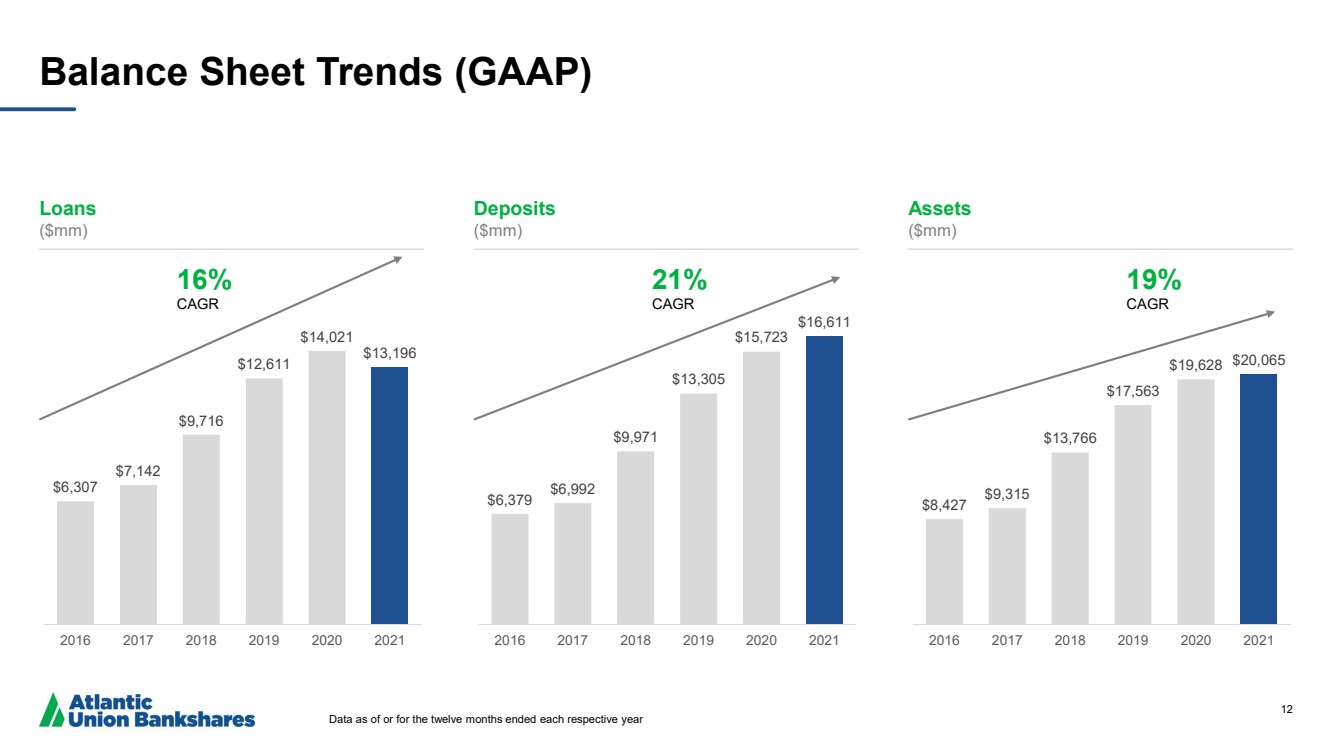
| 12 Balance Sheet Trends (GAAP) Data as of or for the twelve months ended each respective year Loans ($mm) Deposits ($mm) Assets ($mm) $6,307 $7,142 $9,716 $12,611 $14,021 $13,196 2016 2017 2018 2019 2020 2021 16 % CAGR $6,379 $6,992 $9,971 $13,305 $15,723 $16,611 2016 2017 2018 2019 2020 2021 21 % CAGR $8,427 $9,315 $13,766 $17,563 $19,628 $20,065 2016 2017 2018 2019 2020 2021 19 % CAGR |
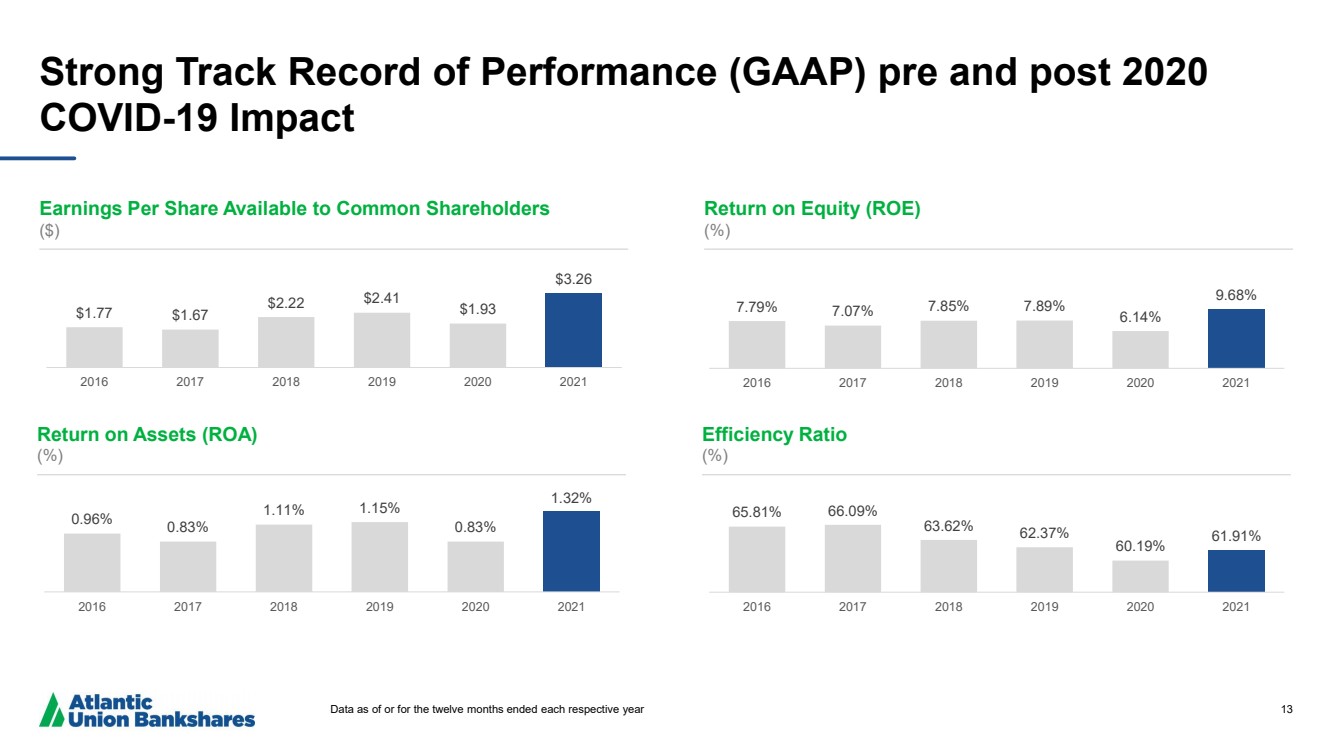
| 13 Strong Track Record of Performance (GAAP) pre and post 2020 COVID - 19 Impact Data as of or for the twelve months ended each respective year Earnings Per Share Available to Common Shareholders ($) Return on Equity (ROE) (%) Return on Assets (ROA) (%) Efficiency Ratio (%) $1.77 $1.67 $2.22 $2.41 $1.93 $3.26 2016 2017 2018 2019 2020 2021 7.79% 7.07% 7.85% 7.89% 6.14% 9.68% 2016 2017 2018 2019 2020 2021 65.81% 66.09% 63.62% 62.37% 60.19% 61.91% 2016 2017 2018 2019 2020 2021 0.96% 0.83% 1.11% 1.15% 0.83% 1.32% 2016 2017 2018 2019 2020 2021 |
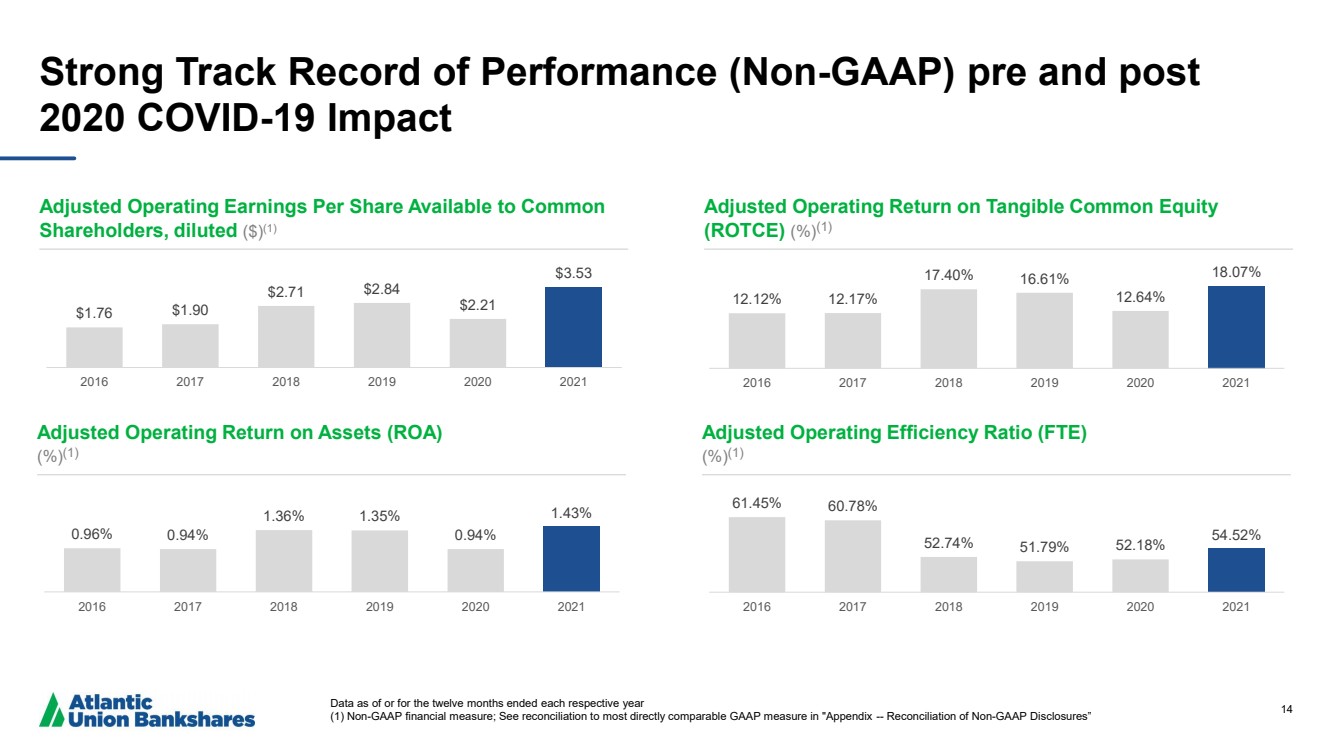
| 14 Strong Track Record of Performance (Non - GAAP) pre and post 2020 COVID - 19 Impact Data as of or for the twelve months ended each respective year (1) Non - GAAP financial measure; See reconciliation to most directly comparable GAAP measure in "Appendix -- Reconciliation of No n - GAAP Disclosures” Adjusted Operating Earnings Per Share Available to Common Shareholders, diluted ($) (1) Adjusted Operating Return on Tangible Common Equity (ROTCE) (%) (1) Adjusted Operating Return on Assets (ROA) (%) (1) Adjusted Operating Efficiency Ratio (FTE) (%) (1) $1.76 $1.90 $2.71 $2.84 $2.21 $3.53 2016 2017 2018 2019 2020 2021 12.12% 12.17% 17.40% 16.61% 12.64% 18.07% 2016 2017 2018 2019 2020 2021 61.45% 60.78% 52.74% 51.79% 52.18% 54.52% 2016 2017 2018 2019 2020 2021 0.96% 0.94% 1.36% 1.35% 0.94% 1.43% 2016 2017 2018 2019 2020 2021 |
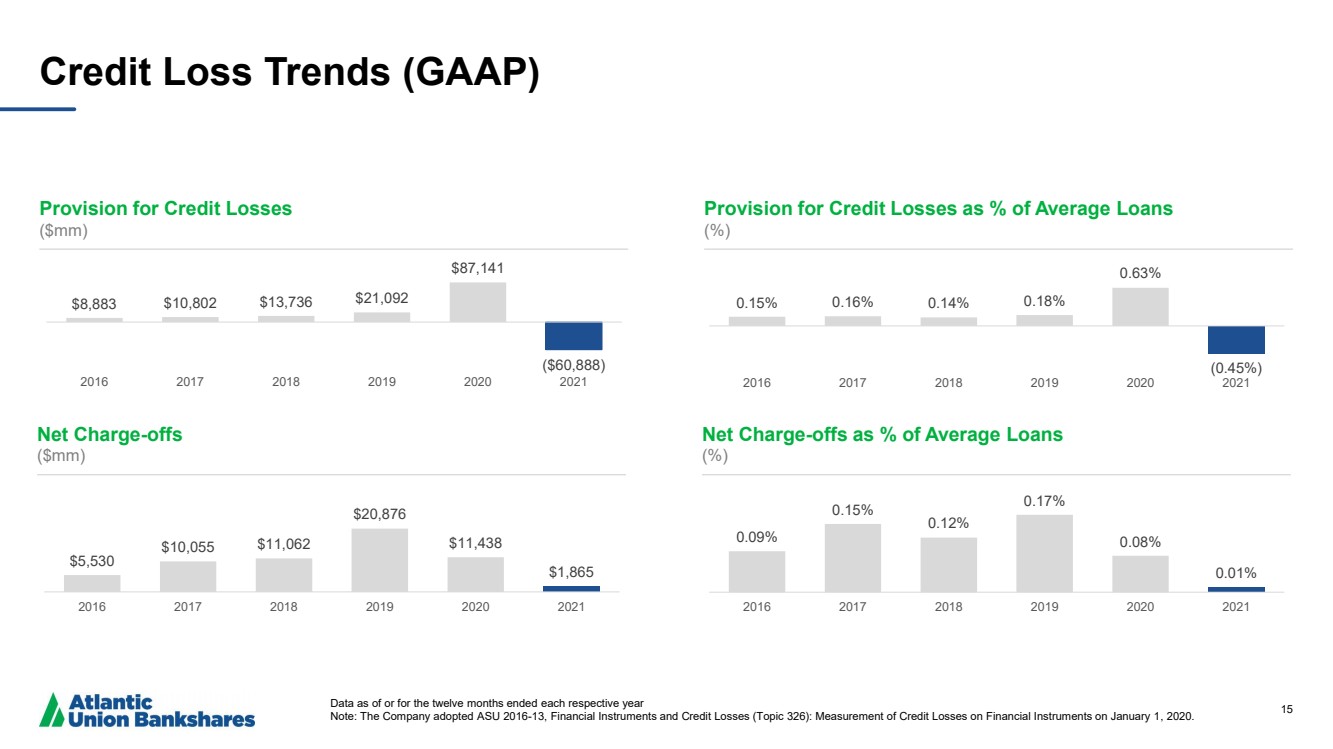
| 15 Credit Loss Trends (GAAP) Data as of or for the twelve months ended each respective year Note : The Company adopted ASU 2016 - 13, Financial Instruments and Credit Losses (Topic 326): Measurement of Credit Losses on Financial Instruments on January 1 , 2020. Provision for Credit Losses ($mm) Provision for Credit Losses as % of Average Loans (%) Net Charge - offs ($mm) Net Charge - offs as % of Average Loans (%) $8,883 $10,802 $13,736 $21,092 $87,141 ($60,888) 2016 2017 2018 2019 2020 2021 0.15% 0.16% 0.14% 0.18% 0.63% (0.45%) 2016 2017 2018 2019 2020 2021 0.09% 0.15% 0.12% 0.17% 0.08% 0.01% 2016 2017 2018 2019 2020 2021 $5,530 $10,055 $11,062 $20,876 $11,438 $1,865 2016 2017 2018 2019 2020 2021 |
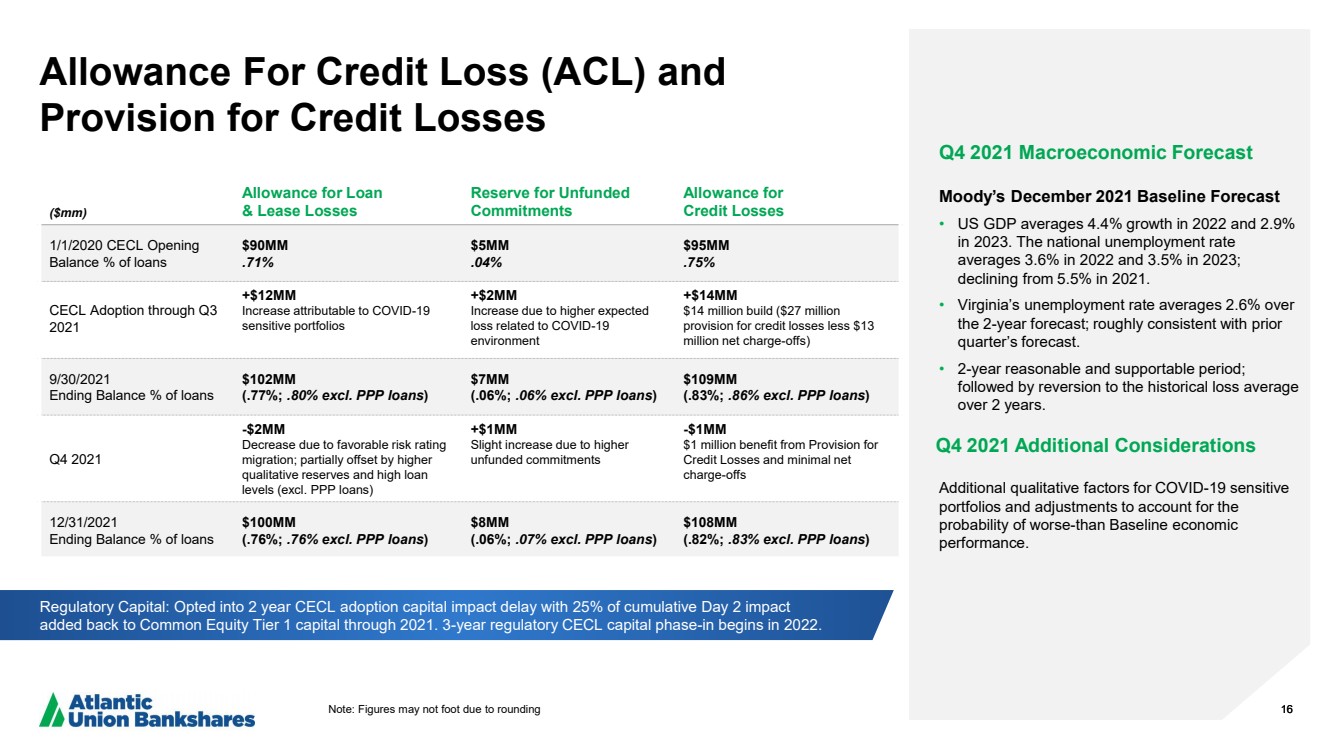
| 16 Allowance For Credit Loss (ACL) and Provision for Credit Losses Note: Figures may not foot due to rounding 16 Q4 2021 Macroeconomic Forecast Moody’s December 2021 Baseline Forecast • US GDP averages 4.4% growth in 2022 and 2.9% in 2023. The national unemployment rate averages 3.6 % in 2022 and 3.5% in 2023; declining from 5.5% in 2021. • Virginia’s unemployment rate averages 2.6% over the 2 - year forecast; roughly consistent with prior quarter’s forecast. • 2 - year reasonable and supportable period; followed by reversion to the historical loss average over 2 years. Q4 2021 Additional Considerations Additional qualitative factors for COVID - 19 sensitive portfolios and adjustments to account for the probability of worse - than Baseline economic performance. Regulatory Capital: Opted into 2 year CECL adoption capital impact delay with 25% of cumulative Day 2 impact added back to Common Equity Tier 1 capital through 2021. 3 - year regulatory CECL capital phase - in begins in 2022. ($mm) Allowance for Loan & Lease Losses Reserve for Unfunded Commitments Allowance for Credit Losses 1/1/2020 CECL Opening Balance % of loans $90MM ..71% $5MM ..04% $95MM ..75% CECL Adoption through Q3 2021 +$12MM Increase attributable to COVID - 19 sensitive portfolios +$2MM Increase due to higher expected loss related to COVID - 19 environment +$14MM $14 million build ($27 million provision for credit losses less $13 million net charge - offs) 9 /30/2021 Ending Balance % of loans $102MM (.77%; ..80% excl. PPP loans ) $7MM (.06%; ..06% excl. PPP loans ) $109MM (.83%; ..86% excl. PPP loans ) Q4 2021 - $2MM Decrease due to favorable risk rating migration; partially offset by higher qualitative reserves and high loan levels (excl. PPP loans) +$ 1 MM Slight increase due to higher unfunded commitments - $1MM $1 million benefit from Provision for Credit Losses and minimal net charge - offs 12/31/2021 Ending Balance % of loans $ 100MM (. 76%; ..76% excl. PPP loans ) $8MM (.06 %; ..07% excl. PPP loans ) $ 108MM (. 82 %; ..83% excl. PPP loans ) |
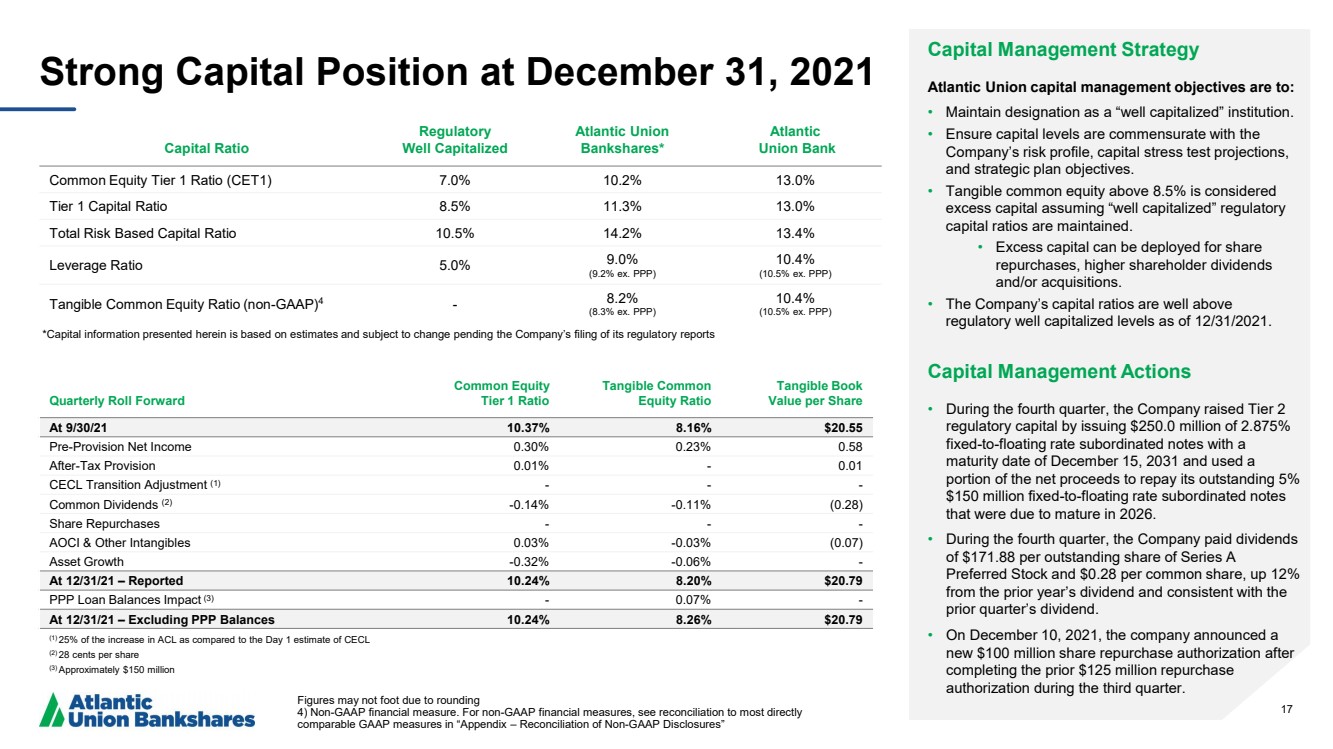
| 17 Strong Capital Position at December 31, 2021 Capital Ratio Regulatory Well Capitalized Atlantic Union Bankshares* Atlantic Union Bank Common Equity Tier 1 Ratio (CET1) 7.0% 10.2% 13.0% Tier 1 Capital Ratio 8.5% 11.3% 13.0% Total Risk Based Capital Ratio 10.5% 14.2% 13.4% Leverage Ratio 5.0% 9.0% ( 9.2% ex. PPP) 10.4% ( 10.5% ex. PPP) Tangible Common Equity Ratio (non - GAAP) 4 - 8.2% ( 8.3% ex. PPP) 10.4% ( 10.5% ex. PPP) Figures may not foot due to rounding 4) Non - GAAP financial measure. For non - GAAP financial measures, see reconciliation to most directly comparable GAAP measures in “Appendix – Reconciliation of Non - GAAP Disclosures” Capital Management Strategy Atlantic Union capital management objectives are to: • Maintain designation as a “well capitalized” institution. • Ensure capital levels are commensurate with the Company’s risk profile, capital stress test projections, and strategic plan objectives. • Tangible common equity above 8.5% is considered excess capital assuming “well capitalized” regulatory capital ratios are maintained. • Excess capital can be deployed for share repurchases, higher shareholder dividends and/or acquisitions. • The Company’s capital ratios are well above regulatory well capitalized levels as of 12/31/2021 .. Capital Management Actions • During the fourth quarter, the Company raised Tier 2 regulatory capital by issuing $250.0 million of 2.875% fixed - to - floating rate subordinated notes with a maturity date of December 15, 2031 and used a portion of the net proceeds to repay its outstanding 5% $150 million fixed - to - floating rate subordinated notes that were due to mature in 2026 .. • During the fourth quarter, the Company paid dividends of $171.88 per outstanding share of Series A Preferred Stock and $0.28 per common share, up 12% from the prior year’s dividend and consistent with the prior quarter’s dividend .. • On December 10, 2021, the company announced a new $100 million share repurchase authorization after completing the prior $125 million repurchase authorization during the third quarter. Quarterly Roll Forward Common Equity Tier 1 Ratio Tangible Common Equity Ratio Tangible Book Value per Share At 9/30/21 10.37% 8.16% $ 20.55 Pre - Provision Net Income 0.30% 0.23% 0.58 After - Tax Provision 0.01% - 0.01 CECL Transition Adjustment (1) - - - Common Dividends (2) - 0.14% - 0.11% ( 0.28) Share Repurchases - - - AOCI & Other Intangibles 0.03% - 0.03% ( 0.07) Asset Growth - 0.32% - 0.06% - At 12/31/21 – Reported 10.24% 8.20% $ 20.79 PPP Loan Balances Impact (3) - 0.07% - At 12/31/21 – Excluding PPP Balances 10.24% 8.26% $ 20.79 (1) 25% of the increase in ACL as compared to the Day 1 estimate of CECL (2) 28 cents per share (3) Approximately $150 million *Capital information presented herein is based on estimates and subject to change pending the Company’s filing of its regulat or y reports |
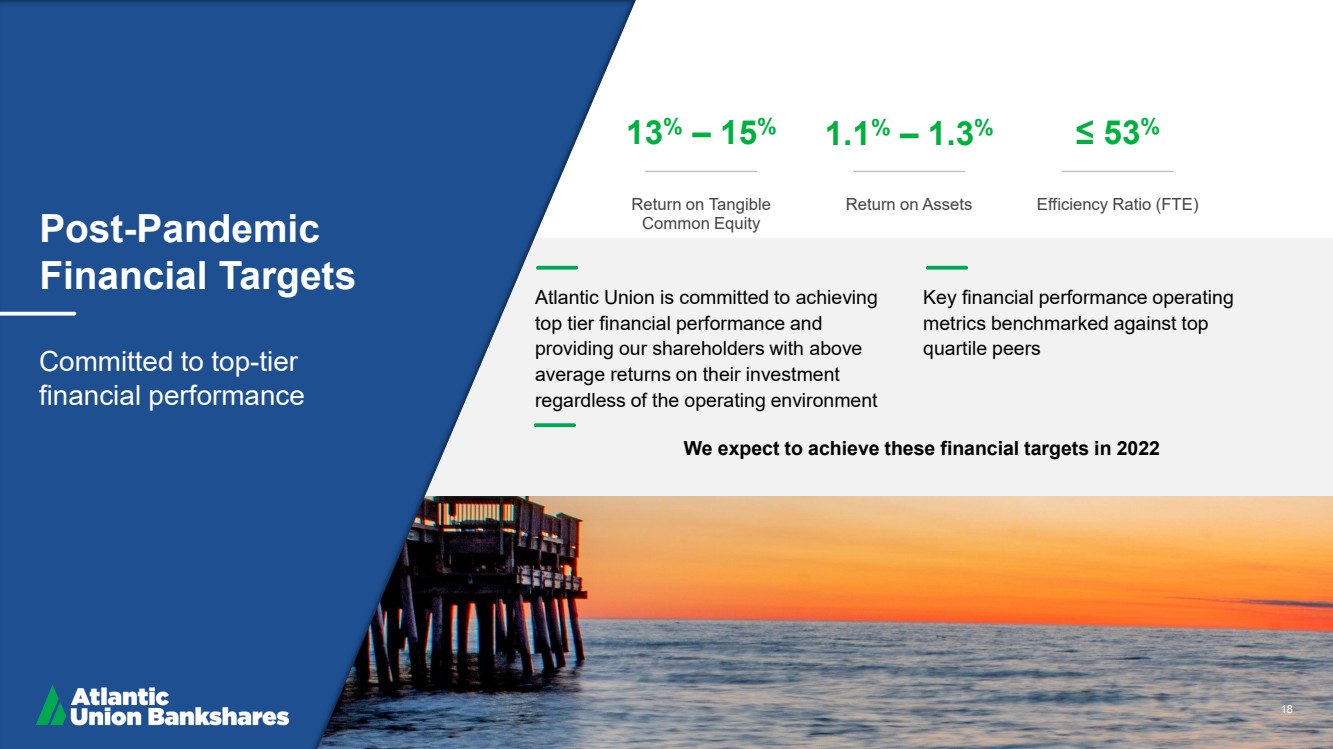
| 18 Post - Pandemic Financial Targets Committed to top - tier financial performance 13 % – 15 % Return on Tangible Common Equity 1.1 % – 1.3 % Return on Assets ≤ 53 % Efficiency Ratio (FTE) Atlantic Union is committed to achieving top tier financial performance and providing our shareholders with above average returns on their investment regardless of the operating environment Key financial performance operating metrics benchmarked against top quartile peers 18 We expect to achieve these financial targets in 2022 |
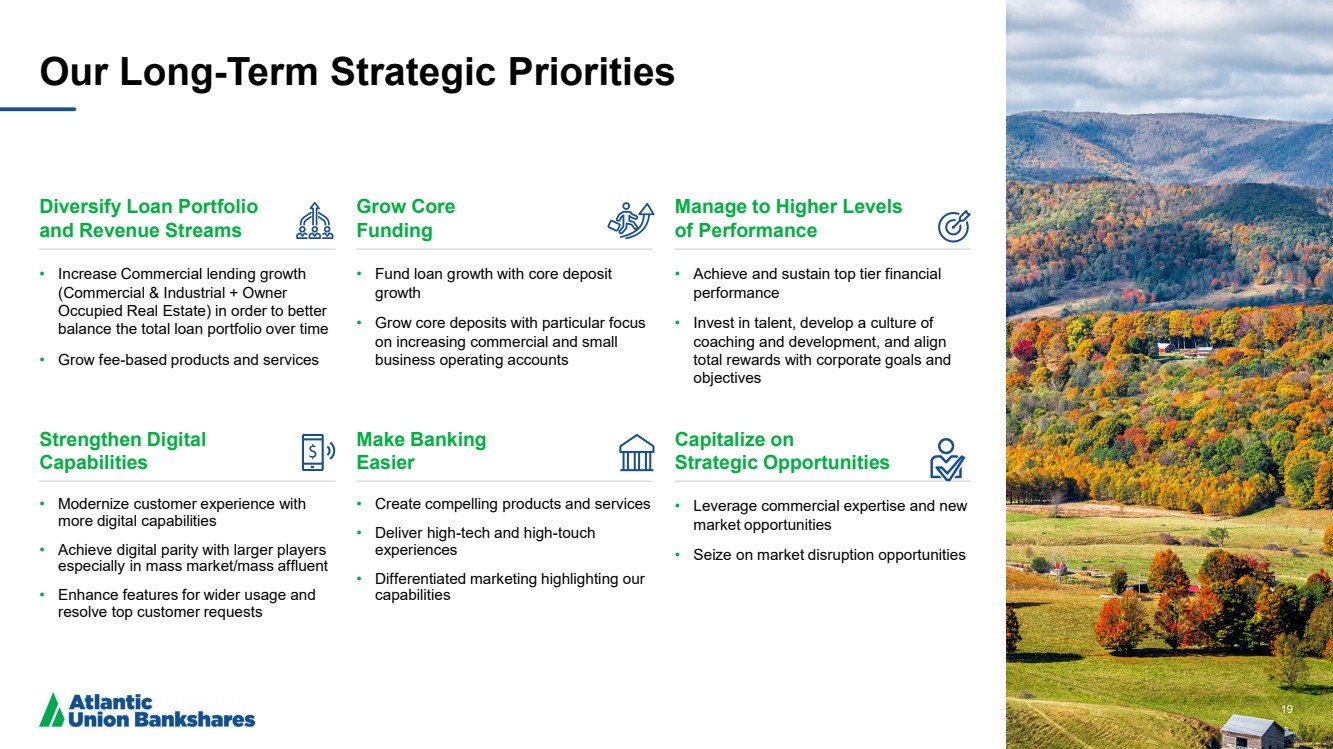
| 19 Our Long - Term Strategic Priorities Diversify Loan Portfolio and Revenue Streams • Increase Commercial lending growth (Commercial & Industrial + Owner Occupied Real Estate) in order to better balance the total loan portfolio over time • Grow fee - based products and services Grow Core Funding • Fund loan growth with core deposit growth • Grow core deposits with particular focus on increasing commercial and small business operating accounts Manage to Higher Levels of Performance • Achieve and sustain top tier financial performance • Invest in talent, develop a culture of coaching and development, and align total rewards with corporate goals and objectives Strengthen Digital Capabilities • Modernize customer experience with more digital capabilities • Achieve digital parity with larger players especially in mass market/mass affluent • Enhance features for wider usage and resolve top customer requests Make Banking Easier • Create compelling products and services • Deliver high - tech and high - touch experiences • Differentiated marketing highlighting our capabilities Capitalize on Strategic Opportunities • Leverage commercial expertise and new market opportunities • Seize on market disruption opportunities 19 |
| 20 Appendix |

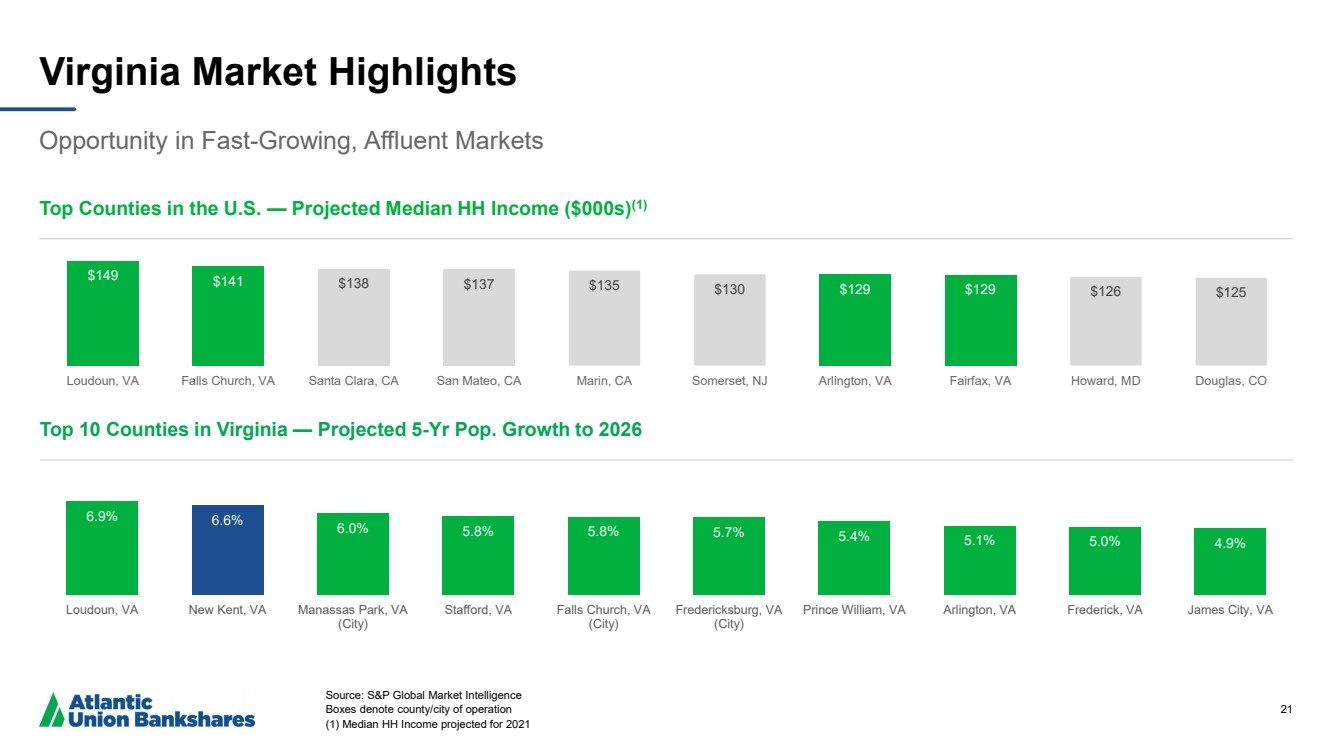
| 21 Virginia Market Highlights Opportunity in Fast - Growing, Affluent Markets Source: S&P Global Market Intelligence Boxes denote county/city of operation (1) Median HH Income projected for 2021 Top Counties in the U.S. — Projected Median HH Income ($000s) (1) Top 10 Counties in Virginia — Projected 5 - Yr Pop. Growth to 2026 $149 $141 $138 $137 $135 $130 $ 129 $129 $126 $125 Loudoun, VA Falls Church, VA Santa Clara, CA San Mateo, CA Marin, CA Somerset, NJ Arlington, VA Fairfax, VA Howard, MD Douglas, CO 6.9% 6.6% 6.0% 5.8% 5.8% 5.7% 5.4% 5.1% 5.0% 4.9% Loudoun, VA New Kent, VA Manassas Park, VA (City) Stafford, VA Falls Church, VA (City) Fredericksburg, VA (City) Prince William, VA Arlington, VA Frederick, VA James City, VA |
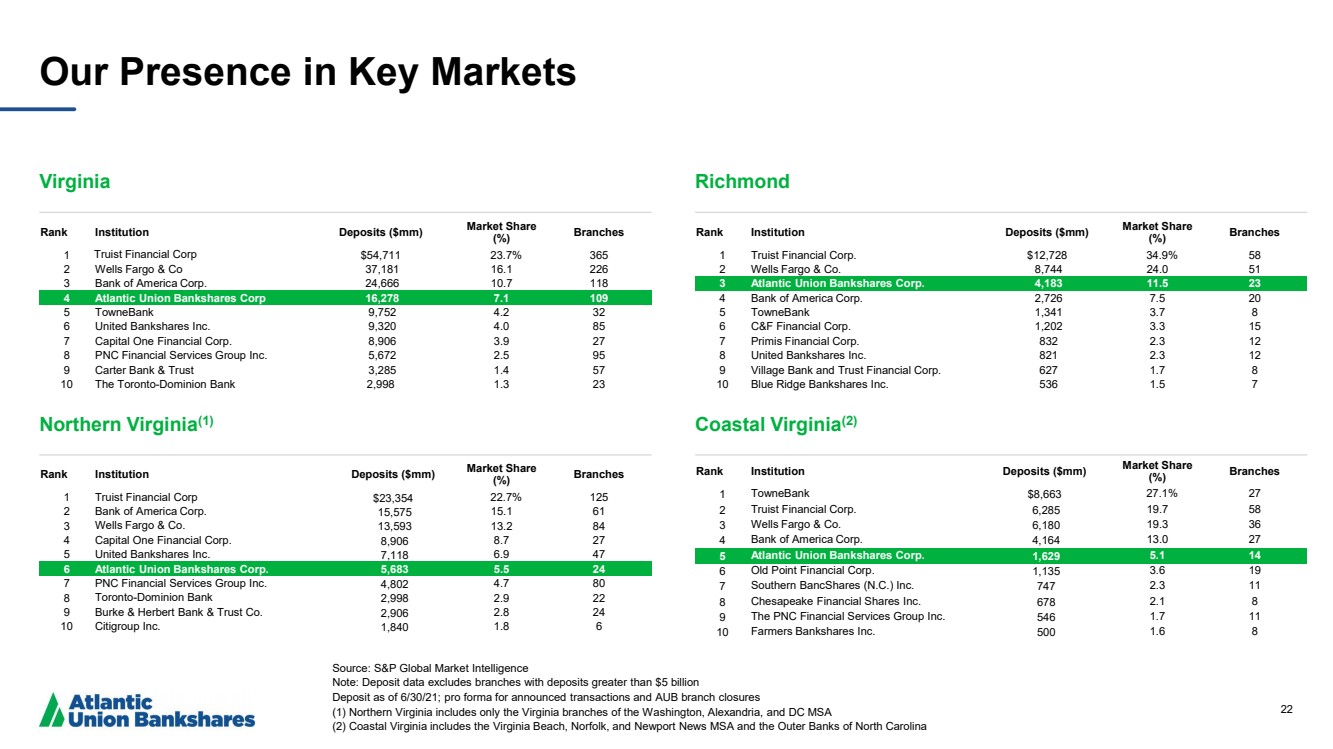
| 22 Our Presence in Key Markets Source: S&P Global Market Intelligence Note: Deposit data excludes branches with deposits greater than $5 billion Deposit as of 6/30/21; pro forma for announced transactions and AUB branch closures (1) Northern Virginia includes only the Virginia branches of the Washington, Alexandria, and DC MSA (2) Coastal Virginia includes the Virginia Beach, Norfolk, and Newport News MSA and the Outer Banks of North Carolina Virginia Richmond Rank Institution Deposits ($mm) Market Share (%) Branches 1 Truist Financial Corp $54,711 23.7% 365 2 Wells Fargo & Co 37,181 16.1 226 3 Bank of America Corp. 24,666 10.7 118 4 Atlantic Union Bankshares Corp 16,278 7.1 109 5 TowneBank 9,752 4.2 32 6 United Bankshares Inc. 9,320 4.0 85 7 Capital One Financial Corp. 8,906 3.9 27 8 PNC Financial Services Group Inc. 5,672 2.5 95 9 Carter Bank & Trust 3,285 1.4 57 10 The Toronto - Dominion Bank 2,998 1.3 23 Northern Virginia (1) Coastal Virginia (2) Rank Institution Deposits ($mm) Market Share (%) Branches 1 Truist Financial Corp $23,354 22.7% 125 2 Bank of America Corp. 15,575 15.1 61 3 Wells Fargo & Co. 13,593 13.2 84 4 Capital One Financial Corp. 8,906 8.7 27 5 United Bankshares Inc. 7,118 6.9 47 6 Atlantic Union Bankshares Corp. 5,683 5.5 24 7 PNC Financial Services Group Inc. 4,802 4.7 80 8 Toronto - Dominion Bank 2,998 2.9 22 9 Burke & Herbert Bank & Trust Co. 2,906 2.8 24 10 Citigroup Inc. 1,840 1.8 6 Rank Institution Deposits ($mm) Market Share (%) Branches 1 Truist Financial Corp. $12,728 34.9% 58 2 Wells Fargo & Co. 8,744 24.0 51 3 Atlantic Union Bankshares Corp. 4,183 11.5 23 4 Bank of America Corp. 2,726 7.5 20 5 TowneBank 1,341 3.7 8 6 C&F Financial Corp. 1,202 3.3 15 7 Primis Financial Corp. 832 2.3 12 8 United Bankshares Inc. 821 2.3 12 9 Village Bank and Trust Financial Corp. 627 1.7 8 10 Blue Ridge Bankshares Inc. 536 1.5 7 Rank Institution Deposits ($mm) Market Share (%) Branches 1 TowneBank $8,663 27.1% 27 2 Truist Financial Corp. 6,285 19.7 58 3 Wells Fargo & Co. 6,180 19.3 36 4 Bank of America Corp. 4,164 13.0 27 5 Atlantic Union Bankshares Corp. 1,629 5.1 14 6 Old Point Financial Corp. 1,135 3.6 19 7 Southern BancShares (N.C.) Inc. 747 2.3 11 8 Chesapeake Financial Shares Inc. 678 2.1 8 9 The PNC Financial Services Group Inc. 546 1.7 11 10 Farmers Bankshares Inc. 500 1.6 8 |
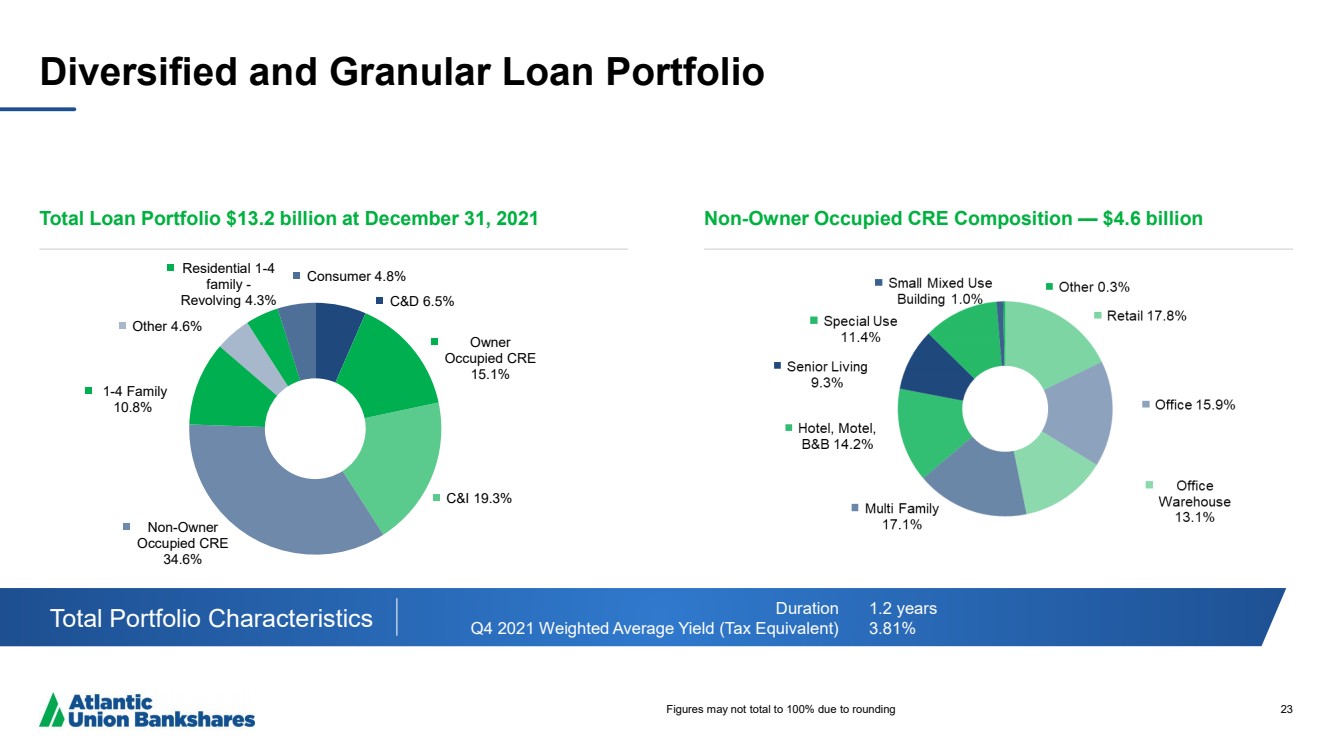
| 23 Diversified and Granular Loan Portfolio Total Loan Portfolio $ 13.2 billion at December 31, 2021 Non - Owner Occupied CRE Composition — $ 4.6 billion Total Portfolio Characteristics Duration Q4 2021 Weighted Average Yield (Tax Equivalent) 1.2 years 3.81% Figures may not total to 100% due to rounding C&D 6.5% Owner Occupied CRE 15.1% C&I 19.3% Non - Owner Occupied CRE 34.6% 1 - 4 Family 10.8% Other 4.6% Residential 1 - 4 family - Revolving 4.3% Consumer 4.8% |
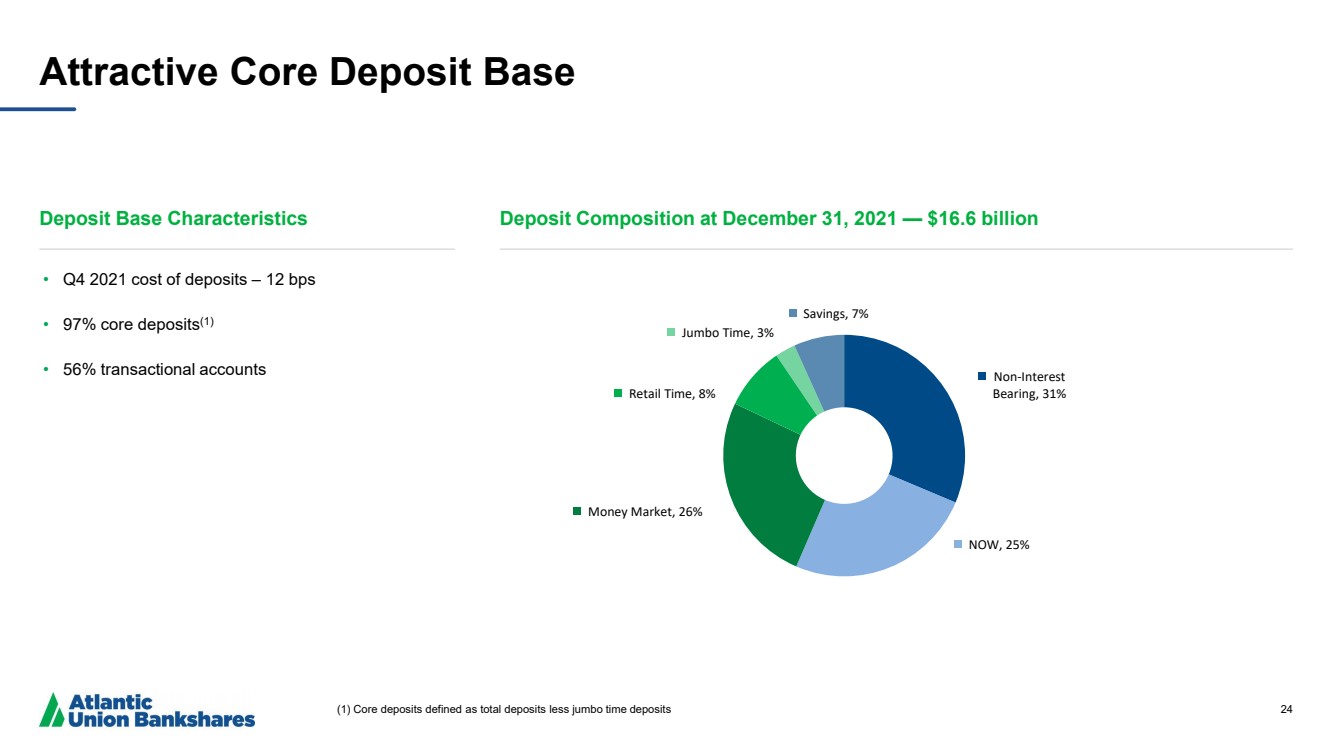
| 24 Attractive Core Deposit Base Deposit Base Characteristics Deposit Composition at December 31, 2021 — $16.6 billion (1) Core deposits defined as total deposits less jumbo time deposits • Q4 2021 cost of deposits – 12 bps • 97% core deposits (1) • 56% transactional accounts Non - Interest Bearing , 31% NOW , 25% Money Market , 26% Retail Time , 8% Jumbo Time , 3% Savings , 7% |
| 25 Reconciliation of Non - GAAP Disclosures The Company has provided supplemental performance measures on a tax - equivalent, tangible, operating, or adjusted basis .. These non - GAAP financial measures are a supplement to GAAP, which is used to prepare the Company’s financial statements, and should not be c ons idered in isolation or as a substitute for analysis of our results as reported under GAAP. In addition, the Company’s non - GAAP financial m easures may not be comparable to non - GAAP financial measures of other companies. The Company uses the non - GAAP financial measures discussed here in in its analysis of the Company’s performance. The Company’s management believes that these non - GAAP financial measures provide addi tional understanding of ongoing operations, enhance comparability of results of operations with prior periods and show the effects o f s ignificant gains and charges in the periods presented without the impact of items or events that may obscure trends in the Company’s underlyin g p erformance. |
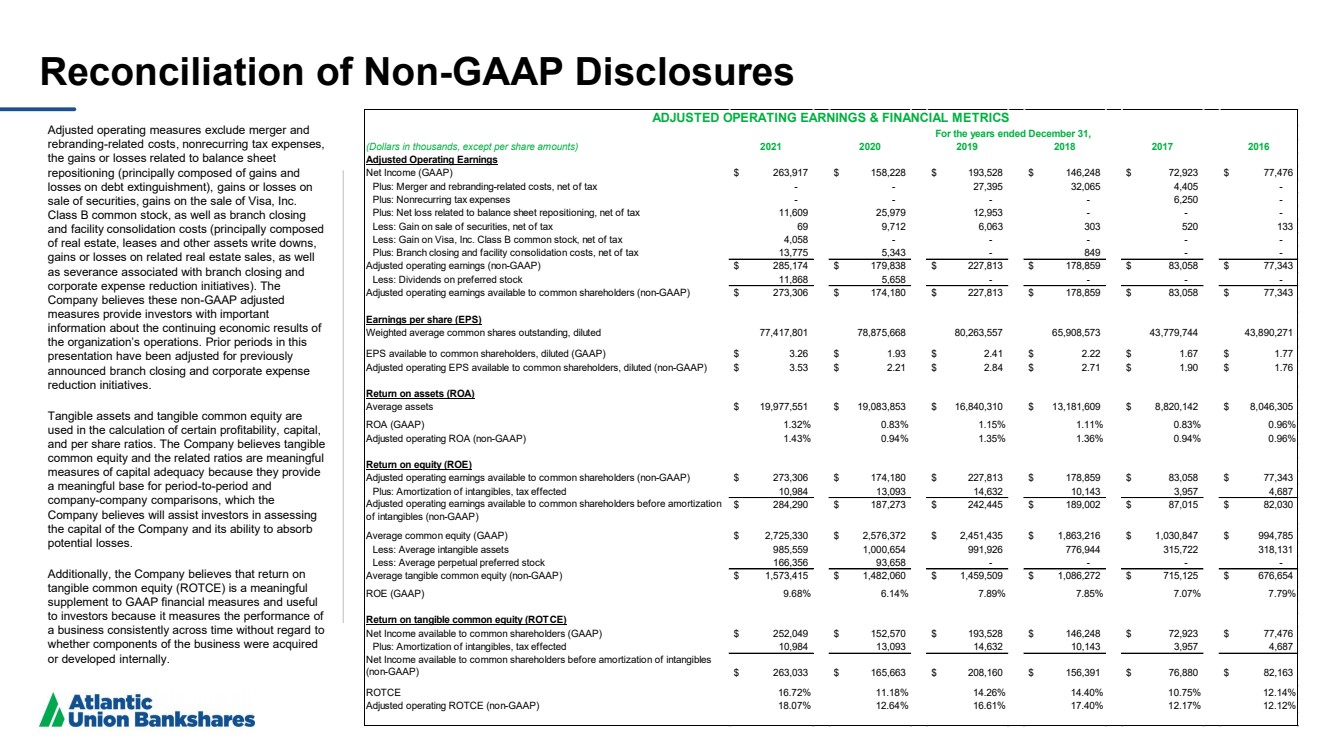
| 26 Reconciliation of Non - GAAP Disclosures Adjusted operating measures exclude merger and rebranding - related costs , nonrecurring tax expenses, the gains or losses related to balance sheet repositioning (principally composed of gains and losses on debt extinguishment), gains or losses on sale of securities, gains on the sale of Visa, Inc. Class B common stock, as well as branch closing and facility consolidation costs (principally composed of real estate, leases and other assets write downs, gains or losses on related real estate sales, as well as severance associated with branch closing and corporate expense reduction initiatives). The Company believes these non - GAAP adjusted measures provide investors with important information about the continuing economic results of the organization’s operations. Prior periods in this presentation have been adjusted for previously announced branch closing and corporate expense reduction initiatives .. Tangible assets and tangible common equity are used in the calculation of certain profitability, capital, and per share ratios. The Company believes tangible common equity and the related ratios are meaningful measures of capital adequacy because they provide a meaningful base for period - to - period and company - company comparisons, which the Company believes will assist investors in assessing the capital of the Company and its ability to absorb potential losses. Additionally , the Company believes that return on tangible common equity (ROTCE) is a meaningful supplement to GAAP financial measures and useful to investors because it measures the performance of a business consistently across time without regard to whether components of the business were acquired or developed internally. (Dollars in thousands, except per share amounts) 2021 2020 2019 2018 2017 2016 Adjusted Operating Earnings Net Income (GAAP) 263,917 $ 158,228 $ 193,528 $ 146,248 $ 72,923 $ 77,476 $ Plus: Merger and rebranding-related costs, net of tax - - 27,395 32,065 4,405 - Plus: Nonrecurring tax expenses - - - - 6,250 - Plus: Net loss related to balance sheet repositioning, net of tax 11,609 25,979 12,953 - - - Less: Gain on sale of securities, net of tax 69 9,712 6,063 303 520 133 Less: Gain on Visa, Inc. Class B common stock, net of tax 4,058 - - - - - Plus: Branch closing and facility consolidation costs, net of tax 13,775 5,343 - 849 - - Adjusted operating earnings (non-GAAP) 285,174 $ 179,838 $ 227,813 $ 178,859 $ 83,058 $ 77,343 $ Less: Dividends on preferred stock 11,868 5,658 - - - - Adjusted operating earnings available to common shareholders (non-GAAP) 273,306 $ 174,180 $ 227,813 $ 178,859 $ 83,058 $ 77,343 $ Earnings per share (EPS) Weighted average common shares outstanding, diluted 77,417,801 78,875,668 80,263,557 65,908,573 43,779,744 43,890,271 EPS available to common shareholders, diluted (GAAP) 3.26 $ 1.93 $ 2.41 $ 2.22 $ 1.67 $ 1.77 $ Adjusted operating EPS available to common shareholders, diluted (non-GAAP) 3.53 $ 2.21 $ 2.84 $ 2.71 $ 1.90 $ 1.76 $ Return on assets (ROA) Average assets 19,977,551 $ 19,083,853 $ 16,840,310 $ 13,181,609 $ 8,820,142 $ 8,046,305 $ ROA (GAAP) 1.32% 0.83% 1.15% 1.11% 0.83% 0.96% Adjusted operating ROA (non-GAAP) 1.43% 0.94% 1.35% 1.36% 0.94% 0.96% Return on equity (ROE) Adjusted operating earnings available to common shareholders (non-GAAP) 273,306 $ 174,180 $ 227,813 $ 178,859 $ 83,058 $ 77,343 $ Plus: Amortization of intangibles, tax effected 10,984 13,093 14,632 10,143 3,957 4,687 Adjusted operating earnings available to common shareholders before amortization of intangibles (non-GAAP) 284,290 $ 187,273 $ 242,445 $ 189,002 $ 87,015 $ 82,030 $ Average common equity (GAAP) 2,725,330 $ 2,576,372 $ 2,451,435 $ 1,863,216 $ 1,030,847 $ 994,785 $ Less: Average intangible assets 985,559 1,000,654 991,926 776,944 315,722 318,131 Less: Average perpetual preferred stock 166,356 93,658 - - - - Average tangible common equity (non-GAAP) 1,573,415 $ 1,482,060 $ 1,459,509 $ 1,086,272 $ 715,125 $ 676,654 $ ROE (GAAP) 9.68% 6.14% 7.89% 7.85% 7.07% 7.79% Return on tangible common equity (ROTCE) Net Income available to common shareholders (GAAP) 252,049 $ 152,570 $ 193,528 $ 146,248 $ 72,923 $ 77,476 $ Plus: Amortization of intangibles, tax effected 10,984 13,093 14,632 10,143 3,957 4,687 Net Income available to common shareholders before amortization of intangibles (non-GAAP) 263,033 $ 165,663 $ 208,160 $ 156,391 $ 76,880 $ 82,163 $ ROTCE 16.72% 11.18% 14.26% 14.40% 10.75% 12.14% Adjusted operating ROTCE (non-GAAP) 18.07% 12.64% 16.61% 17.40% 12.17% 12.12% ADJUSTED OPERATING EARNINGS & FINANCIAL METRICS For the years ended December 31, |
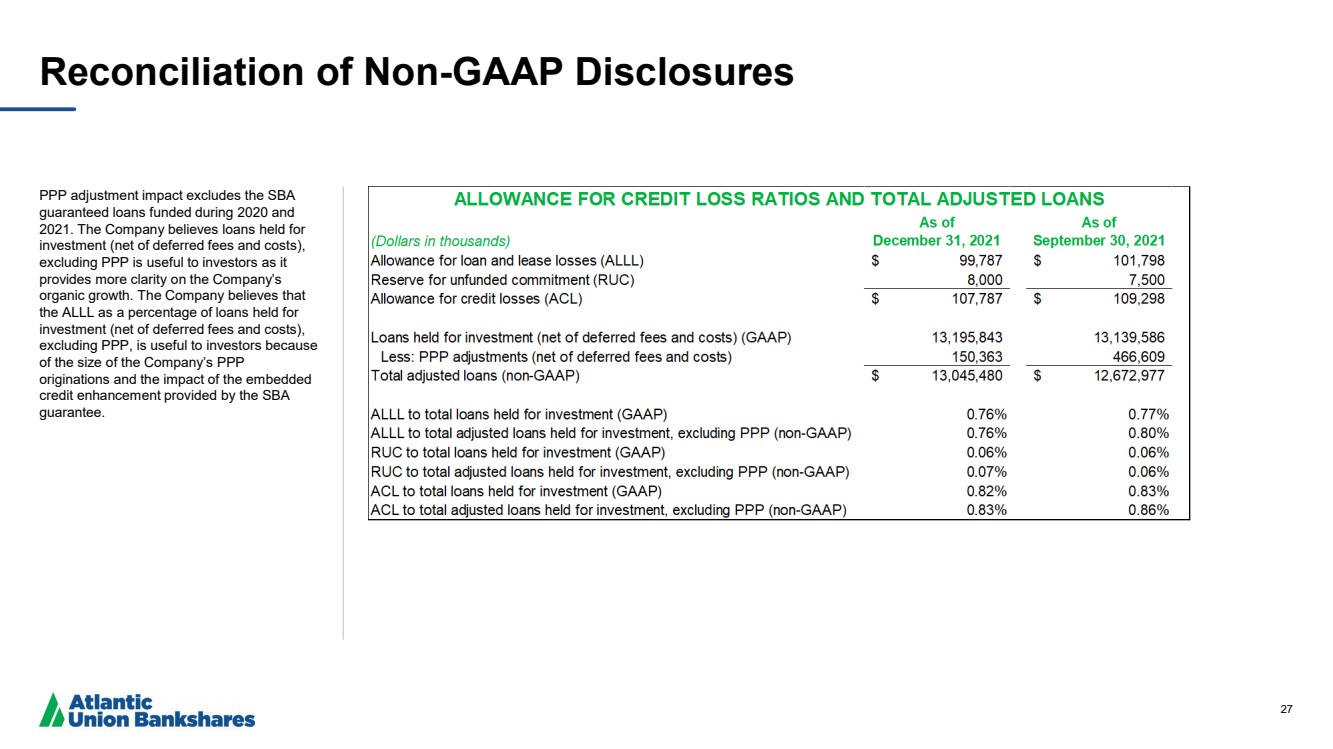
| 27 Reconciliation of Non - GAAP Disclosures PPP adjustment impact excludes the SBA guaranteed loans funded during 2020 and 2021. The Company believes loans held for investment (net of deferred fees and costs), excluding PPP is useful to investors as it provides more clarity on the Company’s organic growth. The Company believes that the ALLL as a percentage of loans held for investment (net of deferred fees and costs), excluding PPP, is useful to investors because of the size of the Company’s PPP originations and the impact of the embedded credit enhancement provided by the SBA guarantee. |
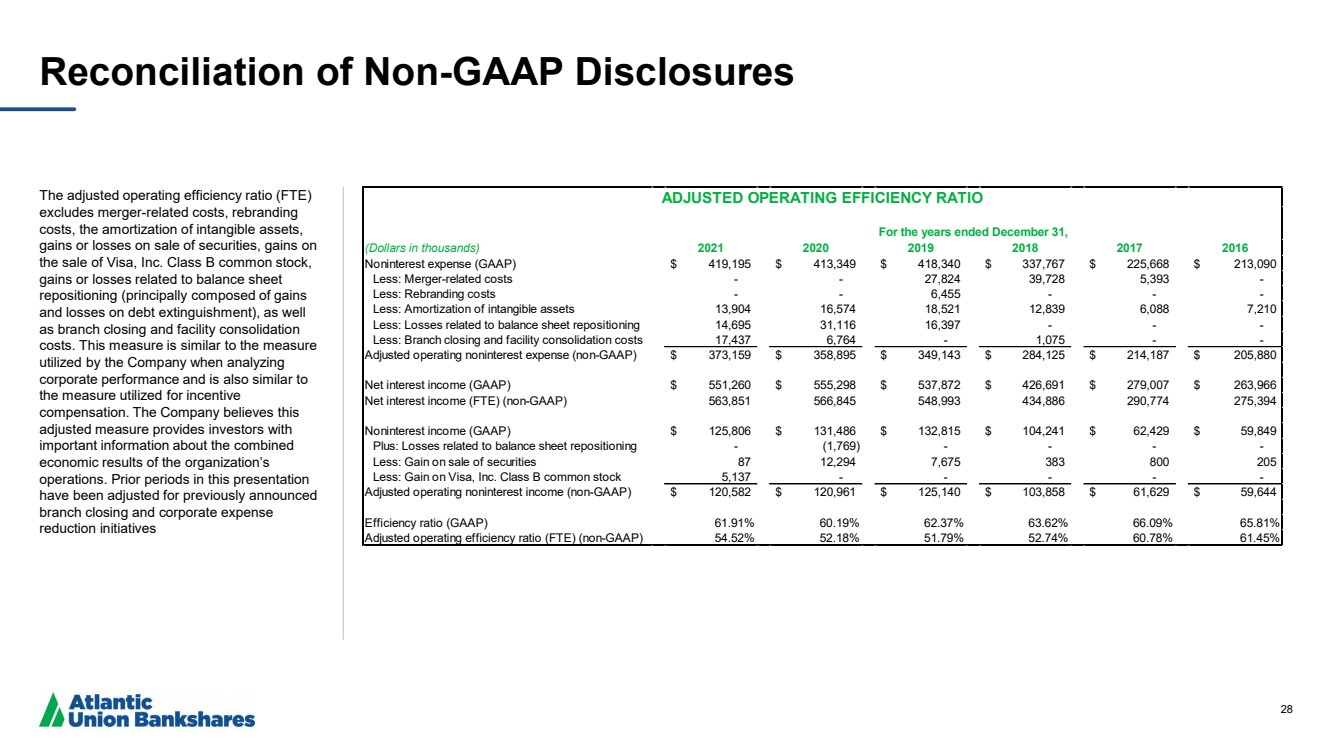
| 28 Reconciliation of Non - GAAP Disclosures The adjusted operating efficiency ratio (FTE) excludes merger - related costs, rebranding costs , the amortization of intangible assets, gains or losses on sale of securities, gains on the sale of Visa, Inc. Class B common stock, gains or losses related to balance sheet repositioning (principally composed of gains and losses on debt extinguishment), as well as branch closing and facility consolidation costs. This measure is similar to the measure utilized by the Company when analyzing corporate performance and is also similar to the measure utilized for incentive compensation. The Company believes this adjusted measure provides investors with important information about the combined economic results of the organization’s operations. Prior periods in this presentation have been adjusted for previously announced branch closing and corporate expense reduction initiatives (Dollars in thousands) 2021 2020 2019 2018 2017 2016 Noninterest expense (GAAP) 419,195 $ 413,349 $ 418,340 $ 337,767 $ 225,668 $ 213,090 $ Less: Merger-related costs - - 27,824 39,728 5,393 - Less: Rebranding costs - - 6,455 - - - Less: Amortization of intangible assets 13,904 16,574 18,521 12,839 6,088 7,210 Less: Losses related to balance sheet repositioning 14,695 31,116 16,397 - - - Less: Branch closing and facility consolidation costs 17,437 6,764 - 1,075 - - Adjusted operating noninterest expense (non-GAAP) 373,159 $ 358,895 $ 349,143 $ 284,125 $ 214,187 $ 205,880 $ Net interest income (GAAP) 551,260 $ 555,298 $ 537,872 $ 426,691 $ 279,007 $ 263,966 $ Net interest income (FTE) (non-GAAP) 563,851 566,845 548,993 434,886 290,774 275,394 Noninterest income (GAAP) 125,806 $ 131,486 $ 132,815 $ 104,241 $ 62,429 $ 59,849 $ Plus: Losses related to balance sheet repositioning - (1,769) - - - - Less: Gain on sale of securities 87 12,294 7,675 383 800 205 Less: Gain on Visa, Inc. Class B common stock 5,137 - - - - - Adjusted operating noninterest income (non-GAAP) 120,582 $ 120,961 $ 125,140 $ 103,858 $ 61,629 $ 59,644 $ Efficiency ratio (GAAP) 61.91% 60.19% 62.37% 63.62% 66.09% 65.81% Adjusted operating efficiency ratio (FTE) (non-GAAP) 54.52% 52.18% 51.79% 52.74% 60.78% 61.45% ADJUSTED OPERATING EFFICIENCY RATIO For the years ended December 31, |
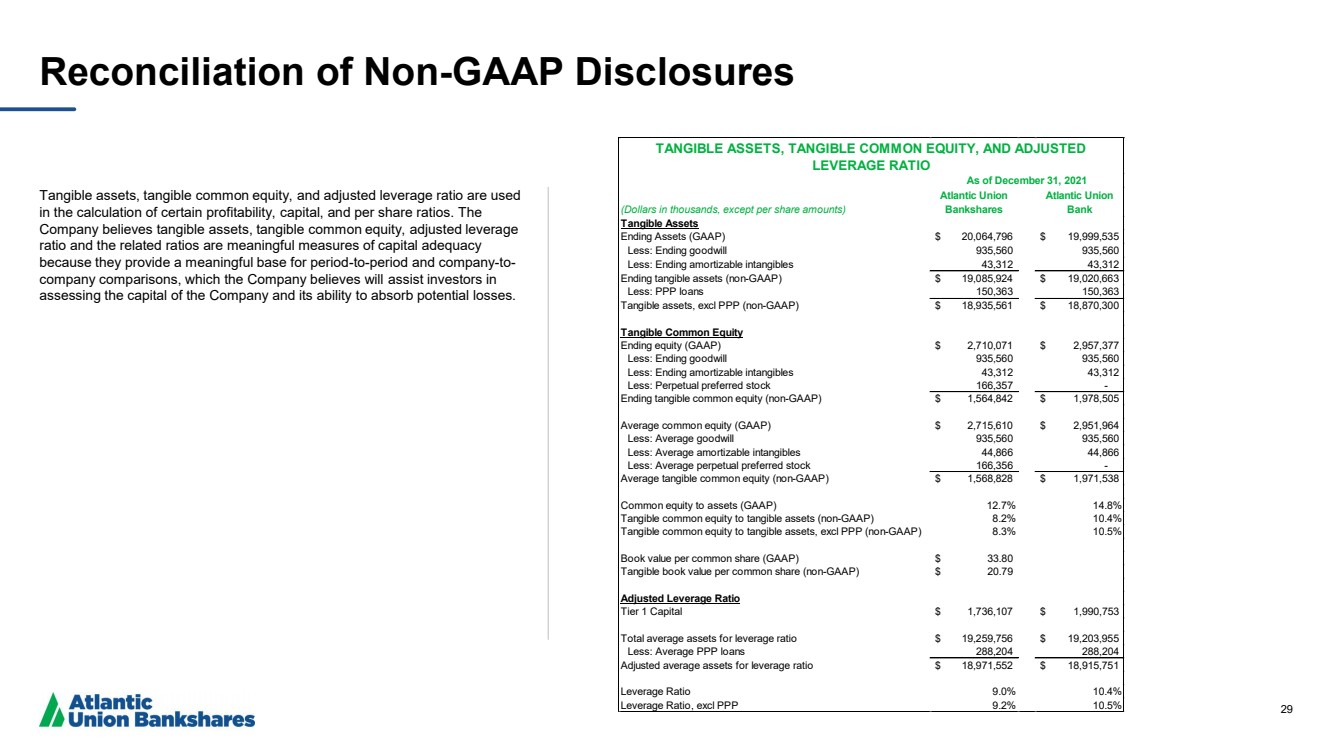
| 29 Reconciliation of Non - GAAP Disclosures Tangible assets, tangible common equity, and adjusted leverage ratio are used in the calculation of certain profitability, capital, and per share ratios. The Company believes tangible assets, tangible common equity, adjusted leverage ratio and the related ratios are meaningful measures of capital adequacy because they provide a meaningful base for period - to - period and company - to - company comparisons, which the Company believes will assist investors in assessing the capital of the Company and its ability to absorb potential losses. (Dollars in thousands, except per share amounts) Atlantic Union Bankshares Atlantic Union Bank Tangible Assets Ending Assets (GAAP) 20,064,796 $ 19,999,535 $ Less: Ending goodwill 935,560 935,560 Less: Ending amortizable intangibles 43,312 43,312 Ending tangible assets (non-GAAP) 19,085,924 $ 19,020,663 $ Less: PPP loans 150,363 150,363 Tangible assets, excl PPP (non-GAAP) 18,935,561 $ 18,870,300 $ Tangible Common Equity Ending equity (GAAP) 2,710,071 $ 2,957,377 $ Less: Ending goodwill 935,560 935,560 Less: Ending amortizable intangibles 43,312 43,312 Less: Perpetual preferred stock 166,357 - Ending tangible common equity (non-GAAP) 1,564,842 $ 1,978,505 $ Average common equity (GAAP) 2,715,610 $ 2,951,964 $ Less: Average goodwill 935,560 935,560 Less: Average amortizable intangibles 44,866 44,866 Less: Average perpetual preferred stock 166,356 - Average tangible common equity (non-GAAP) 1,568,828 $ 1,971,538 $ Common equity to assets (GAAP) 12.7% 14.8% Tangible common equity to tangible assets (non-GAAP) 8.2% 10.4% Tangible common equity to tangible assets, excl PPP (non-GAAP) 8.3% 10.5% Book value per common share (GAAP) 33.80 $ Tangible book value per common share (non-GAAP) 20.79 $ Adjusted Leverage Ratio Tier 1 Capital 1,736,107 $ 1,990,753 $ Total average assets for leverage ratio 19,259,756 $ 19,203,955 $ Less: Average PPP loans 288,204 288,204 Adjusted average assets for leverage ratio 18,971,552 $ 18,915,751 $ Leverage Ratio 9.0% 10.4% Leverage Ratio, excl PPP 9.2% 10.5% TANGIBLE ASSETS, TANGIBLE COMMON EQUITY, AND ADJUSTED LEVERAGE RATIO As of December 31, 2021 |
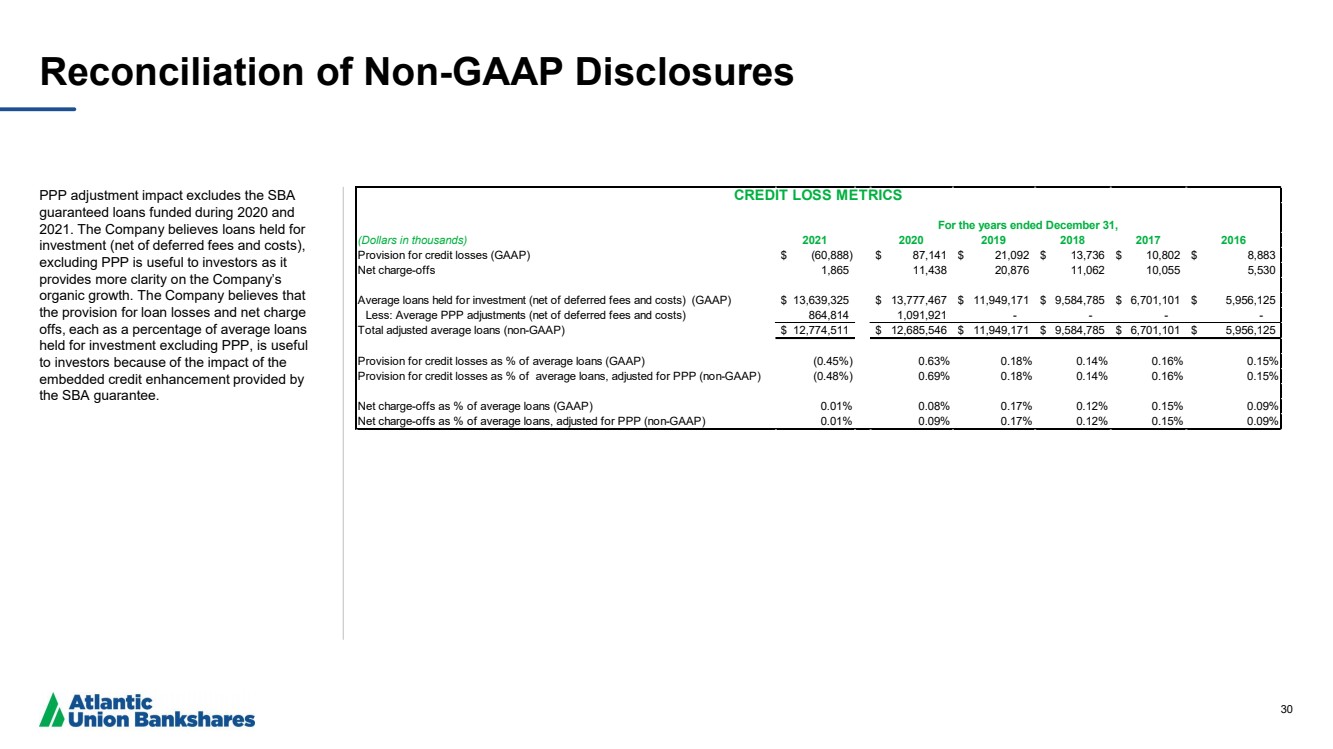
| 30 Reconciliation of Non - GAAP Disclosures PPP adjustment impact excludes the SBA guaranteed loans funded during 2020 and 2021. The Company believes loans held for investment (net of deferred fees and costs), excluding PPP is useful to investors as it provides more clarity on the Company’s organic growth. The Company believes that the provision for loan losses and net charge offs, each as a percentage of average loans held for investment excluding PPP, is useful to investors because of the impact of the embedded credit enhancement provided by the SBA guarantee. (Dollars in thousands) 2021 2020 2019 2018 2017 2016 Provision for credit losses (GAAP) (60,888) $ 87,141 $ 21,092 $ 13,736 $ 10,802 $ 8,883 $ Net charge-offs 1,865 11,438 20,876 11,062 10,055 5,530 Average loans held for investment (net of deferred fees and costs) (GAAP) 13,639,325 $ 13,777,467 $ 11,949,171 $ 9,584,785 $ 6,701,101 $ 5,956,125 $ Less: Average PPP adjustments (net of deferred fees and costs) 864,814 1,091,921 - - - - Total adjusted average loans (non-GAAP) 12,774,511 $ 12,685,546 $ 11,949,171 $ 9,584,785 $ 6,701,101 $ 5,956,125 $ Provision for credit losses as % of average loans (GAAP) (0.45%) 0.63% 0.18% 0.14% 0.16% 0.15% Provision for credit losses as % of average loans, adjusted for PPP (non-GAAP) (0.48%) 0.69% 0.18% 0.14% 0.16% 0.15% Net charge-offs as % of average loans (GAAP) 0.01% 0.08% 0.17% 0.12% 0.15% 0.09% Net charge-offs as % of average loans, adjusted for PPP (non-GAAP) 0.01% 0.09% 0.17% 0.12% 0.15% 0.09% CREDIT LOSS METRICS For the years ended December 31, |