| 4th Quarter FY2021 Earnings Presentation Nasdaq: AUB January 25, 2022 |

| 2 Forward Looking Statements Certain statements in this presentation may constitute “forward - looking statements” within the meaning of the Private Securities Litigation Reform Act of 1995. Forward - looking statements, including without limitation, statements regarding the Company’s outlook on future economic conditions and the impact of the COVID - 19 pandemic, are statements that include, projections, predictions, expectations, or beliefs about future events or results that ar e not statements of historical fact. Such forward - looking statements are based on various assumptions as of the time they are made, and are inherently subject to known and unknown risks, uncertainties, and other fac tor s, some of which cannot be predicted or quantified, that may cause actual results, performance, or achievements to be materia lly different from those expressed or implied by such forward - looking statements. Forward - looking statements are often accompanied by words that co nvey projected future events or outcomes such as “expect,” “believe,” “estimate,” “plan,” “project,” “anticipate,” “intend,” “wi ll,” “may,” “view,” “opportunity,” “potential,” or words of similar meaning or other statements concerning opinions or judgment of the Company an d i ts management about future events. Although the Company believes that its expectations with respect to forward - looking statement s are based upon reasonable assumptions within the bounds of its existing knowledge of its business and operations, there can be no assur anc e that actual results, performance, or achievements of, or trends affecting, the Company will not differ materially from any pro jected future results, performance, or achievements expressed or implied by such forward - looking statements. Actual future results, performanc e, achievements or trends may differ materially from historical results or those anticipated depending on a variety of factor s, including, but not limited to the effects of or changes in: • changes in interest rates; • general economic and financial market conditions, in the United States generally and particularly in the markets in which t he Company operates and which its loans are concentrated, including the effects of declines in real estate values, an increase i n unemployment levels and slowdowns in economic growth, including as a result of COVID - 19; • the quality or composition of the loan or investment portfolios and changes therein; • demand for loan products and financial services in the Company’s market area; • the Company’s ability to manage its growth or implement its growth strategy; • the effectiveness of expense reduction plans; • the introduction of new lines of business or new products and services; • the Company’s ability to recruit and retain key employees; • the incremental cost and/or decreased revenues associated with exceeding $10 billion in assets; • real estate values in the Bank’s lending area; • an insufficient ACL; • changes in accounting principles; • the Company’s liquidity and capital positions; • concentrations of loans secured by real estate, particularly commercial real estate; • the effectiveness of the Company’s credit processes and management of the Company’s credit risk; • the Company’s ability to compete in the market for financial services and increased competition from fintech companies; • technological risks and developments, and cyber threats, attacks, or events; • the potential adverse effects of unusual and infrequently occurring events, such as weather - related disasters, terrorist acts or public health events (such as COVID - 19), and of governmental and societal responses thereto; these potential adverse effects may include, without limitation, adverse effects on the ability of the Company's borrowers to satisfy their obligations to the Co mpa ny, on the value of collateral securing loans, on the demand for the Company's loans or its other products and services, on supply c hai ns and methods used to distribute products and services, on incidents of cyberattack and fraud, on the Company’s liquidity or ca pit al positions, on risks posed by reliance on third - party service providers, on other aspects of the Company's business operations an d on financial markets and economic growth; • the effect of steps the Company takes in response to COVID - 19, the severity and duration of the pandemic, the uncertainty regarding new variants of COVID - 19 that have emerged, the speed and efficacy of vaccine and treatment developments, the impact of loosening or tightening of government restrictions, the pace of recovery when the pandemic subsides and the heightened imp act it has on many of the risks described herein; • the discontinuation of LIBOR and its impact on the financial markets, and the Company’s ability to manage operational, lega l a nd compliance risks related to the discontinuation of LIBOR and implementation of one or more alternate reference rates, • performance by the Company’s counterparties or vendors; • deposit flows; • the availability of financing and the terms thereof; • the level of prepayments on loans and mortgage - backed securities; • legislative or regulatory changes and requirements, including the impact of the CARES Act, as amended by the CAA, and other legislative and regulatory reactions to COVID - 19; • potential claims, damages, and fines related to litigation or government actions, including litigation or actions arising f rom the Company’s participation in and administration of programs related to COVID - 19, including, among other things, the CARES Act, as amended by the CAA; • the effects of changes in federal, state or local tax laws and regulations; • monetary and fiscal policies of the U.S. government, including policies of the U.S. Department of the Treasury and the Fede ral Reserve; • changes to applicable accounting principles and guidelines; and • other factors, many of which are beyond the control of the Company. Please refer to the “Risk Factors” and “Management’s Discussion and Analysis of Financial Condition and Results of Operations ” s ections of the Company’s Annual Report on Form 10 - K for the year ended December 31, 2020 and related disclosures in other filings, which have been filed with the SEC and are available on the SEC’s website at www.sec.gov. All of the forward - look ing statements made in this presentation are expressly qualified by the cautionary statements contained or referred to herein. The actual results or developments anticipated may not be realized or, even if substantially realized, they may not h ave the expected consequences to or effects on the Company or its businesses or operations. Readers are cautioned not to rely too heavily on the forward - looking statements contained in this presentation. Forward - looking statements speak only as of the da te they are made and the Company does not undertake any obligation to update, revise or clarify these forward - looking statements, whether as a result of new information, future events or otherwise. |
| 3 Additional Information Non - GAAP Financial Measures This presentation contains certain financial information determined by methods other than in accordance with generally accepted accounting principles in the United States (“GAAP”). These non - GAAP financial measures are a supplement to GAAP, which is used to prepare the Company’s financial statements, and should not be considered in isolation or as a substitute for comparable measures calculated in accordance with GAAP. In addition, the Company’s non - GAAP financial measures may not be comparable to non - GAAP financial measures of other companies. The Company uses the non - GAAP financial measures discussed herein in its analysis of the Company’s performance. The Company’s management believes that these non - GAAP financial measures provide additional understanding of ongoing operations, enhance comparability of results of operations with prior periods and show the effects of significant gains and charges in the periods presented without the impact of items or events that may obscure trends in the Company’s underlying performance. Please see “Reconciliation of Non - GAAP Disclosures” at the end of this presentation for a reconciliation to the nearest GAAP financial measure. No Offer or Solicitation This presentation does not constitute an offer to sell or a solicitation of an offer to buy any securities. No offer of securities shall be made except by means of a prospectus meeting the requirements of the Securities Act of 1933, as amended, and no offer to sell or solicitation of an offer to buy shall be made in any jurisdiction in which such offer, solicitation or sale would be unlawful. About Atlantic Union Bankshares Corporation Headquartered in Richmond, Virginia, Atlantic Union Bankshares Corporation (Nasdaq: AUB) is the holding company for Atlantic Union Bank. Atlantic Union Bank has 130 branches and approximately 150 ATMs located throughout Virginia, and in portions of Maryland and North Carolina. Certain non - bank financial services affiliates of Atlantic Union Bank include: Atlantic Union Equipment Finance, Inc., which provides equipment financing; Dixon, Hubard , Feinour & Brown, Inc., which provides investment advisory services; Atlantic Union Financial Consultants, LLC, which provides brokerage services; and Union Insurance Group, LLC, which offers various lines of insurance products. |
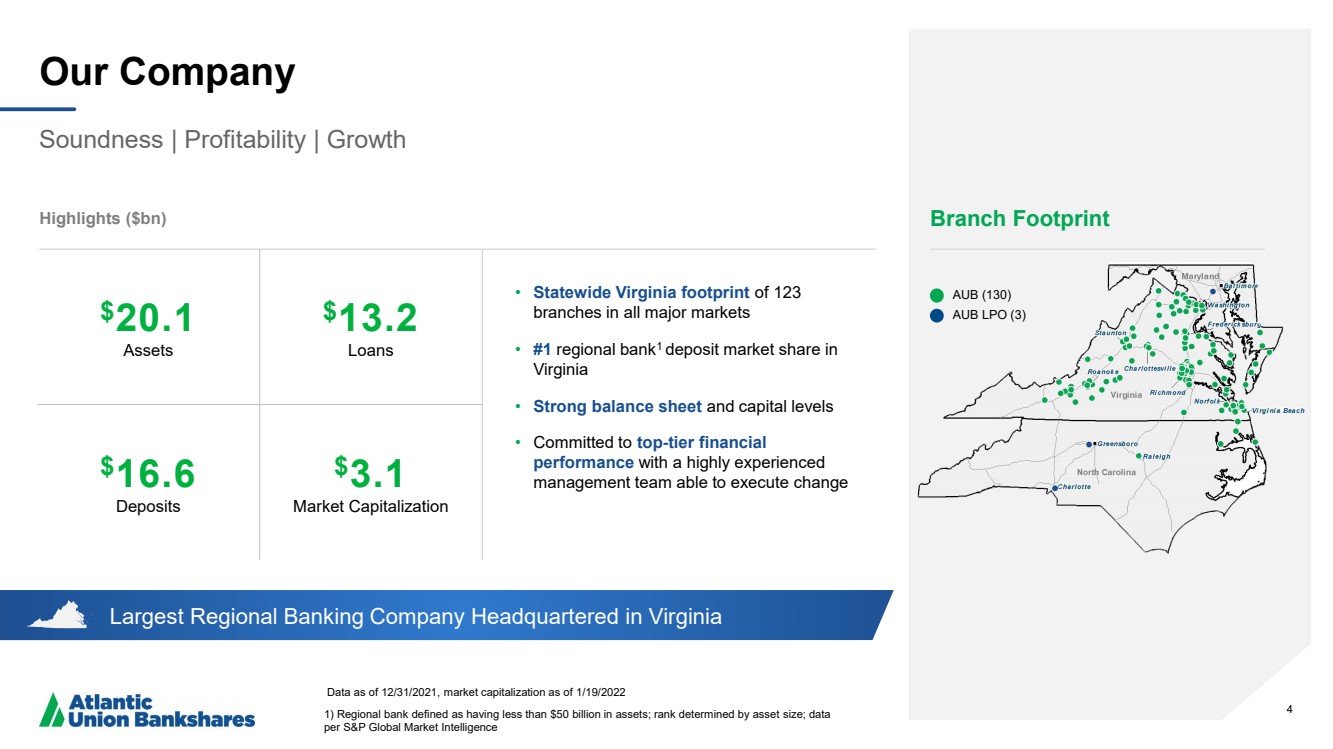
| 4 Largest Regional Banking Company Headquartered in Virginia Our Company Soundness | Profitability | Growth Data as of 12/31/2021 , market capitalization as of 1/19/2022 1) Regional bank defined as having less than $50 billion in assets; rank determined by asset size; data per S&P Global Market Intelligence Highlights ($bn) Branch Footprint AUB (130) AUB LPO (3) • Statewide Virginia footprint of 123 branches in all major markets • #1 regional bank 1 deposit market share in Virginia • Strong balance sheet and capital levels • Committed to top - tier financial performance with a highly experienced management team able to execute change 4 $ 20.1 Assets $ 13.2 Loans $ 16.6 Deposits $ 3 ..1 Market Capitalization |
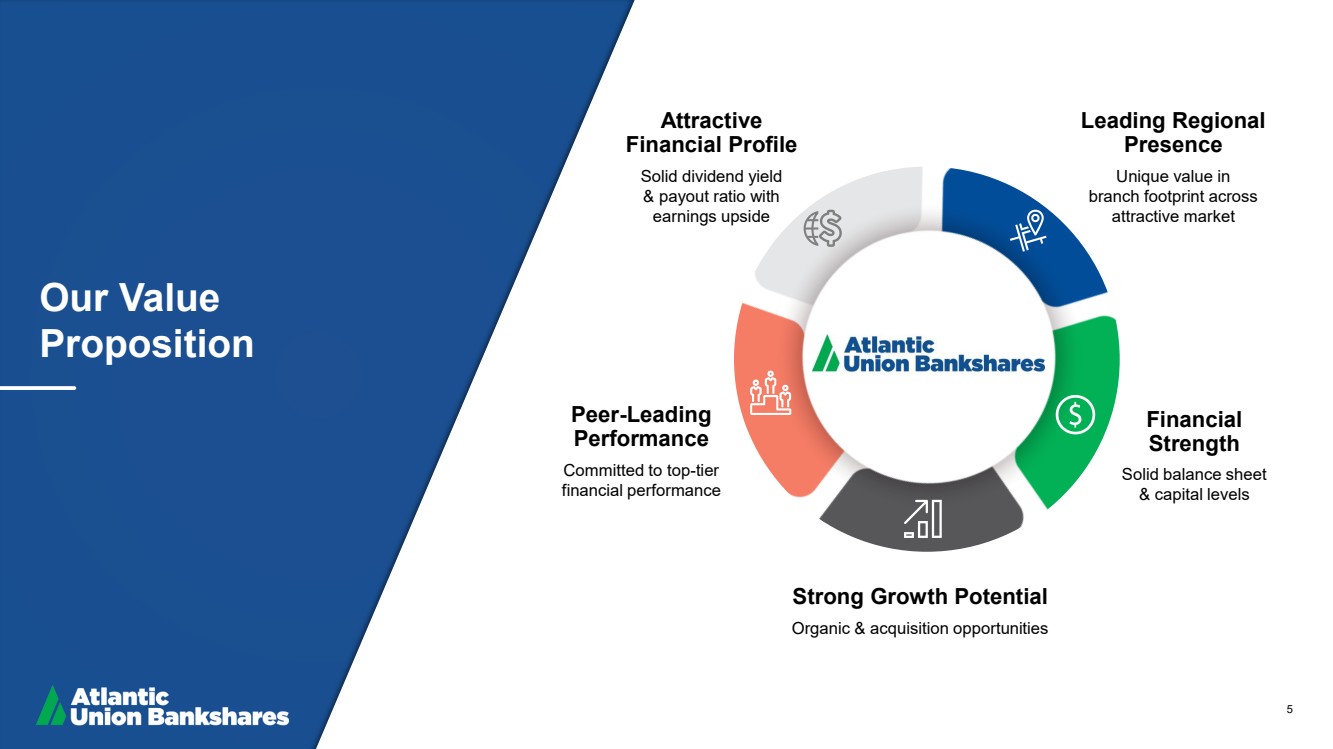
| 5 Our Value Proposition Strong Growth Potential Organic & acquisition opportunities Financial Strength Solid balance sheet & capital levels Leading Regional Presence Unique value in branch footprint across attractive market Attractive Financial Profile Solid dividend yield & payout ratio with earnings upside Peer - Leading Performance Committed to top - tier financial performance |
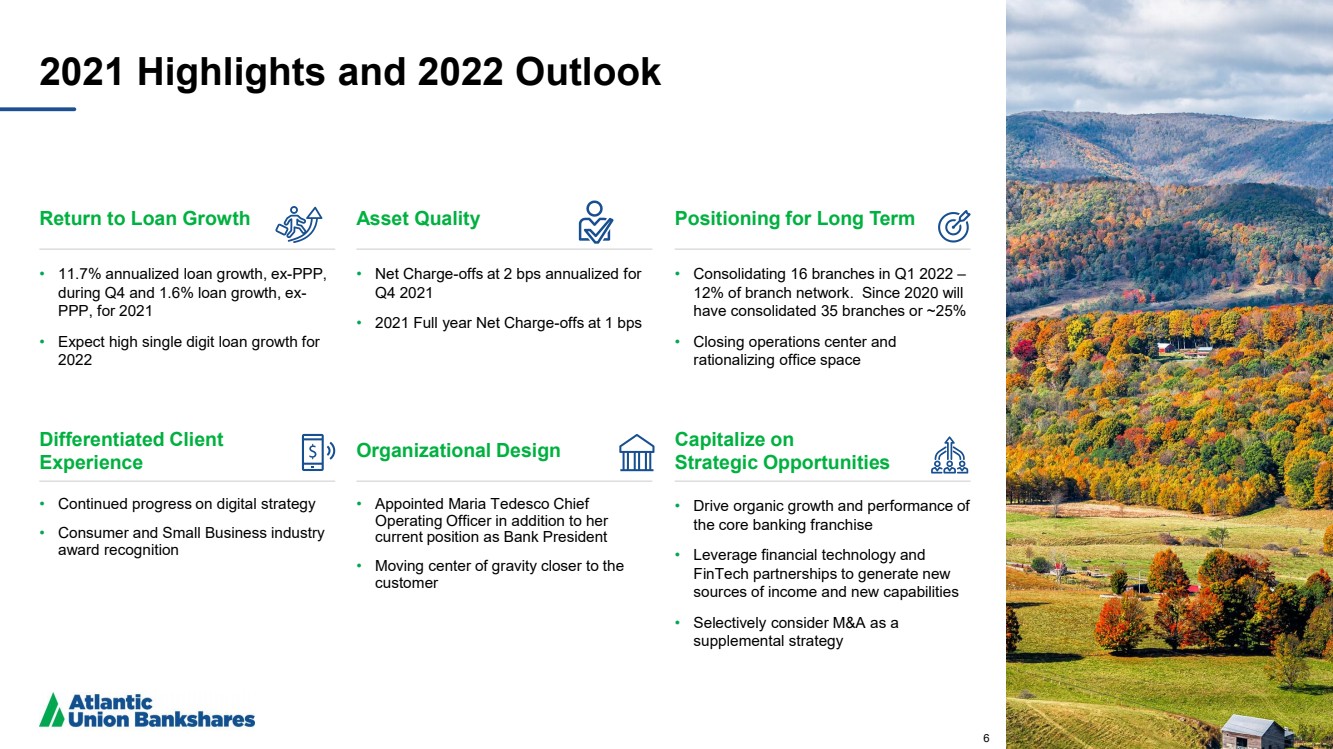
| 6 2021 Highlights and 2022 Outlook Return to Loan Growth • 11.7% annualized loan growth, ex - PPP, during Q4 and 1.6% loan growth, ex - PPP, for 2021 • Expect high single digit loan growth for 2022 Asset Quality • Net Charge - offs at 2 bps annualized for Q4 2021 • 2021 Full year Net Charge - offs at 1 bps Positioning for Long Term • Consolidating 16 branches in Q1 2022 – 12% of branch network. Since 2020 will have consolidated 35 branches or ~25% • Closing operations center and rationalizing office space Differentiated Client Experience • Continued progress on digital strategy • Consumer and Small Business industry award recognition Organizational Design • Appointed Maria Tedesco Chief Operating Officer in addition to her current position as Bank President • Moving center of gravity closer to the customer Capitalize on Strategic Opportunities • Drive organic growth and performance of the core banking franchise • Leverage financial technology and FinTech partnerships to generate new sources of income and new capabilities • Selectively consider M&A as a supplemental strategy 6 |
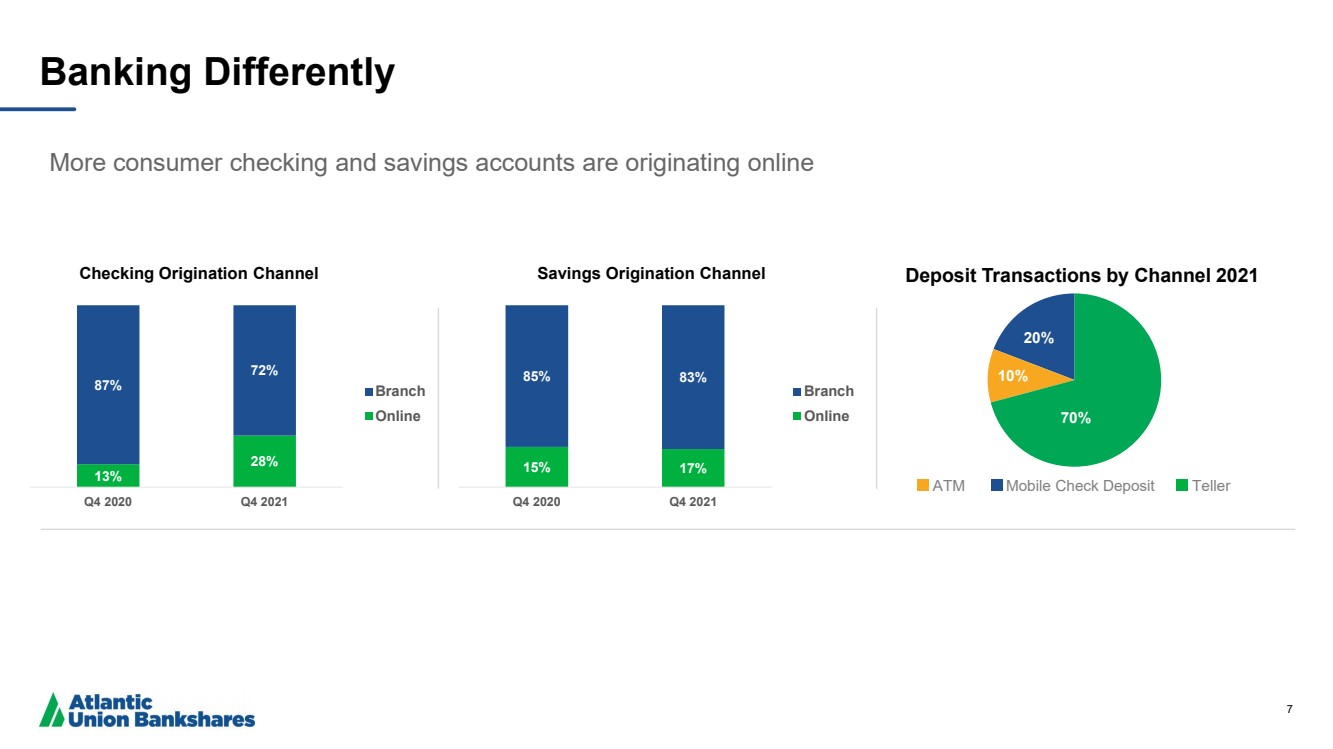
| 7 13% 28% 87% 72% Q4 2020 Q4 2021 Branch Online Banking Differently Checking Origination Channel Savings Origination Channel 20% 10% 70% Deposit Transactions by Channel 2021 Mobile Check Deposit Teller ATM 15% 17% 85% 83% Q4 2020 Q4 2021 Branch Online More consumer checking and savings accounts are originating online |
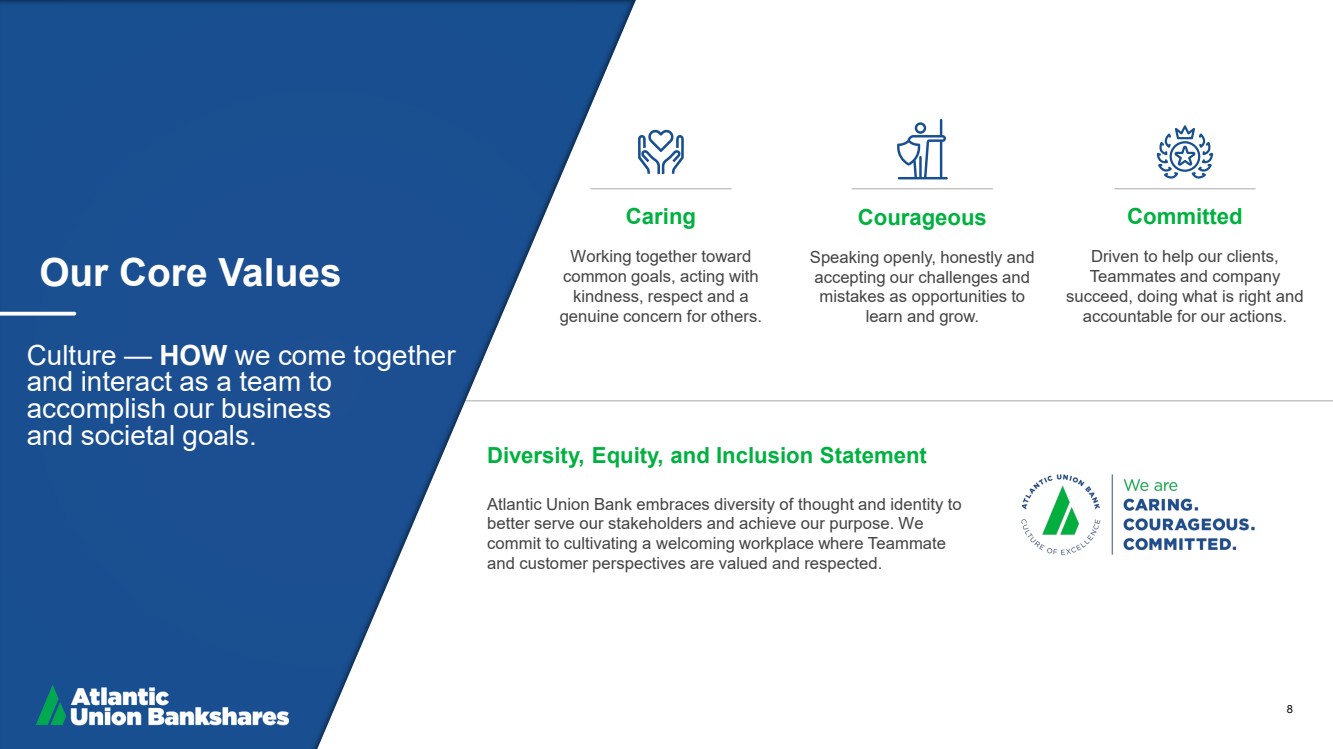
| 8 Caring Working together toward common goals, acting with kindness, respect and a genuine concern for others. Courageous Speaking openly, honestly and accepting our challenges and mistakes as opportunities to learn and grow. Committed Driven to help our clients, Teammates and company succeed, doing what is right and accountable for our actions. Our Core Values Culture — HOW we come together and interact as a team to accomplish our business and societal goals .. Diversity, Equity, and Inclusion Statement Atlantic Union Bank embraces diversity of thought and identity to better serve our stakeholders and achieve our purpose. We commit to cultivating a welcoming workplace where Teammate and customer perspectives are valued and respected. |
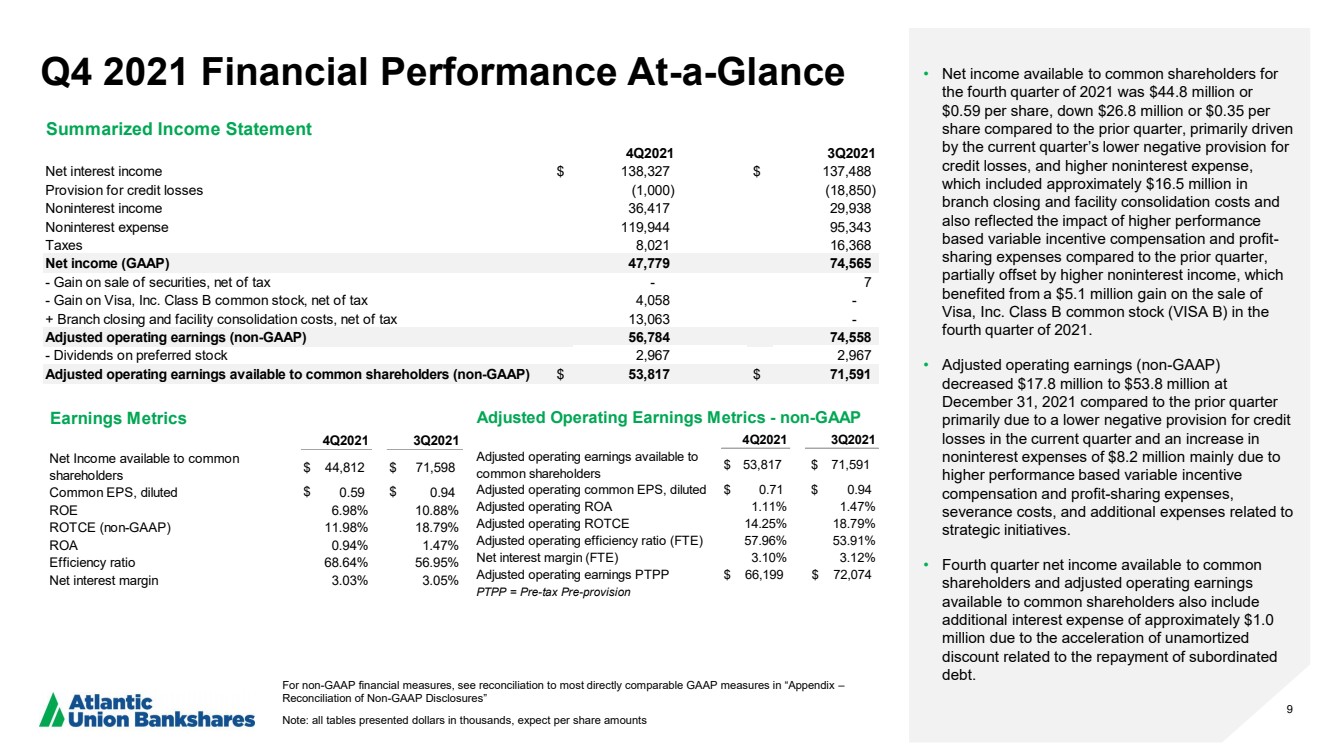
| 9 Q4 2021 Financial Performance At - a - Glance For non - GAAP financial measures, see reconciliation to most directly comparable GAAP measures in “Appendix – Reconciliation of Non - GAAP Disclosures” Note: all tables presented dollars in thousands, expect per share amounts • Net income available to common shareholders for the fourth quarter of 2021 was $44.8 million or $ 0.59 per share, down $26.8 million or $0.35 per share compared to the prior quarter, primarily driven by the current quarter’s lower negative provision for credit losses, and higher noninterest expense, which included approximately $16.5 million in branch closing and facility consolidation costs and also reflected the impact of higher performance based variable incentive compensation and profit - sharing expenses compared to the prior quarter, partially offset by higher noninterest income, which benefited from a $5.1 million gain on the sale of Visa, Inc. Class B common stock (VISA B) in the fourth quarter of 2021. • Adjusted operating earnings (non - GAAP) decreased $17.8 million to $53.8 million at December 31, 2021 compared to the prior quarter primarily due to a lower negative provision for credit losses in the current quarter and an increase in noninterest expenses of $8.2 million mainly due to higher performance based variable incentive compensation and profit - sharing expenses, severance costs, and additional expenses related to strategic initiatives. • Fourth quarter net income available to common shareholders and adjusted operating earnings available to common shareholders also include additional interest expense of approximately $1.0 million due to the acceleration of unamortized discount related to the repayment of subordinated debt. 4Q2021 3Q2021 Net Income available to common shareholders $ 44,812 $ 71,598 Common EPS, diluted $ 0.59 $ 0.94 ROE 6.98% 10.88% ROTCE (non-GAAP) 11.98% 18.79% ROA 0.94% 1.47% Efficiency ratio 68.64% 56.95% Net interest margin 3.03% 3.05% Earnings Metrics 4Q2021 3Q2021 Adjusted operating earnings available to common shareholders $ 53,817 $ 71,591 Adjusted operating common EPS, diluted $ 0.71 $ 0.94 Adjusted operating ROA 1.11% 1.47% Adjusted operating ROTCE 14.25% 18.79% Adjusted operating efficiency ratio (FTE) 57.96% 53.91% Net interest margin (FTE) 3.10% 3.12% Adjusted operating earnings PTPP $ 66,199 $ 72,074 PTPP = Pre-tax Pre-provision Adjusted Operating Earnings Metrics - non-GAAP 4Q2021 3Q2021 Net interest income $ 138,327 $ 137,488 Provision for credit losses (1,000) (18,850) Noninterest income 36,417 29,938 Noninterest expense 119,944 95,343 Taxes 8,021 16,368 Net income (GAAP) 47,779 74,565 - Gain on sale of securities, net of tax - 7 - Gain on Visa, Inc. Class B common stock, net of tax 4,058 - + Branch closing and facility consolidation costs, net of tax 13,063 - Adjusted operating earnings (non-GAAP) 56,784 74,558 - Dividends on preferred stock 2,967 2,967 Adjusted operating earnings available to common shareholders (non-GAAP) $ 53,817 $ 71,591 Summarized Income Statement |
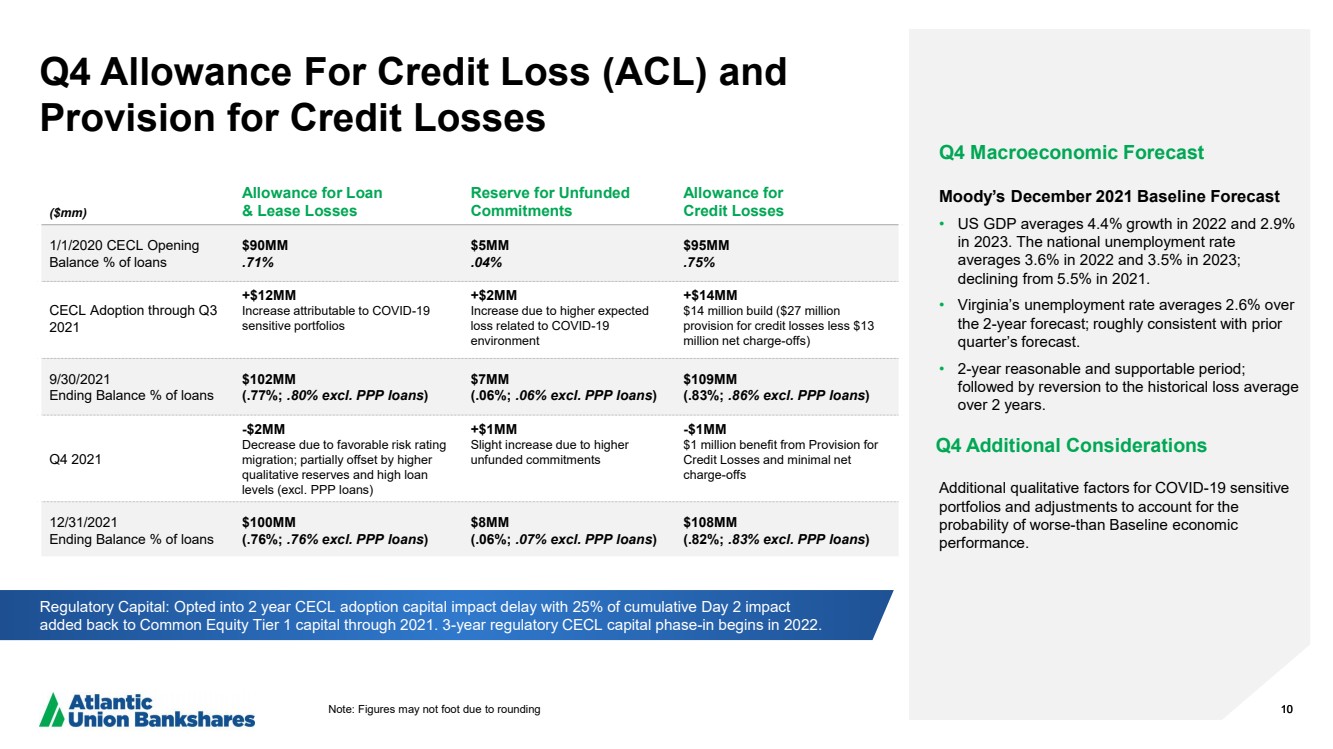
| 10 Q4 Allowance For Credit Loss (ACL) and Provision for Credit Losses Note: Figures may not foot due to rounding 10 Q4 Macroeconomic Forecast Moody’s December 2021 Baseline Forecast • US GDP averages 4.4% growth in 2022 and 2.9% in 2023. The national unemployment rate averages 3.6 % in 2022 and 3.5% in 2023; declining from 5.5% in 2021. • Virginia’s unemployment rate averages 2.6% over the 2 - year forecast; roughly consistent with prior quarter’s forecast. • 2 - year reasonable and supportable period; followed by reversion to the historical loss average over 2 years. Q4 Additional Considerations Additional qualitative factors for COVID - 19 sensitive portfolios and adjustments to account for the probability of worse - than Baseline economic performance. Regulatory Capital: Opted into 2 year CECL adoption capital impact delay with 25% of cumulative Day 2 impact added back to Common Equity Tier 1 capital through 2021. 3 - year regulatory CECL capital phase - in begins in 2022. ($mm) Allowance for Loan & Lease Losses Reserve for Unfunded Commitments Allowance for Credit Losses 1/1/2020 CECL Opening Balance % of loans $90MM ..71% $5MM ..04% $95MM ..75% CECL Adoption through Q3 2021 +$12MM Increase attributable to COVID - 19 sensitive portfolios +$2MM Increase due to higher expected loss related to COVID - 19 environment +$14MM $14 million build ($27 million provision for credit losses less $13 million net charge - offs) 9 /30/2021 Ending Balance % of loans $102MM (.77%; ..80% excl. PPP loans ) $7MM (.06%; ..06% excl. PPP loans ) $109MM (.83%; ..86% excl. PPP loans ) Q4 2021 - $2MM Decrease due to favorable risk rating migration; partially offset by higher qualitative reserves and high loan levels (excl. PPP loans) +$ 1 MM Slight increase due to higher unfunded commitments - $1MM $1 million benefit from Provision for Credit Losses and minimal net charge - offs 12/31/2021 Ending Balance % of loans $ 100MM (. 76%; ..76% excl. PPP loans ) $8MM (.06 %; ..07% excl. PPP loans ) $ 108MM (. 82 %; ..83% excl. PPP loans ) |
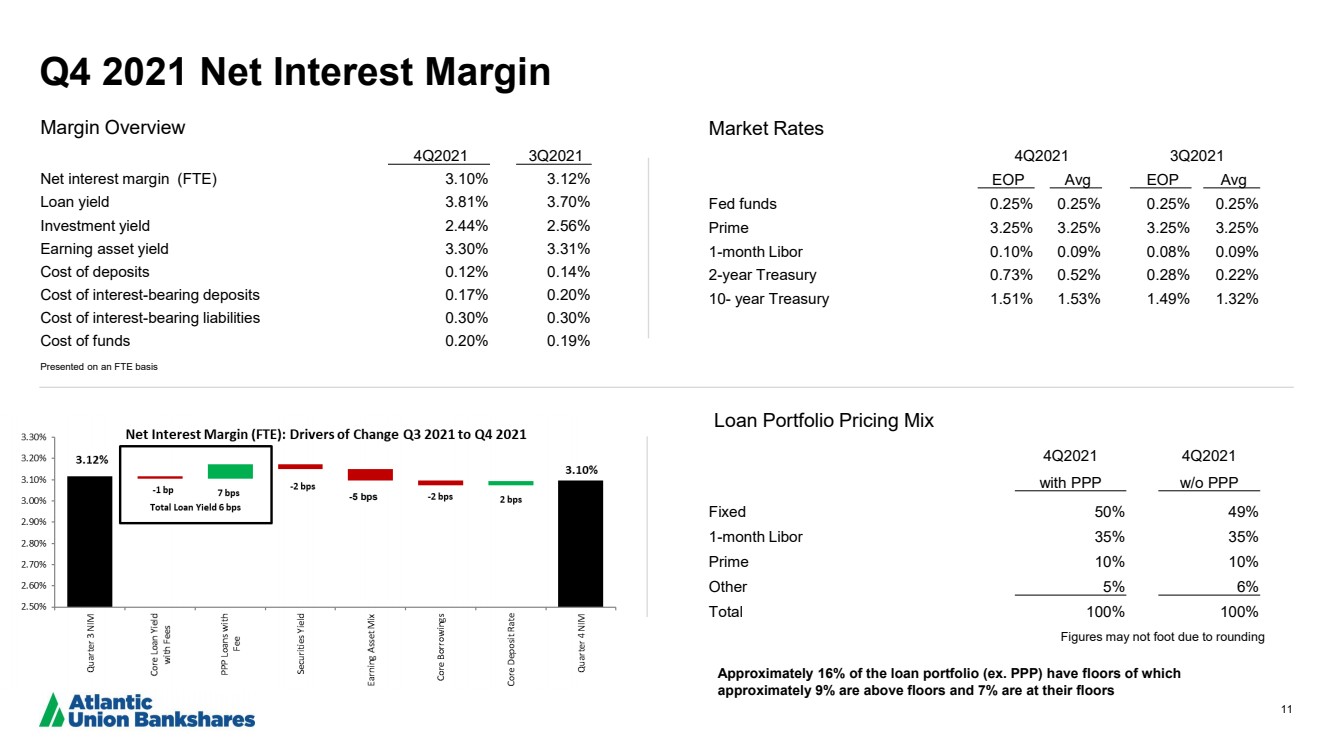
| 11 Q4 2021 Net Interest Margin Market Rates 4Q2021 3Q2021 EOP Avg EOP Avg Fed funds 0.25% 0.25% 0.25% 0.25% Prime 3.25% 3.25% 3.25% 3.25% 1 - month Libor 0.10% 0.09% 0.08% 0.09% 2 - year Treasury 0.73% 0.52% 0.28% 0.22% 10 - year Treasury 1.51% 1.53% 1.49% 1.32% Margin Overview 4Q2021 3Q2021 Net interest margin (FTE) 3.10% 3.12% Loan yield 3.81% 3.70% Investment yield 2.44% 2.56% Earning asset yield 3.30% 3.31% Cost of deposits 0.12% 0.14% Cost of interest - bearing deposits 0.17% 0.20% Cost of interest - bearing liabilities 0.30% 0.30% Cost of funds 0.20% 0.19% Presented on an FTE basis Approximately 16% of the loan portfolio (ex. PPP) have floors of which approximately 9% are above floors and 7% are at their floors Loan Portfolio Pricing Mix 4 Q2021 4 Q2021 with PPP w/o PPP Fixed 50% 49% 1 - month Libor 35% 35% Prime 10% 10% Other 5 % 6% Total 100% 100% Figures may not foot due to rounding - 5 bps |
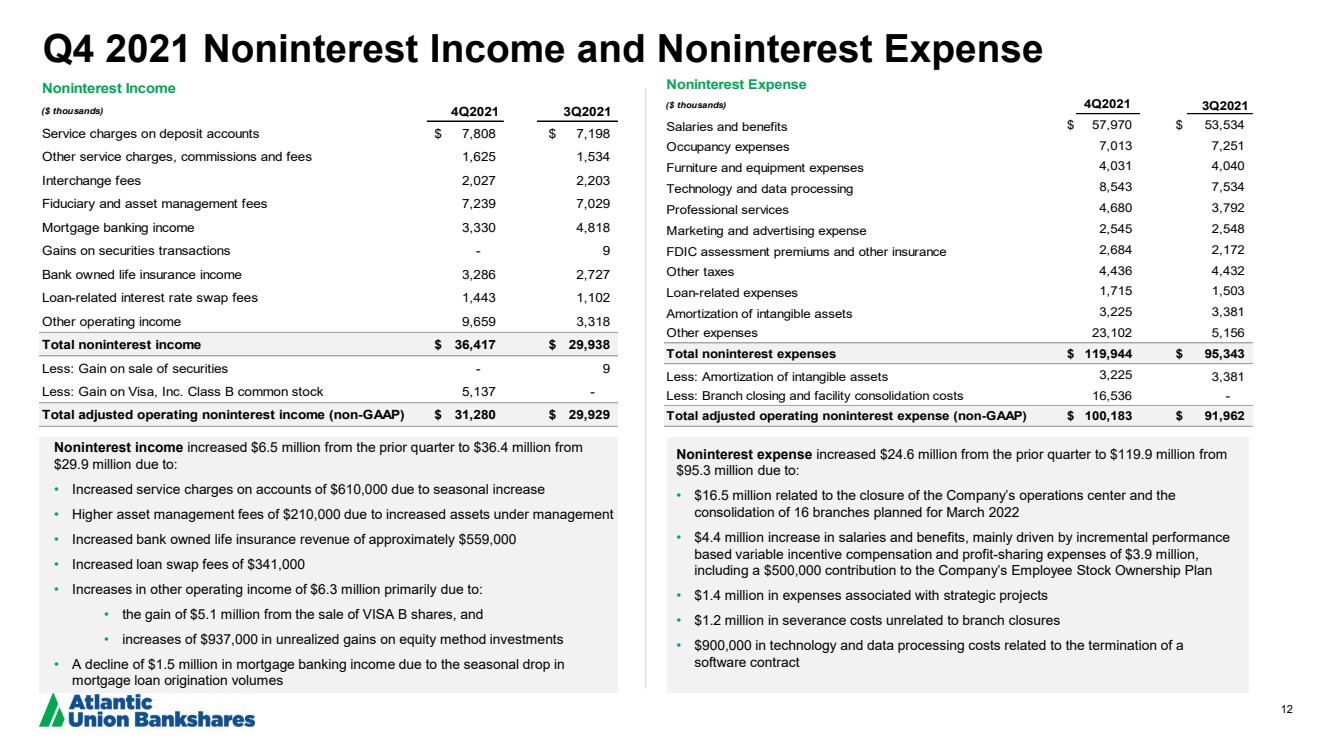
| 12 Q4 2021 Noninterest Income and Noninterest Expense Noninterest income increased $6.5 million from the prior quarter to $36.4 million from $29.9 million due to: • Increased service charges on accounts of $610,000 due to seasonal increase • Higher asset management fees of $ 210,000 due to increased assets under management • Increased bank owned life insurance revenue of approximately $ 559,000 • Increased loan swap fees of $341,000 • Increases in other operating income of $6.3 million primarily due to: • the gain of $5.1 million from the sale of VISA B shares, and • increases of $937,000 in unrealized gains on equity method investments • A decline of $1.5 million in mortgage banking income due to the seasonal drop in mortgage loan origination volumes Noninterest expense increased $24.6 million from the prior quarter to $119.9 million from $95.3 million due to: • $16.5 million related to the closure of the Company’s operations center and the consolidation of 16 branches planned for March 2022 • $4.4 million increase in salaries and benefits, mainly driven by incremental performance based variable incentive compensation and profit - sharing expenses of $3.9 million, including a $500,000 contribution to the Company’s Employee Stock Ownership Plan • $ 1.4 million in expenses associated with strategic projects • $1.2 million in severance costs unrelated to branch closures • $900,000 in technology and data processing costs related to the termination of a software contract Noninterest Income ($ thousands) 4Q2021 3Q2021 Service charges on deposit accounts $ 7,808 $ 7,198 Other service charges, commissions and fees 1,625 1,534 Interchange fees 2,027 2,203 Fiduciary and asset management fees 7,239 7,029 Mortgage banking income 3,330 4,818 Gains on securities transactions - 9 Bank owned life insurance income 3,286 2,727 Loan-related interest rate swap fees 1,443 1,102 Other operating income 9,659 3,318 Total noninterest income $ 36,417 $ 29,938 Less: Gain on sale of securities - 9 Less: Gain on Visa, Inc. Class B common stock 5,137 - Total adjusted operating noninterest income (non-GAAP) $ 31,280 $ 29,929 Noninterest Expense ($ thousands) 4Q2021 3Q2021 Salaries and benefits $ 57,970 $ 53,534 Occupancy expenses 7,013 7,251 Furniture and equipment expenses 4,031 4,040 Technology and data processing 8,543 7,534 Professional services 4,680 3,792 Marketing and advertising expense 2,545 2,548 FDIC assessment premiums and other insurance 2,684 2,172 Other taxes 4,436 4,432 Loan-related expenses 1,715 1,503 Amortization of intangible assets 3,225 3,381 Other expenses 23,102 5,156 Total noninterest expenses $ 119,944 $ 95,343 Less: Amortization of intangible assets 3,225 3,381 Less: Branch closing and facility consolidation costs 16,536 - Total adjusted operating noninterest expense (non-GAAP) $ 100,183 $ 91,962 |
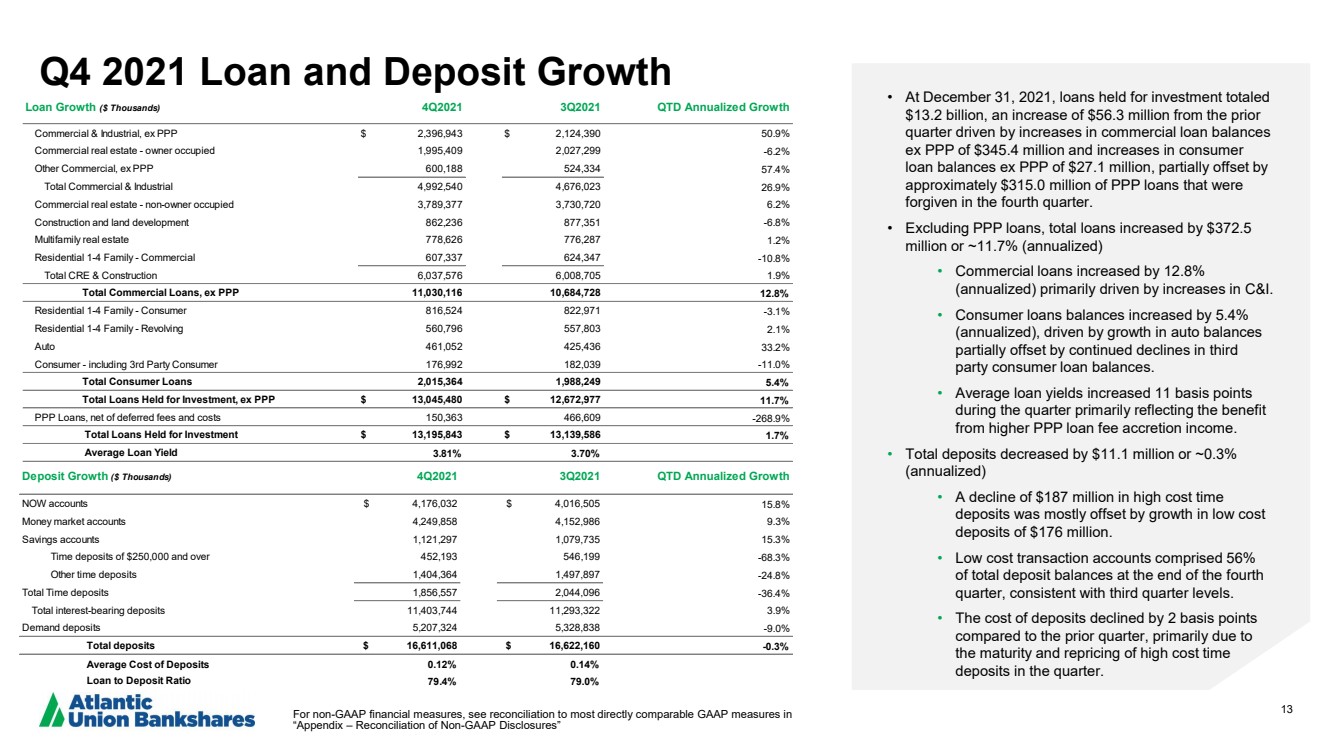
| 13 Q4 2021 Loan and Deposit Growth • At December 31, 2021, loans held for investment totaled $ 13.2 billion, an increase of $ 56.3 million from the prior quarter driven by increases in commercial loan balances ex PPP of $345.4 million and increases in consumer loan balances ex PPP of $27.1 million, partially offset by approximately $315.0 million of PPP loans that were forgiven in the fourth quarter. • Excluding PPP loans, total loans increased by $372.5 million or ~11.7% (annualized) • Commercial loans increased by 12.8% (annualized) primarily driven by increases in C&I. • Consumer loans balances increased by 5.4% (annualized), driven by growth in auto balances partially offset by continued declines in third party consumer loan balances. • Average loan yields increased 11 basis points during the quarter primarily reflecting the benefit from higher PPP loan fee accretion income. • Total deposits decreased by $11.1 million or ~0.3% (annualized) • A decline of $187 million in high cost time deposits was mostly offset by growth in low cost deposits of $ 176 million. • Low cost transaction accounts comprised 56% of total deposit balances at the end of the fourth quarter, consistent with third quarter levels. • The cost of deposits declined by 2 basis points compared to the prior quarter, primarily due to the maturity and repricing of high cost time deposits in the quarter. For non - GAAP financial measures, see reconciliation to most directly comparable GAAP measures in “Appendix – Reconciliation of Non - GAAP Disclosures” Deposit Growth ($ Thousands) 4Q2021 3Q2021 QTD Annualized Growth NOW accounts $ 4,176,032 $ 4,016,505 15.8% Money market accounts 4,249,858 4,152,986 9.3% Savings accounts 1,121,297 1,079,735 15.3% Time deposits of $250,000 and over 452,193 546,199 -68.3% Other time deposits 1,404,364 1,497,897 -24.8% Total Time deposits 1,856,557 2,044,096 -36.4% Total interest-bearing deposits 11,403,744 11,293,322 3.9% Demand deposits 5,207,324 5,328,838 -9.0% Total deposits $ 16,611,068 $ 16,622,160 -0.3% Average Cost of Deposits 0.12% 0.14% Loan to Deposit Ratio 79.4% 79.0% Loan Growth ($ Thousands) 4Q2021 3Q2021 QTD Annualized Growth Commercial & Industrial, ex PPP $ 2,396,943 $ 2,124,390 50.9% Commercial real estate - owner occupied 1,995,409 2,027,299 -6.2% Other Commercial, ex PPP 600,188 524,334 57.4% Total Commercial & Industrial 4,992,540 4,676,023 26.9% Commercial real estate - non-owner occupied 3,789,377 3,730,720 6.2% Construction and land development 862,236 877,351 -6.8% Multifamily real estate 778,626 776,287 1.2% Residential 1-4 Family - Commercial 607,337 624,347 -10.8% Total CRE & Construction 6,037,576 6,008,705 1.9% Total Commercial Loans, ex PPP 11,030,116 10,684,728 12.8% Residential 1-4 Family - Consumer 816,524 822,971 -3.1% Residential 1-4 Family - Revolving 560,796 557,803 2.1% Auto 461,052 425,436 33.2% Consumer - including 3rd Party Consumer 176,992 182,039 -11.0% Total Consumer Loans 2,015,364 1,988,249 5.4% Total Loans Held for Investment, ex PPP $ 13,045,480 $ 12,672,977 11.7% PPP Loans, net of deferred fees and costs 150,363 466,609 -268.9% Total Loans Held for Investment $ 13,195,843 $ 13,139,586 1.7% Average Loan Yield 3.81% 3.70% |
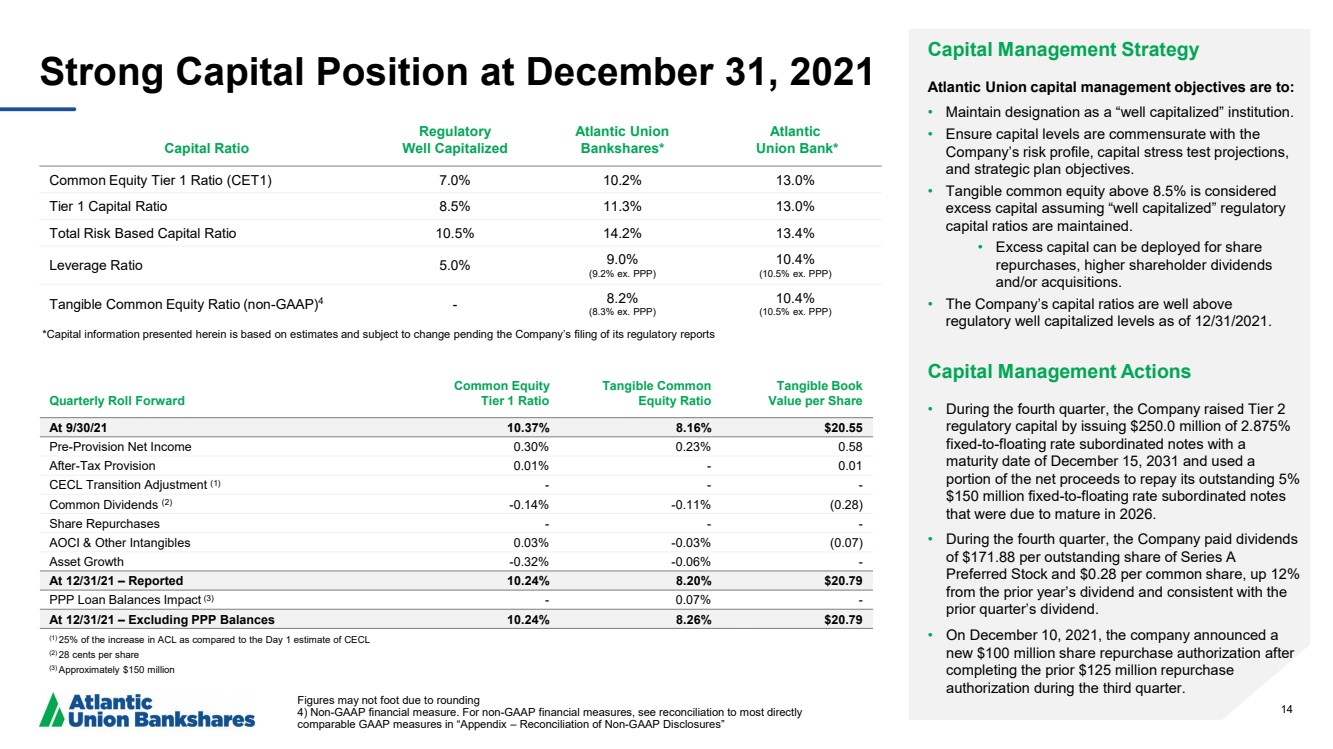
| 14 Strong Capital Position at December 31, 2021 Capital Ratio Regulatory Well Capitalized Atlantic Union Bankshares* Atlantic Union Bank* Common Equity Tier 1 Ratio (CET1) 7.0% 10.2% 13.0% Tier 1 Capital Ratio 8.5% 11.3% 13.0% Total Risk Based Capital Ratio 10.5% 14.2% 13.4% Leverage Ratio 5.0% 9.0% ( 9.2% ex. PPP) 10.4% ( 10.5% ex. PPP) Tangible Common Equity Ratio (non - GAAP) 4 - 8.2% ( 8.3% ex. PPP) 10.4% ( 10.5% ex. PPP) Figures may not foot due to rounding 4) Non - GAAP financial measure. For non - GAAP financial measures, see reconciliation to most directly comparable GAAP measures in “Appendix – Reconciliation of Non - GAAP Disclosures” Capital Management Strategy Atlantic Union capital management objectives are to: • Maintain designation as a “well capitalized” institution. • Ensure capital levels are commensurate with the Company’s risk profile, capital stress test projections, and strategic plan objectives. • Tangible common equity above 8.5% is considered excess capital assuming “well capitalized” regulatory capital ratios are maintained. • Excess capital can be deployed for share repurchases, higher shareholder dividends and/or acquisitions. • The Company’s capital ratios are well above regulatory well capitalized levels as of 12/31/2021 .. Capital Management Actions • During the fourth quarter, the Company raised Tier 2 regulatory capital by issuing $250.0 million of 2.875% fixed - to - floating rate subordinated notes with a maturity date of December 15, 2031 and used a portion of the net proceeds to repay its outstanding 5% $150 million fixed - to - floating rate subordinated notes that were due to mature in 2026 .. • During the fourth quarter, the Company paid dividends of $171.88 per outstanding share of Series A Preferred Stock and $0.28 per common share, up 12% from the prior year’s dividend and consistent with the prior quarter’s dividend .. • On December 10, 2021, the company announced a new $100 million share repurchase authorization after completing the prior $125 million repurchase authorization during the third quarter. Quarterly Roll Forward Common Equity Tier 1 Ratio Tangible Common Equity Ratio Tangible Book Value per Share At 9/30/21 10.37% 8.16% $ 20.55 Pre - Provision Net Income 0.30% 0.23% 0.58 After - Tax Provision 0.01% - 0.01 CECL Transition Adjustment (1) - - - Common Dividends (2) - 0.14% - 0.11% ( 0.28) Share Repurchases - - - AOCI & Other Intangibles 0.03% - 0.03% ( 0.07) Asset Growth - 0.32% - 0.06% - At 12/31/21 – Reported 10.24% 8.20% $ 20.79 PPP Loan Balances Impact (3) - 0.07% - At 12/31/21 – Excluding PPP Balances 10.24% 8.26% $ 20.79 (1) 25% of the increase in ACL as compared to the Day 1 estimate of CECL (2) 28 cents per share (3) Approximately $150 million *Capital information presented herein is based on estimates and subject to change pending the Company’s filing of its regulat or y reports |
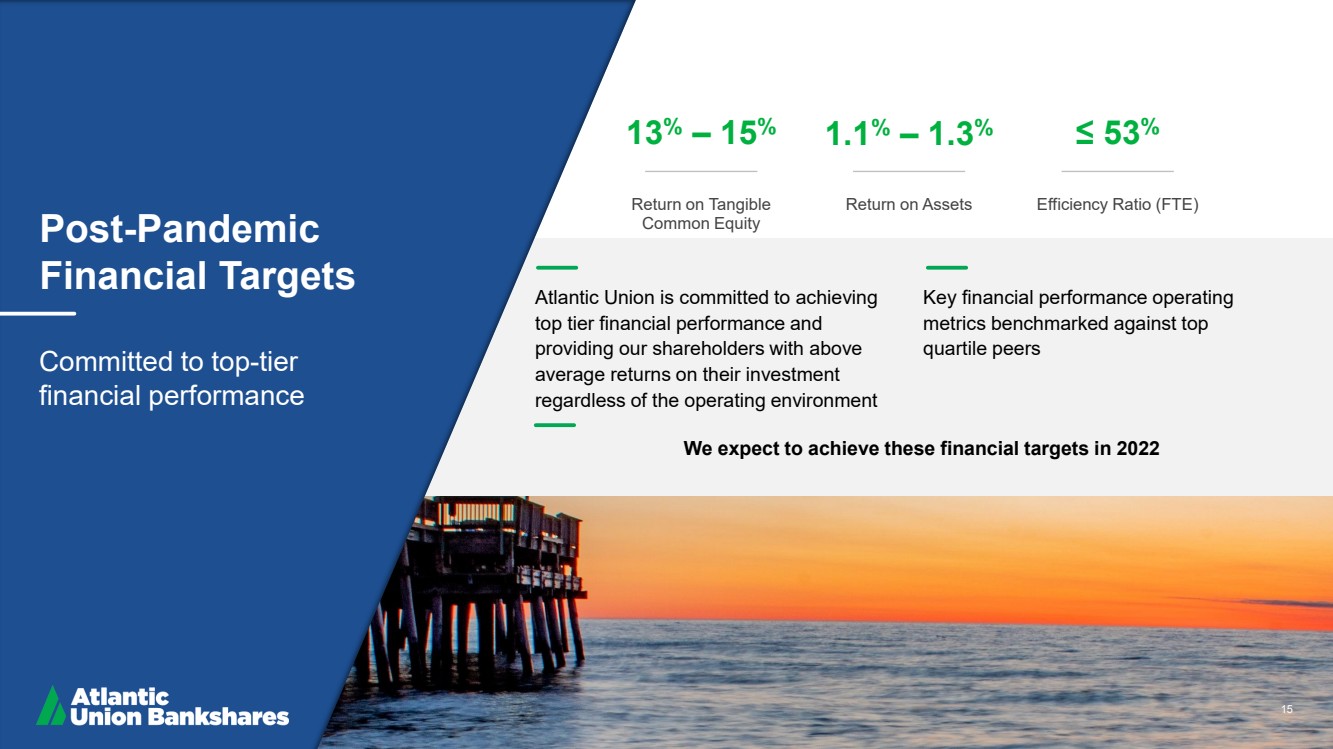
| 15 Post - Pandemic Financial Targets Committed to top - tier financial performance 13 % – 15 % Return on Tangible Common Equity 1.1 % – 1.3 % Return on Assets ≤ 53 % Efficiency Ratio (FTE) Atlantic Union is committed to achieving top tier financial performance and providing our shareholders with above average returns on their investment regardless of the operating environment Key financial performance operating metrics benchmarked against top quartile peers 15 We expect to achieve these financial targets in 2022 |
| 16 Appendix |

| 17 Reconciliation of Non - GAAP Disclosures The Company has provided supplemental performance measures on a tax - equivalent, tangible, operating, adjusted, or pre - tax pre - pr ovision basis. These non - GAAP financial measures are a supplement to GAAP, which is used to prepare the Company’s financial statements, and should not be considered in isolation or as a substitute for analysis of our results as reported under GAAP. In addition, the Company’s non - GAAP financial measures may not be comparable to non - GAAP financial measures of other companies. The Company uses the non - GAAP financial measur es discussed herein in its analysis of the Company’s performance. The Company’s management believes that these non - GAAP financial m easures provide additional understanding of ongoing operations, enhance comparability of results of operations with prior periods and sh ow the effects of significant gains and charges in the periods presented without the impact of items or events that may obscure trends in the C omp any’s underlying performance. |
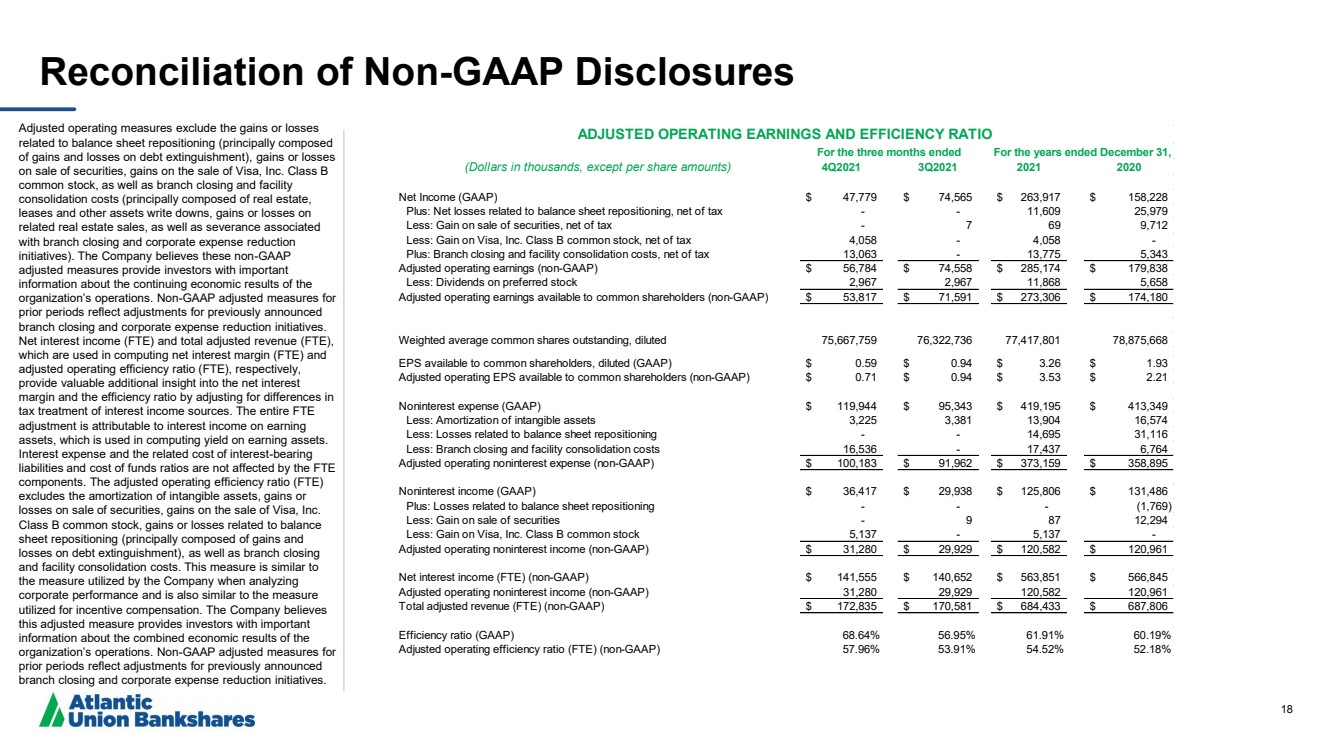
| 18 Reconciliation of Non - GAAP Disclosures Adjusted operating measures exclude the gains or losses related to balance sheet repositioning (principally composed of gains and losses on debt extinguishment), gains or losses on sale of securities, gains on the sale of Visa, Inc. Class B common stock, as well as branch closing and facility consolidation costs (principally composed of real estate, leases and other assets write downs, gains or losses on related real estate sales, as well as severance associated with branch closing and corporate expense reduction initiatives). The Company believes these non - GAAP adjusted measures provide investors with important information about the continuing economic results of the organization’s operations. Non - GAAP adjusted measures for prior periods reflect adjustments for previously announced branch closing and corporate expense reduction initiatives. Net interest income (FTE) and total adjusted revenue (FTE), which are used in computing net interest margin (FTE) and adjusted operating efficiency ratio (FTE), respectively, provide valuable additional insight into the net interest margin and the efficiency ratio by adjusting for differences in tax treatment of interest income sources. The entire FTE adjustment is attributable to interest income on earning assets, which is used in computing yield on earning assets. Interest expense and the related cost of interest - bearing liabilities and cost of funds ratios are not affected by the FTE components. The adjusted operating efficiency ratio (FTE) excludes the amortization of intangible assets, gains or losses on sale of securities, gains on the sale of Visa, Inc. Class B common stock, gains or losses related to balance sheet repositioning (principally composed of gains and losses on debt extinguishment), as well as branch closing and facility consolidation costs. This measure is similar to the measure utilized by the Company when analyzing corporate performance and is also similar to the measure utilized for incentive compensation. The Company believes this adjusted measure provides investors with important information about the combined economic results of the organization’s operations. Non - GAAP adjusted measures for prior periods reflect adjustments for previously announced branch closing and corporate expense reduction initiatives. (Dollars in thousands, except per share amounts) 4Q2021 3Q2021 2021 2020 Net Income (GAAP) 47,779 $ 74,565 $ 263,917 $ 158,228 $ Plus: Net losses related to balance sheet repositioning, net of tax - - 11,609 25,979 Less: Gain on sale of securities, net of tax - 7 69 9,712 Less: Gain on Visa, Inc. Class B common stock, net of tax 4,058 - 4,058 - Plus: Branch closing and facility consolidation costs, net of tax 13,063 - 13,775 5,343 Adjusted operating earnings (non-GAAP) 56,784 $ 74,558 $ 285,174 $ 179,838 $ Less: Dividends on preferred stock 2,967 2,967 11,868 5,658 Adjusted operating earnings available to common shareholders (non-GAAP) 53,817 $ 71,591 $ 273,306 $ 174,180 $ Weighted average common shares outstanding, diluted 75,667,759 76,322,736 77,417,801 78,875,668 EPS available to common shareholders, diluted (GAAP) 0.59 $ 0.94 $ 3.26 $ 1.93 $ Adjusted operating EPS available to common shareholders (non-GAAP) 0.71 $ 0.94 $ 3.53 $ 2.21 $ Noninterest expense (GAAP) 119,944 $ 95,343 $ 419,195 $ 413,349 $ Less: Amortization of intangible assets 3,225 3,381 13,904 16,574 Less: Losses related to balance sheet repositioning - - 14,695 31,116 Less: Branch closing and facility consolidation costs 16,536 - 17,437 6,764 Adjusted operating noninterest expense (non-GAAP) 100,183 $ 91,962 $ 373,159 $ 358,895 $ Noninterest income (GAAP) 36,417 $ 29,938 $ 125,806 $ 131,486 $ Plus: Losses related to balance sheet repositioning - - - (1,769) Less: Gain on sale of securities - 9 87 12,294 Less: Gain on Visa, Inc. Class B common stock 5,137 - 5,137 - Adjusted operating noninterest income (non-GAAP) 31,280 $ 29,929 $ 120,582 $ 120,961 $ Net interest income (FTE) (non-GAAP) 141,555 $ 140,652 $ 563,851 $ 566,845 $ Adjusted operating noninterest income (non-GAAP) 31,280 29,929 120,582 120,961 Total adjusted revenue (FTE) (non-GAAP) 172,835 $ 170,581 $ 684,433 $ 687,806 $ Efficiency ratio (GAAP) 68.64% 56.95% 61.91% 60.19% Adjusted operating efficiency ratio (FTE) (non-GAAP) 57.96% 53.91% 54.52% 52.18% For the three months ended For the years ended December 31, ADJUSTED OPERATING EARNINGS AND EFFICIENCY RATIO |
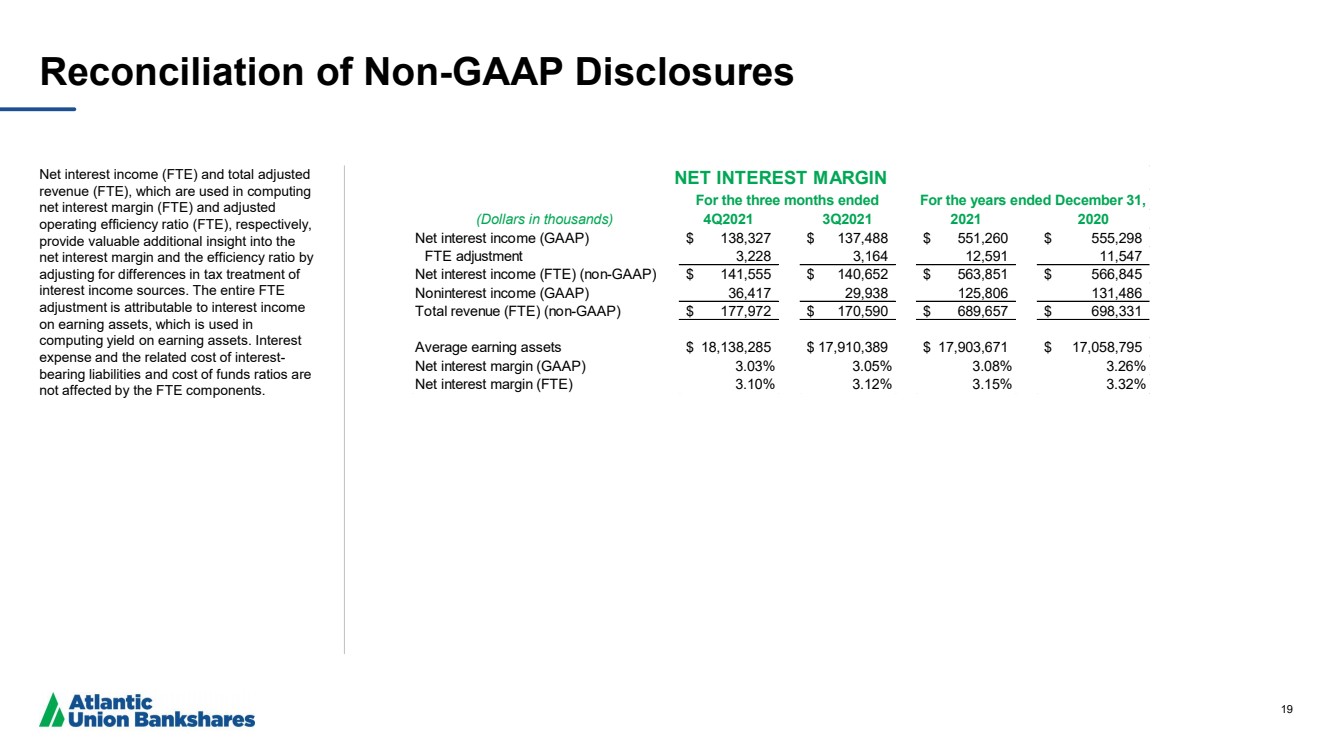
| 19 Reconciliation of Non - GAAP Disclosures Net interest income (FTE) and total adjusted revenue (FTE), which are used in computing net interest margin (FTE) and adjusted operating efficiency ratio (FTE), respectively, provide valuable additional insight into the net interest margin and the efficiency ratio by adjusting for differences in tax treatment of interest income sources. The entire FTE adjustment is attributable to interest income on earning assets, which is used in computing yield on earning assets. Interest expense and the related cost of interest - bearing liabilities and cost of funds ratios are not affected by the FTE components. (Dollars in thousands) 4Q2021 3Q2021 2021 2020 Net interest income (GAAP) 138,327 $ 137,488 $ 551,260 $ 555,298 $ FTE adjustment 3,228 3,164 12,591 11,547 Net interest income (FTE) (non-GAAP) 141,555 $ 140,652 $ 563,851 $ 566,845 $ Noninterest income (GAAP) 36,417 29,938 125,806 131,486 Total revenue (FTE) (non-GAAP) 177,972 $ 170,590 $ 689,657 $ 698,331 $ Average earning assets 18,138,285 $ 17,910,389 $ 17,903,671 $ 17,058,795 $ Net interest margin (GAAP) 3.03% 3.05% 3.08% 3.26% Net interest margin (FTE) 3.10% 3.12% 3.15% 3.32% For the three months ended NET INTEREST MARGIN For the years ended December 31, |
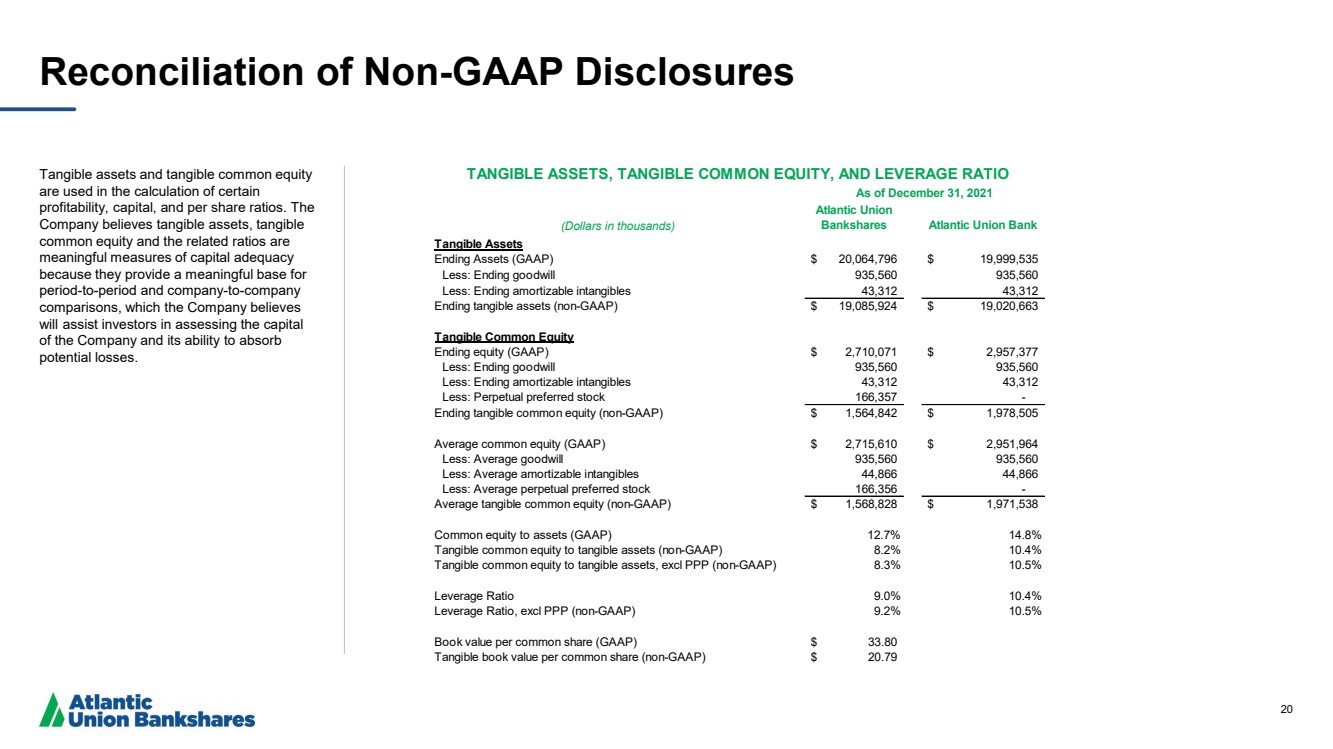
| 20 Reconciliation of Non - GAAP Disclosures Tangible assets and tangible common equity are used in the calculation of certain profitability, capital, and per share ratios. The Company believes tangible assets, tangible common equity and the related ratios are meaningful measures of capital adequacy because they provide a meaningful base for period - to - period and company - to - company comparisons, which the Company believes will assist investors in assessing the capital of the Company and its ability to absorb potential losses. (Dollars in thousands) Atlantic Union Bankshares Atlantic Union Bank Tangible Assets Ending Assets (GAAP) 20,064,796 $ 19,999,535 $ Less: Ending goodwill 935,560 935,560 Less: Ending amortizable intangibles 43,312 43,312 Ending tangible assets (non-GAAP) 19,085,924 $ 19,020,663 $ Tangible Common Equity Ending equity (GAAP) 2,710,071 $ 2,957,377 $ Less: Ending goodwill 935,560 935,560 Less: Ending amortizable intangibles 43,312 43,312 Less: Perpetual preferred stock 166,357 - Ending tangible common equity (non-GAAP) 1,564,842 $ 1,978,505 $ Average common equity (GAAP) 2,715,610 $ 2,951,964 $ Less: Average goodwill 935,560 935,560 Less: Average amortizable intangibles 44,866 44,866 Less: Average perpetual preferred stock 166,356 - Average tangible common equity (non-GAAP) 1,568,828 $ 1,971,538 $ Less: Perpetual preferred stock Common equity to assets (GAAP) 12.7% 14.8% Tangible common equity to tangible assets (non-GAAP) 8.2% 10.4% Tangible common equity to tangible assets, excl PPP (non-GAAP) 8.3% 10.5% Leverage Ratio 9.0% 10.4% Leverage Ratio, excl PPP (non-GAAP) 9.2% 10.5% Book value per common share (GAAP) 33.80 $ Tangible book value per common share (non-GAAP) 20.79 $ TANGIBLE ASSETS, TANGIBLE COMMON EQUITY, AND LEVERAGE RATIO As of December 31, 2021 |
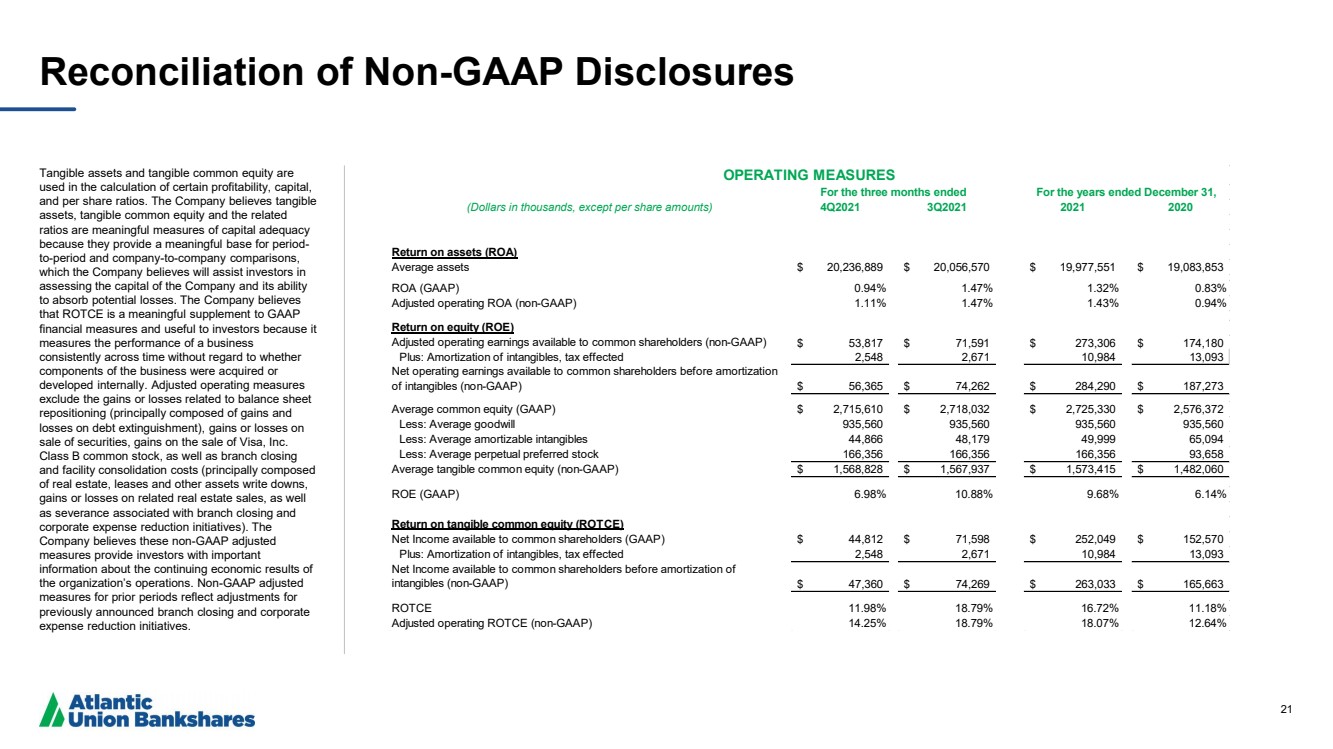
| 21 Reconciliation of Non - GAAP Disclosures Tangible assets and tangible common equity are used in the calculation of certain profitability, capital, and per share ratios. The Company believes tangible assets, tangible common equity and the related ratios are meaningful measures of capital adequacy because they provide a meaningful base for period - to - period and company - to - company comparisons, which the Company believes will assist investors in assessing the capital of the Company and its ability to absorb potential losses. The Company believes that ROTCE is a meaningful supplement to GAAP financial measures and useful to investors because it measures the performance of a business consistently across time without regard to whether components of the business were acquired or developed internally. Adjusted operating measures exclude the gains or losses related to balance sheet repositioning (principally composed of gains and losses on debt extinguishment), gains or losses on sale of securities, gains on the sale of Visa, Inc. Class B common stock, as well as branch closing and facility consolidation costs (principally composed of real estate, leases and other assets write downs, gains or losses on related real estate sales, as well as severance associated with branch closing and corporate expense reduction initiatives). The Company believes these non - GAAP adjusted measures provide investors with important information about the continuing economic results of the organization’s operations. Non - GAAP adjusted measures for prior periods reflect adjustments for previously announced branch closing and corporate expense reduction initiatives. (Dollars in thousands, except per share amounts) 4Q2021 3Q2021 2021 2020 Return on assets (ROA) Average assets 20,236,889 $ 20,056,570 $ 19,977,551 $ 19,083,853 $ ROA (GAAP) 0.94% 1.47% 1.32% 0.83% Adjusted operating ROA (non-GAAP) 1.11% 1.47% 1.43% 0.94% Return on equity (ROE) Adjusted operating earnings available to common shareholders (non-GAAP) 53,817 $ 71,591 $ 273,306 $ 174,180 $ Plus: Amortization of intangibles, tax effected 2,548 2,671 10,984 13,093 Net operating earnings available to common shareholders before amortization of intangibles (non-GAAP) 56,365 $ 74,262 $ 284,290 $ 187,273 $ Average common equity (GAAP) 2,715,610 $ 2,718,032 $ 2,725,330 $ 2,576,372 $ Less: Average goodwill 935,560 935,560 935,560 935,560 Less: Average amortizable intangibles 44,866 48,179 49,999 65,094 Less: Average perpetual preferred stock 166,356 166,356 166,356 93,658 Average tangible common equity (non-GAAP) 1,568,828 $ 1,567,937 $ 1,573,415 $ 1,482,060 $ ROE (GAAP) 6.98% 10.88% 9.68% 6.14% Return on tangible common equity (ROTCE) Net Income available to common shareholders (GAAP) 44,812 $ 71,598 $ 252,049 $ 152,570 $ Plus: Amortization of intangibles, tax effected 2,548 2,671 10,984 13,093 Net Income available to common shareholders before amortization of intangibles (non-GAAP) 47,360 $ 74,269 $ 263,033 $ 165,663 $ ROTCE 11.98% 18.79% 16.72% 11.18% Adjusted operating ROTCE (non-GAAP) 14.25% 18.79% 18.07% 12.64% For the three months ended OPERATING MEASURES For the years ended December 31, |
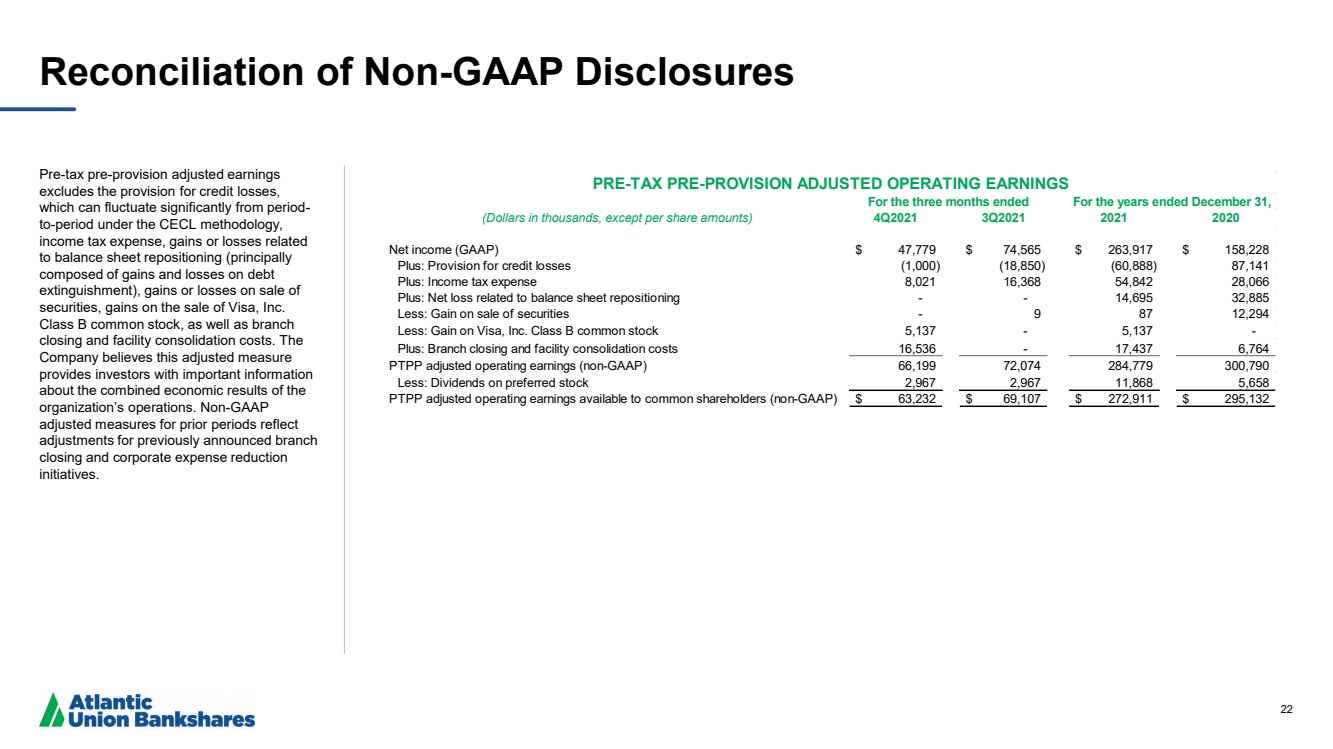
| 22 Reconciliation of Non - GAAP Disclosures Pre - tax pre - provision adjusted earnings excludes the provision for credit losses, which can fluctuate significantly from period - to - period under the CECL methodology, income tax expense, gains or losses related to balance sheet repositioning (principally composed of gains and losses on debt extinguishment), gains or losses on sale of securities, gains on the sale of Visa, Inc. Class B common stock, as well as branch closing and facility consolidation costs. The Company believes this adjusted measure provides investors with important information about the combined economic results of the organization’s operations. Non - GAAP adjusted measures for prior periods reflect adjustments for previously announced branch closing and corporate expense reduction initiatives. (Dollars in thousands, except per share amounts) 4Q2021 3Q2021 2021 2020 Net income (GAAP) 47,779 $ 74,565 $ 263,917 $ 158,228 $ Plus: Provision for credit losses (1,000) (18,850) (60,888) 87,141 Plus: Income tax expense 8,021 16,368 54,842 28,066 Plus: Net loss related to balance sheet repositioning - - 14,695 32,885 Less: Gain on sale of securities - 9 87 12,294 Less: Gain on Visa, Inc. Class B common stock 5,137 - 5,137 - Plus: Branch closing and facility consolidation costs 16,536 - 17,437 6,764 PTPP adjusted operating earnings (non-GAAP) 66,199 72,074 284,779 300,790 Less: Dividends on preferred stock 2,967 2,967 11,868 5,658 PTPP adjusted operating earnings available to common shareholders (non-GAAP) 63,232 $ 69,107 $ 272,911 $ 295,132 $ For the three months ended PRE-TAX PRE-PROVISION ADJUSTED OPERATING EARNINGS For the years ended December 31, |
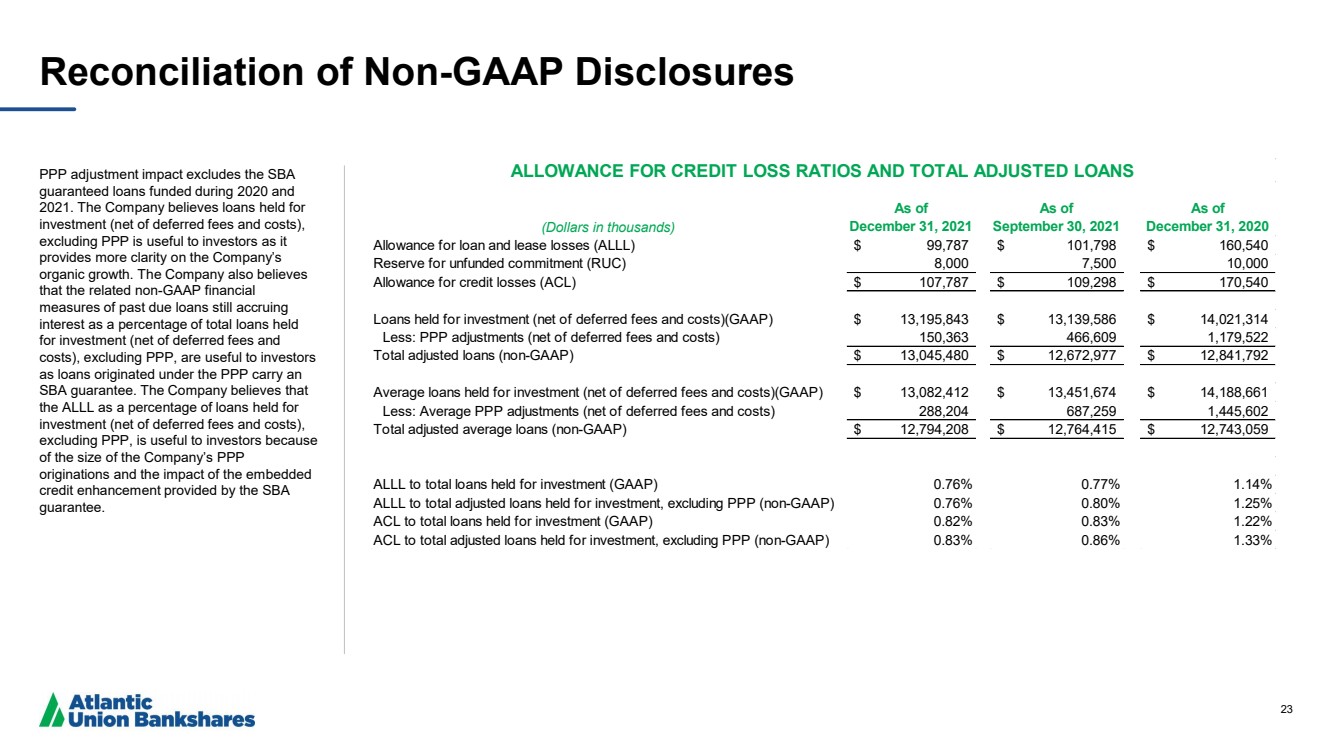
| 23 Reconciliation of Non - GAAP Disclosures PPP adjustment impact excludes the SBA guaranteed loans funded during 2020 and 2021. The Company believes loans held for investment (net of deferred fees and costs), excluding PPP is useful to investors as it provides more clarity on the Company’s organic growth. The Company also believes that the related non - GAAP financial measures of past due loans still accruing interest as a percentage of total loans held for investment (net of deferred fees and costs), excluding PPP, are useful to investors as loans originated under the PPP carry an SBA guarantee. The Company believes that the ALLL as a percentage of loans held for investment (net of deferred fees and costs), excluding PPP, is useful to investors because of the size of the Company’s PPP originations and the impact of the embedded credit enhancement provided by the SBA guarantee. (Dollars in thousands) As of December 31, 2021 As of September 30, 2021 As of December 31, 2020 Allowance for loan and lease losses (ALLL) 99,787 $ 101,798 $ 160,540 $ Reserve for unfunded commitment (RUC) 8,000 7,500 10,000 Allowance for credit losses (ACL) 107,787 $ 109,298 $ 170,540 $ Loans held for investment (net of deferred fees and costs)(GAAP) 13,195,843 $ 13,139,586 $ 14,021,314 $ Less: PPP adjustments (net of deferred fees and costs) 150,363 466,609 1,179,522 Total adjusted loans (non-GAAP) 13,045,480 $ 12,672,977 $ 12,841,792 $ Average loans held for investment (net of deferred fees and costs)(GAAP) 13,082,412 $ 13,451,674 $ 14,188,661 $ Less: Average PPP adjustments (net of deferred fees and costs) 288,204 687,259 1,445,602 Total adjusted average loans (non-GAAP) 12,794,208 $ 12,764,415 $ 12,743,059 $ ALLL to total loans held for investment (GAAP) 0.76% 0.77% 1.14% ALLL to total adjusted loans held for investment, excluding PPP (non-GAAP) 0.76% 0.80% 1.25% ACL to total loans held for investment (GAAP) 0.82% 0.83% 1.22% ACL to total adjusted loans held for investment, excluding PPP (non-GAAP) 0.83% 0.86% 1.33% ALLOWANCE FOR CREDIT LOSS RATIOS AND TOTAL ADJUSTED LOANS |