| 3rd Quarter FY2021 Earnings Presentation Nasdaq: AUB October 25, 2021 |

| Forward Looking Statements 2 Certain statements in this presentation may constitute “forward-looking statements” within the meaning of the Private Securities Litigation Reform Act of 1995. Forward-looking statements are statements that include, projections, predictions, expectations, or beliefs about future events or results that are not statements of historical fact. Such forward-looking statements are based on various assumptions as of the time they are made, and are inherently subject to known and unknown risks, uncertainties, and other factors, some of which cannot be predicted or quantified, that may cause actual results, performance, or achievements to be materially different from those expressed or implied by such forward-looking statements. Forward-looking statements are often accompanied by words that convey projected future events or outcomes such as “expect,” “believe,” “estimate,” “plan,” “project,” “anticipate,” “intend,” “will,” “may,” “view,” “opportunity,” “potential,” or words of similar meaning or other statements concerning opinions or judgment of the Company and its management about future events. Although the Company believes that its expectations with respect to forward-looking statements are based upon reasonable assumptions within the bounds of its existing knowledge of its business and operations, there can be no assurance that actual results, performance, or achievements of, or trends affecting, the Company will not differ materially from any projected future results, performance, or achievements expressed or implied by such forward-looking statements. Actual future results, performance, achievements or trends may differ materially from historical results or those anticipated depending on a variety of factors, including, but not limited to the effects of or changes in: • changes in interest rates; • general economic and financial market conditions, in the United States generally and particularly in the markets in which the Company operates and which its loans are concentrated, including the effects of declines in real estate values, an increase in unemployment levels and slowdowns in economic growth, including as a result of COVID-19; • the quality or composition of the loan or investment portfolios and changes therein; • demand for loan products and financial services in the Company’s market area; • the Company’s ability to manage its growth or implement its growth strategy; • the effectiveness of expense reduction plans; • the introduction of new lines of business or new products and services; • the Company’s ability to recruit and retain key employees; • the incremental cost and/or decreased revenues associated with exceeding $10 billion in assets; • real estate values in the Bank’s lending area; • an insufficient ACL; • changes in accounting principles; • the Company’s liquidity and capital positions; • concentrations of loans secured by real estate, particularly commercial real estate; • the effectiveness of the Company’s credit processes and management of the Company’s credit risk; • the Company’s ability to compete in the market for financial services and increased competition from fintech companies; • technological risks and developments, and cyber threats, attacks, or events; • the potential adverse effects of unusual and infrequently occurring events, such as weather- related disasters, terrorist acts or public health events (such as COVID-19), and of governmental and societal responses thereto; these potential adverse effects may include, without limitation, adverse effects on the ability of the Company's borrowers to satisfy their obligations to the Company, on the value of collateral securing loans, on the demand for the Company's loans or its other products and services, on supply chains and methods used to distribute products and services, on incidents of cyberattack and fraud, on the Company’s liquidity or capital positions, on risks posed by reliance on third-party service providers, on other aspects of the Company's business operations and on financial markets and economic growth; • the effect of steps the Company takes in response to COVID-19, the severity and duration of the pandemic, the uncertainty regarding new variants of COVID-19 that have emerged, the speed and efficacy of vaccine and treatment developments, the impact of loosening or tightening of government restrictions, the pace of recovery when the pandemic subsides and the heightened impact it has on many of the risks described herein; • the discontinuation of LIBOR and its impact on the financial markets, and the Company’s ability to manage operational, legal and compliance risks related to the discontinuation of LIBOR and implementation of one or more alternate reference rates, • performance by the Company’s counterparties or vendors; • deposit flows; • the availability of financing and the terms thereof; • the level of prepayments on loans and mortgage-backed securities; • legislative or regulatory changes and requirements, including the impact of the CARES Act, as amended by the CAA, and other legislative and regulatory reactions to COVID-19; • potential claims, damages, and fines related to litigation or government actions, including litigation or actions arising from the Company’s participation in and administration of programs related to COVID-19, including, among other things, the CARES Act, as amended by the CAA; • the effects of changes in federal, state or local tax laws and regulations; • monetary and fiscal policies of the U.S. government, including policies of the U.S. Department of the Treasury and the Federal Reserve; • changes to applicable accounting principles and guidelines; and • other factors, many of which are beyond the control of the Company. Please refer to the “Risk Factors” and “Management’s Discussion and Analysis of Financial Condition and Results of Operations” sections of the Company’s Annual Report on Form 10 K for the year ended December 31, 2020 and related disclosures in other filings, which have been filed with the SEC and are available on the SEC’s website at www.sec.gov. All of the forward-looking statements made in this presentation are expressly qualified by the cautionary statements contained or referred to herein. The actual results or developments anticipated may not be realized or, even if substantially realized, they may not have the expected consequences to or effects on the Company or its businesses or operations. Readers are cautioned not to rely too heavily on the forward-looking statements contained in this presentation. Forward-looking statements speak only as of the date they are made and the Company does not undertake any obligation to update, revise or clarify these forward-looking statements, whether as a result of new information, future events or otherwise. |
| Additional Information 3 Non-GAAP Financial Measures This presentation contains certain financial information determined by methods other than in accordance with generally accepted accounting principles in the United States (“GAAP”). These non-GAAP disclosures have limitations as analytical tools and should not be considered in isolation or as a substitute for analysis of our results as reported under GAAP, nor are they necessarily comparable to non-GAAP performance measures that may be presented by other companies. The Company uses the non-GAAP financial measures discussed herein in its analysis of the Company’s performance. The Company’s management believes that these non-GAAP financial measures provide additional understanding of ongoing operations, enhance comparability of results of operations with prior periods and show the effects of significant gains and charges in the periods presented without the impact of items or events that may obscure trends in the Company’s underlying performance. Please see “Reconciliation of Non-GAAP Disclosures” at the end of this presentation for a reconciliation to the nearest GAAP financial measure. No Offer or Solicitation This presentation does not constitute an offer to sell or a solicitation of an offer to buy any securities. No offer of securities shall be made except by means of a prospectus meeting the requirements of the Securities Act of 1933, as amended, and no offer to sell or solicitation of an offer to buy shall be made in any jurisdiction in which such offer, solicitation or sale would be unlawful. About Atlantic Union Bankshares Corporation Headquartered in Richmond, Virginia, Atlantic Union Bankshares Corporation (Nasdaq: AUB) is the holding company for Atlantic Union Bank. Atlantic Union Bank has 130 branches and approximately 150 ATMs located throughout Virginia, and in portions of Maryland and North Carolina. Certain non-bank financial services affiliates of Atlantic Union Bank include: Atlantic Union Equipment Finance, Inc., which provides equipment financing; Dixon, Hubard, Feinour & Brown, Inc., which provides investment advisory services; Atlantic Union Financial Consultants, LLC, which provides brokerage services; and Union Insurance Group, LLC, which offers various lines of insurance products. |
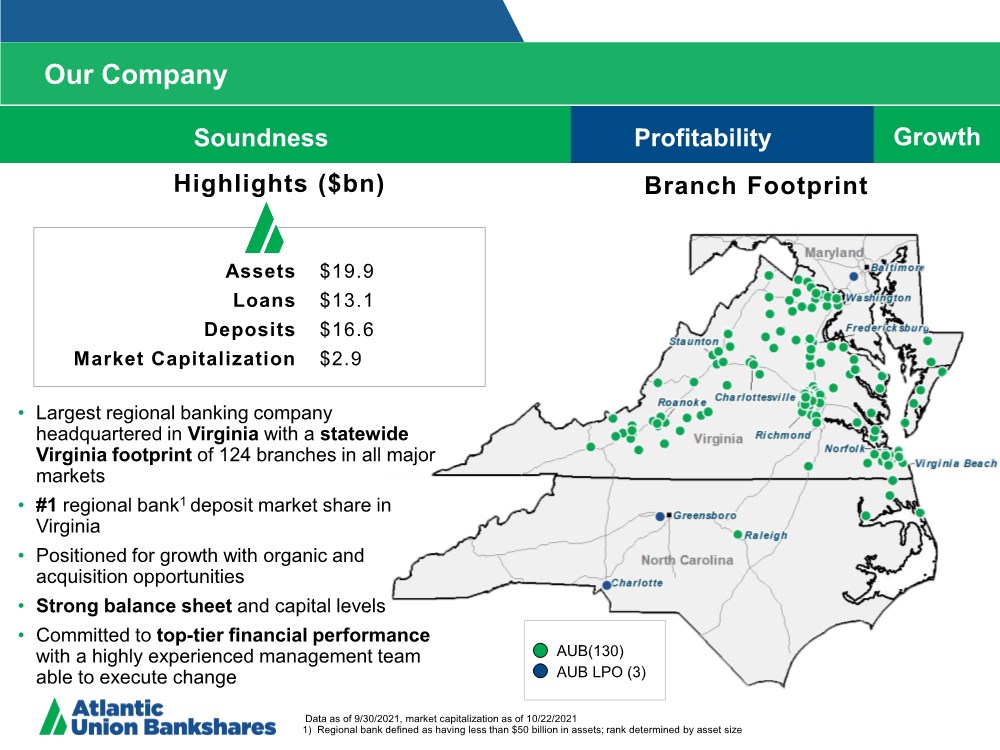
| Our Company 4 Branch Footprint Data as of 9/30/2021, market capitalization as of 10/21/2021 1) Regional bank defined as having less than $50 billion in assets; rank determined by asset size Assets Loans Deposits Market Capitalization $19.9 $13.1 $16.6 $2.9 • Largest regional banking company headquartered in Virginia with a statewide Virginia footprint of 124 branches in all major markets •#1 regional bank1 deposit market share in Virginia • Positioned for growth with organic and acquisition opportunities • Strong balance sheet and capital levels • Committed to top-tier financial performance with a highly experienced management team able to execute change Highlights ($bn) AUB(130) AUB LPO (3) Soundness Profitability Growth Data as of 9/30/2021, market capitalization as of 10/22/2021 1) Regional bank defined as having less than $50 billion in assets; rank determined by asset size |
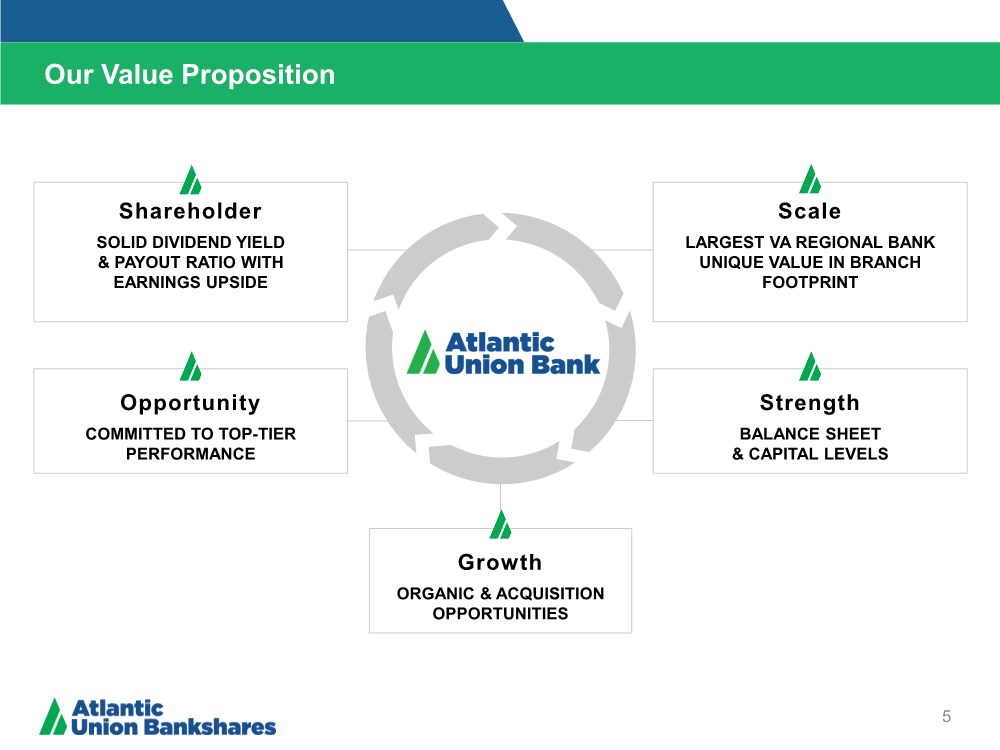
| Shareholder SOLID DIVIDEND YIELD & PAYOUT RATIO WITH EARNINGS UPSIDE Scale LARGEST VA REGIONAL BANK UNIQUE VALUE IN BRANCH FOOTPRINT Strength BALANCE SHEET & CAPITAL LEVELS Opportunity COMMITTED TO TOP-TIER PERFORMANCE Our Value Proposition 5 Growth ORGANIC & ACQUISITION OPPORTUNITIES |
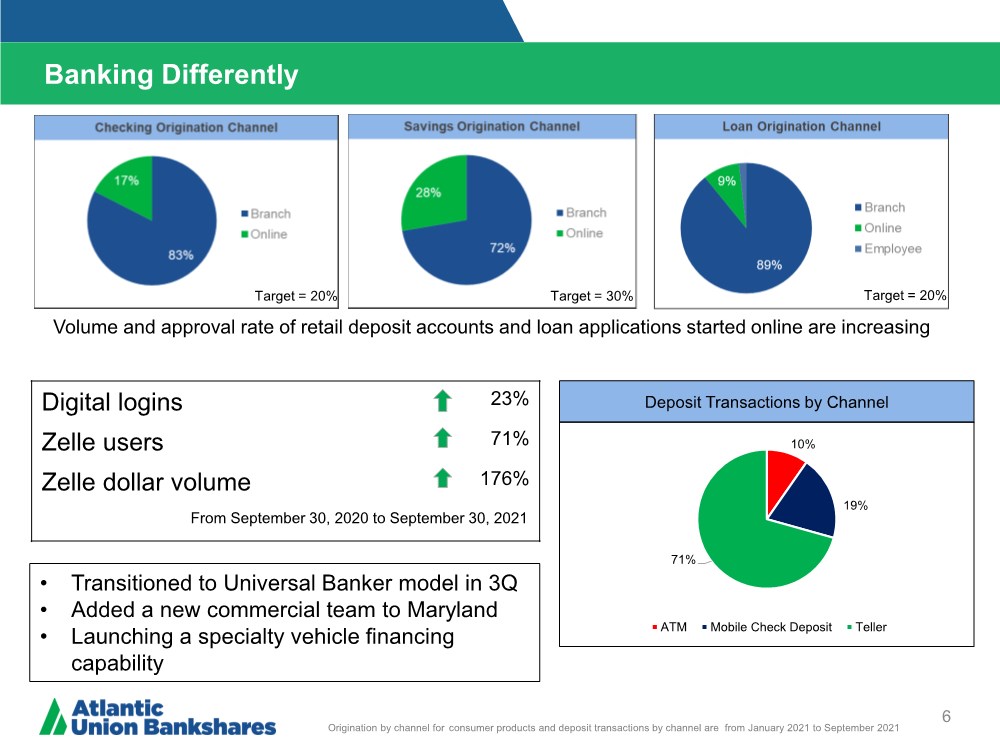
| Banking Differently 6 Volume and approval rate of retail deposit accounts and loan applications started online are increasing Origination by channel for consumer products and deposit transactions by channel are from January 2021 to September 2021 Digital logins 23% Zelle users 71% Zelle dollar volume 176% From September 30, 2020 to September 30, 2021 Deposit Transactions by Channel 10% 19% 71% ATM Mobile Check Deposit Teller • Transitioned to Universal Banker model in 3Q • Added a new commercial team to Maryland • Launching a specialty vehicle financing capability Target = 20% Target = 30% Target = 20% |
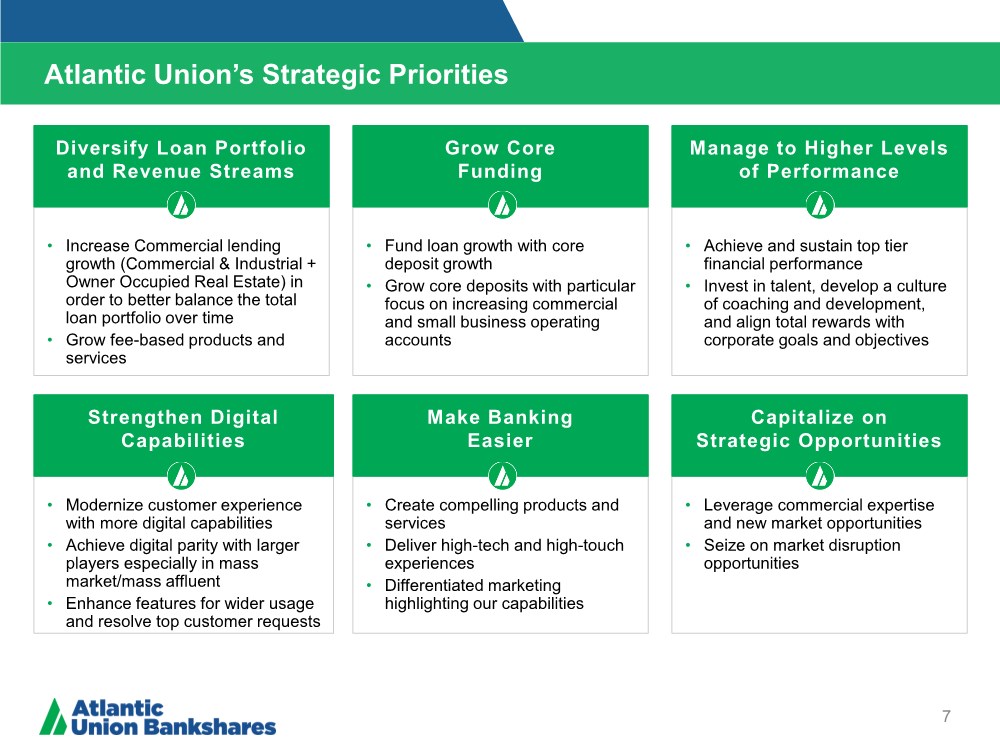
| Atlantic Union’s Strategic Priorities 7 • Increase Commercial lending growth (Commercial & Industrial + Owner Occupied Real Estate) in order to better balance the total loan portfolio over time • Grow fee-based products and services Diversify Loan Portfolio and Revenue Streams • Fund loan growth with core deposit growth • Grow core deposits with particular focus on increasing commercial and small business operating accounts Grow Core Funding • Achieve and sustain top tier financial performance • Invest in talent, develop a culture of coaching and development, and align total rewards with corporate goals and objectives Manage to Higher Levels of Performance • Modernize customer experience with more digital capabilities • Achieve digital parity with larger players especially in mass market/mass affluent • Enhance features for wider usage and resolve top customer requests • Create compelling products and services • Deliver high-tech and high-touch experiences • Differentiated marketing highlighting our capabilities • Leverage commercial expertise and new market opportunities • Seize on market disruption opportunities Strengthen Digital Capabilities Make Banking Easier Capitalize on Strategic Opportunities |
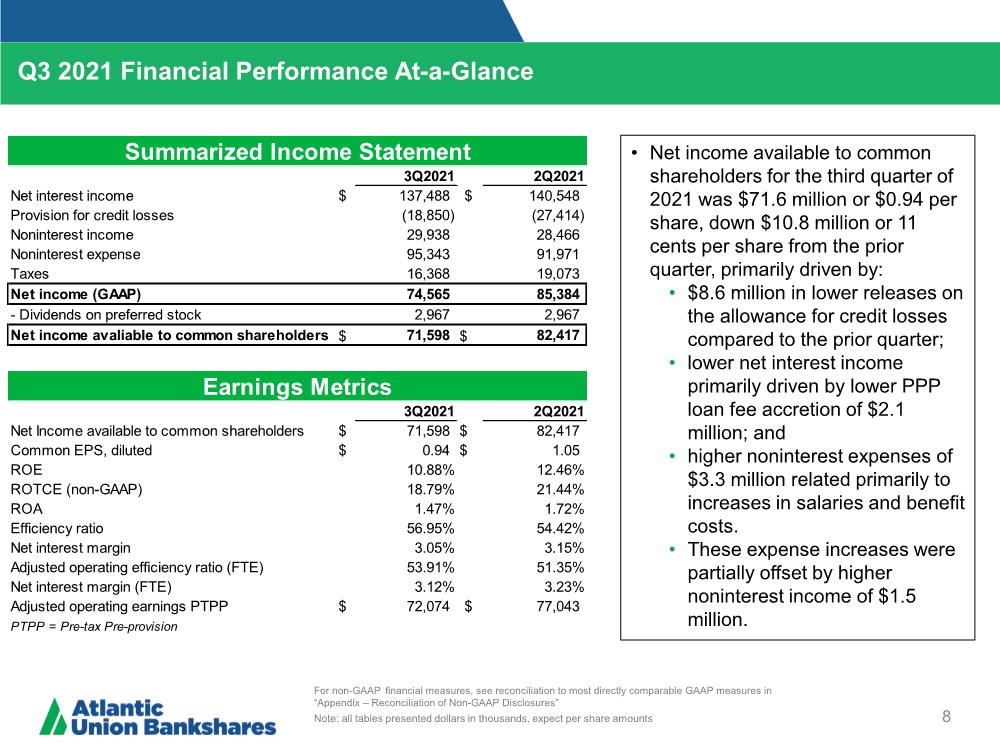
| Q3 2021 Financial Performance At-a-Glance 8 For non-GAAP financial measures, see reconciliation to most directly comparable GAAP measures in “Appendix – Reconciliation of Non-GAAP Disclosures” Note: all tables presented dollars in thousands, expect per share amounts • Net income available to common shareholders for the third quarter of 2021 was $71.6 million or $0.94 per share, down $10.8 million or 11 cents per share from the prior quarter, primarily driven by: • $8.6 million in lower releases on the allowance for credit losses compared to the prior quarter; • lower net interest income primarily driven by lower PPP loan fee accretion of $2.1 million; and • higher noninterest expenses of $3.3 million related primarily to increases in salaries and benefit costs. • These expense increases were partially offset by higher noninterest income of $1.5 million. 3Q2021 2Q2021 Net interest income $ 137,488 $ 140,548 Provision for credit losses (18,850) (27,414) Noninterest income 29,938 28,466 Noninterest expense 95,343 91,971 Taxes 16,368 19,073 Net income (GAAP) 74,565 85,384 - Dividends on preferred stock 2,967 2,967 Net income avaliable to common shareholders $ 71,598 $ 82,417 Summarized Income Statement 3Q2021 2Q2021 Net Income available to common shareholders $ 71,598 $ 82,417 Common EPS, diluted $ 0.94 $ 1.05 ROE 10.88% 12.46% ROTCE (non-GAAP) 18.79% 21.44% ROA 1.47% 1.72% Efficiency ratio 56.95% 54.42% Net interest margin 3.05% 3.15% Adjusted operating efficiency ratio (FTE) 53.91% 51.35% Net interest margin (FTE) 3.12% 3.23% Adjusted operating earnings PTPP $ 72,074 $ 77,043 PTPP = Pre-tax Pre-provision Earnings Metrics |
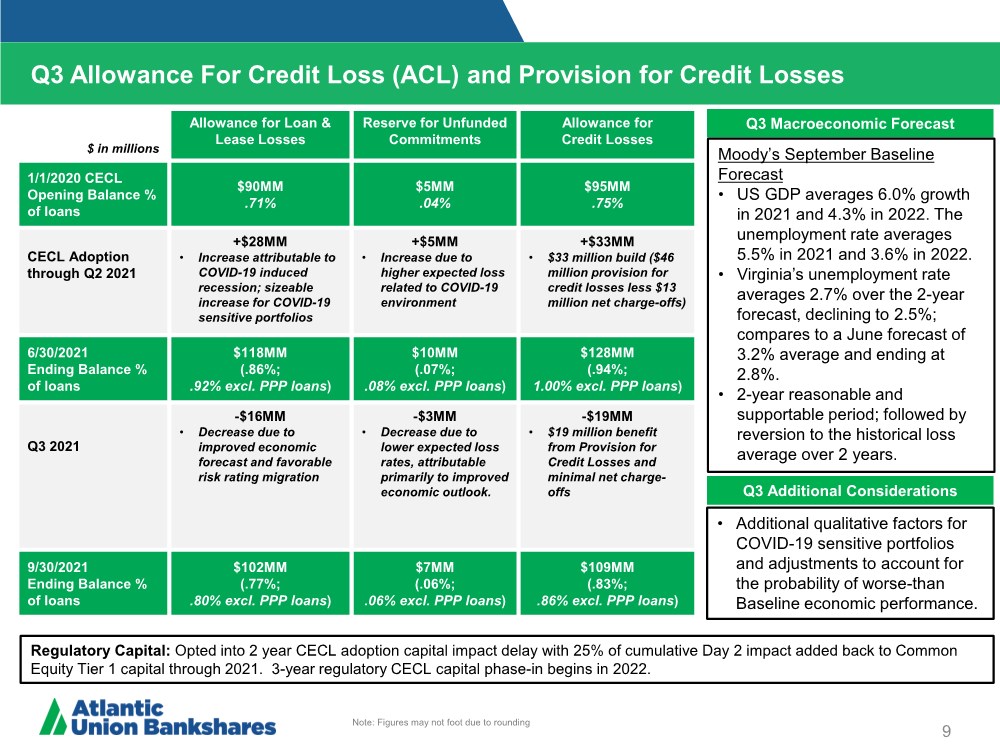
| Q3 Allowance For Credit Loss (ACL) and Provision for Credit Losses 9 Q3 Macroeconomic Forecast Q3 Additional Considerations Moody’s September Baseline Forecast • US GDP averages 6.0% growth in 2021 and 4.3% in 2022. The unemployment rate averages 5.5% in 2021 and 3.6% in 2022. • Virginia’s unemployment rate averages 2.7% over the 2-year forecast, declining to 2.5%; compares to a June forecast of 3.2% average and ending at 2.8%. • 2-year reasonable and supportable period; followed by reversion to the historical loss average over 2 years. • Additional qualitative factors for COVID-19 sensitive portfolios and adjustments to account for the probability of worse-than Baseline economic performance. Regulatory Capital: Opted into 2 year CECL adoption capital impact delay with 25% of cumulative Day 2 impact added back to Common Equity Tier 1 capital through 2021. 3-year regulatory CECL capital phase-in begins in 2022. $ in millions Allowance for Loan & Lease Losses Reserve for Unfunded Commitments Allowance for Credit Losses 1/1/2020 CECL Opening Balance % of loans $90MM ..71% $5MM ..04% $95MM ..75% CECL Adoption through Q2 2021 +$28MM • Increase attributable to COVID-19 induced recession; sizeable increase for COVID-19 sensitive portfolios +$5MM • Increase due to higher expected loss related to COVID-19 environment +$33MM • $33 million build ($46 million provision for credit losses less $13 million net charge-offs) 6/30/2021 Ending Balance % of loans $118MM (.86%; ..92% excl. PPP loans) $10MM (.07%; ..08% excl. PPP loans) $128MM (.94%; 1.00% excl. PPP loans) Q3 2021 -$16MM • Decrease due to improved economic forecast and favorable risk rating migration -$3MM • Decrease due to lower expected loss rates, attributable primarily to improved economic outlook. -$19MM • $19 million benefit from Provision for Credit Losses and minimal net charge- offs 9/30/2021 Ending Balance % of loans $102MM (.77%; ..80% excl. PPP loans) $7MM (.06%; ..06% excl. PPP loans) $109MM (.83%; ..86% excl. PPP loans) Note: Figures may not foot due to rounding |
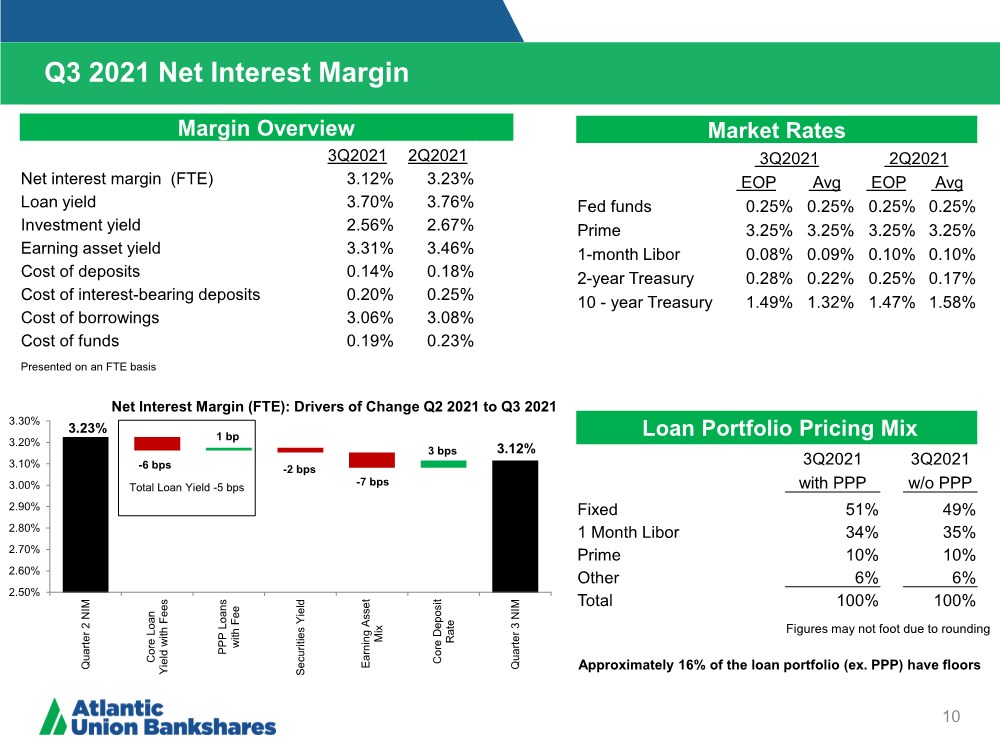
| 10 Q3 2021 Net Interest Margin Market Rates 3Q2021 2Q2021 EOP Avg EOP Avg Fed funds 0.25% 0.25% 0.25% 0.25% Prime 3.25% 3.25% 3.25% 3.25% 1-month Libor 0.08% 0.09% 0.10% 0.10% 2-year Treasury 0.28% 0.22% 0.25% 0.17% 10 - year Treasury 1.49% 1.32% 1.47% 1.58% Margin Overview 3Q2021 2Q2021 Net interest margin (FTE) 3.12% 3.23% Loan yield 3.70% 3.76% Investment yield 2.56% 2.67% Earning asset yield 3.31% 3.46% Cost of deposits 0.14% 0.18% Cost of interest-bearing deposits 0.20% 0.25% Cost of borrowings 3.06% 3.08% Cost of funds 0.19% 0.23% Presented on an FTE basis Approximately 16% of the loan portfolio (ex. PPP) have floors Loan Portfolio Pricing Mix 3Q2021 3Q2021 with PPP w/o PPP Fixed 51% 49% 1 Month Libor 34% 35% Prime 10% 10% Other 6% 6% Total 100% 100% Figures may not foot due to rounding Total Loan Yield -5 bps 3.23% 3.12% 2.50% 2.60% 2.70% 2.80% 2.90% 3.00% 3.10% 3.20% 3.30% Quarter 2 NIM Core Loan Yield with Fees PPP Loans with Fee Securities Yield Earning Asset Mix Core Deposit Rate Quarter 3 NIM Net Interest Margin (FTE): Drivers of Change Q2 2021 to Q3 2021 -6 bps 1 bp -2 bps -7 bps 3 bps |
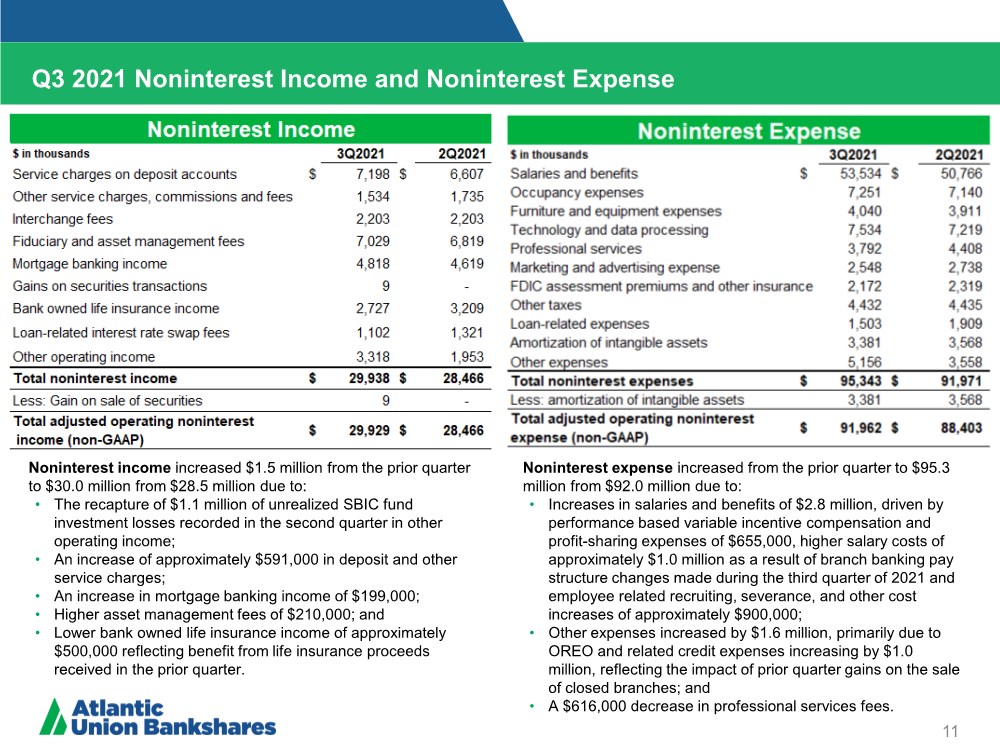
| 11 Noninterest income increased $1.5 million from the prior quarter to $30.0 million from $28.5 million due to: • The recapture of $1.1 million of unrealized SBIC fund investment losses recorded in the second quarter in other operating income; • An increase of approximately $591,000 in deposit and other service charges; • An increase in mortgage banking income of $199,000; • Higher asset management fees of $210,000; and • Lower bank owned life insurance income of approximately $500,000 reflecting benefit from life insurance proceeds received in the prior quarter. Q3 2021 Noninterest Income and Noninterest Expense Noninterest expense increased from the prior quarter to $95.3 million from $92.0 million due to: • Increases in salaries and benefits of $2.8 million, driven by performance based variable incentive compensation and profit-sharing expenses of $655,000, higher salary costs of approximately $1.0 million as a result of branch banking pay structure changes made during the third quarter of 2021 and employee related recruiting, severance, and other cost increases of approximately $900,000; • Other expenses increased by $1.6 million, primarily due to OREO and related credit expenses increasing by $1.0 million, reflecting the impact of prior quarter gains on the sale of closed branches; and • A $616,000 decrease in professional services fees. |
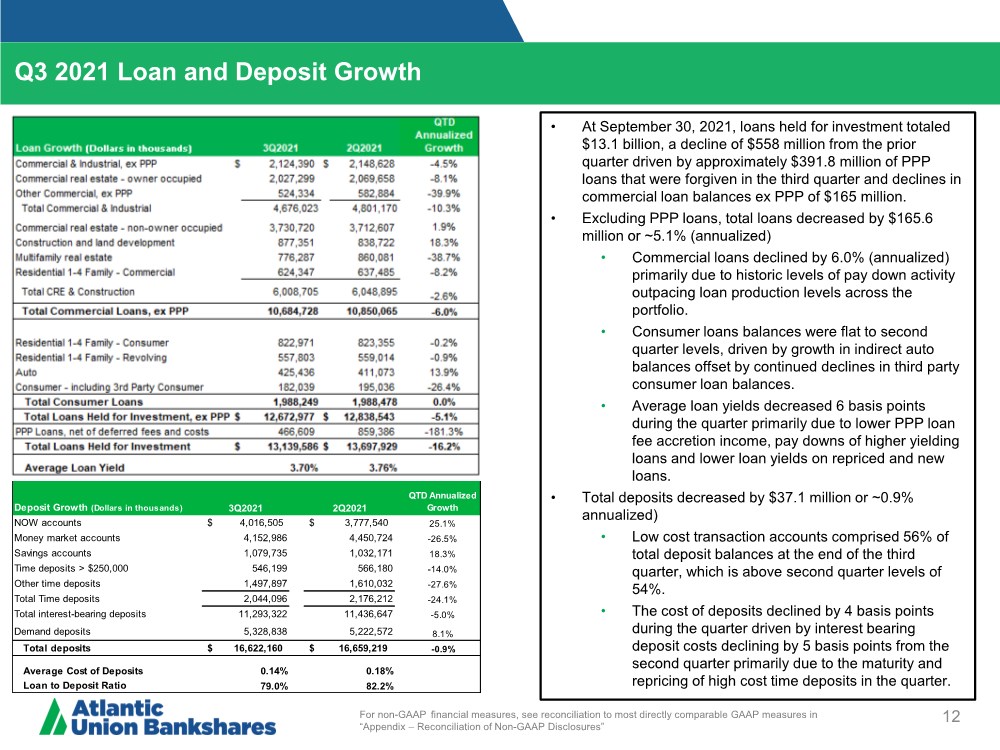
| 12 Q3 2021 Loan and Deposit Growth For non-GAAP financial measures, see reconciliation to most directly comparable GAAP measures in “Appendix – Reconciliation of Non-GAAP Disclosures” • At September 30, 2021, loans held for investment totaled $13.1 billion, a decline of $558 million from the prior quarter driven by approximately $391.8 million of PPP loans that were forgiven in the third quarter and declines in commercial loan balances ex PPP of $165 million. • Excluding PPP loans, total loans decreased by $165.6 million or ~5.1% (annualized) • Commercial loans declined by 6.0% (annualized) primarily due to historic levels of pay down activity outpacing loan production levels across the portfolio. • Consumer loans balances were flat to second quarter levels, driven by growth in indirect auto balances offset by continued declines in third party consumer loan balances. • Average loan yields decreased 6 basis points during the quarter primarily due to lower PPP loan fee accretion income, pay downs of higher yielding loans and lower loan yields on repriced and new loans. • Total deposits decreased by $37.1 million or ~0.9% annualized) • Low cost transaction accounts comprised 56% of total deposit balances at the end of the third quarter, which is above second quarter levels of 54%. • The cost of deposits declined by 4 basis points during the quarter driven by interest bearing deposit costs declining by 5 basis points from the second quarter primarily due to the maturity and repricing of high cost time deposits in the quarter. Deposit Growth (Dollars in thousands) 3Q2021 2Q2021 QTD Annualized Growth NOW accounts $ 4,016,505 $ 3,777,540 25.1% Money market accounts 4,152,986 4,450,724 -26.5% Savings accounts 1,079,735 1,032,171 18.3% Time deposits > $250,000 546,199 566,180 -14.0% Other time deposits 1,497,897 1,610,032 -27.6% Total Time deposits 2,044,096 2,176,212 -24.1% Total interest-bearing deposits 11,293,322 11,436,647 -5.0% Demand deposits 5,328,838 5,222,572 8.1% Total deposits $ 16,622,160 $ 16,659,219 -0.9% Average Cost of Deposits 0.14% 0.18% Loan to Deposit Ratio 79.0% 82.2% |
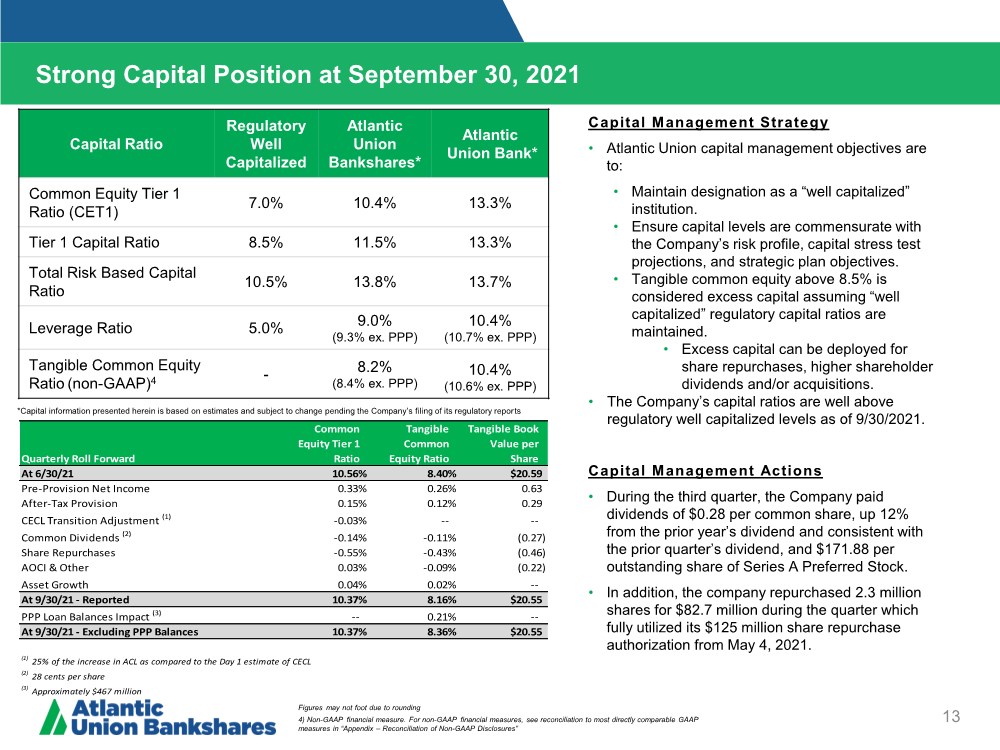
| Strong Capital Position at September 30, 2021 13 Capital Ratio Regulatory Well Capitalized Atlantic Union Bankshares* Atlantic Union Bank* Common Equity Tier 1 Ratio (CET1) 7.0% 10.4% 13.3% Tier 1 Capital Ratio 8.5% 11.5% 13.3% Total Risk Based Capital Ratio 10.5% 13.8% 13.7% Leverage Ratio 5.0% 9.0% (9.3% ex. PPP) 10.4% (10.7% ex. PPP) Tangible Common Equity Ratio (non-GAAP)4 - 8.2% (8.4% ex. PPP) 10.4% (10.6% ex. PPP) *Capital information presented herein is based on estimates and subject to change pending the Company’s filing of its regulatory reports Capital Management Strategy • Atlantic Union capital management objectives are to: • Maintain designation as a “well capitalized” institution. • Ensure capital levels are commensurate with the Company’s risk profile, capital stress test projections, and strategic plan objectives. • Tangible common equity above 8.5% is considered excess capital assuming “well capitalized” regulatory capital ratios are maintained. • Excess capital can be deployed for share repurchases, higher shareholder dividends and/or acquisitions. • The Company’s capital ratios are well above regulatory well capitalized levels as of 9/30/2021. Capital Management Actions • During the third quarter, the Company paid dividends of $0.28 per common share, up 12% from the prior year’s dividend and consistent with the prior quarter’s dividend, and $171.88 per outstanding share of Series A Preferred Stock. • In addition, the company repurchased 2.3 million shares for $82.7 million during the quarter which fully utilized its $125 million share repurchase authorization from May 4, 2021. Figures may not foot due to rounding 4) Non-GAAP financial measure. For non-GAAP financial measures, see reconciliation to most directly comparable GAAP measures in “Appendix – Reconciliation of Non-GAAP Disclosures” Quarterly Roll Forward Common Equity Tier 1 Ratio Tangible Common Equity Ratio Tangible Book Value per Share At 6/30/21 10.56% 8.40% $20.59 Pre-Provision Net Income 0.33% 0.26% 0.63 After-Tax Provision 0.15% 0.12% 0.29 CECL Transition Adjustment (1) -0.03% -- -- Common Dividends (2) -0.14% -0.11% (0.27) Share Repurchases -0.55% -0.43% (0.46) AOCI & Other 0.03% -0.09% (0.22) Asset Growth 0.04% 0.02% -- At 9/30/21 - Reported 10.37% 8.16% $20.55 PPP Loan Balances Impact (3) -- 0.21% -- At 9/30/21 - Excluding PPP Balances 10.37% 8.36% $20.55 (1) 25% of the increase in ACL as compared to the Day 1 estimate of CECL (2) 28 cents per share (3) Approximately $467 million |
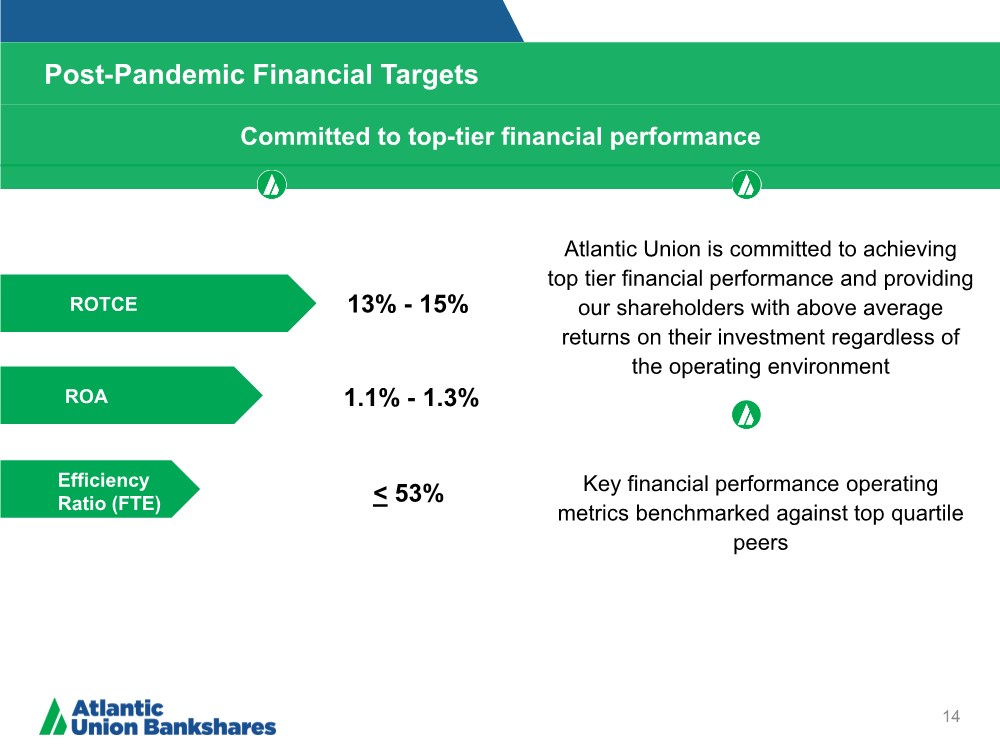
| Post-Pandemic Financial Targets 14 ROTCE ROA Efficiency Ratio (FTE) 1.1% - 1.3% 13% - 15% < 53% Atlantic Union is committed to achieving top tier financial performance and providing our shareholders with above average returns on their investment regardless of the operating environment Key financial performance operating metrics benchmarked against top quartile peers Committed to top-tier financial performance |
| Appendix |
| Reconciliation of Non-GAAP Disclosures 16 Operating Earnings Per Share The Company has provided supplemental performance measures on a tax-equivalent, tangible, operating, adjusted, or pre-tax pre-provision basis. These non-GAAP financial measures are supplements to GAAP, which is used to prepare the Company’s financial statements, and should not be considered in isolation or as a substitute for comparable measures calculated in accordance with GAAP. In addition, the Company’s non-GAAP financial measures may not be comparable to non-GAAP financial measures of other companies. The Company uses the non-GAAP financial measures discussed herein in its analysis of the Company’s performance. The Company’s management believes that these non-GAAP financial measures provide additional understanding of ongoing operations, enhance comparability of results of operations with prior periods and show the effects of significant gains and charges in the periods presented without the impact of items or events that may obscure trends in the Company’s underlying performance. |
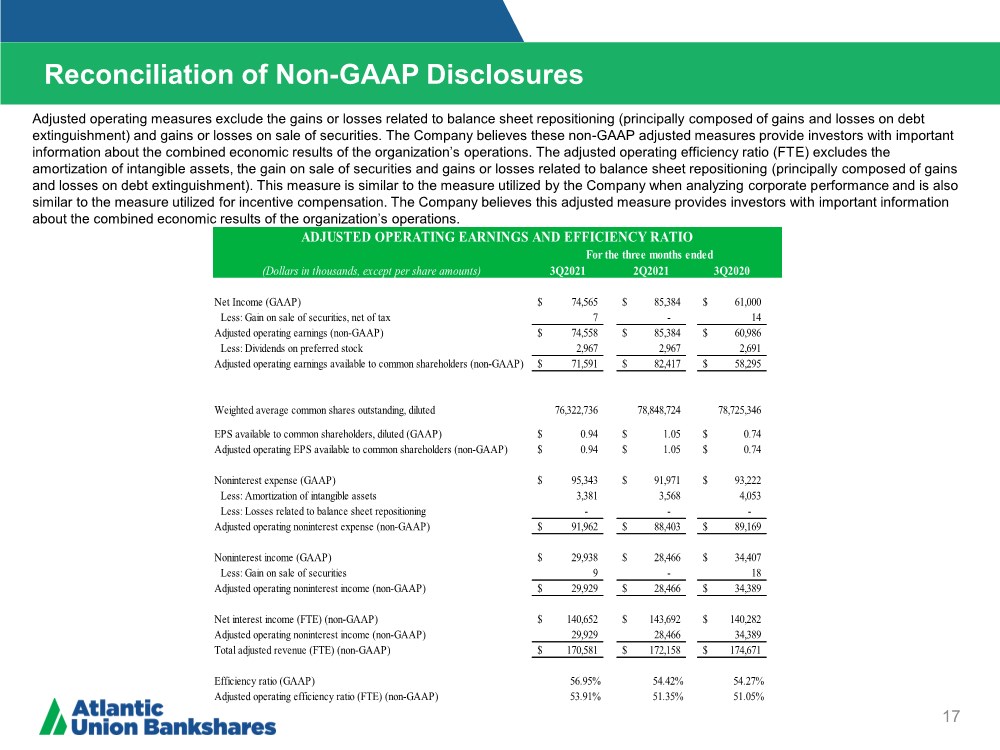
| Reconciliation of Non-GAAP Disclosures 17 Operating Earnings Per Share Adjusted operating measures exclude the gains or losses related to balance sheet repositioning (principally composed of gains and losses on debt extinguishment) and gains or losses on sale of securities. The Company believes these non-GAAP adjusted measures provide investors with important information about the combined economic results of the organization’s operations. The adjusted operating efficiency ratio (FTE) excludes the amortization of intangible assets, the gain on sale of securities and gains or losses related to balance sheet repositioning (principally composed of gains and losses on debt extinguishment). This measure is similar to the measure utilized by the Company when analyzing corporate performance and is also similar to the measure utilized for incentive compensation. The Company believes this adjusted measure provides investors with important information about the combined economic results of the organization’s operations. (Dollars in thousands, except per share amounts) 3Q2021 2Q2021 3Q2020 Net Income (GAAP) 74,565 $ 85,384 $ 61,000 $ Less: Gain on sale of securities, net of tax 7 - 14 Adjusted operating earnings (non-GAAP) 74,558 $ 85,384 $ 60,986 $ Less: Dividends on preferred stock 2,967 2,967 2,691 Adjusted operating earnings available to common shareholders (non-GAAP) 71,591 $ 82,417 $ 58,295 $ Weighted average common shares outstanding, diluted 76,322,736 78,848,724 78,725,346 EPS available to common shareholders, diluted (GAAP) 0.94 $ 1.05 $ 0.74 $ Adjusted operating EPS available to common shareholders (non-GAAP) 0.94 $ 1.05 $ 0.74 $ Noninterest expense (GAAP) 95,343 $ 91,971 $ 93,222 $ Less: Amortization of intangible assets 3,381 3,568 4,053 Less: Losses related to balance sheet repositioning - - - Adjusted operating noninterest expense (non-GAAP) 91,962 $ 88,403 $ 89,169 $ Noninterest income (GAAP) 29,938 $ 28,466 $ 34,407 $ Less: Gain on sale of securities 9 - 18 Adjusted operating noninterest income (non-GAAP) 29,929 $ 28,466 $ 34,389 $ Net interest income (FTE) (non-GAAP) 140,652 $ 143,692 $ 140,282 $ Adjusted operating noninterest income (non-GAAP) 29,929 28,466 34,389 Total adjusted revenue (FTE) (non-GAAP) 170,581 $ 172,158 $ 174,671 $ Efficiency ratio (GAAP) 56.95% 54.42% 54.27% Adjusted operating efficiency ratio (FTE) (non-GAAP) 53.91% 51.35% 51.05% ADJUSTED OPERATING EARNINGS AND EFFICIENCY RATIO For the three months ended |
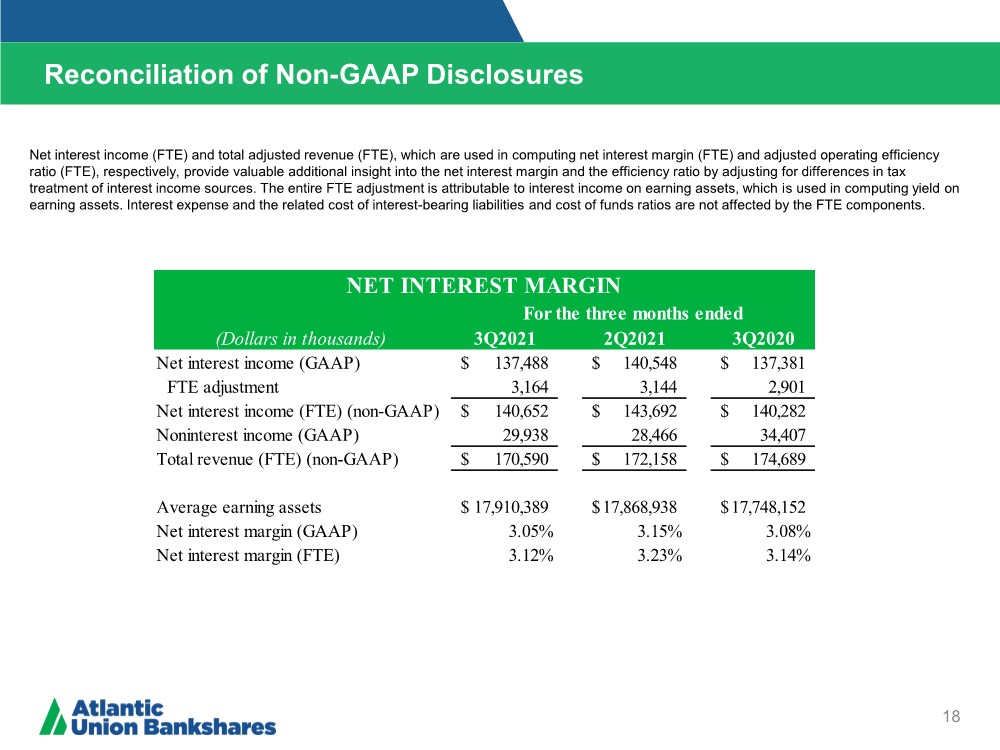
| Reconciliation of Non-GAAP Disclosures 18 Operating Earnings Per Share Net interest income (FTE) and total adjusted revenue (FTE), which are used in computing net interest margin (FTE) and adjusted operating efficiency ratio (FTE), respectively, provide valuable additional insight into the net interest margin and the efficiency ratio by adjusting for differences in tax treatment of interest income sources. The entire FTE adjustment is attributable to interest income on earning assets, which is used in computing yield on earning assets. Interest expense and the related cost of interest-bearing liabilities and cost of funds ratios are not affected by the FTE components. (Dollars in thousands) 3Q2021 2Q2021 3Q2020 Net interest income (GAAP) 137,488 $ 140,548 $ 137,381 $ FTE adjustment 3,164 3,144 2,901 Net interest income (FTE) (non-GAAP) 140,652 $ 143,692 $ 140,282 $ Noninterest income (GAAP) 29,938 28,466 34,407 Total revenue (FTE) (non-GAAP) 170,590 $ 172,158 $ 174,689 $ Average earning assets 17,910,389 $ 17,868,938 $ 17,748,152 $ Net interest margin (GAAP) 3.05% 3.15% 3.08% Net interest margin (FTE) 3.12% 3.23% 3.14% NET INTEREST MARGIN For the three months ended |
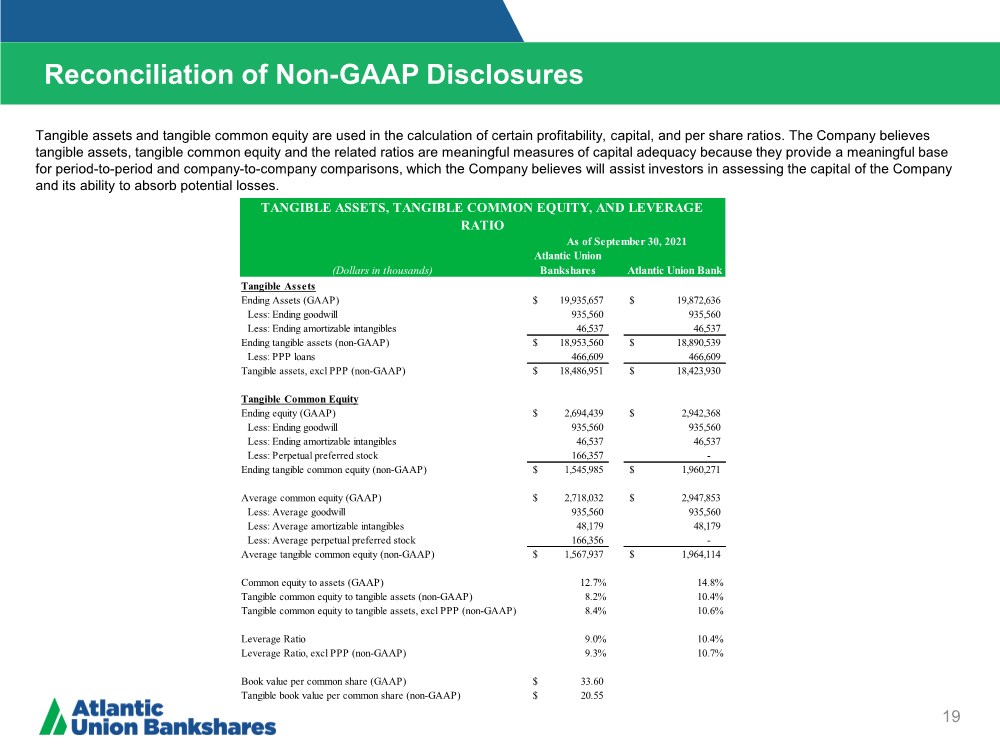
| Reconciliation of Non-GAAP Disclosures 19 Tangible assets and tangible common equity are used in the calculation of certain profitability, capital, and per share ratios. The Company believes tangible assets, tangible common equity and the related ratios are meaningful measures of capital adequacy because they provide a meaningful base for period-to-period and company-to-company comparisons, which the Company believes will assist investors in assessing the capital of the Company and its ability to absorb potential losses. (Dollars in thousands) Atlantic Union Bankshares Atlantic Union Bank Tangible Assets Ending Assets (GAAP) 19,935,657 $ 19,872,636 $ Less: Ending goodwill 935,560 935,560 Less: Ending amortizable intangibles 46,537 46,537 Ending tangible assets (non-GAAP) 18,953,560 $ 18,890,539 $ Less: PPP loans 466,609 466,609 Tangible assets, excl PPP (non-GAAP) 18,486,951 $ 18,423,930 $ Tangible Common Equity Ending equity (GAAP) 2,694,439 $ 2,942,368 $ Less: Ending goodwill 935,560 935,560 Less: Ending amortizable intangibles 46,537 46,537 Less: Perpetual preferred stock 166,357 - Ending tangible common equity (non-GAAP) 1,545,985 $ 1,960,271 $ Average common equity (GAAP) 2,718,032 $ 2,947,853 $ Less: Average goodwill 935,560 935,560 Less: Average amortizable intangibles 48,179 48,179 Less: Average perpetual preferred stock 166,356 - Average tangible common equity (non-GAAP) 1,567,937 $ 1,964,114 $ Less: Perpetual preferred stock Common equity to assets (GAAP) 12.7% 14.8% Tangible common equity to tangible assets (non-GAAP) 8.2% 10.4% Tangible common equity to tangible assets, excl PPP (non-GAAP) 8.4% 10.6% Leverage Ratio 9.0% 10.4% Leverage Ratio, excl PPP (non-GAAP) 9.3% 10.7% Book value per common share (GAAP) 33.60 $ Tangible book value per common share (non-GAAP) 20.55 $ TANGIBLE ASSETS, TANGIBLE COMMON EQUITY, AND LEVERAGE RATIO As of September 30, 2021 |
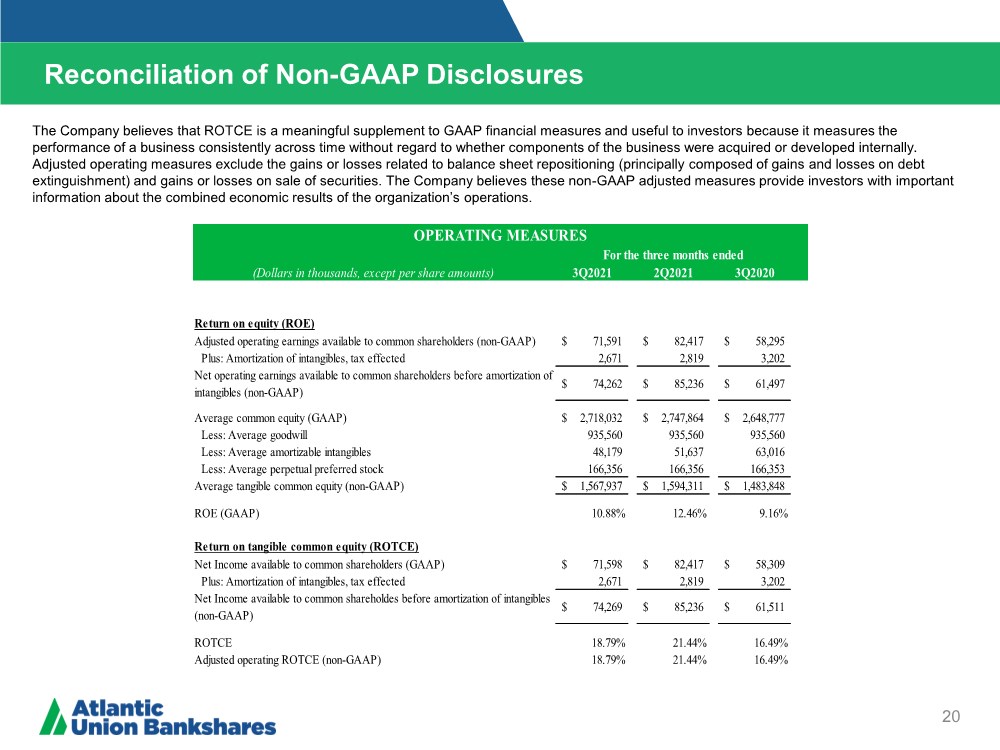
| Reconciliation of Non-GAAP Disclosures 20 Operating Earnings Per Share The Company believes that ROTCE is a meaningful supplement to GAAP financial measures and useful to investors because it measures the performance of a business consistently across time without regard to whether components of the business were acquired or developed internally. Adjusted operating measures exclude the gains or losses related to balance sheet repositioning (principally composed of gains and losses on debt extinguishment) and gains or losses on sale of securities. The Company believes these non-GAAP adjusted measures provide investors with important information about the combined economic results of the organization’s operations. (Dollars in thousands, except per share amounts) 3Q2021 2Q2021 3Q2020 Return on equity (ROE) Adjusted operating earnings available to common shareholders (non-GAAP) 71,591 $ 82,417 $ 58,295 $ Plus: Amortization of intangibles, tax effected 2,671 2,819 3,202 Net operating earnings available to common shareholders before amortization of intangibles (non-GAAP) 74,262 $ 85,236 $ 61,497 $ Average common equity (GAAP) 2,718,032 $ 2,747,864 $ 2,648,777 $ Less: Average goodwill 935,560 935,560 935,560 Less: Average amortizable intangibles 48,179 51,637 63,016 Less: Average perpetual preferred stock 166,356 166,356 166,353 Average tangible common equity (non-GAAP) 1,567,937 $ 1,594,311 $ 1,483,848 $ ROE (GAAP) 10.88% 12.46% 9.16% Return on tangible common equity (ROTCE) Net Income available to common shareholders (GAAP) 71,598 $ 82,417 $ 58,309 $ Plus: Amortization of intangibles, tax effected 2,671 2,819 3,202 Net Income available to common shareholdes before amortization of intangibles (non-GAAP) 74,269 $ 85,236 $ 61,511 $ ROTCE 18.79% 21.44% 16.49% Adjusted operating ROTCE (non-GAAP) 18.79% 21.44% 16.49% OPERATING MEASURES For the three months ended |
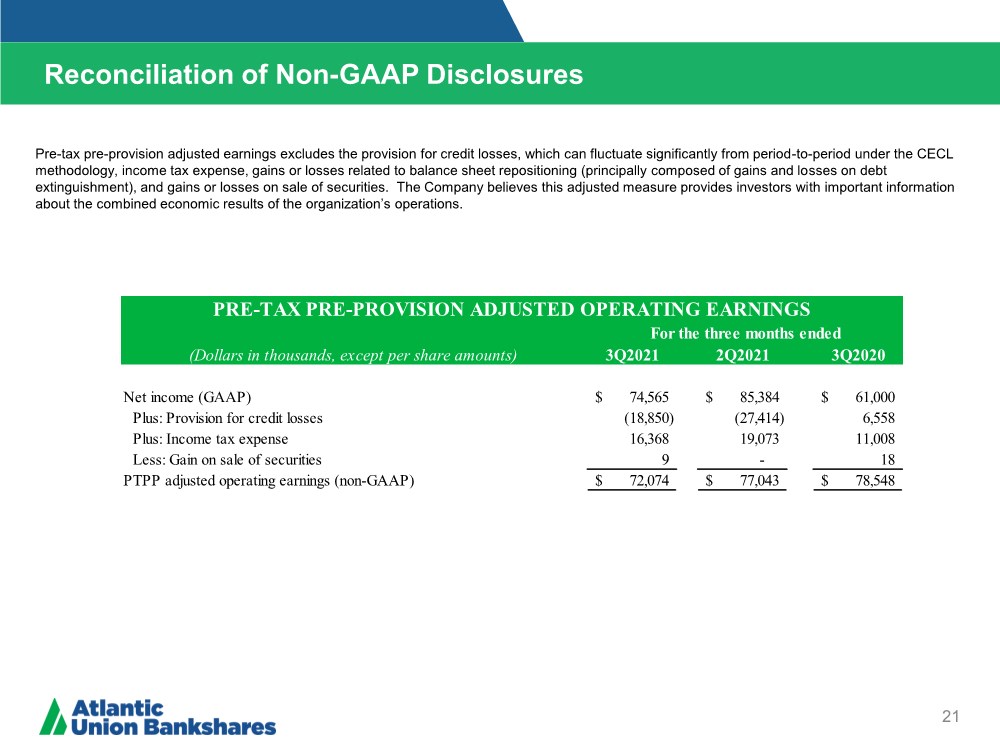
| Reconciliation of Non-GAAP Disclosures 21 Operating Earnings Per Share Pre-tax pre-provision adjusted earnings excludes the provision for credit losses, which can fluctuate significantly from period-to-period under the CECL methodology, income tax expense, gains or losses related to balance sheet repositioning (principally composed of gains and losses on debt extinguishment), and gains or losses on sale of securities. The Company believes this adjusted measure provides investors with important information about the combined economic results of the organization’s operations. (Dollars in thousands, except per share amounts) 3Q2021 2Q2021 3Q2020 Net income (GAAP) 74,565 $ 85,384 $ 61,000 $ Plus: Provision for credit losses (18,850) (27,414) 6,558 Plus: Income tax expense 16,368 19,073 11,008 Less: Gain on sale of securities 9 - 18 PTPP adjusted operating earnings (non-GAAP) 72,074 $ 77,043 $ 78,548 $ PRE-TAX PRE-PROVISION ADJUSTED OPERATING EARNINGS For the three months ended |
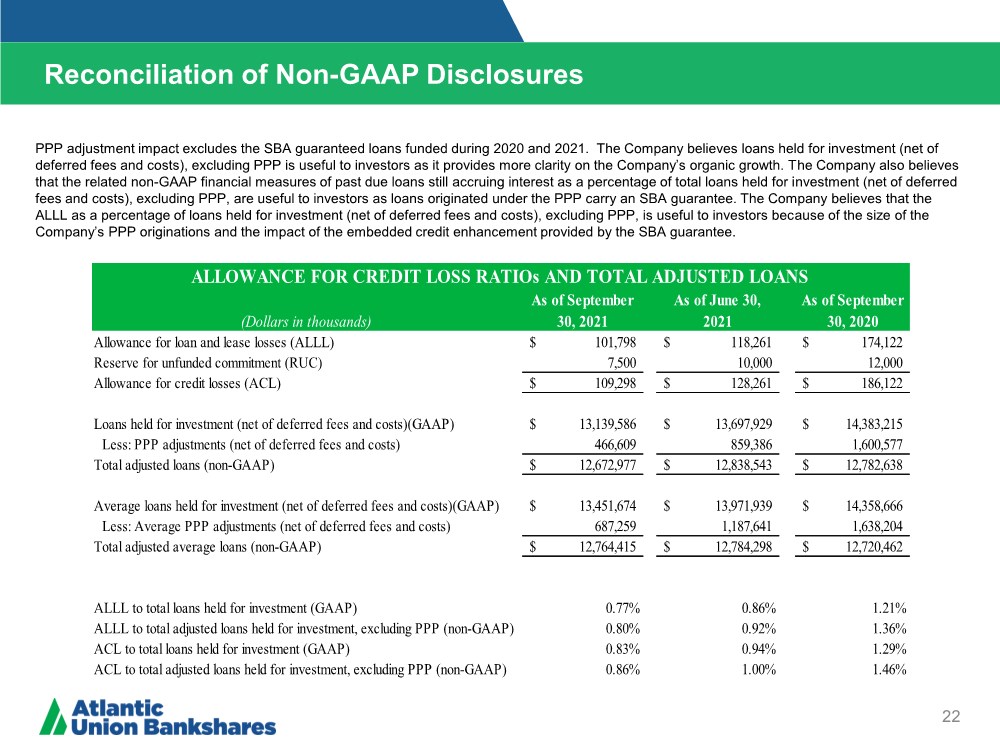
| Reconciliation of Non-GAAP Disclosures 22 ($ IN THOUSANDS) Operating Earnings Per Share PPP adjustment impact excludes the SBA guaranteed loans funded during 2020 and 2021. The Company believes loans held for investment (net of deferred fees and costs), excluding PPP is useful to investors as it provides more clarity on the Company’s organic growth. The Company also believes that the related non-GAAP financial measures of past due loans still accruing interest as a percentage of total loans held for investment (net of deferred fees and costs), excluding PPP, are useful to investors as loans originated under the PPP carry an SBA guarantee. The Company believes that the ALLL as a percentage of loans held for investment (net of deferred fees and costs), excluding PPP, is useful to investors because of the size of the Company’s PPP originations and the impact of the embedded credit enhancement provided by the SBA guarantee. (Dollars in thousands) As of September 30, 2021 As of June 30, 2021 As of September 30, 2020 Allowance for loan and lease losses (ALLL) 101,798 $ 118,261 $ 174,122 $ Reserve for unfunded commitment (RUC) 7,500 10,000 12,000 Allowance for credit losses (ACL) 109,298 $ 128,261 $ 186,122 $ Loans held for investment (net of deferred fees and costs)(GAAP) 13,139,586 $ 13,697,929 $ 14,383,215 $ Less: PPP adjustments (net of deferred fees and costs) 466,609 859,386 1,600,577 Total adjusted loans (non-GAAP) 12,672,977 $ 12,838,543 $ 12,782,638 $ Average loans held for investment (net of deferred fees and costs)(GAAP) 13,451,674 $ 13,971,939 $ 14,358,666 $ Less: Average PPP adjustments (net of deferred fees and costs) 687,259 1,187,641 1,638,204 Total adjusted average loans (non-GAAP) 12,764,415 $ 12,784,298 $ 12,720,462 $ ALLL to total loans held for investment (GAAP) 0.77% 0.86% 1.21% ALLL to total adjusted loans held for investment, excluding PPP (non-GAAP) 0.80% 0.92% 1.36% ACL to total loans held for investment (GAAP) 0.83% 0.94% 1.29% ACL to total adjusted loans held for investment, excluding PPP (non-GAAP) 0.86% 1.00% 1.46% ALLOWANCE FOR CREDIT LOSS RATIOs AND TOTAL ADJUSTED LOANS |