| Investor Presentation Nasdaq: AUB August - September 2021 |

| Forward Looking Statements 2 Certain statements in this presentation may constitute “forward-looking statements” within the meaning of the Private Securities Litigation Reform Act of 1995. Forward-looking statements are statements that include projections, predictions, expectations, or beliefs about future events or results that are not statements of historical fact. Such forward-looking statements are based on various assumptions as of the time they are made, and are inherently subject to known and unknown risks, uncertainties, and other factors, some of which cannot be predicted or quantified, that may cause actual results, performance, or achievements to be materially different from those expressed or implied by such forward-looking statements. Forward-looking statements are often accompanied by words that convey projected future events or outcomes such as “expect,” “believe,” “estimate,” “plan,” “project,” “anticipate,” “intend,” “will,” “may,” “view,” “opportunity,” “potential,” or words of similar meaning or other statements concerning opinions or judgment of Atlantic Union Bankshares Corporation (“Atlantic Union” or the “Company”) and its management about future events. Although the Company believes that its expectations with respect to forward-looking statements are based upon reasonable assumptions within the bounds of its existing knowledge of its business and operations, there can be no assurance that actual results, performance, or achievements of, or trends affecting, the Company will not differ materially from any projected future results, performance, or achievements expressed or implied by such forward-looking statements. Actual future results, performance, achievements or trends may differ materially from historical results or those anticipated depending on a variety of factors, including, but not limited to the effects of or changes in: • changes in interest rates; • general economic and financial market conditions, in the United States generally and particularly in the markets in which the Company operates and which its loans are concentrated, including the effects of declines in real estate values, an increase in unemployment levels and slowdowns in economic growth, including as a result of COVID-19; • the quality or composition of the loan or investment portfolios and changes therein; • demand for loan products and financial services in the Company’s market area; • the Company’s ability to manage its growth or implement its growth strategy; • the effectiveness of expense reduction plans; • the introduction of new lines of business or new products and services; • the Company’s ability to recruit and retain key employees; • the incremental cost and/or decreased revenues associated with exceeding $10 billion in assets; • real estate values in the Bank’s lending area; • an insufficient ACL; • changes in accounting principles; • the Company’s liquidity and capital positions; • concentrations of loans secured by real estate, particularly commercial real estate; • the effectiveness of the Company’s credit processes and management of the Company’s credit risk; • the Company’s ability to compete in the market for financial services and increased competition from fintech companies; • technological risks and developments, and cyber threats, attacks, or events; • the potential adverse effects of unusual and infrequently occurring events, such as weather- related disasters, terrorist acts or public health events (such as COVID-19), and of governmental and societal responses thereto; these potential adverse effects may include, without limitation, adverse effects on the ability of the Company's borrowers to satisfy their obligations to the Company, on the value of collateral securing loans, on the demand for the Company's loans or its other products and services, on supply chains and methods used to distribute products and services, on incidents of cyberattack and fraud, on the Company’s liquidity or capital positions, on risks posed by reliance on third-party service providers, on other aspects of the Company's business operations and on financial markets and economic growth; • the effect of steps the Company takes in response to COVID-19, the severity and duration of the pandemic, the uncertainty regarding new variants of COVID-19 that have emerged, the speed and efficacy of vaccine and treatment developments, the impact of loosening or tightening of government restrictions, the pace of recovery when the pandemic subsides and the heightened impact it has on many of the risks described herein; • the discontinuation of LIBOR and its impact on the financial markets, and the Company’s ability to manage operational, legal and compliance risks related to the discontinuation of LIBOR and implementation of one or more alternate reference rates, • performance by the Company’s counterparties or vendors; • deposit flows; • the availability of financing and the terms thereof; • the level of prepayments on loans and mortgage-backed securities; • legislative or regulatory changes and requirements, including the impact of the CARES Act, as amended by the CAA, and other legislative and regulatory reactions to COVID-19; • potential claims, damages, and fines related to litigation or government actions, including litigation or actions arising from the Company’s participation in and administration of programs related to COVID-19, including, among other things, the CARES Act, as amended by the CAA; • the effects of changes in federal, state or local tax laws and regulations; • monetary and fiscal policies of the U.S. government, including policies of the U.S. Department of the Treasury and the Federal Reserve; • changes to applicable accounting principles and guidelines; and • other factors, many of which are beyond the control of the Company. Please refer to the “Risk Factors” and “Management’s Discussion and Analysis of Financial Condition and Results of Operations” sections of the Company’s Annual Report on Form 10-K for the year ended December 31, 2020 and comparable “Risk Factors” sections of the Company’s Quarterly Reports on Form 10-Q and related disclosures in other filings, which have been filed with the SEC and are available on the SEC’s website at www.sec.gov. All of the forward-looking statements made in this presentation are expressly qualified by the cautionary statements contained or referred to herein. The actual results or developments anticipated may not be realized or, even if substantially realized, they may not have the expected consequences to or effects on the Company or its businesses or operations. Readers are cautioned not to rely too heavily on the forward-looking statements contained in this presentation. Forward-looking statements speak only as of the date they are made and the Company does not undertake any obligation to update, revise or clarify these forward-looking statements, whether as a result of new information, future events or otherwise. |
| Additional Information 3 Non-GAAP Financial Measures This presentation contains certain financial information determined by methods other than in accordance with generally accepted accounting principles in the United States (“GAAP”). These non-GAAP disclosures have limitations as analytical tools and should not be considered in isolation or as a substitute for analysis of our results as reported under GAAP, nor are they necessarily comparable to non-GAAP performance measures that may be presented by other companies. The Company uses the non-GAAP financial measures discussed herein in its analysis of the Company’s performance. The Company’s management believes that these non-GAAP financial measures provide additional understanding of ongoing operations, enhance comparability of results of operations with prior periods and show the effects of significant gains and charges in the periods presented without the impact of items or events that may obscure trends in the Company’s underlying performance. Please see “Reconciliation of Non-GAAP Disclosures” at the end of this presentation for a reconciliation to the nearest GAAP financial measure. No Offer or Solicitation This presentation does not constitute an offer to sell or a solicitation of an offer to buy any securities. No offer of securities shall be made except by means of a prospectus meeting the requirements of the Securities Act of 1933, as amended, and no offer to sell or solicitation of an offer to buy shall be made in any jurisdiction in which such offer, solicitation or sale would be unlawful. About Atlantic Union Bankshares Corporation Headquartered in Richmond, Virginia, Atlantic Union Bankshares Corporation (Nasdaq: AUB) is the holding company for Atlantic Union Bank. Atlantic Union Bank has 130 branches and approximately 150 ATMs located throughout Virginia, and in portions of Maryland and North Carolina. Certain non-bank financial services affiliates of Atlantic Union Bank include: Atlantic Union Equipment Finance, Inc., which provides equipment financing; Old Dominion Capital Management, Inc., and its subsidiary, Outfitter Advisors, Ltd., and Dixon, Hubard, Feinour, & Brown, Inc., which provide investment advisory services; Atlantic Union Financial Consultants, LLC, which provides brokerage services; and Union Insurance Group, LLC, which offers various lines of insurance products. |
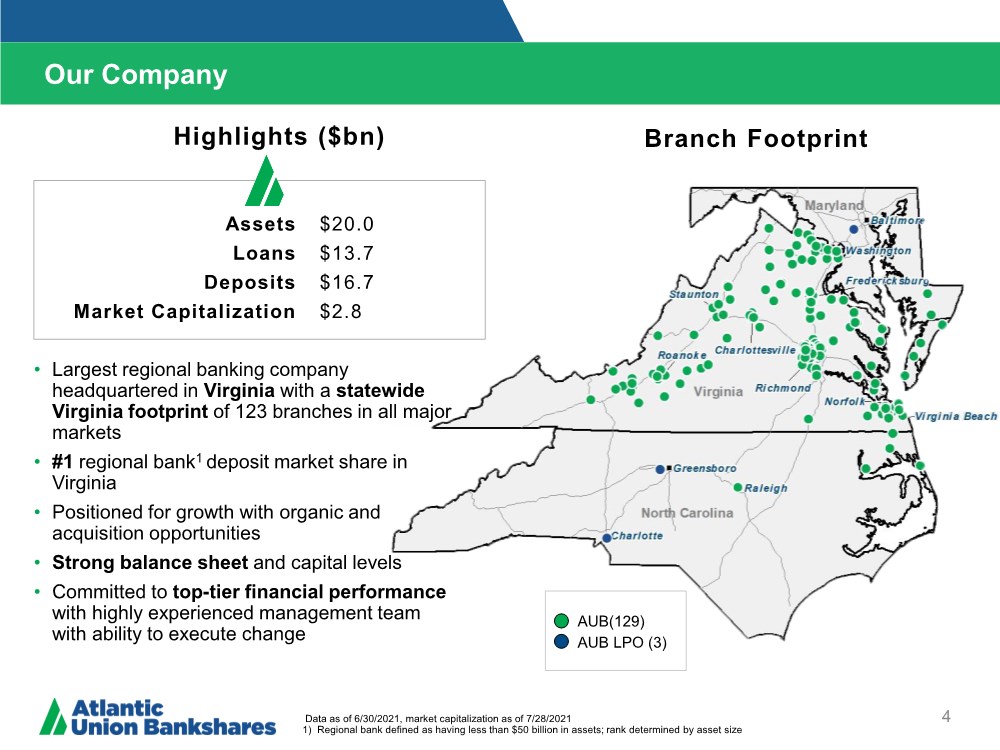
| Our Company 4 Branch Footprint Data as of 6/30/2021, market capitalization as of 7/28/2021 1) Regional bank defined as having less than $50 billion in assets; rank determined by asset size Assets Loans Deposits Market Capitalization $20.0 $13.7 $16.7 $2.8 • Largest regional banking company headquartered in Virginia with a statewide Virginia footprint of 123 branches in all major markets •#1 regional bank1 deposit market share in Virginia • Positioned for growth with organic and acquisition opportunities • Strong balance sheet and capital levels • Committed to top-tier financial performance with highly experienced management team with ability to execute change Highlights ($bn) AUB(129) AUB LPO (3) |
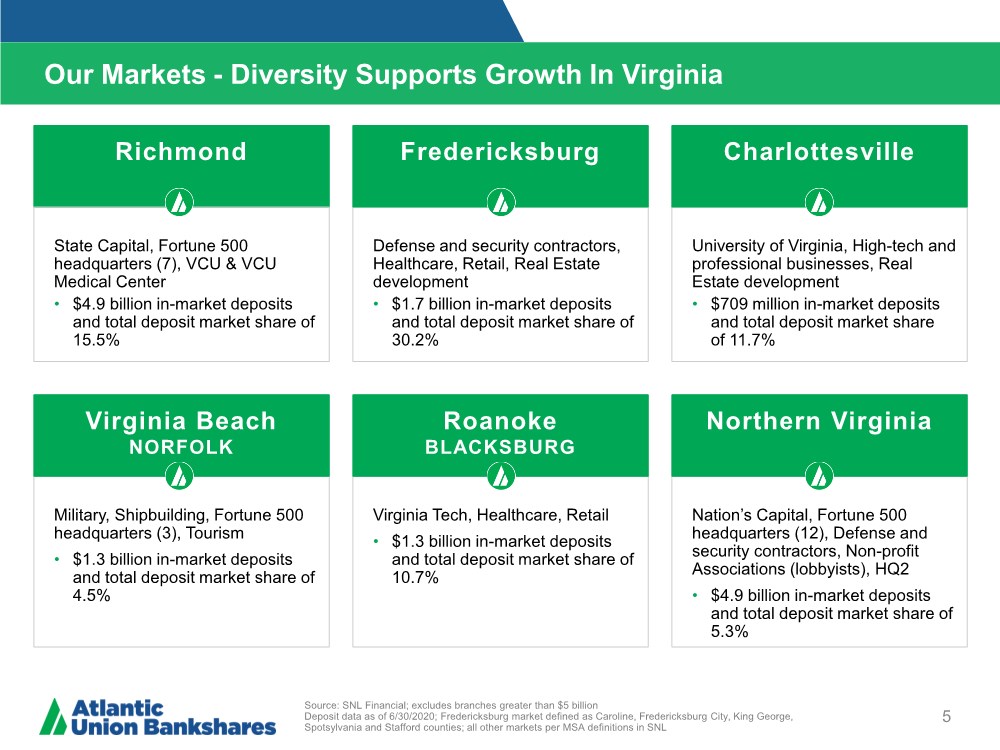
| Richmond Our Markets - Diversity Supports Growth In Virginia 5 Source: SNL Financial; excludes branches greater than $5 billion Deposit data as of 6/30/2020; Fredericksburg market defined as Caroline, Fredericksburg City, King George, Spotsylvania and Stafford counties; all other markets per MSA definitions in SNL State Capital, Fortune 500 headquarters (7), VCU & VCU Medical Center • $4.9 billion in-market deposits and total deposit market share of 15.5% Defense and security contractors, Healthcare, Retail, Real Estate development • $1.7 billion in-market deposits and total deposit market share of 30.2% Fredericksburg University of Virginia, High-tech and professional businesses, Real Estate development • $709 million in-market deposits and total deposit market share of 11.7% Charlottesville Military, Shipbuilding, Fortune 500 headquarters (3), Tourism • $1.3 billion in-market deposits and total deposit market share of 4.5% Virginia Tech, Healthcare, Retail • $1.3 billion in-market deposits and total deposit market share of 10.7% Nation’s Capital, Fortune 500 headquarters (12), Defense and security contractors, Non-profit Associations (lobbyists), HQ2 • $4.9 billion in-market deposits and total deposit market share of 5.3% Virginia Beach NORFOLK Roanoke BLACKSBURG Northern Virginia |
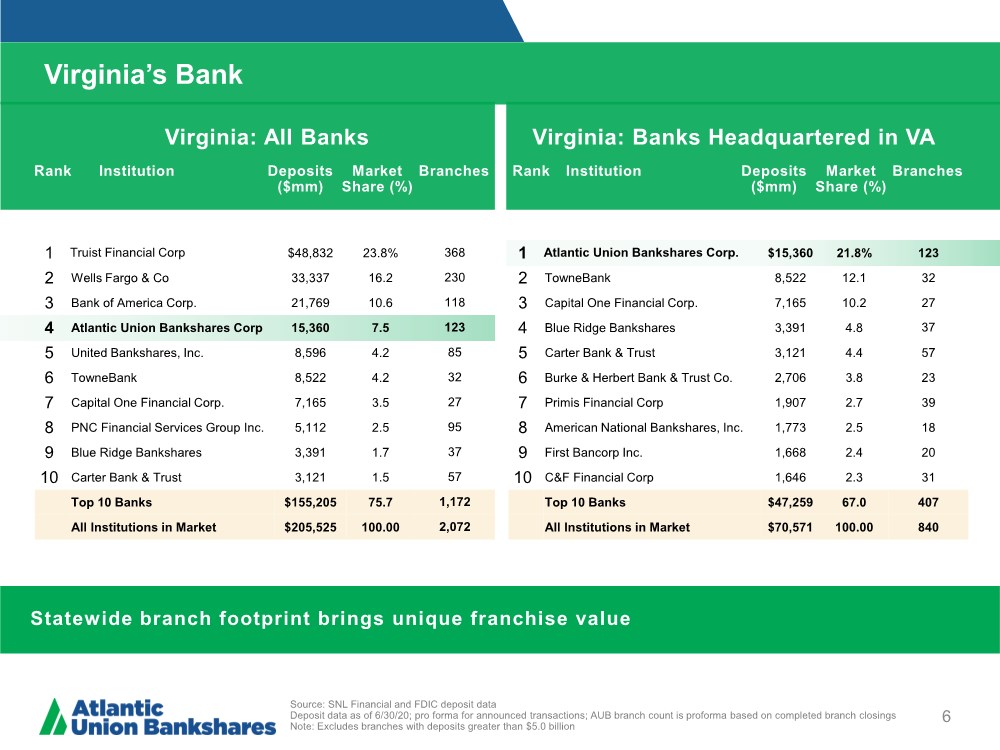
| Virginia’s Bank 6 Virginia: All Banks Virginia: Banks Headquartered in VA Rank Institution Deposits ($mm) Market Share (%) Branches 1 Truist Financial Corp $48,832 23.8% 368 2 Wells Fargo & Co 33,337 16.2 230 3 Bank of America Corp. 21,769 10.6 118 4 Atlantic Union Bankshares Corp 15,360 7.5 123 5 United Bankshares, Inc. 8,596 4.2 85 6 TowneBank 8,522 4.2 32 7 Capital One Financial Corp. 7,165 3.5 27 8 PNC Financial Services Group Inc. 5,112 2.5 95 9 Blue Ridge Bankshares 3,391 1.7 37 10 Carter Bank & Trust 3,121 1.5 57 Top 10 Banks $155,205 75.7 1,172 All Institutions in Market $205,525 100.00 2,072 Rank Institution Deposits ($mm) Market Share (%) Branches 1 Atlantic Union Bankshares Corp. $15,360 21.8% 123 2 TowneBank 8,522 12.1 32 3 Capital One Financial Corp. 7,165 10.2 27 4 Blue Ridge Bankshares 3,391 4.8 37 5 Carter Bank & Trust 3,121 4.4 57 6 Burke & Herbert Bank & Trust Co. 2,706 3.8 23 7 Primis Financial Corp 1,907 2.7 39 8 American National Bankshares, Inc. 1,773 2.5 18 9 First Bancorp Inc. 1,668 2.4 20 10 C&F Financial Corp 1,646 2.3 31 Top 10 Banks $47,259 67.0 407 All Institutions in Market $70,571 100.00 840 Source: SNL Financial and FDIC deposit data Deposit data as of 6/30/20; pro forma for announced transactions; AUB branch count is proforma based on completed branch closings Note: Excludes branches with deposits greater than $5.0 billion Statewide branch footprint brings unique franchise value |
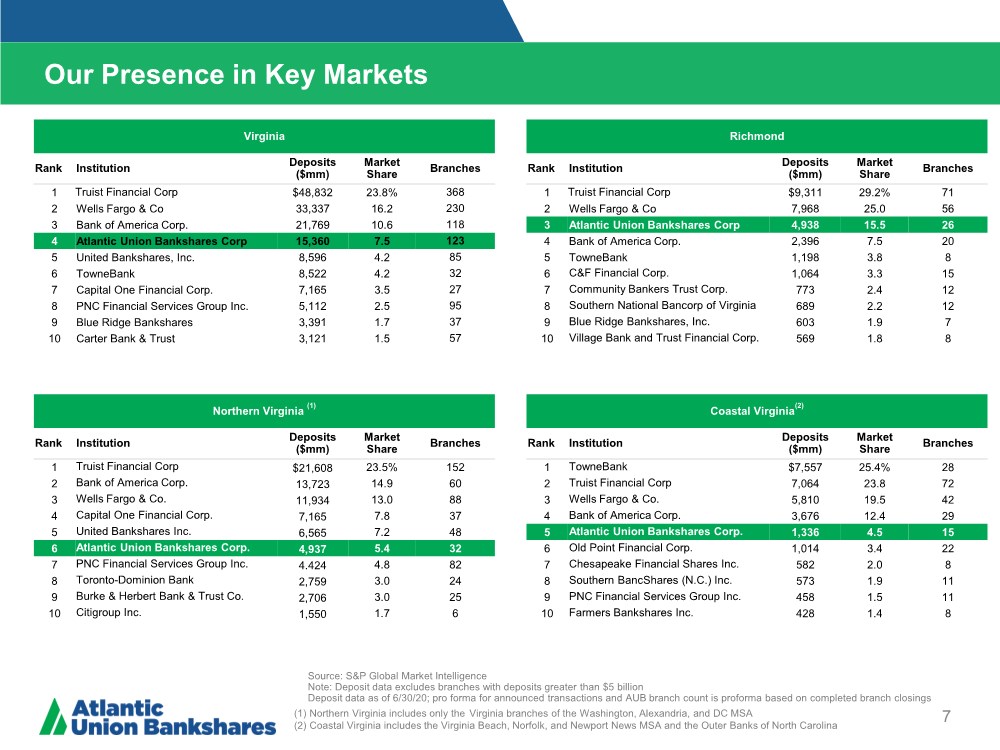
| Our Presence in Key Markets 7 Source: S&P Global Market Intelligence Note: Deposit data excludes branches with deposits greater than $5 billion Deposit data as of 6/30/20; pro forma for announced transactions and AUB branch count is proforma based on completed branch closings (1) Northern Virginia includes only the Virginia branches of the Washington, Alexandria, and DC MSA (2) Coastal Virginia includes the Virginia Beach, Norfolk, and Newport News MSA and the Outer Banks of North Carolina Northern Virginia (1) Rank Institution Deposits ($mm) Market Share Branches 1 Truist Financial Corp $21,608 23.5% 152 2 Bank of America Corp. 13,723 14.9 60 3 Wells Fargo & Co. 11,934 13.0 88 4 Capital One Financial Corp. 7,165 7.8 37 5 United Bankshares Inc. 6,565 7.2 48 6 Atlantic Union Bankshares Corp. 4,937 5.4 32 7 PNC Financial Services Group Inc. 4.424 4.8 82 8 Toronto-Dominion Bank 2,759 3.0 24 9 Burke & Herbert Bank & Trust Co. 2,706 3.0 25 10 Citigroup Inc. 1,550 1.7 6 Virginia Rank Institution Deposits ($mm) Market Share Branches 1 Truist Financial Corp $48,832 23.8% 368 2 Wells Fargo & Co 33,337 16.2 230 3 Bank of America Corp. 21,769 10.6 118 4 Atlantic Union Bankshares Corp 15,360 7.5 123 5 United Bankshares, Inc. 8,596 4.2 85 6 TowneBank 8,522 4.2 32 7 Capital One Financial Corp. 7,165 3.5 27 8 PNC Financial Services Group Inc. 5,112 2.5 95 9 Blue Ridge Bankshares 3,391 1.7 37 10 Carter Bank & Trust 3,121 1.5 57 Richmond Rank Institution Deposits ($mm) Market Share Branches 1 Truist Financial Corp $9,311 29.2% 71 2 Wells Fargo & Co 7,968 25.0 56 3 Atlantic Union Bankshares Corp 4,938 15.5 26 4 Bank of America Corp. 2,396 7.5 20 5 TowneBank 1,198 3.8 8 6 C&F Financial Corp. 1,064 3.3 15 7 Community Bankers Trust Corp. 773 2.4 12 8 Southern National Bancorp of Virginia 689 2.2 12 9 Blue Ridge Bankshares, Inc. 603 1.9 7 10 Village Bank and Trust Financial Corp. 569 1.8 8 Coastal Virginia(2) Rank Institution Deposits ($mm) Market Share Branches 1 TowneBank $7,557 25.4% 28 2 Truist Financial Corp 7,064 23.8 72 3 Wells Fargo & Co. 5,810 19.5 42 4 Bank of America Corp. 3,676 12.4 29 5 Atlantic Union Bankshares Corp. 1,336 4.5 15 6 Old Point Financial Corp. 1,014 3.4 22 7 Chesapeake Financial Shares Inc. 582 2.0 8 8 Southern BancShares (N.C.) Inc. 573 1.9 11 9 PNC Financial Services Group Inc. 458 1.5 11 10 Farmers Bankshares Inc. 428 1.4 8 |
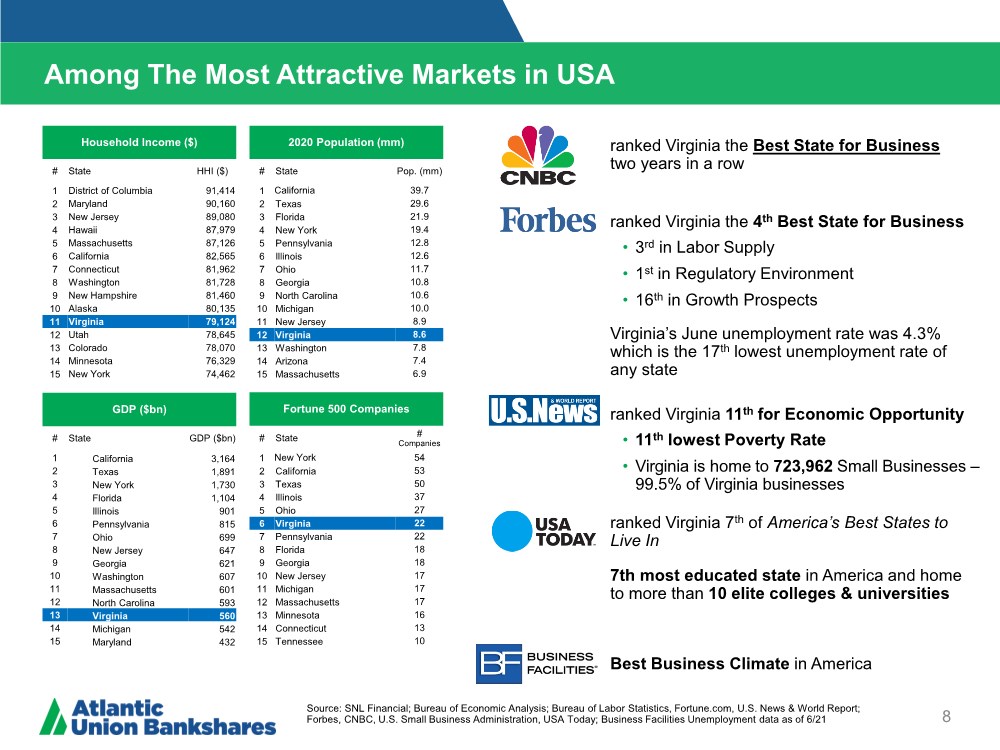
| Among The Most Attractive Markets in USA 8 Fortune 500 Companies # State # Companies 1 New York 54 2 California 53 3 Texas 50 4 Illinois 37 5 Ohio 27 6 Virginia 22 7 Pennsylvania 22 8 Florida 18 9 Georgia 18 10 New Jersey 17 11 Michigan 17 12 Massachusetts 17 13 Minnesota 16 14 Connecticut 13 15 Tennessee 10 • 3rd in Labor Supply • 1st in Regulatory Environment • 16th in Growth Prospects ranked Virginia the Best State for Business two years in a row ranked Virginia the 4th Best State for Business Virginia’s June unemployment rate was 4.3% which is the 17th lowest unemployment rate of any state • 11th lowest Poverty Rate • Virginia is home to 723,962 Small Businesses – 99.5% of Virginia businesses ranked Virginia 11th for Economic Opportunity ranked Virginia 7th of America’s Best States to Live In 7th most educated state in America and home to more than 10 elite colleges & universities Source: SNL Financial; Bureau of Economic Analysis; Bureau of Labor Statistics, Fortune.com, U.S. News & World Report; Forbes, CNBC, U.S. Small Business Administration, USA Today; Business Facilities Unemployment data as of 6/21 2020 Population (mm) # State Pop. (mm) 1 California 39.7 2 Texas 29.6 3 Florida 21.9 4 New York 19.4 5 Pennsylvania 12.8 6 Illinois 12.6 7 Ohio 11.7 8 Georgia 10.8 9 North Carolina 10.6 10 Michigan 10.0 11 New Jersey 8.9 12 Virginia 8.6 13 Washington 7.8 14 Arizona 7.4 15 Massachusetts 6.9 Household Income ($) # State HHI ($) 1 District of Columbia 91,414 2 Maryland 90,160 3 New Jersey 89,080 4 Hawaii 87,979 5 Massachusetts 87,126 6 California 82,565 7 Connecticut 81,962 8 Washington 81,728 9 New Hampshire 81,460 10 Alaska 80,135 11 Virginia 79,124 12 Utah 78,645 13 Colorado 78,070 14 Minnesota 76,329 15 New York 74,462 GDP ($bn) # State GDP ($bn) 1 California 3,164 2 Texas 1,891 3 New York 1,730 4 Florida 1,104 5 Illinois 901 6 Pennsylvania 815 7 Ohio 699 8 New Jersey 647 9 Georgia 621 10 Washington 607 11 Massachusetts 601 12 North Carolina 593 13 Virginia 560 14 Michigan 542 15 Maryland 432 Best Business Climate in America |
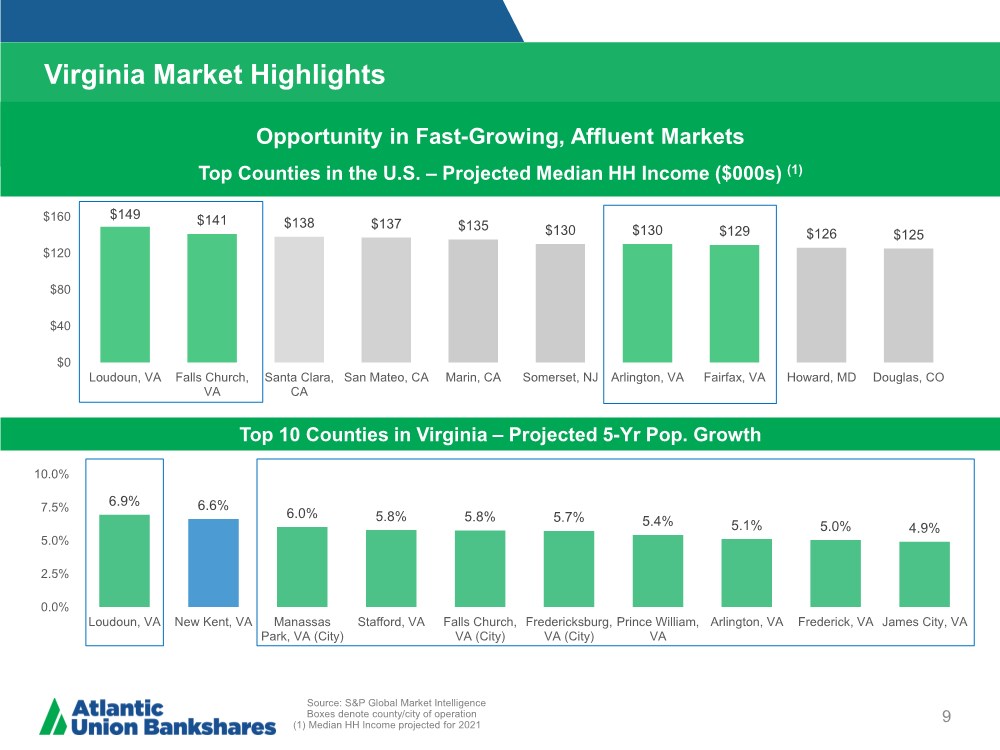
| $149 $141 $138 $137 $135 $130 $130 $129 $126 $125 $0 $40 $80 $120 $160 Loudoun, VA Falls Church, VA Santa Clara, CA San Mateo, CA Marin, CA Somerset, NJ Arlington, VA Fairfax, VA Howard, MD Douglas, CO 6.9% 6.6% 6.0% 5.8% 5.8% 5.7% 5.4% 5.1% 5.0% 4.9% 0.0% 2.5% 5.0% 7.5% 10.0% Loudoun, VA New Kent, VA Manassas Park, VA (City) Stafford, VA Falls Church, VA (City) Fredericksburg, VA (City) Prince William, VA Arlington, VA Frederick, VA James City, VA Virginia Market Highlights 9 Source: S&P Global Market Intelligence Boxes denote county/city of operation (1) Median HH Income projected for 2021 Top 10 Counties in Virginia – Projected 5-Yr Pop. Growth Opportunity in Fast-Growing, Affluent Markets Top Counties in the U.S. – Projected Median HH Income ($000s) (1) |
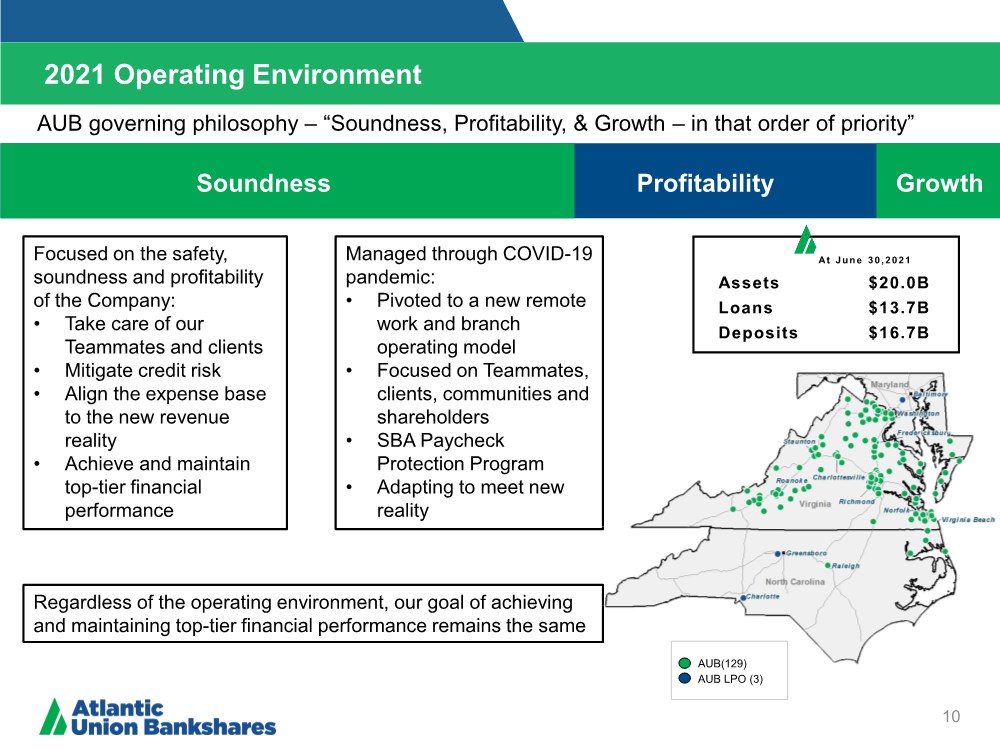
| 2021 Operating Environment 10 Soundness Profitability Growth At June 30,2021 Assets $20.0B Loans $13.7B Deposits $16.7B Managed through COVID-19 pandemic: • Pivoted to a new remote work and branch operating model • Focused on Teammates, clients, communities and shareholders • SBA Paycheck Protection Program • Adapting to meet new reality AUB governing philosophy –“Soundness, Profitability, & Growth – in that order of priority” Focused on the safety, soundness and profitability of the Company: • Take care of our Teammates and clients • Mitigate credit risk • Align the expense base to the new revenue reality • Achieve and maintain top-tier financial performance Regardless of the operating environment, our goal of achieving and maintaining top-tier financial performance remains the same AUB(129) AUB LPO (3) |
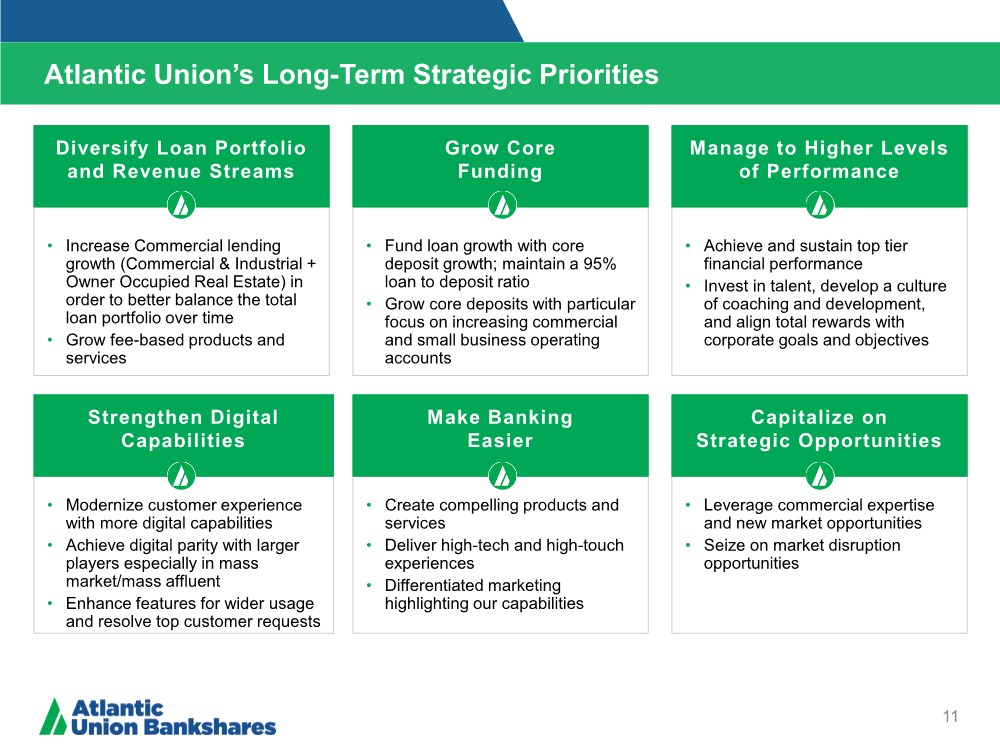
| Atlantic Union’s Long-Term Strategic Priorities 11 • Increase Commercial lending growth (Commercial & Industrial + Owner Occupied Real Estate) in order to better balance the total loan portfolio over time • Grow fee-based products and services Diversify Loan Portfolio and Revenue Streams • Fund loan growth with core deposit growth; maintain a 95% loan to deposit ratio • Grow core deposits with particular focus on increasing commercial and small business operating accounts Grow Core Funding • Achieve and sustain top tier financial performance • Invest in talent, develop a culture of coaching and development, and align total rewards with corporate goals and objectives Manage to Higher Levels of Performance • Modernize customer experience with more digital capabilities • Achieve digital parity with larger players especially in mass market/mass affluent • Enhance features for wider usage and resolve top customer requests • Create compelling products and services • Deliver high-tech and high-touch experiences • Differentiated marketing highlighting our capabilities • Leverage commercial expertise and new market opportunities • Seize on market disruption opportunities Strengthen Digital Capabilities Make Banking Easier Capitalize on Strategic Opportunities |
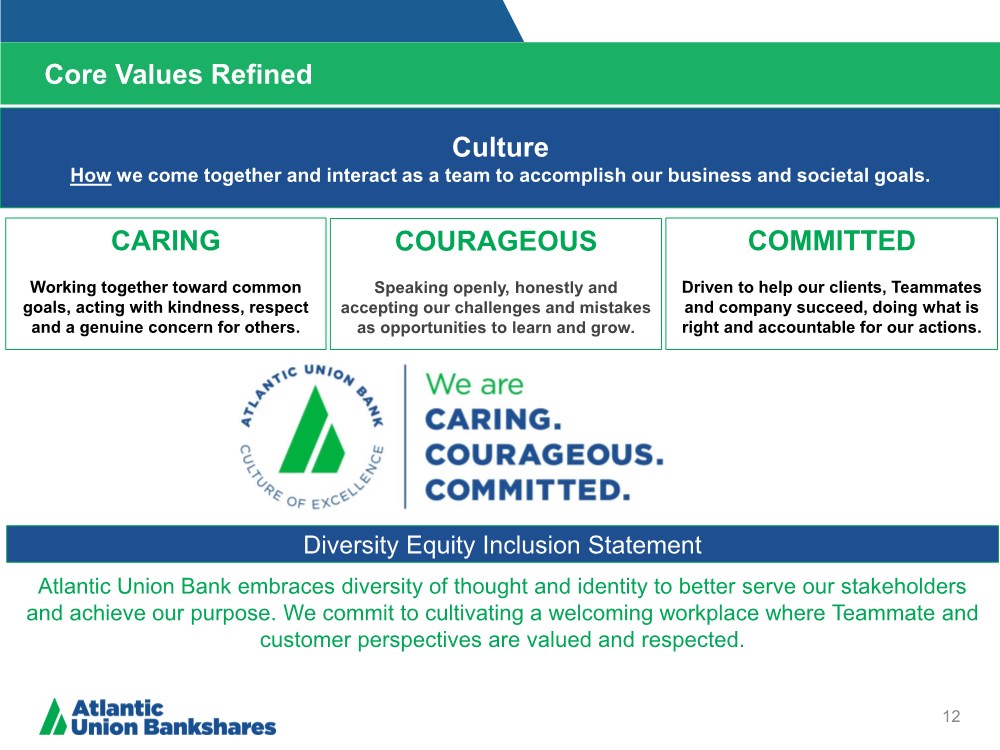
| Core Values Refined 12 CARING Working together toward common goals, acting with kindness, respect and a genuine concern for others. COURAGEOUS Speaking openly, honestly and accepting our challenges and mistakes as opportunities to learn and grow. COMMITTED Driven to help our clients, Teammates and company succeed, doing what is right and accountable for our actions. Diversity Equity Inclusion Statement Atlantic Union Bank embraces diversity of thought and identity to better serve our stakeholders and achieve our purpose. We commit to cultivating a welcoming workplace where Teammate and customer perspectives are valued and respected. Culture How we come together and interact as a team to accomplish our business and societal goals. |
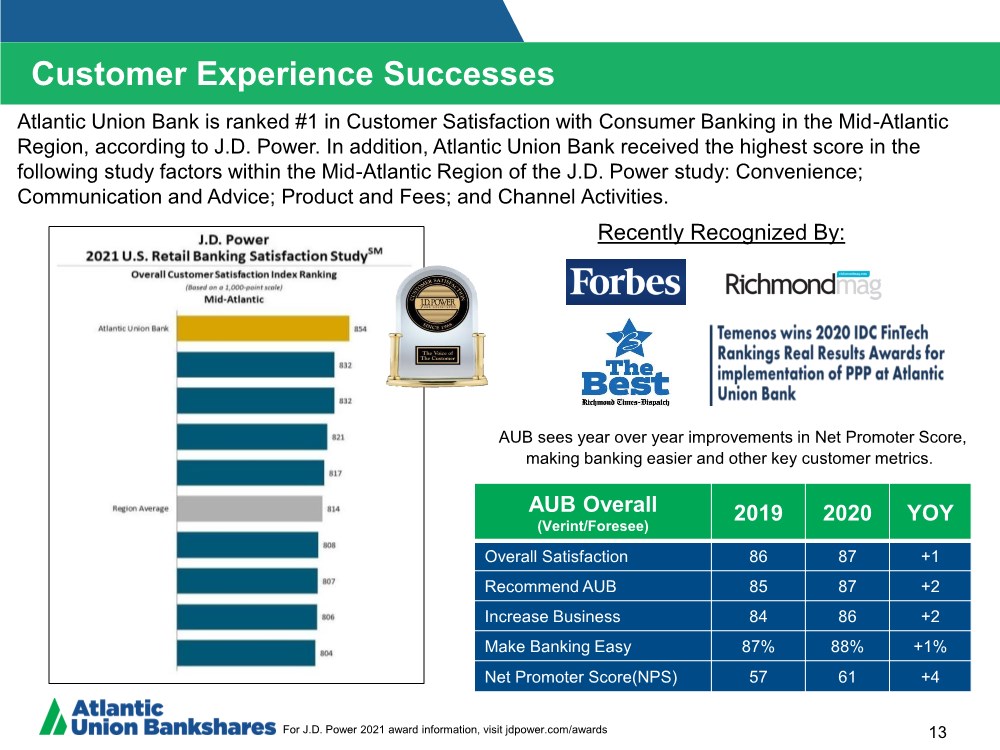
| Customer Experience Successes 13 AUB Overall (Verint/Foresee) 2019 2020 YOY Overall Satisfaction 86 87 +1 Recommend AUB 85 87 +2 Increase Business 84 86 +2 Make Banking Easy 87% 88% +1% Net Promoter Score(NPS) 57 61 +4 Atlantic Union Bank is ranked #1 in Customer Satisfaction with Consumer Banking in the Mid-Atlantic Region, according to J.D. Power. In addition, Atlantic Union Bank received the highest score in the following study factors within the Mid-Atlantic Region of the J.D. Power study: Convenience; Communication and Advice; Product and Fees; and Channel Activities. AUB sees year over year improvements in Net Promoter Score, making banking easier and other key customer metrics. Recently Recognized By: For J.D. Power 2021 award information, visit jdpower.com/awards |
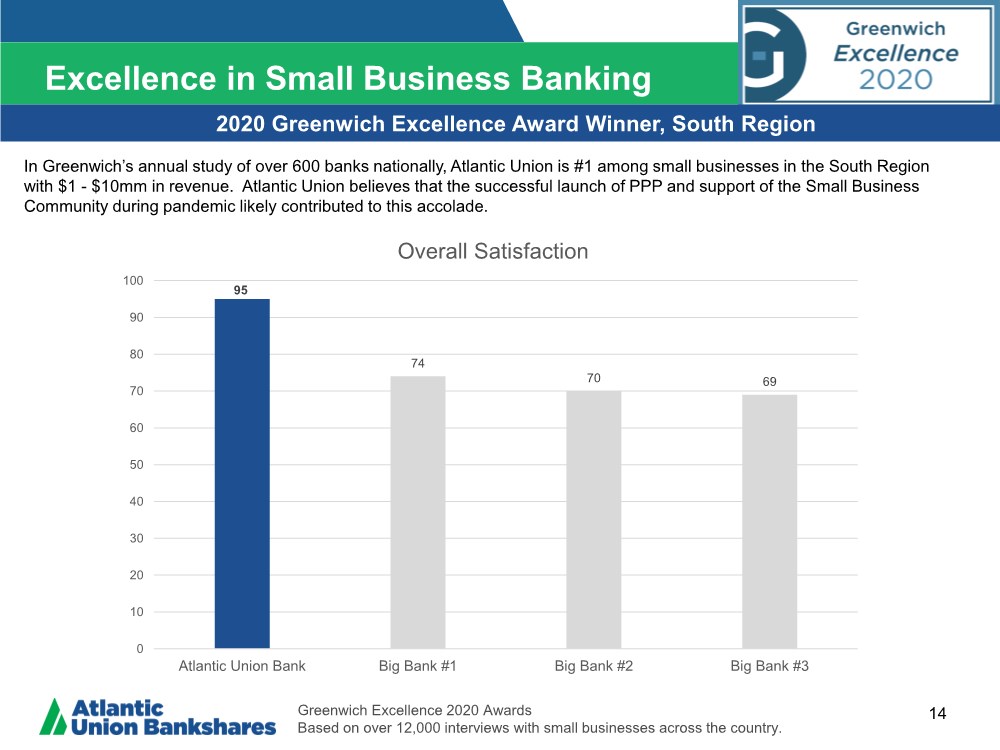
| Excellence in Small Business Banking 14 2020 Greenwich Excellence Award Winner, South Region Greenwich Excellence 2020 Awards Based on over 12,000 interviews with small businesses across the country. 95 74 70 69 0 10 20 30 40 50 60 70 80 90 100 Atlantic Union Bank Big Bank #1 Big Bank #2 Big Bank #3 Overall Satisfaction In Greenwich’s annual study of over 600 banks nationally, Atlantic Union is #1 among small businesses in the South Region with $1 - $10mm in revenue. Atlantic Union believes that the successful launch of PPP and support of the Small Business Community during pandemic likely contributed to this accolade. |
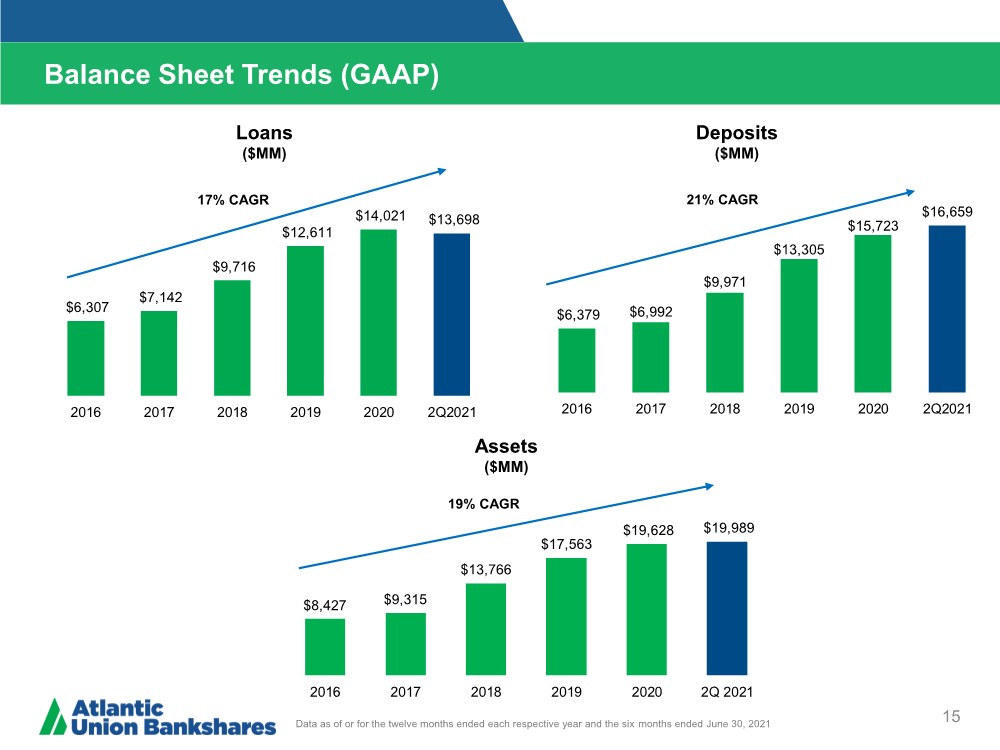
| $8,427 $9,315 $13,766 $17,563 $19,628 $19,989 2016 2017 2018 2019 2020 2Q 2021 $6,379 $6,992 $9,971 $13,305 $15,723 $16,659 2016 2017 2018 2019 2020 2Q2021 $6,307 $7,142 $9,716 $12,611 $14,021 $13,698 2016 2017 2018 2019 2020 2Q2021 Balance Sheet Trends (GAAP) 15 Loans ($MM) Deposits ($MM) Assets ($MM) Data as of or for the twelve months ended each respective year and the six months ended June 30, 2021 17% CAGR 21% CAGR 19% CAGR |
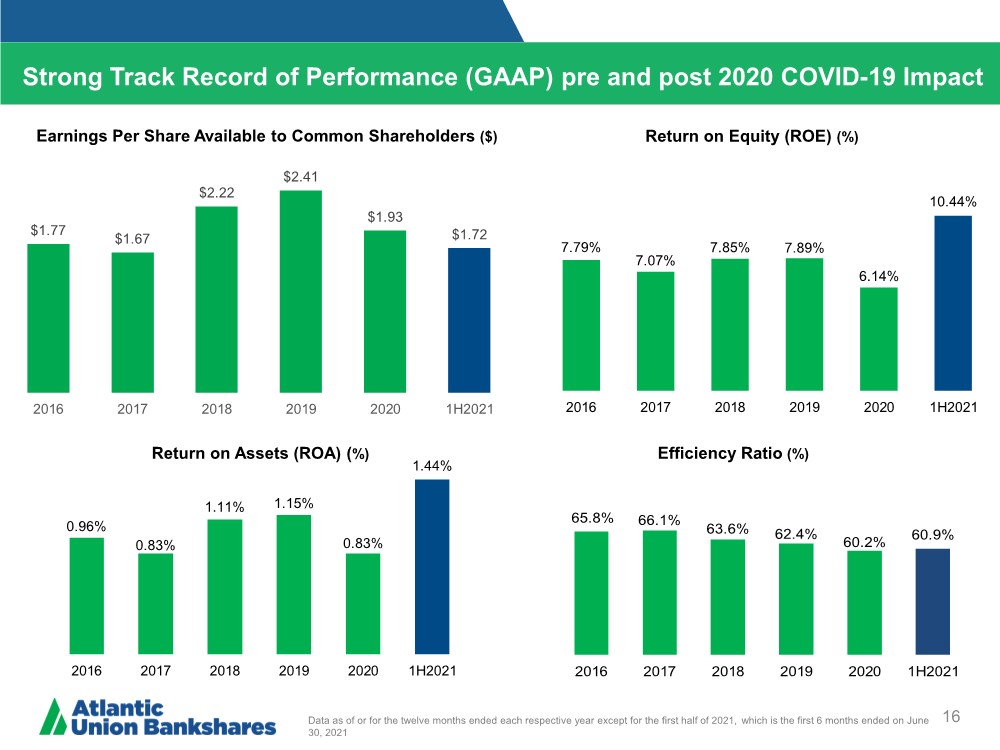
| Strong Track Record of Performance (GAAP) pre and post 2020 COVID-19 Impact 16 Data as of or for the twelve months ended each respective year except for the first half of 2021, which is the first 6 months ended on June 30, 2021 Return on Assets (ROA) (%) Return on Equity (ROE) (%) Efficiency Ratio (%) Earnings Per Share Available to Common Shareholders ($) 7.79% 7.07% 7.85% 7.89% 6.14% 10.44% 2016 2017 2018 2019 2020 1H2021 0.96% 0.83% 1.11% 1.15% 0.83% 1.44% 2016 2017 2018 2019 2020 1H2021 65.8% 66.1% 63.6% 62.4% 60.2% 60.9% 2016 2017 2018 2019 2020 1H2021 $1.77 $1.67 $2.22 $2.41 $1.93 $1.72 2016 2017 2018 2019 2020 1H2021 |
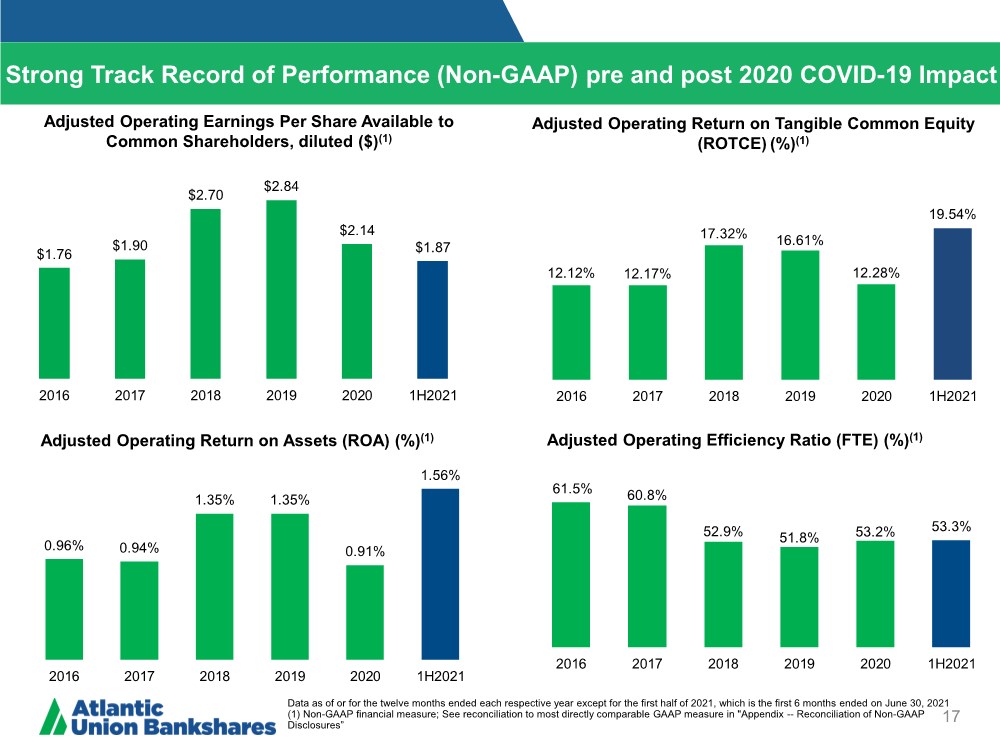
| Strong Track Record of Performance (Non-GAAP) pre and post 2020 COVID-19 Impact 17 Data as of or for the twelve months ended each respective year except for the first half of 2021, which is the first 6 months ended on June 30, 2021 (1) Non-GAAP financial measure; See reconciliation to most directly comparable GAAP measure in "Appendix -- Reconciliation of Non-GAAP Disclosures” Adjusted Operating Return on Assets (ROA) (%)(1) Adjusted Operating Return on Tangible Common Equity (ROTCE)(%)(1) Adjusted Operating Efficiency Ratio (FTE) (%)(1) Adjusted Operating Earnings Per Share Available to Common Shareholders, diluted ($)(1) $1.76 $1.90 $2.70 $2.84 $2.14 $1.87 2016 2017 2018 2019 2020 1H2021 0.96% 0.94% 1.35% 1.35% 0.91% 1.56% 2016 2017 2018 2019 2020 1H2021 12.12% 12.17% 17.32% 16.61% 12.28% 19.54% 2016 2017 2018 2019 2020 1H2021 61.5% 60.8% 52.9% 51.8% 53.2% 53.3% 2016 2017 2018 2019 2020 1H2021 |
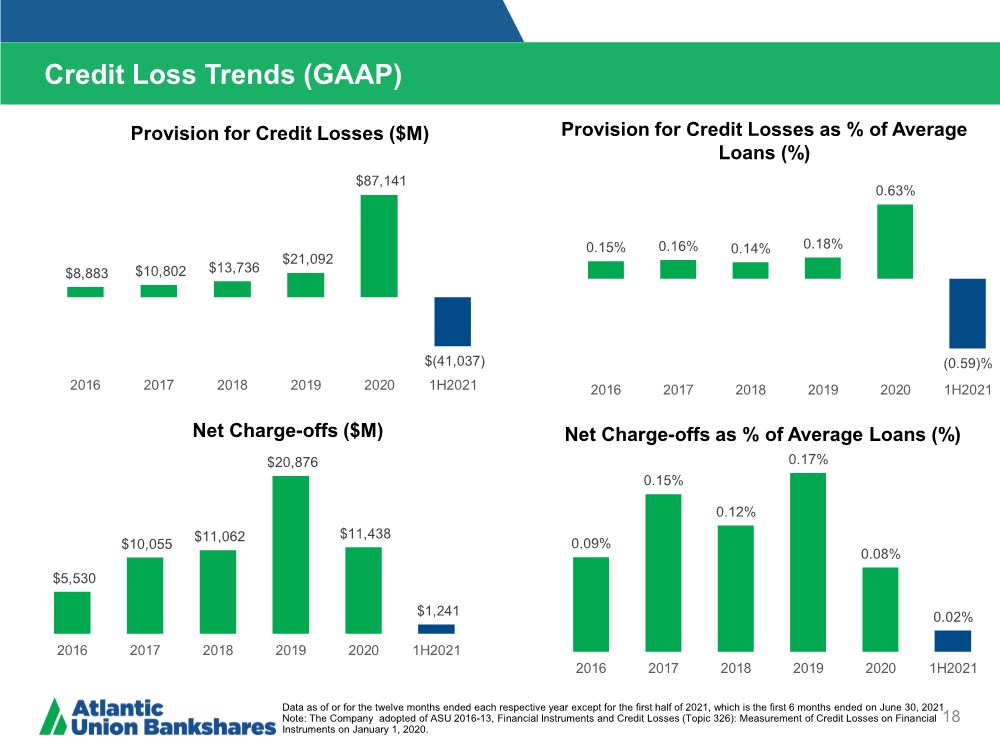
| 18 Provision for Credit Losses ($M) Provision for Credit Losses as % of Average Loans (%) Credit Loss Trends (GAAP) Net Charge-offs ($M) Net Charge-offs as % of Average Loans (%) Data as of or for the twelve months ended each respective year except for the first half of 2021, which is the first 6 months ended on June 30, 2021 Note: The Company adopted of ASU 2016-13, Financial Instruments and Credit Losses (Topic 326): Measurement of Credit Losses on Financial Instruments on January 1, 2020. $8,883 $10,802 $13,736 $21,092 $87,141 $(41,037) 2016 2017 2018 2019 2020 1H2021 0.15% 0.16% 0.14% 0.18% 0.63% (0.59)% 2016 2017 2018 2019 2020 1H2021 $5,530 $10,055 $11,062 $20,876 $11,438 $1,241 2016 2017 2018 2019 2020 1H2021 0.09% 0.15% 0.12% 0.17% 0.08% 0.02% 2016 2017 2018 2019 2020 1H2021 |
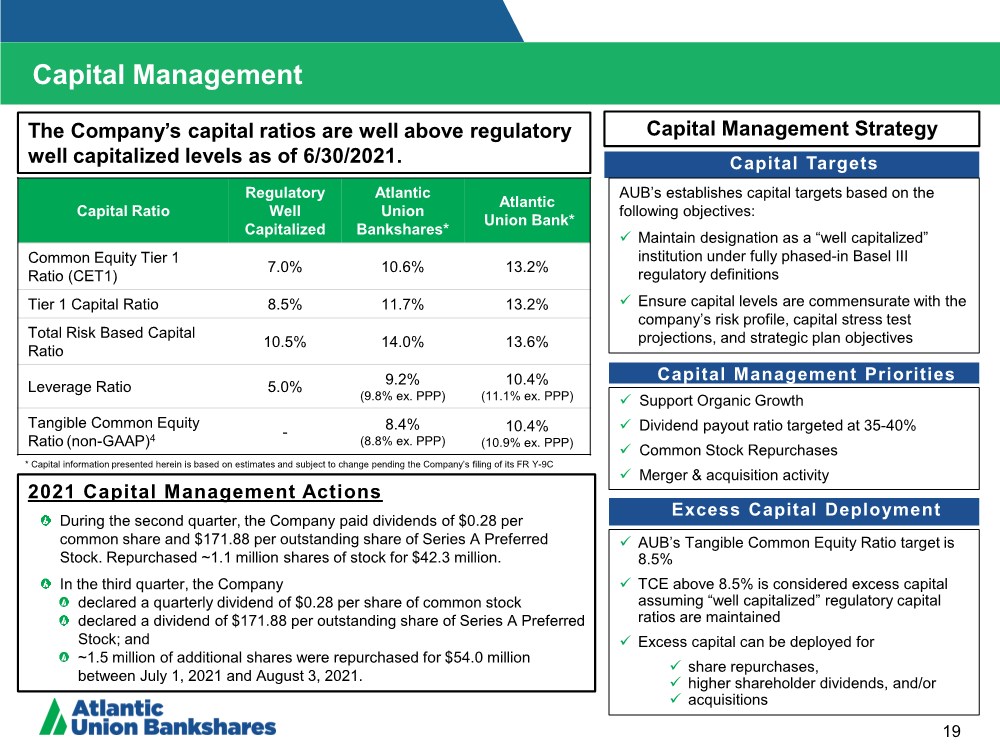
| * Capital information presented herein is based on estimates and subject to change pending the Company’s filing of its FR Y-9C Capital Management Strategy Capital Targets Capital Management Priorities Excess Capital Deployment AUB’s establishes capital targets based on the following objectives: Maintain designation as a “well capitalized” institution under fully phased-in Basel III regulatory definitions Ensure capital levels are commensurate with the company’s risk profile, capital stress test projections, and strategic plan objectives AUB’s Tangible Common Equity Ratio target is 8.5% TCE above 8.5% is considered excess capital assuming “well capitalized” regulatory capital ratios are maintained Excess capital can be deployed for share repurchases, higher shareholder dividends, and/or acquisitions Support Organic Growth Dividend payout ratio targeted at 35-40% Common Stock Repurchases Merger & acquisition activity 19 The Company’s capital ratios are well above regulatory well capitalized levels as of 6/30/2021. Capital Management 2021 Capital Management Actions During the second quarter, the Company paid dividends of $0.28 per common share and $171.88 per outstanding share of Series A Preferred Stock. Repurchased ~1.1 million shares of stock for $42.3 million. In the third quarter, the Company declared a quarterly dividend of $0.28 per share of common stock declared a dividend of $171.88 per outstanding share of Series A Preferred Stock; and ~1.5 million of additional shares were repurchased for $54.0 million between July 1, 2021 and August 3, 2021. Capital Ratio Regulatory Well Capitalized Atlantic Union Bankshares* Atlantic Union Bank* Common Equity Tier 1 Ratio (CET1) 7.0% 10.6% 13.2% Tier 1 Capital Ratio 8.5% 11.7% 13.2% Total Risk Based Capital Ratio 10.5% 14.0% 13.6% Leverage Ratio 5.0% 9.2% (9.8% ex. PPP) 10.4% (11.1% ex. PPP) Tangible Common Equity Ratio (non-GAAP)4 - 8.4% (8.8% ex. PPP) 10.4% (10.9% ex. PPP) |
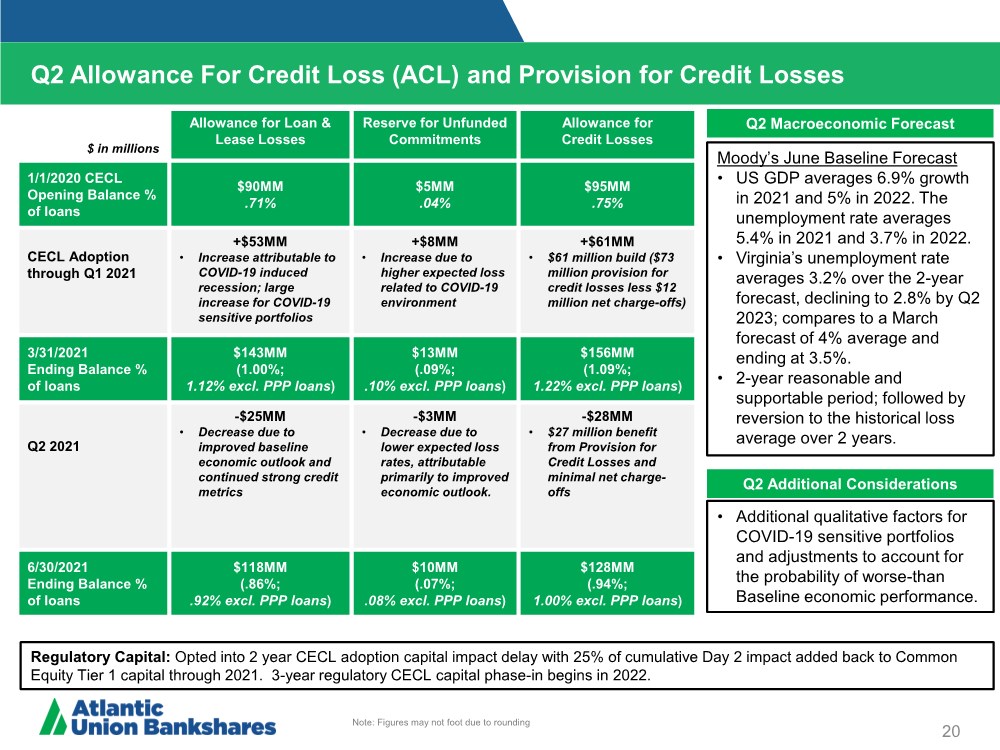
| Q2 Allowance For Credit Loss (ACL) and Provision for Credit Losses 20 Q2 Macroeconomic Forecast Q2 Additional Considerations Moody’s June Baseline Forecast • US GDP averages 6.9% growth in 2021 and 5% in 2022. The unemployment rate averages 5.4% in 2021 and 3.7% in 2022. • Virginia’s unemployment rate averages 3.2% over the 2-year forecast, declining to 2.8% by Q2 2023; compares to a March forecast of 4% average and ending at 3.5%. • 2-year reasonable and supportable period; followed by reversion to the historical loss average over 2 years. • Additional qualitative factors for COVID-19 sensitive portfolios and adjustments to account for the probability of worse-than Baseline economic performance. Regulatory Capital: Opted into 2 year CECL adoption capital impact delay with 25% of cumulative Day 2 impact added back to Common Equity Tier 1 capital through 2021. 3-year regulatory CECL capital phase-in begins in 2022. $ in millions Allowance for Loan & Lease Losses Reserve for Unfunded Commitments Allowance for Credit Losses 1/1/2020 CECL Opening Balance % of loans $90MM ..71% $5MM ..04% $95MM ..75% CECL Adoption through Q1 2021 +$53MM • Increase attributable to COVID-19 induced recession; large increase for COVID-19 sensitive portfolios +$8MM • Increase due to higher expected loss related to COVID-19 environment +$61MM • $61 million build ($73 million provision for credit losses less $12 million net charge-offs) 3/31/2021 Ending Balance % of loans $143MM (1.00%; 1.12% excl. PPP loans) $13MM (.09%; ..10% excl. PPP loans) $156MM (1.09%; 1.22% excl. PPP loans) Q2 2021 -$25MM • Decrease due to improved baseline economic outlook and continued strong credit metrics -$3MM • Decrease due to lower expected loss rates, attributable primarily to improved economic outlook. -$28MM • $27 million benefit from Provision for Credit Losses and minimal net charge- offs 6/30/2021 Ending Balance % of loans $118MM (.86%; ..92% excl. PPP loans) $10MM (.07%; ..08% excl. PPP loans) $128MM (.94%; 1.00% excl. PPP loans) Note: Figures may not foot due to rounding |
| 2021 Operating Environment – Managing through the Pandemic 21 Soundness Profitability Growth During challenging times, it is important to remember our governing philosophy –“Soundness, Profitability, & Growth – in that order of priority” This core philosophy is serving us well as we manage the Company through the current coronavirus pandemic crisis. We continue to effectively manage through the pandemic with an intense focus on: Taking care of our Teammates and clients – they will remember how we treated them during this period. Mitigating credit risk – batten down the hatches and protect the Bank by working with our business and consumer clients to assist them through these tough times. Aligning the expense base to the lower for longer interest rate environment – ensure sustained top tier financial performance on the other side. We believe that by effectively managing through this crisis, we have become a stronger, more agile company that is well positioned to take advantage of growth opportunities as economic activity normalizes. |
| Appendix |
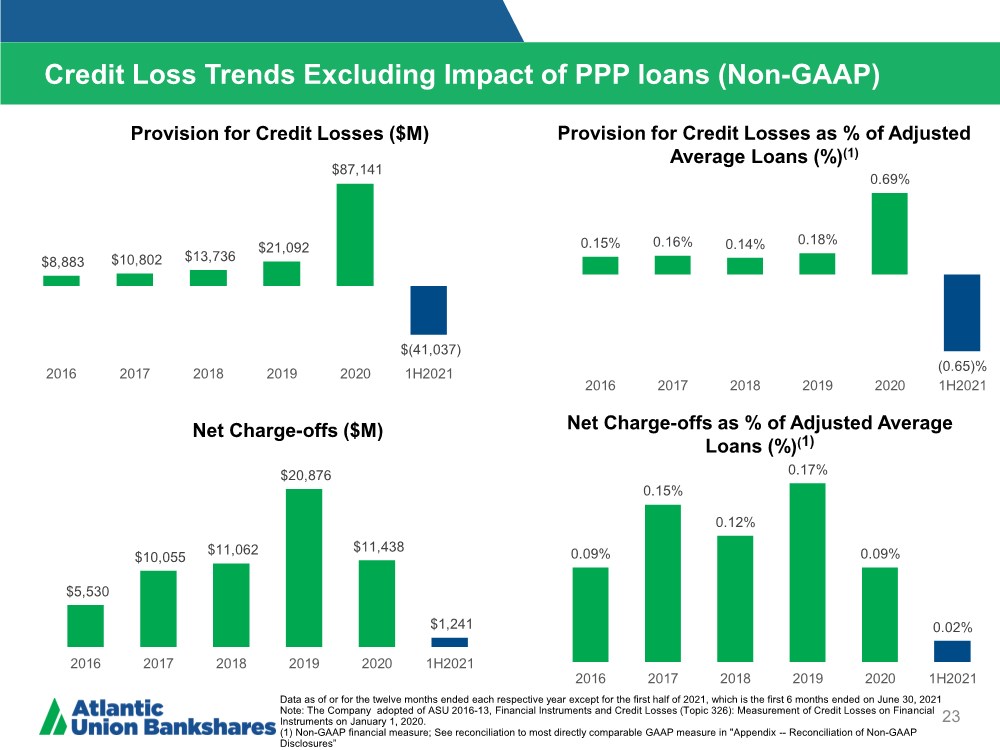
| 23 Provision for Credit Losses ($M) Provision for Credit Losses as % of Adjusted Average Loans (%)(1) Credit Loss Trends Excluding Impact of PPP loans (Non-GAAP) Net Charge-offs ($M) Net Charge-offs as % of Adjusted Average Loans (%)(1) Data as of or for the twelve months ended each respective year except for the first half of 2021, which is the first 6 months ended on June 30, 2021 Note: The Company adopted of ASU 2016-13, Financial Instruments and Credit Losses (Topic 326): Measurement of Credit Losses on Financial Instruments on January 1, 2020. (1) Non-GAAP financial measure; See reconciliation to most directly comparable GAAP measure in "Appendix -- Reconciliation of Non-GAAP Disclosures” $5,530 $10,055 $11,062 $20,876 $11,438 $1,241 2016 2017 2018 2019 2020 1H2021 $8,883 $10,802 $13,736 $21,092 $87,141 $(41,037) 2016 2017 2018 2019 2020 1H2021 0.15% 0.16% 0.14% 0.18% 0.69% (0.65)% 2016 2017 2018 2019 2020 1H2021 0.09% 0.15% 0.12% 0.17% 0.09% 0.02% 2016 2017 2018 2019 2020 1H2021 |
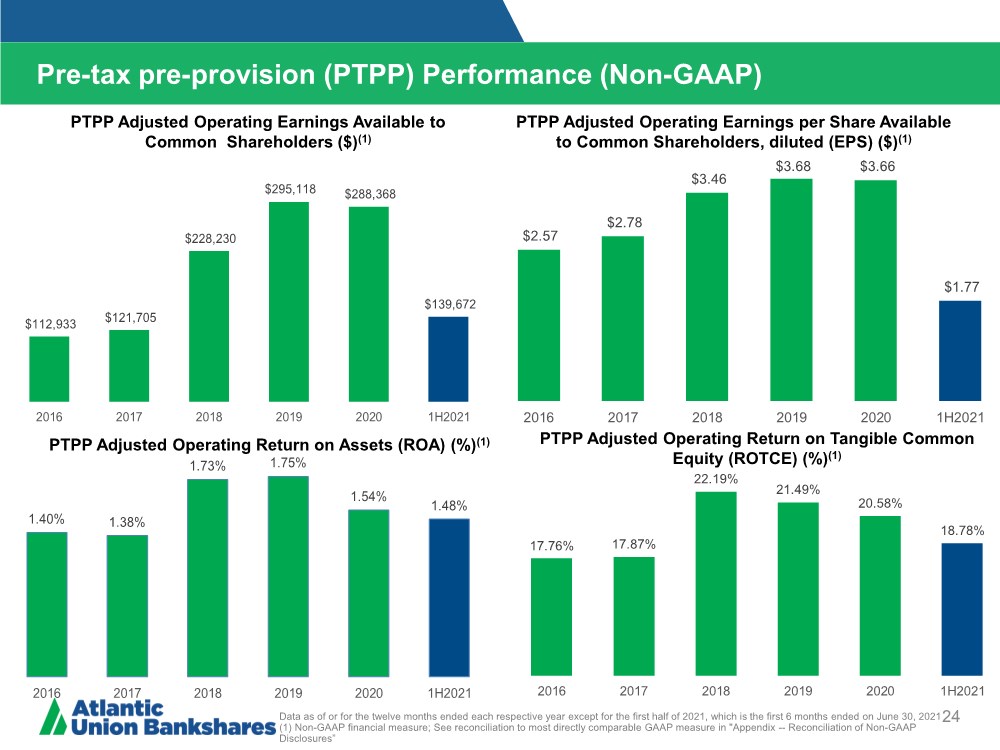
| 24 PTPP Adjusted Operating Earnings per Share Available to Common Shareholders, diluted (EPS) ($)(1) Pre-tax pre-provision (PTPP) Performance (Non-GAAP) PTPP Adjusted Operating Return on Assets (ROA) (%)(1) PTPP Adjusted Operating Earnings Available to Common Shareholders ($)(1) PTPP Adjusted Operating Return on Tangible Common Equity (ROTCE) (%)(1) Data as of or for the twelve months ended each respective year except for the first half of 2021, which is the first 6 months ended on June 30, 2021 (1) Non-GAAP financial measure; See reconciliation to most directly comparable GAAP measure in "Appendix -- Reconciliation of Non-GAAP Disclosures” $2.57 $2.78 $3.46 $3.68 $3.66 $1.77 2016 2017 2018 2019 2020 1H2021 $112,933 $121,705 $228,230 $295,118 $288,368 $139,672 2016 2017 2018 2019 2020 1H2021 1.40% 1.38% 1.73% 1.75% 1.54% 1.48% 2016 2017 2018 2019 2020 1H2021 17.76% 17.87% 22.19% 21.49% 20.58% 18.78% 2016 2017 2018 2019 2020 1H2021 |
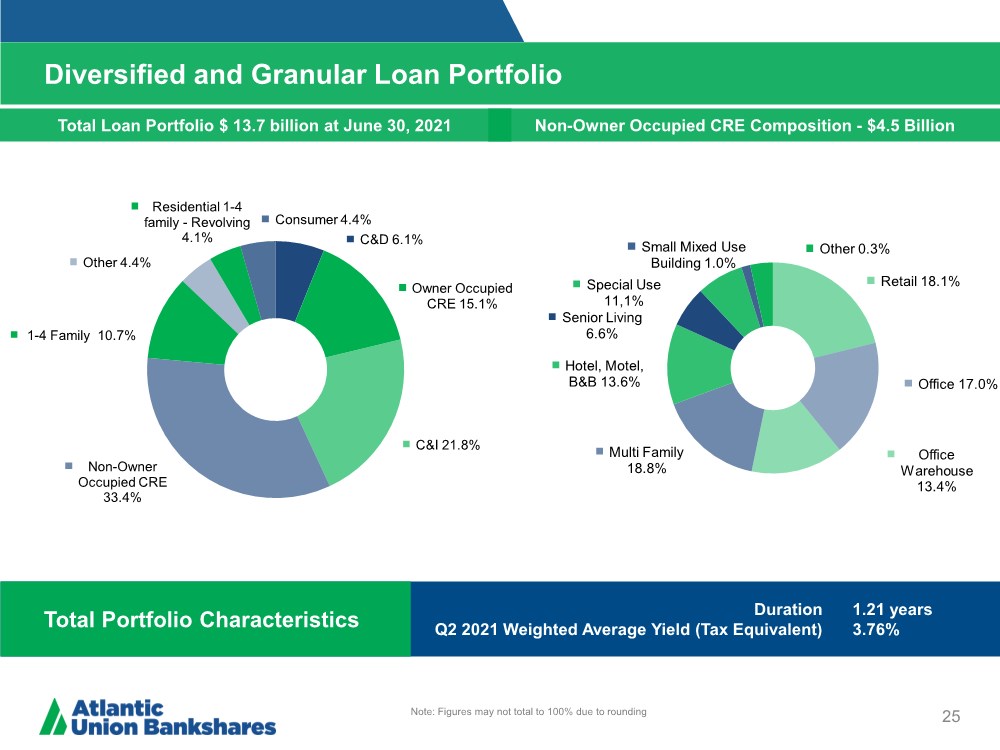
| Diversified and Granular Loan Portfolio 25 Note: Figures may not total to 100% due to rounding Total Loan Portfolio $ 13.7 billion at June 30, 2021 Non-Owner Occupied CRE Composition - $4.5 Billion Total Portfolio Characteristics Duration Q2 2021 Weighted Average Yield (Tax Equivalent) 1.21 years 3.76% C&D 6.1% Owner Occupied CRE 15.1% C&I 21.8% Non-Owner Occupied CRE 33.4% 1-4 Family 10.7% Other 4.4% Residential 1-4 family - Revolving 4.1% Consumer 4.4% Retail 18.1% Office 17.0% Office Warehouse 13.4% Multi Family 18.8% Hotel, Motel, B&B 13.6% Senior Living 6.6% Special Use 11,1% Small Mixed Use Building 1.0% Other 0.3% |
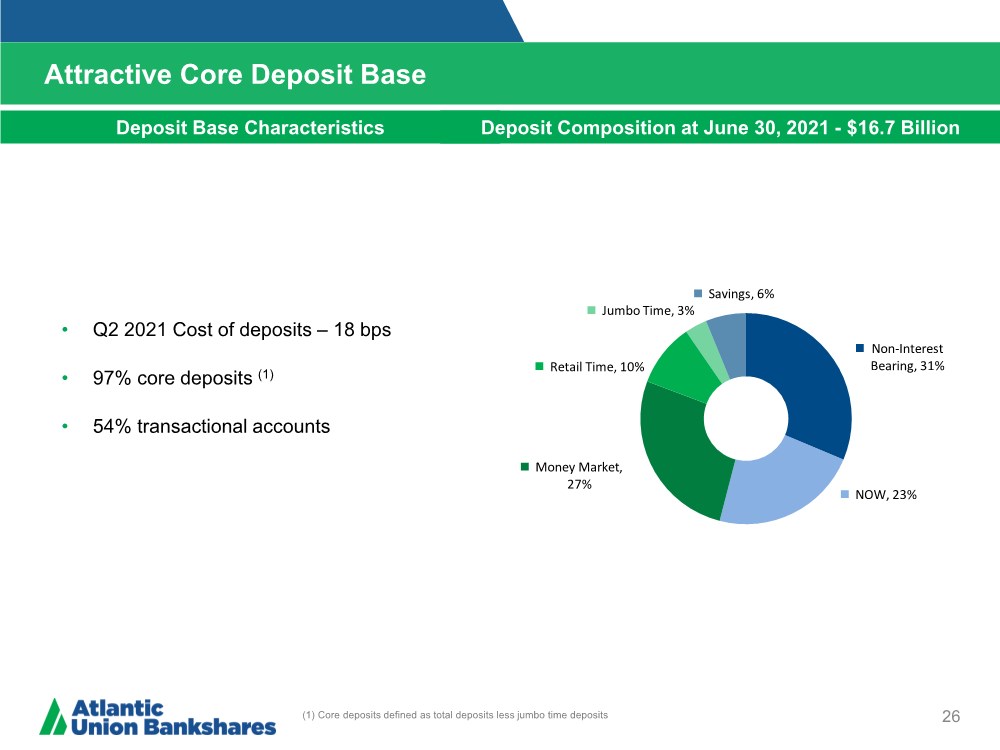
| Attractive Core Deposit Base 26 (1) Core deposits defined as total deposits less jumbo time deposits Deposit Base Characteristics Deposit Composition at June 30, 2021 - $16.7 Billion • Q2 2021 Cost of deposits – 18 bps • 97% core deposits (1) • 54% transactional accounts Non-Interest Bearing, 31% NOW, 23% Money Market, 27% Retail Time, 10% Jumbo Time, 3% Savings, 6% |
| Reconciliation of Non-GAAP Disclosures 27 Operating Earnings Per Share The Company has provided supplemental performance measures on a tax-equivalent, tangible, operating, adjusted, or pre-tax pre-provision basis. These non-GAAP financial measures are supplements to GAAP, which is used to prepare the Company’s financial statements, and should not be considered in isolation or as a substitute for comparable measures calculated in accordance with GAAP. In addition, the Company’s non-GAAP financial measures may not be comparable to non-GAAP financial measures of other companies. The Company uses the non-GAAP financial measures discussed herein in its analysis of the Company’s performance. The Company’s management believes that these non-GAAP financial measures provide additional understanding of ongoing operations, enhance comparability of results of operations with prior periods and show the effects of significant gains and charges in the periods presented without the impact of items or events that may obscure trends in the Company’s underlying performance. |
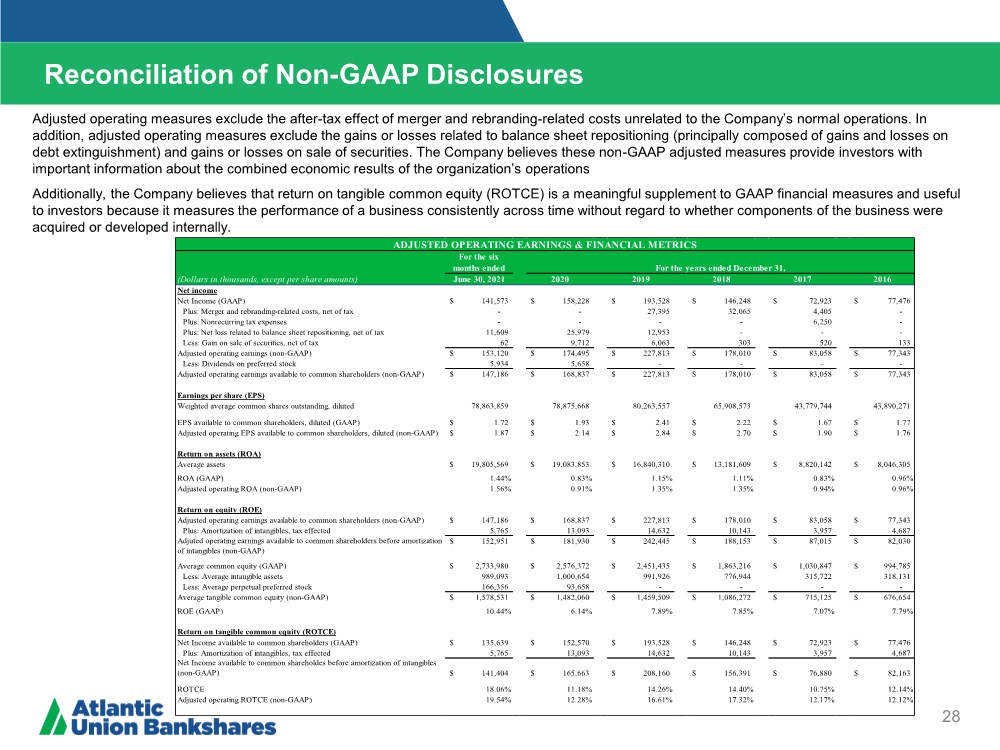
| Reconciliation of Non-GAAP Disclosures 28 Operating Earnings Per Share Adjusted operating measures exclude the after-tax effect of merger and rebranding-related costs unrelated to the Company’s normal operations. In addition, adjusted operating measures exclude the gains or losses related to balance sheet repositioning (principally composed of gains and losses on debt extinguishment) and gains or losses on sale of securities. The Company believes these non-GAAP adjusted measures provide investors with important information about the combined economic results of the organization’s operations Additionally, the Company believes that return on tangible common equity (ROTCE) is a meaningful supplement to GAAP financial measures and useful to investors because it measures the performance of a business consistently across time without regard to whether components of the business were acquired or developed internally. For the six months ended (Dollars in thousands, except per share amounts) June 30, 2021 2020 2019 2018 2017 2016 Net income Net Income (GAAP) 141,573 $ 158,228 $ 193,528 $ 146,248 $ 72,923 $ 77,476 $ Plus: Merger and rebranding-related costs, net of tax - - 27,395 32,065 4,405 - Plus: Nonrecurring tax expenses - - - - 6,250 - Plus: Net loss related to balance sheet repositioning, net of tax 11,609 25,979 12,953 - - - Less: Gain on sale of securities, net of tax 62 9,712 6,063 303 520 133 Adjusted operating earnings (non-GAAP) 153,120 $ 174,495 $ 227,813 $ 178,010 $ 83,058 $ 77,343 $ Less: Dividends on preferred stock 5,934 5,658 - - - - Adjusted operating earnings available to common shareholders (non-GAAP) 147,186 $ 168,837 $ 227,813 $ 178,010 $ 83,058 $ 77,343 $ Earnings per share (EPS) Weighted average common shares outstanding, diluted 78,863,859 78,875,668 80,263,557 65,908,573 43,779,744 43,890,271 EPS available to common shareholders, diluted (GAAP) 1.72 $ 1.93 $ 2.41 $ 2.22 $ 1.67 $ 1.77 $ Adjusted operating EPS available to common shareholders, diluted (non-GAAP) 1.87 $ 2.14 $ 2.84 $ 2.70 $ 1.90 $ 1.76 $ Return on assets (ROA) Average assets 19,805,569 $ 19,083,853 $ 16,840,310 $ 13,181,609 $ 8,820,142 $ 8,046,305 $ ROA (GAAP) 1.44% 0.83% 1.15% 1.11% 0.83% 0.96% Adjusted operating ROA (non-GAAP) 1.56% 0.91% 1.35% 1.35% 0.94% 0.96% Return on equity (ROE) Adjusted operating earnings available to common shareholders (non-GAAP) 147,186 $ 168,837 $ 227,813 $ 178,010 $ 83,058 $ 77,343 $ Plus: Amortization of intangibles, tax effected 5,765 13,093 14,632 10,143 3,957 4,687 Adjuted operating earnings available to common shareholders before amortization of intangibles (non-GAAP) 152,951 $ 181,930 $ 242,445 $ 188,153 $ 87,015 $ 82,030 $ Average common equity (GAAP) 2,733,980 $ 2,576,372 $ 2,451,435 $ 1,863,216 $ 1,030,847 $ 994,785 $ Less: Average intangible assets 989,093 1,000,654 991,926 776,944 315,722 318,131 Less: Average perpetual preferred stock 166,356 93,658 - - - - Average tangible common equity (non-GAAP) 1,578,531 $ 1,482,060 $ 1,459,509 $ 1,086,272 $ 715,125 $ 676,654 $ ROE (GAAP) 10.44% 6.14% 7.89% 7.85% 7.07% 7.79% Return on tangible common equity (ROTCE) Net Income available to common shareholders (GAAP) 135,639 $ 152,570 $ 193,528 $ 146,248 $ 72,923 $ 77,476 $ Plus: Amortization of intangibles, tax effected 5,765 13,093 14,632 10,143 3,957 4,687 Net Income available to common shareholdes before amortization of intangibles (non-GAAP) 141,404 $ 165,663 $ 208,160 $ 156,391 $ 76,880 $ 82,163 $ ROTCE 18.06% 11.18% 14.26% 14.40% 10.75% 12.14% Adjusted operating ROTCE (non-GAAP) 19.54% 12.28% 16.61% 17.32% 12.17% 12.12% For the years ended December 31, ADJUSTED OPERATING EARNINGS & FINANCIAL METRICS |
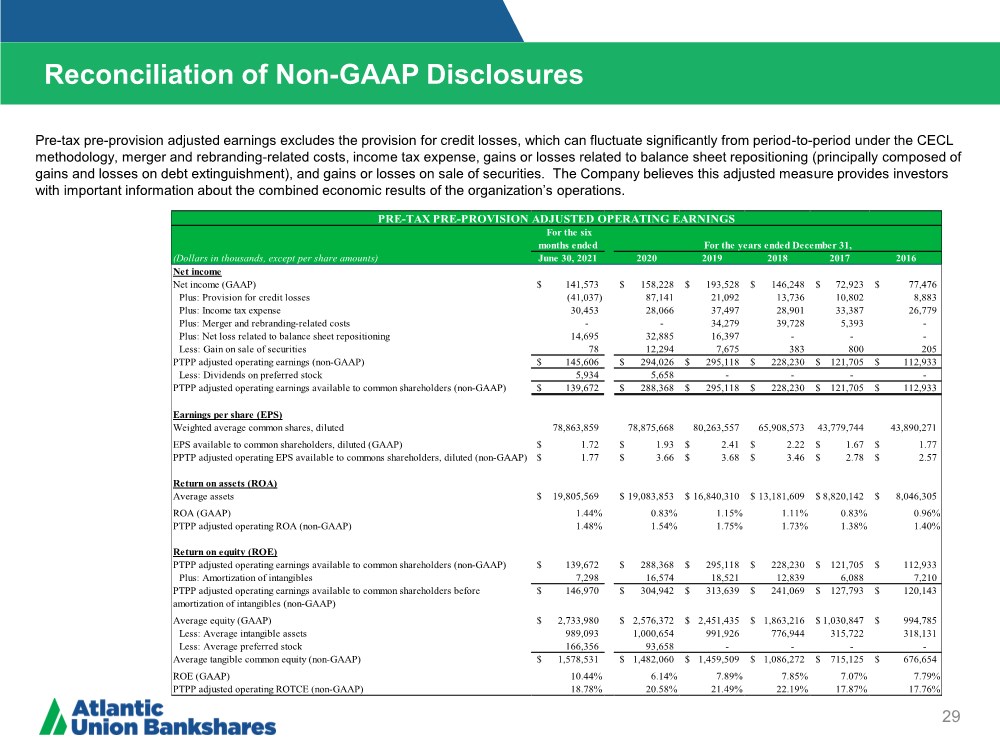
| Reconciliation of Non-GAAP Disclosures 29 Operating Earnings Per Share Pre-tax pre-provision adjusted earnings excludes the provision for credit losses, which can fluctuate significantly from period-to-period under the CECL methodology, merger and rebranding-related costs, income tax expense, gains or losses related to balance sheet repositioning (principally composed of gains and losses on debt extinguishment), and gains or losses on sale of securities. The Company believes this adjusted measure provides investors with important information about the combined economic results of the organization’s operations. For the six months ended (Dollars in thousands, except per share amounts) June 30, 2021 2020 2019 2018 2017 2016 Net income Net income (GAAP) 141,573 $ 158,228 $ 193,528 $ 146,248 $ 72,923 $ 77,476 $ Plus: Provision for credit losses (41,037) 87,141 21,092 13,736 10,802 8,883 Plus: Income tax expense 30,453 28,066 37,497 28,901 33,387 26,779 Plus: Merger and rebranding-related costs - - 34,279 39,728 5,393 - Plus: Net loss related to balance sheet repositioning 14,695 32,885 16,397 - - - Less: Gain on sale of securities 78 12,294 7,675 383 800 205 PTPP adjusted operating earnings (non-GAAP) 145,606 $ 294,026 $ 295,118 $ 228,230 $ 121,705 $ 112,933 $ Less: Dividends on preferred stock 5,934 5,658 - - - - PTPP adjusted operating earnings available to common shareholders (non-GAAP) 139,672 $ 288,368 $ 295,118 $ 228,230 $ 121,705 $ 112,933 $ Earnings per share (EPS) Weighted average common shares, diluted 78,863,859 78,875,668 80,263,557 65,908,573 43,779,744 43,890,271 EPS available to common shareholders, diluted (GAAP) 1.72 $ 1.93 $ 2.41 $ 2.22 $ 1.67 $ 1.77 $ PPTP adjusted operating EPS available to commons shareholders, diluted (non-GAAP) 1.77 $ 3.66 $ 3.68 $ 3.46 $ 2.78 $ 2.57 $ Return on assets (ROA) Average assets 19,805,569 $ 19,083,853 $ 16,840,310 $ 13,181,609 $ 8,820,142 $ 8,046,305 $ ROA (GAAP) 1.44% 0.83% 1.15% 1.11% 0.83% 0.96% PTPP adjusted operating ROA (non-GAAP) 1.48% 1.54% 1.75% 1.73% 1.38% 1.40% Return on equity (ROE) PTPP adjusted operating earnings available to common shareholders (non-GAAP) 139,672 $ 288,368 $ 295,118 $ 228,230 $ 121,705 $ 112,933 $ Plus: Amortization of intangibles 7,298 16,574 18,521 12,839 6,088 7,210 PTPP adjusted operating earnings available to common shareholders before amortization of intangibles (non-GAAP) 146,970 $ 304,942 $ 313,639 $ 241,069 $ 127,793 $ 120,143 $ Average equity (GAAP) 2,733,980 $ 2,576,372 $ 2,451,435 $ 1,863,216 $ 1,030,847 $ 994,785 $ Less: Average intangible assets 989,093 1,000,654 991,926 776,944 315,722 318,131 Less: Average preferred stock 166,356 93,658 - - - - Average tangible common equity (non-GAAP) 1,578,531 $ 1,482,060 $ 1,459,509 $ 1,086,272 $ 715,125 $ 676,654 $ ROE (GAAP) 10.44% 6.14% 7.89% 7.85% 7.07% 7.79% PTPP adjusted operating ROTCE (non-GAAP) 18.78% 20.58% 21.49% 22.19% 17.87% 17.76% For the years ended December 31, PRE-TAX PRE-PROVISION ADJUSTED OPERATING EARNINGS |
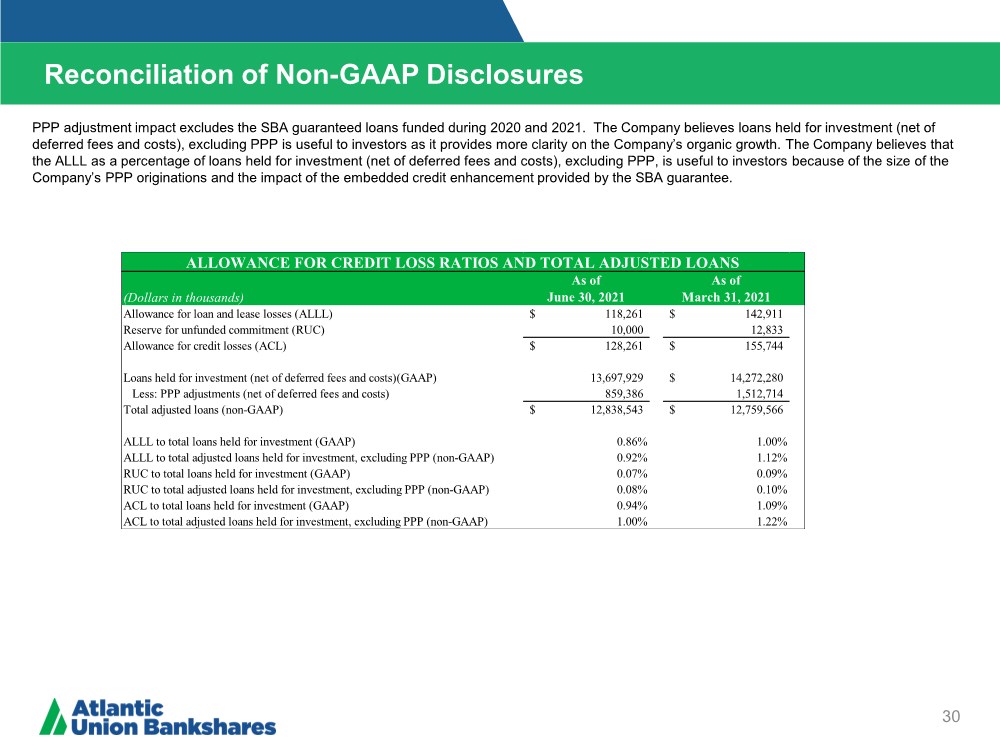
| Reconciliation of Non-GAAP Disclosures 30 Operating Earnings Per Share PPP adjustment impact excludes the SBA guaranteed loans funded during 2020 and 2021. The Company believes loans held for investment (net of deferred fees and costs), excluding PPP is useful to investors as it provides more clarity on the Company’s organic growth. The Company believes that the ALLL as a percentage of loans held for investment (net of deferred fees and costs), excluding PPP, is useful to investors because of the size of the Company’s PPP originations and the impact of the embedded credit enhancement provided by the SBA guarantee. (Dollars in thousands) As of June 30, 2021 As of March 31, 2021 Allowance for loan and lease losses (ALLL) 118,261 $ 142,911 $ Reserve for unfunded commitment (RUC) 10,000 12,833 Allowance for credit losses (ACL) 128,261 $ 155,744 $ Loans held for investment (net of deferred fees and costs)(GAAP) 13,697,929 14,272,280 $ Less: PPP adjustments (net of deferred fees and costs) 859,386 1,512,714 Total adjusted loans (non-GAAP) 12,838,543 $ 12,759,566 $ ALLL to total loans held for investment (GAAP) 0.86% 1.00% ALLL to total adjusted loans held for investment, excluding PPP (non-GAAP) 0.92% 1.12% RUC to total loans held for investment (GAAP) 0.07% 0.09% RUC to total adjusted loans held for investment, excluding PPP (non-GAAP) 0.08% 0.10% ACL to total loans held for investment (GAAP) 0.94% 1.09% ACL to total adjusted loans held for investment, excluding PPP (non-GAAP) 1.00% 1.22% ALLOWANCE FOR CREDIT LOSS RATIOS AND TOTAL ADJUSTED LOANS |
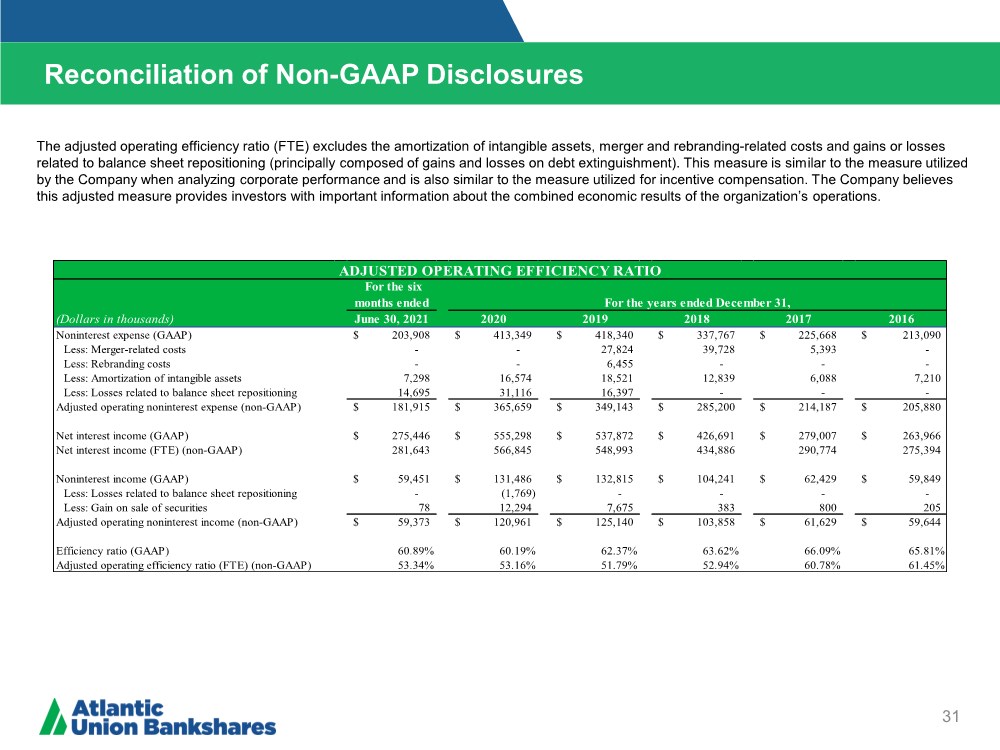
| Reconciliation of Non-GAAP Disclosures 31 Operating Earnings Per Share The adjusted operating efficiency ratio (FTE) excludes the amortization of intangible assets, merger and rebranding-related costs and gains or losses related to balance sheet repositioning (principally composed of gains and losses on debt extinguishment). This measure is similar to the measure utilized by the Company when analyzing corporate performance and is also similar to the measure utilized for incentive compensation. The Company believes this adjusted measure provides investors with important information about the combined economic results of the organization’s operations. For the six months ended (Dollars in thousands) June 30, 2021 2020 2019 2018 2017 2016 Noninterest expense (GAAP) 203,908 $ 413,349 $ 418,340 $ 337,767 $ 225,668 $ 213,090 $ Less: Merger-related costs - - 27,824 39,728 5,393 - Less: Rebranding costs - - 6,455 - - - Less: Amortization of intangible assets 7,298 16,574 18,521 12,839 6,088 7,210 Less: Losses related to balance sheet repositioning 14,695 31,116 16,397 - - - Adjusted operating noninterest expense (non-GAAP) 181,915 $ 365,659 $ 349,143 $ 285,200 $ 214,187 $ 205,880 $ Net interest income (GAAP) 275,446 $ 555,298 $ 537,872 $ 426,691 $ 279,007 $ 263,966 $ Net interest income (FTE) (non-GAAP) 281,643 566,845 548,993 434,886 290,774 275,394 Noninterest income (GAAP) 59,451 $ 131,486 $ 132,815 $ 104,241 $ 62,429 $ 59,849 $ Less: Losses related to balance sheet repositioning - (1,769) - - - - Less: Gain on sale of securities 78 12,294 7,675 383 800 205 Adjusted operating noninterest income (non-GAAP) 59,373 $ 120,961 $ 125,140 $ 103,858 $ 61,629 $ 59,644 $ Efficiency ratio (GAAP) 60.89% 60.19% 62.37% 63.62% 66.09% 65.81% Adjusted operating efficiency ratio (FTE) (non-GAAP) 53.34% 53.16% 51.79% 52.94% 60.78% 61.45% ADJUSTED OPERATING EFFICIENCY RATIO For the years ended December 31, |
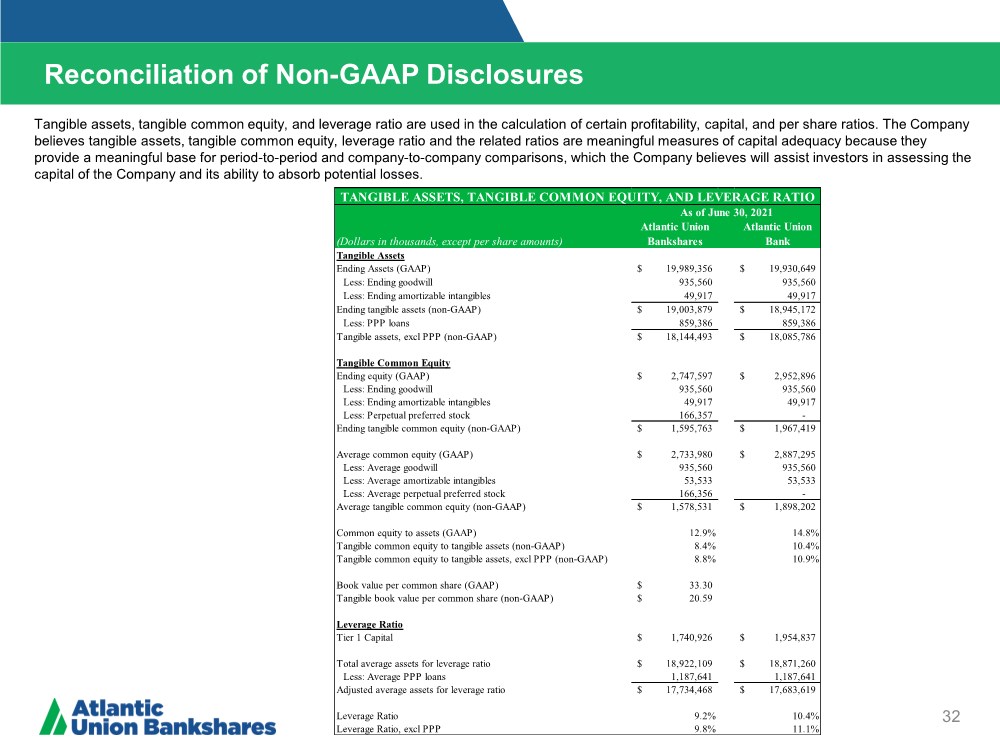
| Reconciliation of Non-GAAP Disclosures 32 Tangible assets, tangible common equity, and leverage ratio are used in the calculation of certain profitability, capital, and per share ratios. The Company believes tangible assets, tangible common equity, leverage ratio and the related ratios are meaningful measures of capital adequacy because they provide a meaningful base for period-to-period and company-to-company comparisons, which the Company believes will assist investors in assessing the capital of the Company and its ability to absorb potential losses. (Dollars in thousands, except per share amounts) Atlantic Union Bankshares Atlantic Union Bank Tangible Assets Ending Assets (GAAP) 19,989,356 $ 19,930,649 $ Less: Ending goodwill 935,560 935,560 Less: Ending amortizable intangibles 49,917 49,917 Ending tangible assets (non-GAAP) 19,003,879 $ 18,945,172 $ Less: PPP loans 859,386 859,386 Tangible assets, excl PPP (non-GAAP) 18,144,493 $ 18,085,786 $ Tangible Common Equity Ending equity (GAAP) 2,747,597 $ 2,952,896 $ Less: Ending goodwill 935,560 935,560 Less: Ending amortizable intangibles 49,917 49,917 Less: Perpetual preferred stock 166,357 - Ending tangible common equity (non-GAAP) 1,595,763 $ 1,967,419 $ Average common equity (GAAP) 2,733,980 $ 2,887,295 $ Less: Average goodwill 935,560 935,560 Less: Average amortizable intangibles 53,533 53,533 Less: Average perpetual preferred stock 166,356 - Average tangible common equity (non-GAAP) 1,578,531 $ 1,898,202 $ Common equity to assets (GAAP) 12.9% 14.8% Tangible common equity to tangible assets (non-GAAP) 8.4% 10.4% Tangible common equity to tangible assets, excl PPP (non-GAAP) 8.8% 10.9% Book value per common share (GAAP) 33.30 $ Tangible book value per common share (non-GAAP) 20.59 $ Leverage Ratio Tier 1 Capital 1,740,926 $ 1,954,837 $ Total average assets for leverage ratio 18,922,109 $ 18,871,260 $ Less: Average PPP loans 1,187,641 1,187,641 Adjusted average assets for leverage ratio 17,734,468 $ 17,683,619 $ Leverage Ratio 9.2% 10.4% Leverage Ratio, excl PPP 9.8% 11.1% TANGIBLE ASSETS, TANGIBLE COMMON EQUITY, AND LEVERAGE RATIO As of June 30, 2021 |
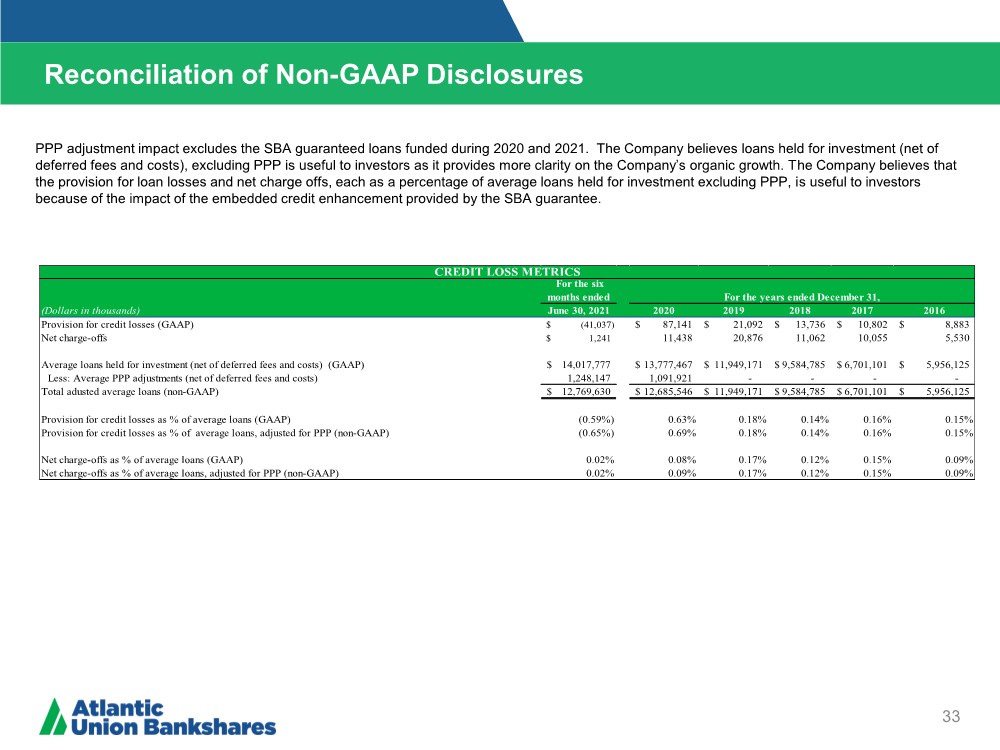
| Reconciliation of Non-GAAP Disclosures 33 ($ IN THOUSANDS) Operating Earnings Per Share PPP adjustment impact excludes the SBA guaranteed loans funded during 2020 and 2021. The Company believes loans held for investment (net of deferred fees and costs), excluding PPP is useful to investors as it provides more clarity on the Company’s organic growth. The Company believes that the provision for loan losses and net charge offs, each as a percentage of average loans held for investment excluding PPP, is useful to investors because of the impact of the embedded credit enhancement provided by the SBA guarantee. For the six months ended (Dollars in thousands) June 30, 2021 2020 2019 2018 2017 2016 Provision for credit losses (GAAP) (41,037) $ 87,141 $ 21,092 $ 13,736 $ 10,802 $ 8,883 $ Net charge-offs 1,241 $ 11,438 20,876 11,062 10,055 5,530 Average loans held for investment (net of deferred fees and costs) (GAAP) 14,017,777 $ 13,777,467 $ 11,949,171 $ 9,584,785 $ 6,701,101 $ 5,956,125 $ Less: Average PPP adjustments (net of deferred fees and costs) 1,248,147 1,091,921 - - - - Total adusted average loans (non-GAAP) 12,769,630 $ 12,685,546 $ 11,949,171 $ 9,584,785 $ 6,701,101 $ 5,956,125 $ Provision for credit losses as % of average loans (GAAP) (0.59%) 0.63% 0.18% 0.14% 0.16% 0.15% Provision for credit losses as % of average loans, adjusted for PPP (non-GAAP) (0.65%) 0.69% 0.18% 0.14% 0.16% 0.15% Net charge-offs as % of average loans (GAAP) 0.02% 0.08% 0.17% 0.12% 0.15% 0.09% Net charge-offs as % of average loans, adjusted for PPP (non-GAAP) 0.02% 0.09% 0.17% 0.12% 0.15% 0.09% For the years ended December 31, CREDIT LOSS METRICS |