| 2021 Annual Shareholders Meeting Nasdaq: AUB May 4, 2021 |

| Forward Looking Statements 2 Certain statements in this presentation may constitute “forward-looking statements” within the meaning of the Private Securities Litigation Reform Act of 1995. Forward-looking statements are statements that include projections, predictions, expectations, or beliefs about future events or results that are not statements of historical fact. Such forward-looking statements are based on various assumptions as of the time they are made, and are inherently subject to known and unknown risks, uncertainties, and other factors, some of which cannot be predicted or quantified, that may cause actual results, performance, or achievements to be materially different from those expressed or implied by such forward-looking statements. Forward-looking statements are often accompanied by words that convey projected future events or outcomes such as “expect,” “believe,” “estimate,” “plan,” “project,” “anticipate,” “intend,” “will,” “may,” “view,” “opportunity,” “potential,” or words of similar meaning or other statements concerning opinions or judgment of Atlantic Union Bankshares Corporation (“Atlantic Union” or the “Company”) and its management about future events. Although the Company believes that its expectations with respect to forward-looking statements are based upon reasonable assumptions within the bounds of its existing knowledge of its business and operations, there can be no assurance that actual results, performance, or achievements of, or trends affecting, the Company will not differ materially from any projected future results, performance, or achievements expressed or implied by such forward-looking statements. Actual future results, performance, achievements or trends may differ materially from historical results or those anticipated depending on a variety of factors, including, but not limited to the effects of or changes in: • changes in interest rates; • general economic and financial market conditions, in the United States generally and particularly in the markets in which the Company operates and which its loans are concentrated, including the effects of declines in real estate values, an increase in unemployment levels and slowdowns in economic growth, including as a result of COVID-19; • the quality or composition of the loan or investment portfolios and changes therein; • demand for loan products and financial services in the Company’s market area; • the Company’s ability to manage its growth or implement its growth strategy; • the effectiveness of expense reduction plans; • the introduction of new lines of business or new products and services; • the Company’s ability to recruit and retain key employees; • the incremental cost and/or decreased revenues associated with exceeding $10 billion in assets; • real estate values in the Bank’s lending area; • an insufficient ACL; • changes in accounting principles; • the Company’s liquidity and capital positions; • concentrations of loans secured by real estate, particularly commercial real estate; • the effectiveness of the Company’s credit processes and management of the Company’s credit risk; • the Company’s ability to compete in the market for financial services and increased competition relating from fintech companies; • technological risks and developments, and cyber threats, attacks, or events; • the potential adverse effects of unusual and infrequently occurring events, such as weather- related disasters, terrorist acts or public health events (such as COVID-19), and of governmental and societal responses thereto; these potential adverse effects may include, without limitation, adverse effects on the ability of the Company's borrowers to satisfy their obligations to the Company, on the value of collateral securing loans, on the demand for the Company's loans or its other products and services, on incidents of cyberattack and fraud, on the Company’s liquidity or capital positions, on risks posed by reliance on third-party service providers, on other aspects of the Company's business operations and on financial markets and economic growth; • the effect of steps the Company takes in response to COVID-19, the severity and duration of the pandemic, the uncertainty regarding new variants of COVID-19 that have emerged, the speed and efficacy of vaccine and treatment developments, the impact of loosening or tightening of government restrictions, the pace of recovery when the pandemic subsides and the heightened impact it has on many of the risks described herein; • the discontinuation of LIBOR and its impact on the financial markets, and the Company’s ability to manage operational, legal and compliance risks related to the discontinuation of LIBOR and implementation of one or more alternate reference rates; • performance by the Company’s counterparties or vendors; • deposit flows; • the availability of financing and the terms thereof; • the level of prepayments on loans and mortgage-backed securities; • legislative or regulatory changes and requirements, including the impact of the CARES Act, as amended by the CAA, and other legislative and regulatory reactions to COVID-19; • potential claims, damages, and fines related to litigation or government actions, including litigation or actions arising from the Company’s participation in and administration of programs related to COVID-19, including, among other things, the CARES Act, as amended by the CAA; • the effects of changes in federal, state or local tax laws and regulations; • monetary and fiscal policies of the U.S. government, including policies of the U.S. Department of the Treasury and the Federal Reserve; • changes to applicable accounting principles and guidelines; and • other factors, many of which are beyond the control of the Company. Please refer to the “Risk Factors” and “Management’s Discussion and Analysis of Financial Condition and Results of Operations” sections of the Company’s Annual Report on Form 10-K for the year ended December 31, 2020 and comparable “Risk Factors” sections of the Company’s Quarterly Reports on Form 10-Q and related disclosures in other filings, which have been filed with the SEC and are available on the SEC’s website at www.sec.gov. All of the forward-looking statements made in this press release are expressly qualified by the cautionary statements contained or referred to herein. The actual results or developments anticipated may not be realized or, even if substantially realized, they may not have the expected consequences to or effects on the Company or its businesses or operations. Readers are cautioned not to rely too heavily on the forward-looking statements contained in this presentation. Forward-looking statements speak only as of the date they are made and the Company does not undertake any obligation to update, revise or clarify these forward-looking statements, whether as a result of new information, future events or otherwise. |
| Additional Information 3 Non-GAAP Financial Measures This presentation contains certain financial information determined by methods other than in accordance with generally accepted accounting principles in the United States (“GAAP”). These non-GAAP disclosures have limitations as analytical tools and should not be considered in isolation or as a substitute for analysis of our results as reported under GAAP, nor are they necessarily comparable to non-GAAP performance measures that may be presented by other companies. The Company uses the non-GAAP financial measures discussed herein in its analysis of the Company’s performance. The Company’s management believes that these non-GAAP financial measures provide additional understanding of ongoing operations, enhance comparability of results of operations with prior periods and show the effects of significant gains and charges in the periods presented without the impact of items or events that may obscure trends in the Company’s underlying performance. Please see “Reconciliation of Non-GAAP Disclosures” at the end of this presentation for a reconciliation to the nearest GAAP financial measure. No Offer or Solicitation This presentation does not constitute an offer to sell or a solicitation of an offer to buy any securities. No offer of securities shall be made except by means of a prospectus meeting the requirements of the Securities Act of 1933, as amended, and no offer to sell or solicitation of an offer to buy shall be made in any jurisdiction in which such offer, solicitation or sale would be unlawful. About Atlantic Union Bankshares Corporation Headquartered in Richmond, Virginia, Atlantic Union Bankshares Corporation (Nasdaq: AUB) is the holding company for Atlantic Union Bank. Atlantic Union Bank has 129 branches and approximately 150 ATMs located throughout Virginia, and in portions of Maryland and North Carolina. Atlantic Union Bank Wealth Management is a brand name used by Atlantic Union Bank and certain affiliates when providing trust, wealth management, private banking, and investment advisory products and services. Certain non-bank affiliates of Atlantic Union Bank include: Old Dominion Capital Management, Inc., and its subsidiary, Outfitter Advisors, Ltd., and Dixon, Hubard, Feinour, & Brown, Inc., which provide investment advisory services; Atlantic Union Financial Consultants, LLC, which provides brokerage services; and Union Insurance Group, LLC, which offers various lines of insurance products. |
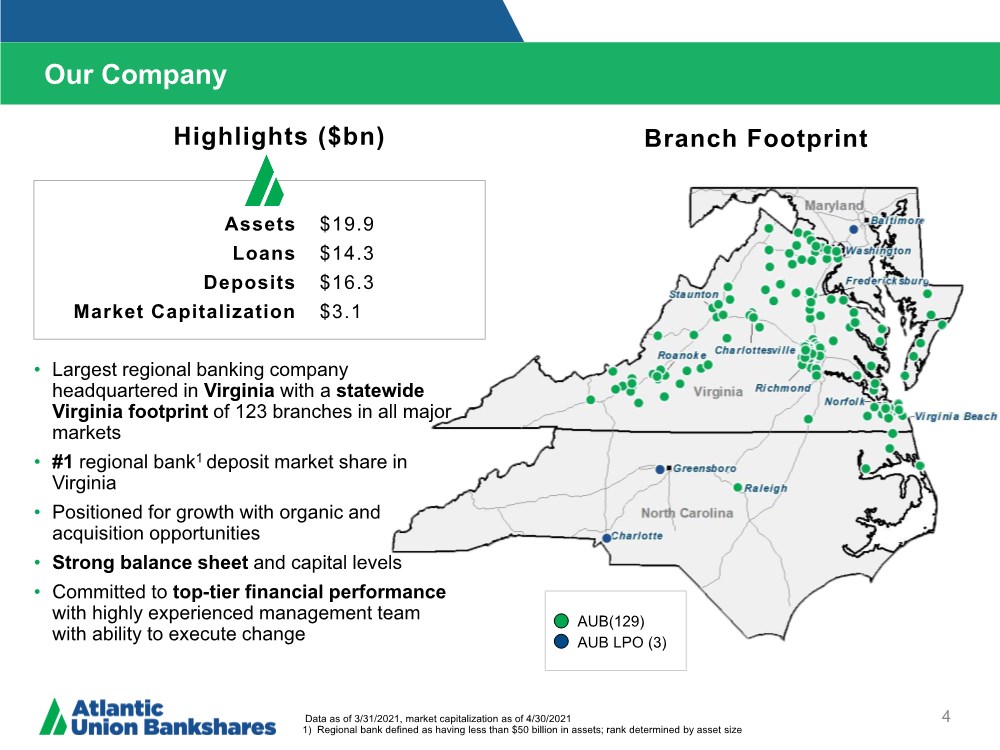
| Our Company 4 Branch Footprint Data as of 3/31/2021, market capitalization as of 4/30/2021 1) Regional bank defined as having less than $50 billion in assets; rank determined by asset size Assets Loans Deposits Market Capitalization $19.9 $14.3 $16.3 $3.1 • Largest regional banking company headquartered in Virginia with a statewide Virginia footprint of 123 branches in all major markets •#1 regional bank1 deposit market share in Virginia • Positioned for growth with organic and acquisition opportunities • Strong balance sheet and capital levels • Committed to top-tier financial performance with highly experienced management team with ability to execute change Highlights ($bn) AUB(129) AUB LPO (3) |
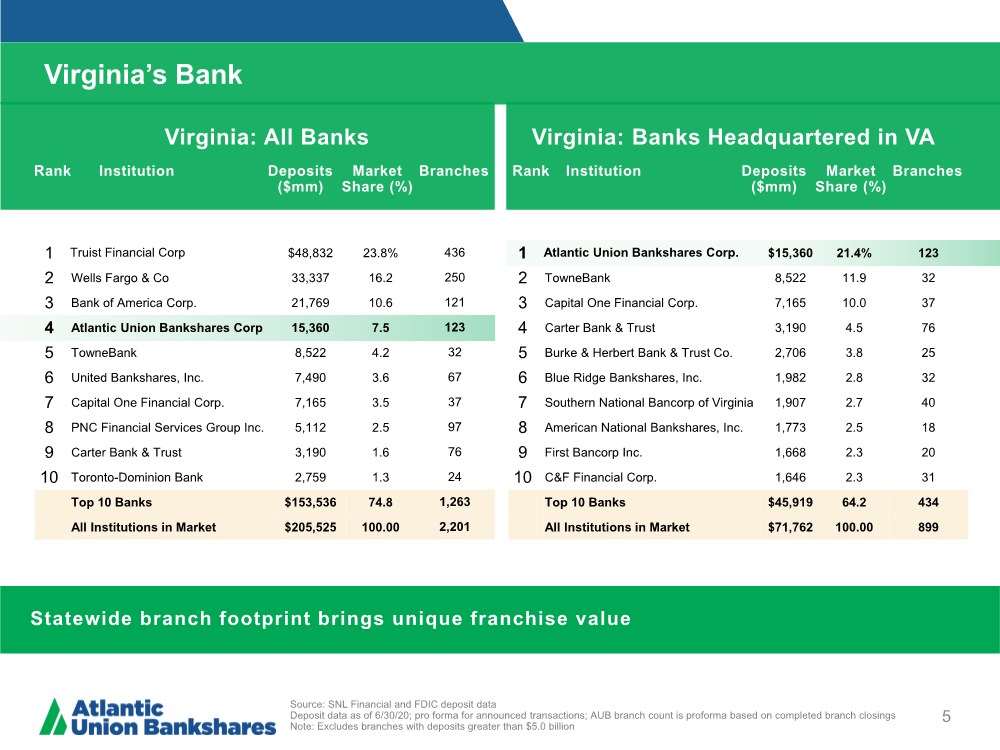
| Virginia’s Bank 5 Virginia: All Banks Virginia: Banks Headquartered in VA Rank Institution Deposits ($mm) Market Share (%) Branches 1 Truist Financial Corp $48,832 23.8% 436 2 Wells Fargo & Co 33,337 16.2 250 3 Bank of America Corp. 21,769 10.6 121 4 Atlantic Union Bankshares Corp 15,360 7.5 123 5 TowneBank 8,522 4.2 32 6 United Bankshares, Inc. 7,490 3.6 67 7 Capital One Financial Corp. 7,165 3.5 37 8 PNC Financial Services Group Inc. 5,112 2.5 97 9 Carter Bank & Trust 3,190 1.6 76 10 Toronto-Dominion Bank 2,759 1.3 24 Top 10 Banks $153,536 74.8 1,263 All Institutions in Market $205,525 100.00 2,201 Rank Institution Deposits ($mm) Market Share (%) Branches 1 Atlantic Union Bankshares Corp. $15,360 21.4% 123 2 TowneBank 8,522 11.9 32 3 Capital One Financial Corp. 7,165 10.0 37 4 Carter Bank & Trust 3,190 4.5 76 5 Burke & Herbert Bank & Trust Co. 2,706 3.8 25 6 Blue Ridge Bankshares, Inc. 1,982 2.8 32 7 Southern National Bancorp of Virginia 1,907 2.7 40 8 American National Bankshares, Inc. 1,773 2.5 18 9 First Bancorp Inc. 1,668 2.3 20 10 C&F Financial Corp. 1,646 2.3 31 Top 10 Banks $45,919 64.2 434 All Institutions in Market $71,762 100.00 899 Source: SNL Financial and FDIC deposit data Deposit data as of 6/30/20; pro forma for announced transactions; AUB branch count is proforma based on completed branch closings Note: Excludes branches with deposits greater than $5.0 billion Statewide branch footprint brings unique franchise value |
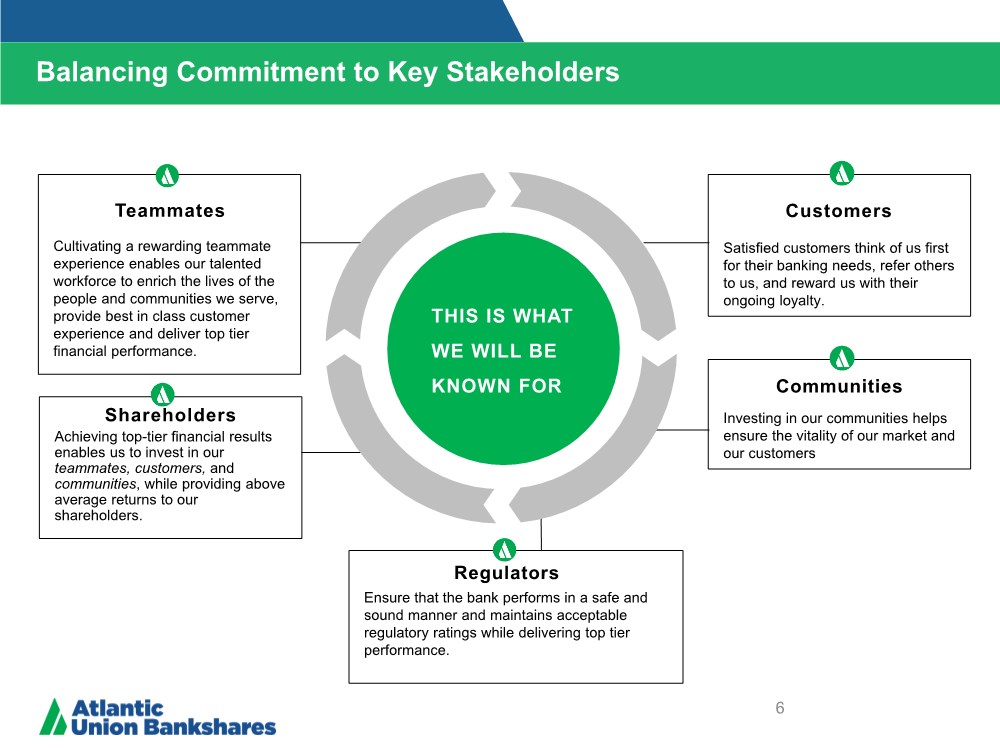
| Cultivating a rewarding teammate experience enables our talented workforce to enrich the lives of the people and communities we serve, provide best in class customer experience and deliver top tier financial performance. Balancing Commitment to Key Stakeholders Teammates Customers Shareholders Communities COMMERCIAL RETAIL WEALTH Satisfied customers think of us first for their banking needs, refer others to us, and reward us with their ongoing loyalty. Investing in our communities helps ensure the vitality of our market and our customers Achieving top-tier financial results enables us to invest in our teammates, customers, and communities, while providing above average returns to our shareholders. THIS IS WHAT WE WILL BE KNOWN FOR Ensure that the bank performs in a safe and sound manner and maintains acceptable regulatory ratings while delivering top tier performance. Regulators 6 |
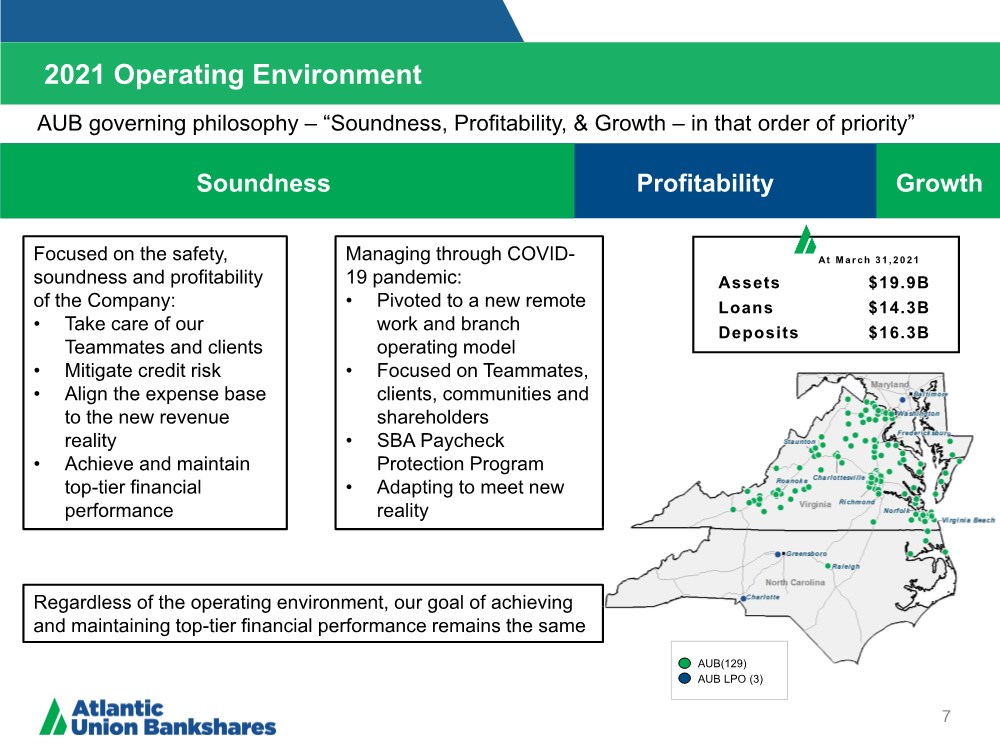
| 2021 Operating Environment 7 Soundness Profitability Growth At March 31,2021 Assets $19.9B Loans $14.3B Deposits $16.3B Managing through COVID- 19 pandemic: • Pivoted to a new remote work and branch operating model • Focused on Teammates, clients, communities and shareholders • SBA Paycheck Protection Program • Adapting to meet new reality AUB governing philosophy –“Soundness, Profitability, & Growth – in that order of priority” Focused on the safety, soundness and profitability of the Company: • Take care of our Teammates and clients • Mitigate credit risk • Align the expense base to the new revenue reality • Achieve and maintain top-tier financial performance Regardless of the operating environment, our goal of achieving and maintaining top-tier financial performance remains the same AUB(129) AUB LPO (3) |
| 2021 Operating Environment – Managing through the Pandemic 8 Soundness Profitability Growth During challenging times, it is important to remember our governing philosophy –“Soundness, Profitability, & Growth – in that order of priority” This core philosophy is serving us well as we manage the Company through the current coronavirus pandemic crisis. We continue to effectively manage through the pandemic with an intense focus on: Taking care of our Teammates and clients – they will remember how we treated them during this period. Mitigating credit risk – batten down the hatches and protect the Bank by working with our business and consumer clients to assist them through these tough times. Aligning the expense base to the lower for longer interest rate environment – ensure sustained top tier financial performance on the other side. We believe that by effectively managing through this crisis, we have become a stronger, more agile company that is well positioned to take advantage of growth opportunities as economic activity normalizes. |
| 3 2 1 4 5 6 Diversify Loan Portfolio and Revenue Streams Increase commercial lending growth to better balance the total loan portfolio and grow fee-based products and services. Grow Core Funding Grow core deposits with particular focus on transaction accounts and maintain 95% loan to deposit ratio. Manage to Higher Levels of Performance Achieve and sustain top-tier financial performance while investing in top talent and elevating the Teammate experience. Strengthen Digital Capabilities Modernize customer experience with more digital capabilities and enhance features for wider usage and resolve top client requests. Make Banking Easier Create compelling products and services while delivering high- tech and high-touch experiences. Capitalize on Strategic Opportunities Seize on market disruption opportunities and leverage commercial expertise for new market opportunities. Environmental Social and Governance Increasing transparency with enhanced disclosures. We remain focused on our key objectives 7 9 |
| Review of 2020 and 2021 Outlook |

| 2020 was a year of expedited transformation. This environment became a catalyst for exceptional bank-wide teamwork, tighter prioritizing, faster transformation and innovation. Each business area stepped up to meet demand and help our clients in new ways, while accomplishing our planned initiatives. Established measurement systems to support data-driven decision making across the enterprise, improving accuracy and responsiveness. Our efforts are paying off: delivered strong customer satisfaction scores, achieved key competitive wins, improved brand awareness, while business lines were able to meet or exceed financial plan. 2020 Highlights 11 |
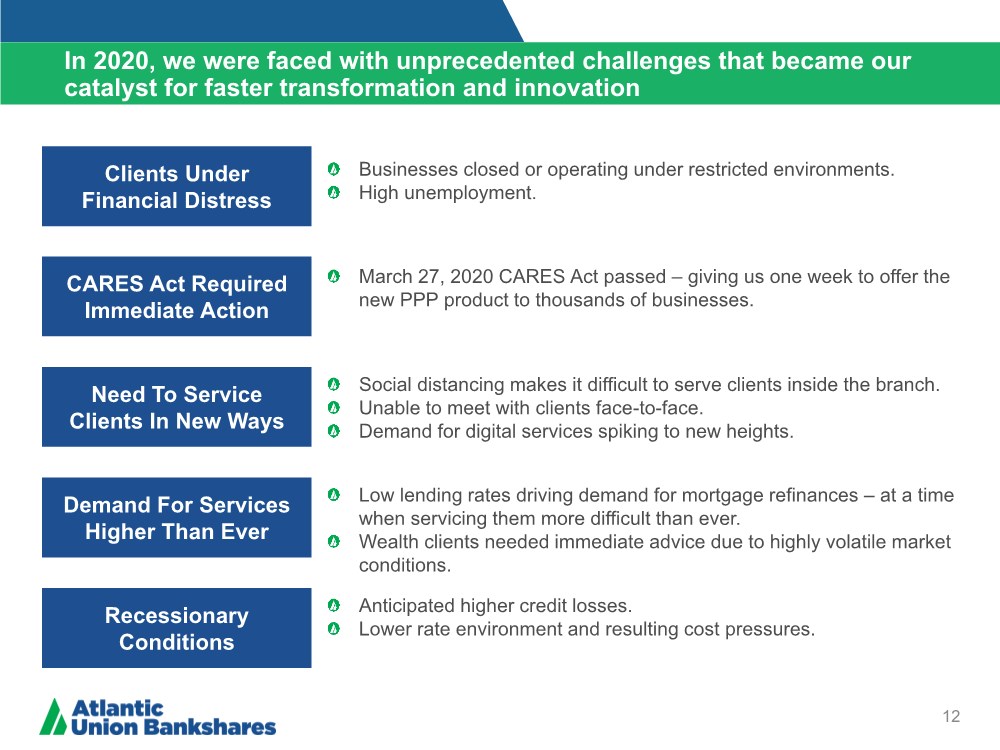
| In 2020, we were faced with unprecedented challenges that became our catalyst for faster transformation and innovation Clients Under Financial Distress CARES Act Required Immediate Action Need To Service Clients In New Ways Demand For Services Higher Than Ever Businesses closed or operating under restricted environments. High unemployment. March 27, 2020 CARES Act passed – giving us one week to offer the new PPP product to thousands of businesses. Social distancing makes it difficult to serve clients inside the branch. Unable to meet with clients face-to-face. Demand for digital services spiking to new heights. Low lending rates driving demand for mortgage refinances – at a time when servicing them more difficult than ever. Wealth clients needed immediate advice due to highly volatile market conditions. Recessionary Conditions Anticipated higher credit losses. Lower rate environment and resulting cost pressures. 12 |
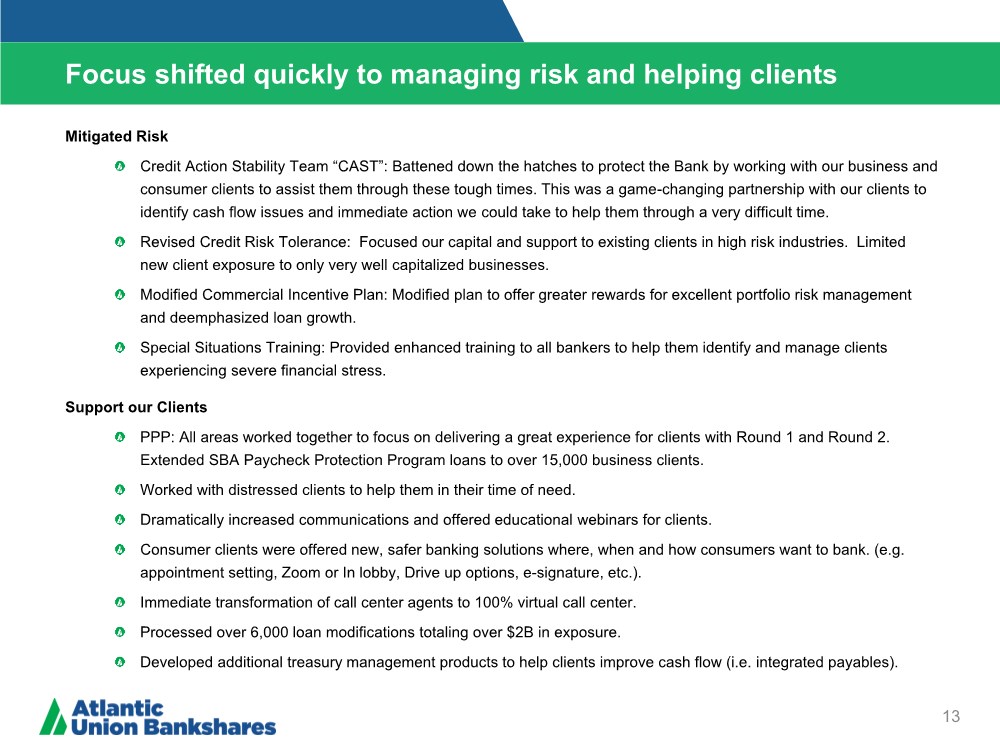
| Mitigated Risk Credit Action Stability Team “CAST”: Battened down the hatches to protect the Bank by working with our business and consumer clients to assist them through these tough times. This was a game-changing partnership with our clients to identify cash flow issues and immediate action we could take to help them through a very difficult time. Revised Credit Risk Tolerance: Focused our capital and support to existing clients in high risk industries. Limited new client exposure to only very well capitalized businesses. Modified Commercial Incentive Plan: Modified plan to offer greater rewards for excellent portfolio risk management and deemphasized loan growth. Special Situations Training: Provided enhanced training to all bankers to help them identify and manage clients experiencing severe financial stress. Support our Clients PPP: All areas worked together to focus on delivering a great experience for clients with Round 1 and Round 2. Extended SBA Paycheck Protection Program loans to over 15,000 business clients. Worked with distressed clients to help them in their time of need. Dramatically increased communications and offered educational webinars for clients. Consumer clients were offered new, safer banking solutions where, when and how consumers want to bank. (e.g. appointment setting, Zoom or In lobby, Drive up options, e-signature, etc.). Immediate transformation of call center agents to 100% virtual call center. Processed over 6,000 loan modifications totaling over $2B in exposure. Developed additional treasury management products to help clients improve cash flow (i.e. integrated payables). Focus shifted quickly to managing risk and helping clients 13 |
| Aligned the expense base to the new revenue reality: Took action to reduce expenses including closing 20 branches or 13% of the network and reduced expenses across the business lines. Enhanced The Client/Teammate Digital Experience: An agile quarterly release delivery schedule allows for quicker improvements to client experiences with relevant enhanced self service capabilities, such as debit card controls, credit score monitoring and virtual zoom appointments. Investments made in digital platforms improved the digital sales experiences for Mortgage, Deposits and Commercial Loan Clients, while servicing improvements to Wealth Technology and Treasury Management have resulted in an empowered and engaged teammate experience. Optimized Marketing: Developed new capabilities and greater emphasis on online customer sales to close the gap due to reduced branch traffic and closures. Expanded Product Lines/Services and Talent: Strategic hiring in Commercial and Business Banking as well as the Wealth Institutional Group. Commercial clients have new and improved treasury management products. Continued expansion of the Equipment Finance division. Launch of Solutions Banking which is gaining traction and generating new accounts. Rapid incorporation of Zoom and DocuSign for account opening and servicing. Launched Transition Checking for consumers facing financial challenges limiting access to banking services (Over 600 clients now have a checking account who otherwise would not have had access to the banking system). Capitalized on Market Opportunities: Implemented a local market playbook to capitalize on marketplace disruption by competitors closing branches. Leveraged PPP success by building client relationships and expanding existing ones. The businesses continued to execute on planned initiatives to improve efficiencies and enable organic growth 14 |
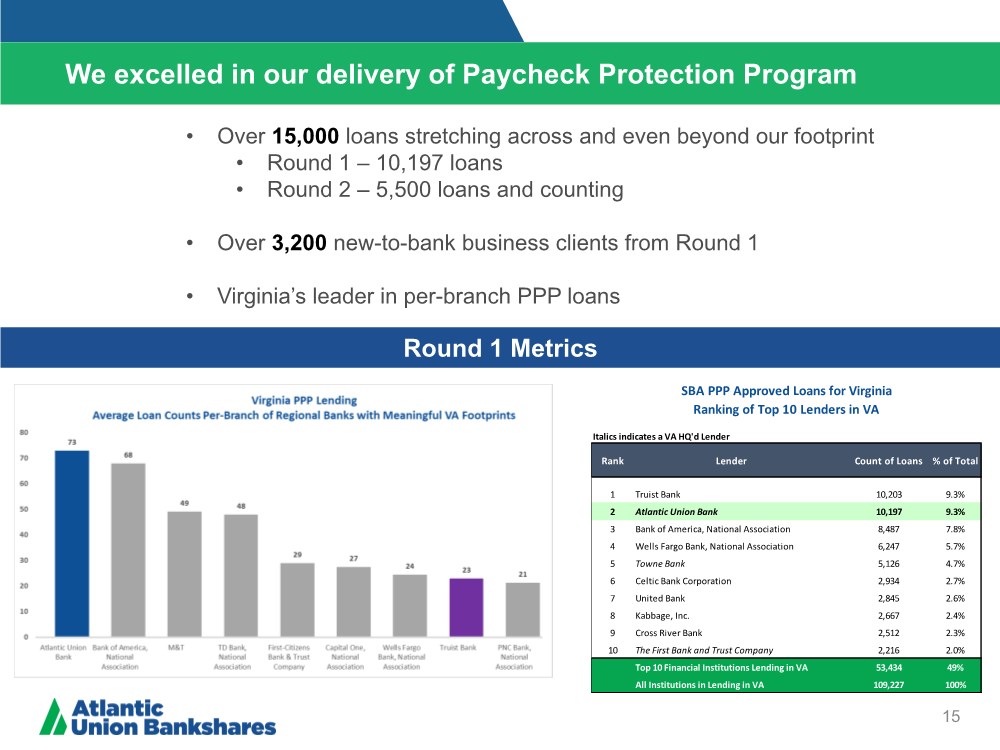
| We excelled in our delivery of Paycheck Protection Program 15 Italics indicates a VA HQ'd Lender Rank Lender Count of Loans % of Total 1 Truist Bank 10,203 9.3% 2 Atlantic Union Bank 10,197 9.3% 3 Bank of America, National Association 8,487 7.8% 4 Wells Fargo Bank, National Association 6,247 5.7% 5 Towne Bank 5,126 4.7% 6 Celtic Bank Corporation 2,934 2.7% 7 United Bank 2,845 2.6% 8 Kabbage, Inc. 2,667 2.4% 9 Cross River Bank 2,512 2.3% 10 The First Bank and Trust Company 2,216 2.0% Top 10 Financial Institutions Lending in VA 53,434 49% All Institutions in Lending in VA 109,227 100% SBA PPP Approved Loans for Virginia Ranking of Top 10 Lenders in VA • Over 15,000 loans stretching across and even beyond our footprint • Round 1 – 10,197 loans • Round 2 – 5,500 loans and counting • Over 3,200 new-to-bank business clients from Round 1 • Virginia’s leader in per-branch PPP loans Round 1 Metrics |
| Improved frequency of communications. Launched our Diversity, Equity and Inclusion initiative and established DEI Council. Expanded the reach and influence of Women’s Inclusion Network (WIN) learning sessions and virtual panel discussions. Hosted WIN on Racial Equality webinars. Provided half-day off in recognition of Juneteenth. Provided frequent information on health and safety. Supporting our Teammates 16 |

| Efforts are paying off... |

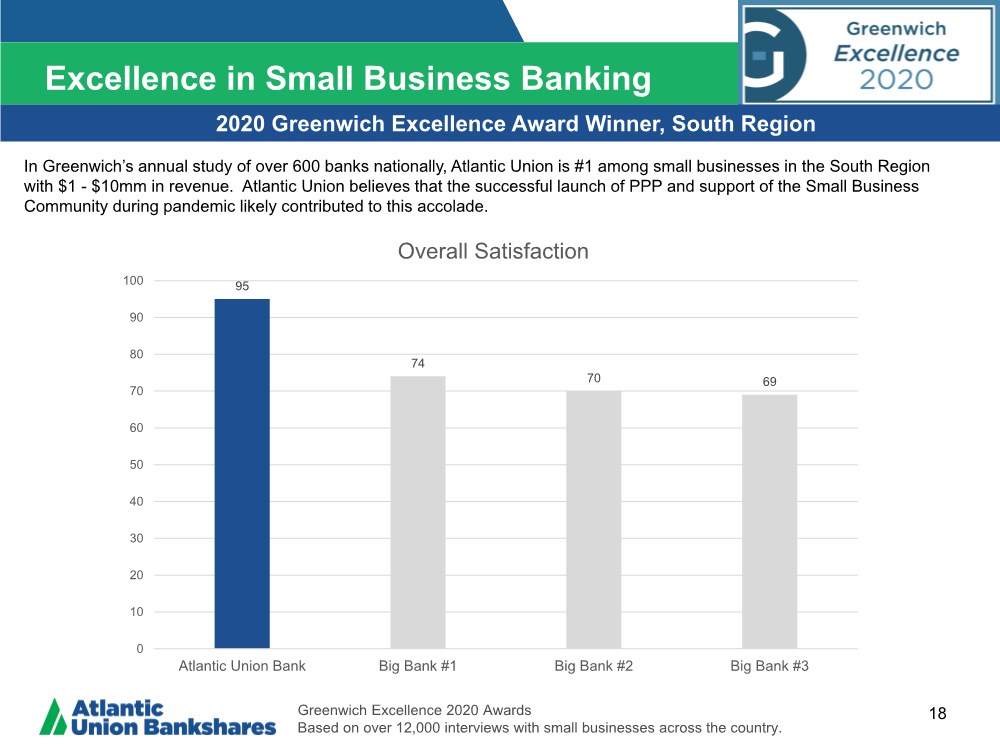
| Excellence in Small Business Banking 18 2020 Greenwich Excellence Award Winner, South Region Greenwich Excellence 2020 Awards Based on over 12,000 interviews with small businesses across the country. 95 74 70 69 0 10 20 30 40 50 60 70 80 90 100 Atlantic Union Bank Big Bank #1 Big Bank #2 Big Bank #3 Overall Satisfaction In Greenwich’s annual study of over 600 banks nationally, Atlantic Union is #1 among small businesses in the South Region with $1 - $10mm in revenue. Atlantic Union believes that the successful launch of PPP and support of the Small Business Community during pandemic likely contributed to this accolade. |
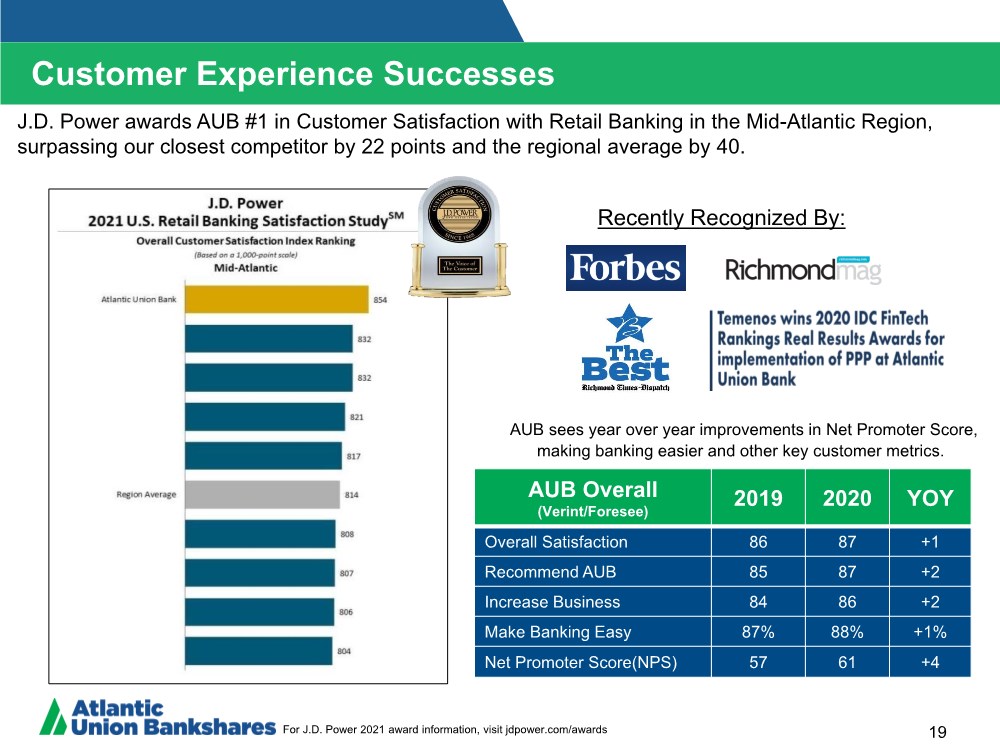
| Customer Experience Successes 19 AUB Overall (Verint/Foresee) 2019 2020 YOY Overall Satisfaction 86 87 +1 Recommend AUB 85 87 +2 Increase Business 84 86 +2 Make Banking Easy 87% 88% +1% Net Promoter Score(NPS) 57 61 +4 J.D. Power awards AUB #1 in Customer Satisfaction with Retail Banking in the Mid-Atlantic Region, surpassing our closest competitor by 22 points and the regional average by 40. AUB sees year over year improvements in Net Promoter Score, making banking easier and other key customer metrics. Recently Recognized By: For J.D. Power 2021 award information, visit jdpower.com/awards |
| 20 Continue to execute against our strategic plan. Focusing on credit discipline, continued growth, product expansion and relationship banking model. Develop more segmented approaches for each of our target audiences, including Mass Market, Mass Affluent, Affluent and Small Business. Double-down on our efforts in Business Banking, capitalizing on our success with PPP lending. Execute the existing Wealth strategy by introducing a new Wealth Management brand aligned to maximize the bank’s franchise and rolling out a unique High Income offering for qualified investors. Continuing the successful Home Loans playbook and build a digital end to end experience. Build on our digital capabilities to further drive client satisfaction and eliminate friction in our sales processes. Increase brand awareness, supporting and aligning to business agendas, driving digital acquisition and supporting segmentation approach while taking advantage of marketing opportunities created by our competitors. More to come in 2021 |
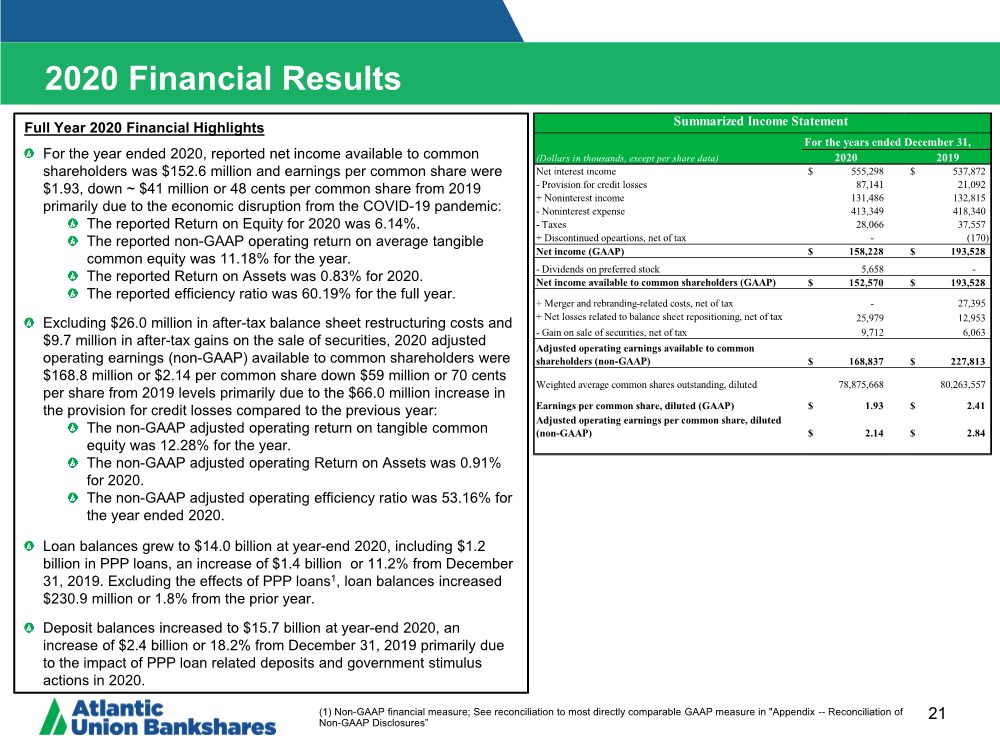
| 2020 Financial Results 21 Full Year 2020 Financial Highlights For the year ended 2020, reported net income available to common shareholders was $152.6 million and earnings per common share were $1.93, down ~ $41 million or 48 cents per common share from 2019 primarily due to the economic disruption from the COVID-19 pandemic: The reported Return on Equity for 2020 was 6.14%. The reported non-GAAP operating return on average tangible common equity was 11.18% for the year. The reported Return on Assets was 0.83% for 2020. The reported efficiency ratio was 60.19% for the full year. Excluding $26.0 million in after-tax balance sheet restructuring costs and $9.7 million in after-tax gains on the sale of securities, 2020 adjusted operating earnings (non-GAAP) available to common shareholders were $168.8 million or $2.14 per common share down $59 million or 70 cents per share from 2019 levels primarily due to the $66.0 million increase in the provision for credit losses compared to the previous year: The non-GAAP adjusted operating return on tangible common equity was 12.28% for the year. The non-GAAP adjusted operating Return on Assets was 0.91% for 2020. The non-GAAP adjusted operating efficiency ratio was 53.16% for the year ended 2020. Loan balances grew to $14.0 billion at year-end 2020, including $1.2 billion in PPP loans, an increase of $1.4 billion or 11.2% from December 31, 2019. Excluding the effects of PPP loans1, loan balances increased $230.9 million or 1.8% from the prior year. Deposit balances increased to $15.7 billion at year-end 2020, an increase of $2.4 billion or 18.2% from December 31, 2019 primarily due to the impact of PPP loan related deposits and government stimulus actions in 2020. (1) Non-GAAP financial measure; See reconciliation to most directly comparable GAAP measure in "Appendix -- Reconciliation of Non-GAAP Disclosures” For the years ended December 31, (Dollars in thousands, except per share data) 2020 2019 Net interest income 555,298 $ 537,872 $ - Provision for credit losses 87,141 21,092 + Noninterest income 131,486 132,815 - Noninterest expense 413,349 418,340 - Taxes 28,066 37,557 + Discontinued opeartions, net of tax - (170) Net income (GAAP) 158,228 $ 193,528 $ - Dividends on preferred stock 5,658 - Net income available to common shareholders (GAAP) 152,570 $ 193,528 $ + Merger and rebranding-related costs, net of tax - 27,395 + Net losses related to balance sheet repositioning, net of tax 25,979 12,953 - Gain on sale of securities, net of tax 9,712 6,063 Adjusted operating earnings available to common shareholders (non-GAAP) 168,837 $ 227,813 $ Weighted average common shares outstanding, diluted 78,875,668 80,263,557 Earnings per common share, diluted (GAAP) 1.93 $ 2.41 $ Adjusted operating earnings per common share, diluted (non-GAAP) 2.14 $ 2.84 $ Summarized Income Statement |
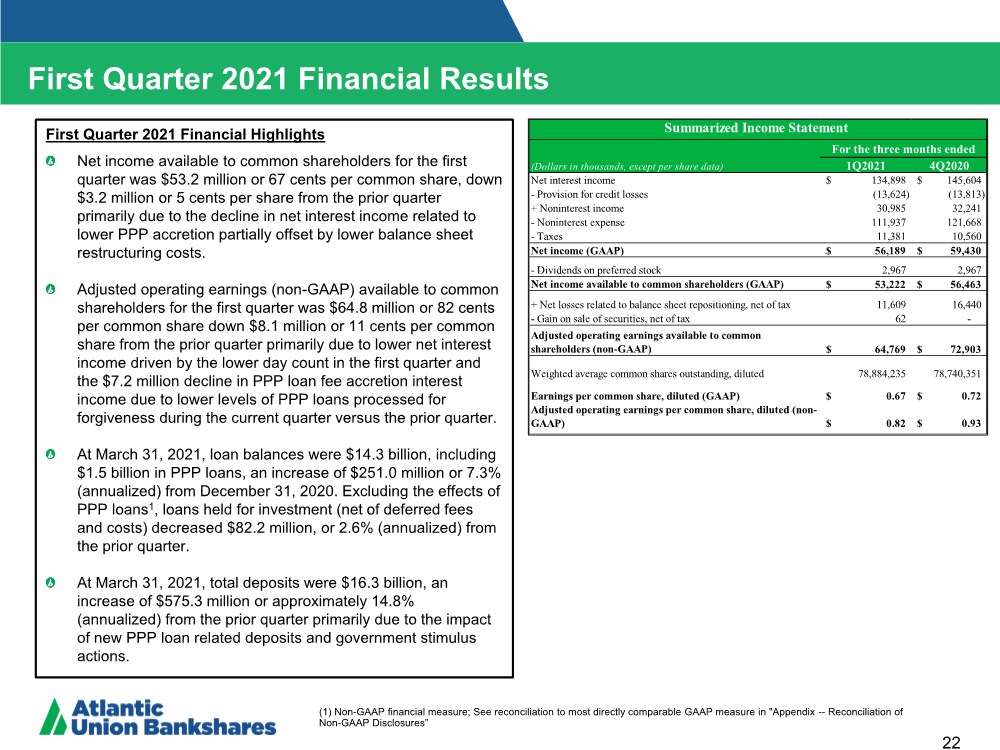
| 22 First Quarter 2021 Financial Highlights Net income available to common shareholders for the first quarter was $53.2 million or 67 cents per common share, down $3.2 million or 5 cents per share from the prior quarter primarily due to the decline in net interest income related to lower PPP accretion partially offset by lower balance sheet restructuring costs. Adjusted operating earnings (non-GAAP) available to common shareholders for the first quarter was $64.8 million or 82 cents per common share down $8.1 million or 11 cents per common share from the prior quarter primarily due to lower net interest income driven by the lower day count in the first quarter and the $7.2 million decline in PPP loan fee accretion interest income due to lower levels of PPP loans processed for forgiveness during the current quarter versus the prior quarter. At March 31, 2021, loan balances were $14.3 billion, including $1.5 billion in PPP loans, an increase of $251.0 million or 7.3% (annualized) from December 31, 2020. Excluding the effects of PPP loans1, loans held for investment (net of deferred fees and costs) decreased $82.2 million, or 2.6% (annualized) from the prior quarter. At March 31, 2021, total deposits were $16.3 billion, an increase of $575.3 million or approximately 14.8% (annualized) from the prior quarter primarily due to the impact of new PPP loan related deposits and government stimulus actions. First Quarter 2021 Financial Results (1) Non-GAAP financial measure; See reconciliation to most directly comparable GAAP measure in "Appendix -- Reconciliation of Non-GAAP Disclosures” (Dollars in thousands, except per share data) 1Q2021 4Q2020 Net interest income 134,898 $ 145,604 $ - Provision for credit losses (13,624) (13,813) + Noninterest income 30,985 32,241 - Noninterest expense 111,937 121,668 - Taxes 11,381 10,560 Net income (GAAP) 56,189 $ 59,430 $ - Dividends on preferred stock 2,967 2,967 Net income available to common shareholders (GAAP) 53,222 $ 56,463 $ + Net losses related to balance sheet repositioning, net of tax 11,609 16,440 - Gain on sale of securities, net of tax 62 - Adjusted operating earnings available to common shareholders (non-GAAP) 64,769 $ 72,903 $ Weighted average common shares outstanding, diluted 78,884,235 78,740,351 Earnings per common share, diluted (GAAP) 0.67 $ 0.72 $ Adjusted operating earnings per common share, diluted (non- GAAP) 0.82 $ 0.93 $ For the three months ended Summarized Income Statement |
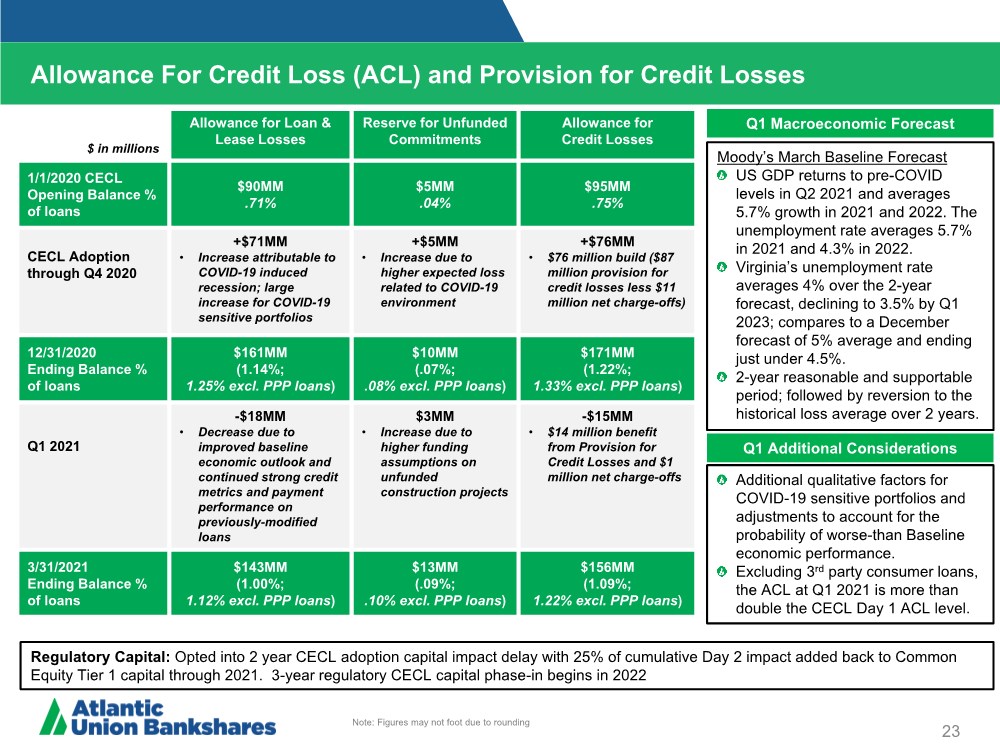
| Allowance For Credit Loss (ACL) and Provision for Credit Losses 23 Q1 Macroeconomic Forecast Q1 Additional Considerations Moody’s March Baseline Forecast US GDP returns to pre-COVID levels in Q2 2021 and averages 5.7% growth in 2021 and 2022. The unemployment rate averages 5.7% in 2021 and 4.3% in 2022. Virginia’s unemployment rate averages 4% over the 2-year forecast, declining to 3.5% by Q1 2023; compares to a December forecast of 5% average and ending just under 4.5%. 2-year reasonable and supportable period; followed by reversion to the historical loss average over 2 years. Additional qualitative factors for COVID-19 sensitive portfolios and adjustments to account for the probability of worse-than Baseline economic performance. Excluding 3rd party consumer loans, the ACL at Q1 2021 is more than double the CECL Day 1 ACL level. Regulatory Capital: Opted into 2 year CECL adoption capital impact delay with 25% of cumulative Day 2 impact added back to Common Equity Tier 1 capital through 2021. 3-year regulatory CECL capital phase-in begins in 2022 $ in millions Allowance for Loan & Lease Losses Reserve for Unfunded Commitments Allowance for Credit Losses 1/1/2020 CECL Opening Balance % of loans $90MM ..71% $5MM ..04% $95MM ..75% CECL Adoption through Q4 2020 +$71MM • Increase attributable to COVID-19 induced recession; large increase for COVID-19 sensitive portfolios +$5MM • Increase due to higher expected loss related to COVID-19 environment +$76MM • $76 million build ($87 million provision for credit losses less $11 million net charge-offs) 12/31/2020 Ending Balance % of loans $161MM (1.14%; 1.25% excl. PPP loans) $10MM (.07%; ..08% excl. PPP loans) $171MM (1.22%; 1.33% excl. PPP loans) Q1 2021 -$18MM • Decrease due to improved baseline economic outlook and continued strong credit metrics and payment performance on previously-modified loans $3MM • Increase due to higher funding assumptions on unfunded construction projects -$15MM • $14 million benefit from Provision for Credit Losses and $1 million net charge-offs 3/31/2021 Ending Balance % of loans $143MM (1.00%; 1.12% excl. PPP loans) $13MM (.09%; ..10% excl. PPP loans) $156MM (1.09%; 1.22% excl. PPP loans) Note: Figures may not foot due to rounding |
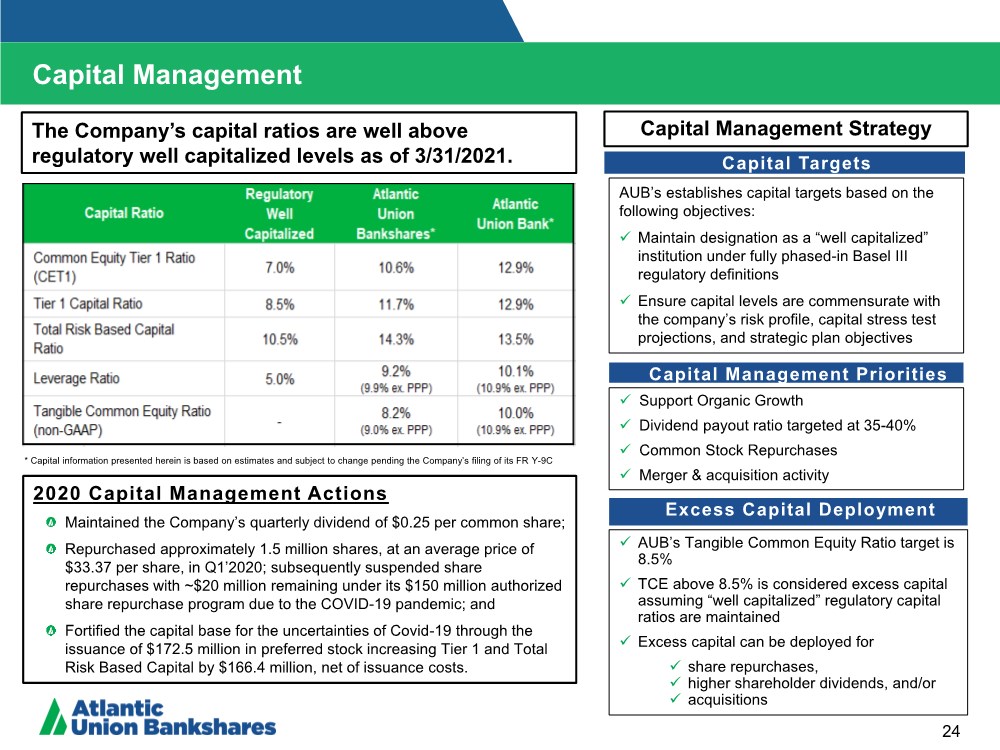
| Capital Management Strategy Capital Targets Capital Management Priorities Excess Capital Deployment AUB’s establishes capital targets based on the following objectives: Maintain designation as a “well capitalized” institution under fully phased-in Basel III regulatory definitions Ensure capital levels are commensurate with the company’s risk profile, capital stress test projections, and strategic plan objectives AUB’s Tangible Common Equity Ratio target is 8.5% TCE above 8.5% is considered excess capital assuming “well capitalized” regulatory capital ratios are maintained Excess capital can be deployed for share repurchases, higher shareholder dividends, and/or acquisitions Support Organic Growth Dividend payout ratio targeted at 35-40% Common Stock Repurchases Merger & acquisition activity 24 The Company’s capital ratios are well above regulatory well capitalized levels as of 3/31/2021. Capital Management * Capital information presented herein is based on estimates and subject to change pending the Company’s filing of its FR Y-9C 2020 Capital Management Actions Maintained the Company’s quarterly dividend of $0.25 per common share; Repurchased approximately 1.5 million shares, at an average price of $33.37 per share, in Q1’2020; subsequently suspended share repurchases with ~$20 million remaining under its $150 million authorized share repurchase program due to the COVID-19 pandemic; and Fortified the capital base for the uncertainties of Covid-19 through the issuance of $172.5 million in preferred stock increasing Tier 1 and Total Risk Based Capital by $166.4 million, net of issuance costs. |
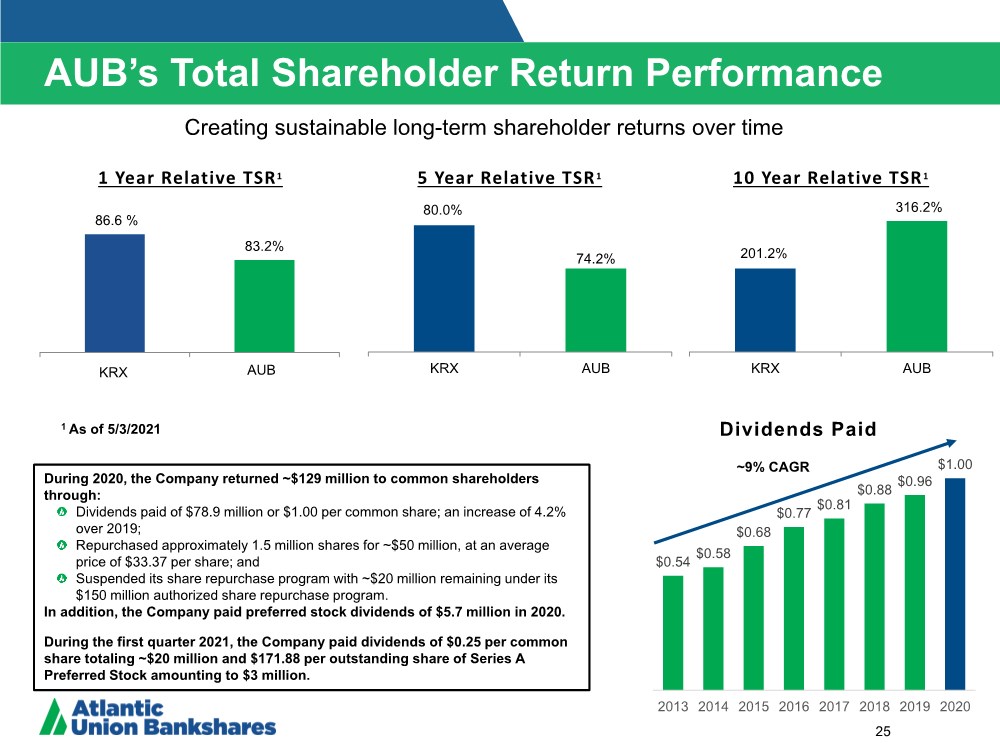
| 80.0% 74.2% KRX AUB 25 5 Year Relative TSR 1 1 As of 5/3/2021 1 Year Relative TSR1 86.6 % 83.2% KRX AUB Creating sustainable long-term shareholder returns over time KRX AUB 201.2% 316.2% KRX AUB 10 Year Relative TSR 1 Dividends Paid ~9% CAGR AUB’s Total Shareholder Return Performance $0.54 $0.58 $0.68 $0.77 $0.81 $0.88 $0.96 $1.00 2013 2014 2015 2016 2017 2018 2019 2020 During 2020, the Company returned ~$129 million to common shareholders through: Dividends paid of $78.9 million or $1.00 per common share; an increase of 4.2% over 2019; Repurchased approximately 1.5 million shares for ~$50 million, at an average price of $33.37 per share; and Suspended its share repurchase program with ~$20 million remaining under its $150 million authorized share repurchase program. In addition, the Company paid preferred stock dividends of $5.7 million in 2020. During the first quarter 2021, the Company paid dividends of $0.25 per common share totaling ~$20 million and $171.88 per outstanding share of Series A Preferred Stock amounting to $3 million. |
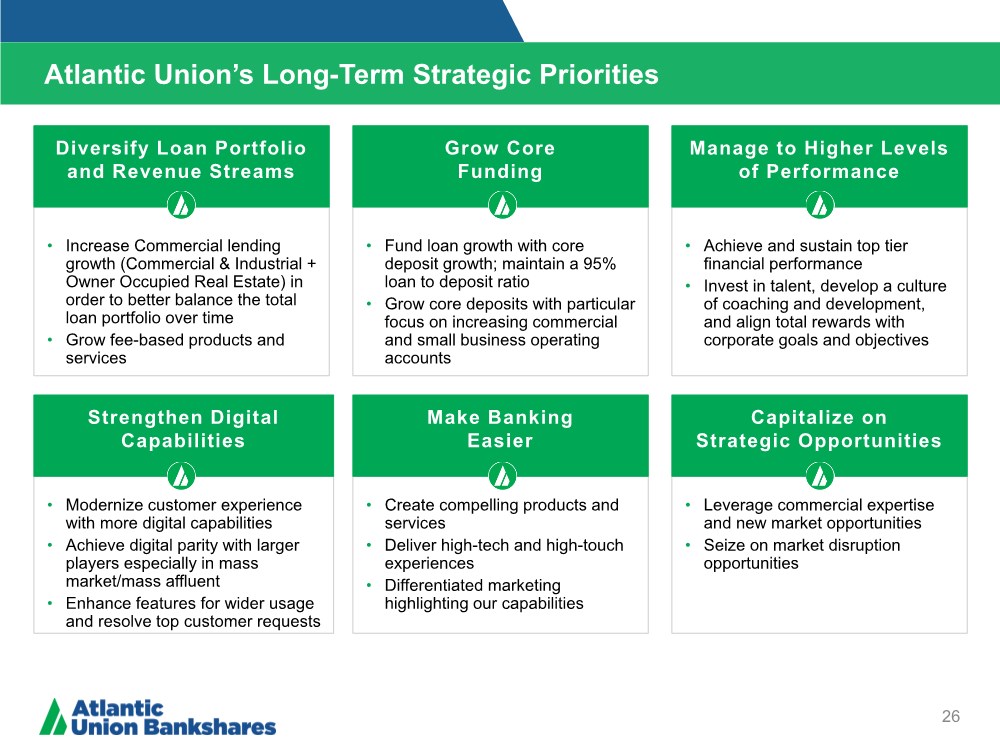
| Atlantic Union’s Long-Term Strategic Priorities 26 • Increase Commercial lending growth (Commercial & Industrial + Owner Occupied Real Estate) in order to better balance the total loan portfolio over time • Grow fee-based products and services Diversify Loan Portfolio and Revenue Streams • Fund loan growth with core deposit growth; maintain a 95% loan to deposit ratio • Grow core deposits with particular focus on increasing commercial and small business operating accounts Grow Core Funding • Achieve and sustain top tier financial performance • Invest in talent, develop a culture of coaching and development, and align total rewards with corporate goals and objectives Manage to Higher Levels of Performance • Modernize customer experience with more digital capabilities • Achieve digital parity with larger players especially in mass market/mass affluent • Enhance features for wider usage and resolve top customer requests • Create compelling products and services • Deliver high-tech and high-touch experiences • Differentiated marketing highlighting our capabilities • Leverage commercial expertise and new market opportunities • Seize on market disruption opportunities Strengthen Digital Capabilities Make Banking Easier Capitalize on Strategic Opportunities |
| Questions |
| Appendix |

| Reconciliation of Non-GAAP Disclosures 29 Operating Earnings Per Share The Company has provided supplemental performance measures on a tax-equivalent, tangible, operating, adjusted, or pre-tax pre-provision basis. These non-GAAP financial measures are supplements to GAAP, which is used to prepare the Company’s financial statements, and should not be considered in isolation or as a substitute for comparable measures calculated in accordance with GAAP. In addition, the Company’s non-GAAP financial measures may not be comparable to non-GAAP financial measures of other companies. The Company uses the non-GAAP financial measures discussed herein in its analysis of the Company’s performance. The Company’s management believes that these non-GAAP financial measures provide additional understanding of ongoing operations, enhance comparability of results of operations with prior periods and show the effects of significant gains and charges in the periods presented without the impact of items or events that may obscure trends in the Company’s underlying performance. |
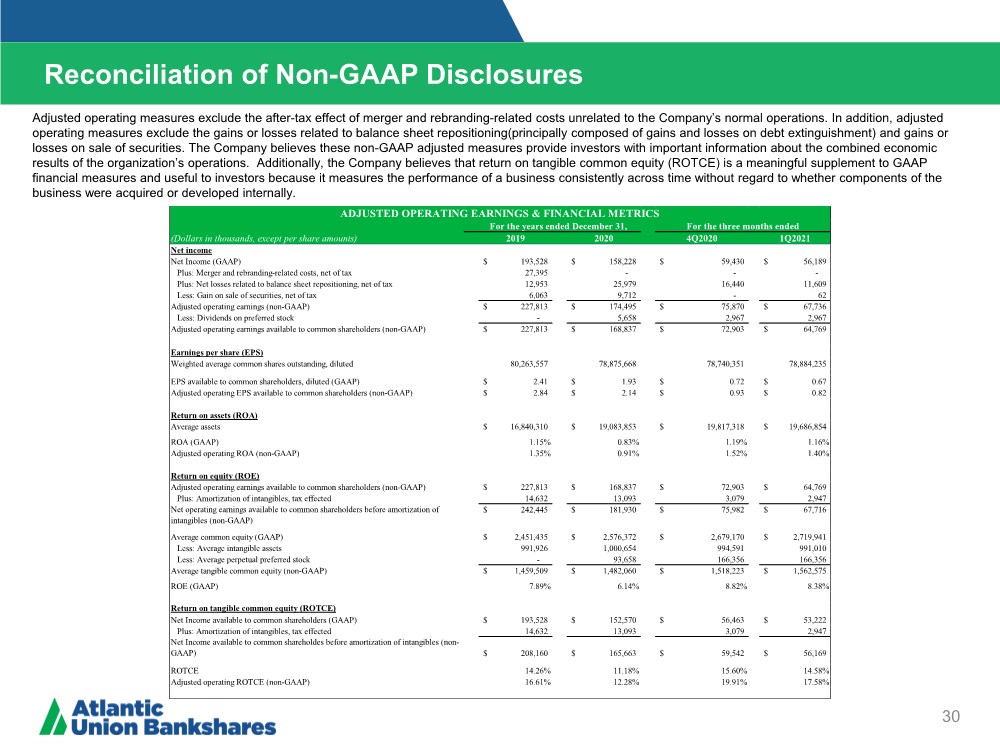
| Reconciliation of Non-GAAP Disclosures 30 Operating Earnings Per Share Adjusted operating measures exclude the after-tax effect of merger and rebranding-related costs unrelated to the Company’s normal operations. In addition, adjusted operating measures exclude the gains or losses related to balance sheet repositioning(principally composed of gains and losses on debt extinguishment) and gains or losses on sale of securities. The Company believes these non-GAAP adjusted measures provide investors with important information about the combined economic results of the organization’s operations. Additionally, the Company believes that return on tangible common equity (ROTCE) is a meaningful supplement to GAAP financial measures and useful to investors because it measures the performance of a business consistently across time without regard to whether components of the business were acquired or developed internally. (Dollars in thousands, except per share amounts) 2019 2020 4Q2020 1Q2021 Net income Net Income (GAAP) 193,528 $ 158,228 $ 59,430 $ 56,189 $ Plus: Merger and rebranding-related costs, net of tax 27,395 - - - Plus: Net losses related to balance sheet repositioning, net of tax 12,953 25,979 16,440 11,609 Less: Gain on sale of securities, net of tax 6,063 9,712 - 62 Adjusted operating earnings (non-GAAP) 227,813 $ 174,495 $ 75,870 $ 67,736 $ Less: Dividends on preferred stock - 5,658 2,967 2,967 Adjusted operating earnings available to common shareholders (non-GAAP) 227,813 $ 168,837 $ 72,903 $ 64,769 $ Earnings per share (EPS) Weighted average common shares outstanding, diluted 80,263,557 78,875,668 78,740,351 78,884,235 EPS available to common shareholders, diluted (GAAP) 2.41 $ 1.93 $ 0.72 $ 0.67 $ Adjusted operating EPS available to common shareholders (non-GAAP) 2.84 $ 2.14 $ 0.93 $ 0.82 $ Return on assets (ROA) Average assets 16,840,310 $ 19,083,853 $ 19,817,318 $ 19,686,854 $ ROA (GAAP) 1.15% 0.83% 1.19% 1.16% Adjusted operating ROA (non-GAAP) 1.35% 0.91% 1.52% 1.40% Return on equity (ROE) Adjusted operating earnings available to common shareholders (non-GAAP) 227,813 $ 168,837 $ 72,903 $ 64,769 $ Plus: Amortization of intangibles, tax effected 14,632 13,093 3,079 2,947 Net operating earnings available to common shareholders before amortization of intangibles (non-GAAP) 242,445 $ 181,930 $ 75,982 $ 67,716 $ Average common equity (GAAP) 2,451,435 $ 2,576,372 $ 2,679,170 $ 2,719,941 $ Less: Average intangible assets 991,926 1,000,654 994,591 991,010 Less: Average perpetual preferred stock - 93,658 166,356 166,356 Average tangible common equity (non-GAAP) 1,459,509 $ 1,482,060 $ 1,518,223 $ 1,562,575 $ ROE (GAAP) 7.89% 6.14% 8.82% 8.38% Return on tangible common equity (ROTCE) Net Income available to common shareholders (GAAP) 193,528 $ 152,570 $ 56,463 $ 53,222 $ Plus: Amortization of intangibles, tax effected 14,632 13,093 3,079 2,947 Net Income available to common shareholdes before amortization of intangibles (non- GAAP) 208,160 $ 165,663 $ 59,542 $ 56,169 $ ROTCE 14.26% 11.18% 15.60% 14.58% Adjusted operating ROTCE (non-GAAP) 16.61% 12.28% 19.91% 17.58% ADJUSTED OPERATING EARNINGS & FINANCIAL METRICS For the three months ended For the years ended December 31, |
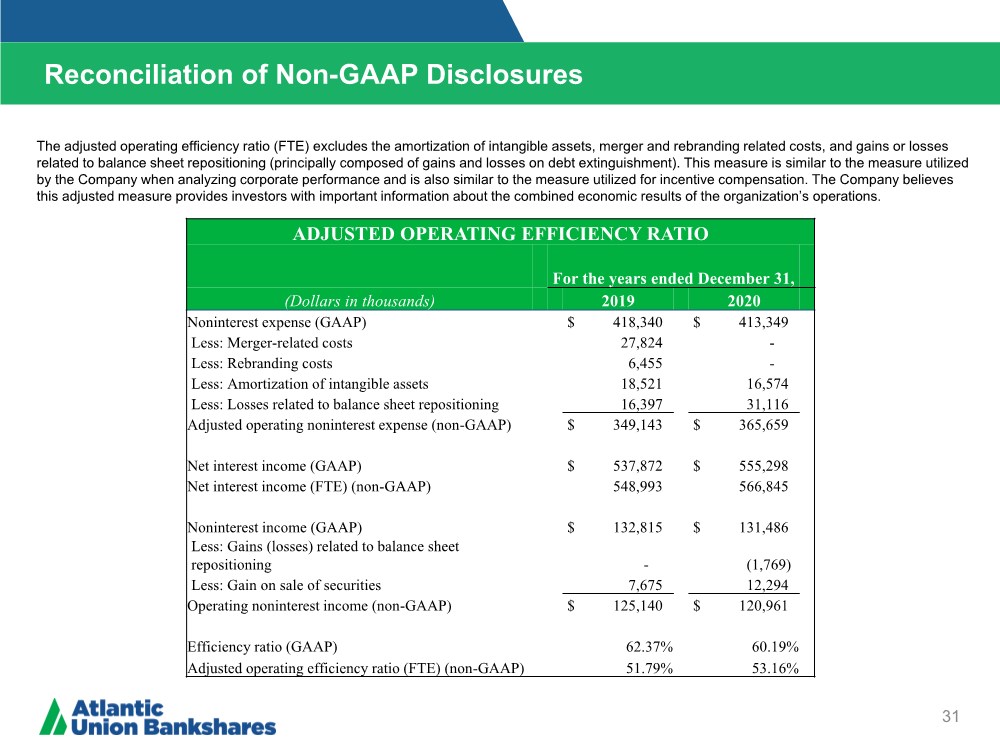
| Reconciliation of Non-GAAP Disclosures 31 Operating Earnings Per Share The adjusted operating efficiency ratio (FTE) excludes the amortization of intangible assets, merger and rebranding related costs, and gains or losses related to balance sheet repositioning (principally composed of gains and losses on debt extinguishment). This measure is similar to the measure utilized by the Company when analyzing corporate performance and is also similar to the measure utilized for incentive compensation. The Company believes this adjusted measure provides investors with important information about the combined economic results of the organization’s operations. ADJUSTED OPERATING EFFICIENCY RATIO For the years ended December 31, (Dollars in thousands) 2019 2020 Noninterest expense (GAAP) $ 418,340 $ 413,349 Less: Merger-related costs 27,824 - Less: Rebranding costs 6,455 - Less: Amortization of intangible assets 18,521 16,574 Less: Losses related to balance sheet repositioning 16,397 31,116 Adjusted operating noninterest expense (non-GAAP) $ 349,143 $ 365,659 Net interest income (GAAP) $ 537,872 $ 555,298 Net interest income (FTE) (non-GAAP) 548,993 566,845 Noninterest income (GAAP) $ 132,815 $ 131,486 Less: Gains (losses) related to balance sheet repositioning -(1,769) Less: Gain on sale of securities 7,675 12,294 Operating noninterest income (non-GAAP) $ 125,140 $ 120,961 Efficiency ratio (GAAP) 62.37% 60.19% Adjusted operating efficiency ratio (FTE) (non-GAAP) 51.79% 53.16% |
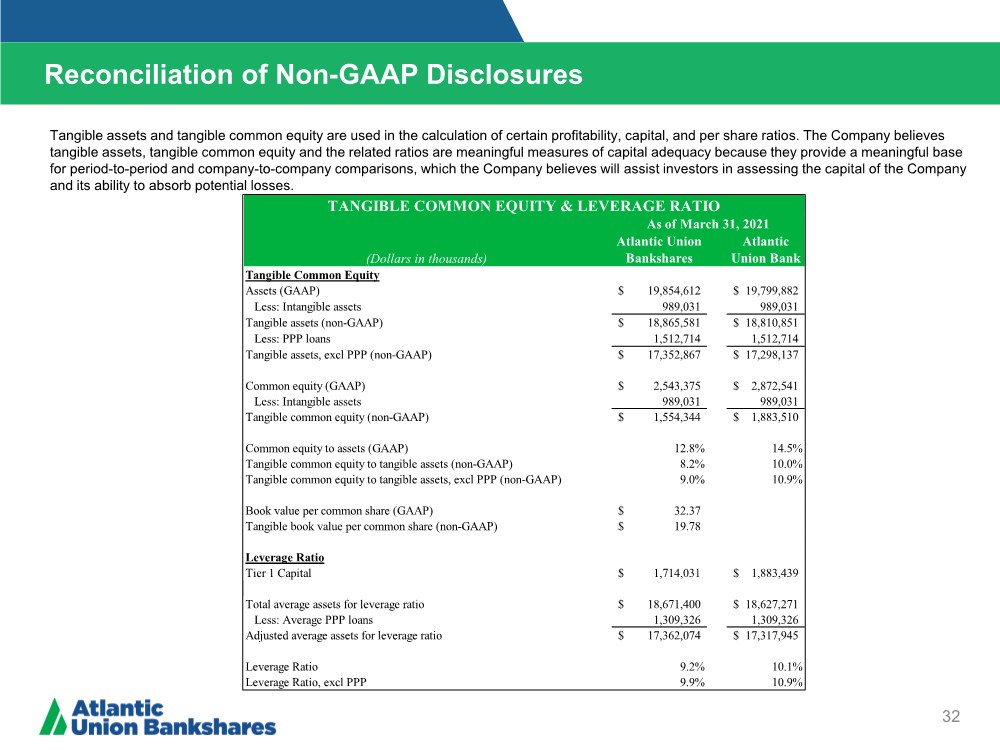
| Reconciliation of Non-GAAP Disclosures 32 Tangible assets and tangible common equity are used in the calculation of certain profitability, capital, and per share ratios. The Company believes tangible assets, tangible common equity and the related ratios are meaningful measures of capital adequacy because they provide a meaningful base for period-to-period and company-to-company comparisons, which the Company believes will assist investors in assessing the capital of the Company and its ability to absorb potential losses. (Dollars in thousands) Atlantic Union Bankshares Atlantic Union Bank Tangible Common Equity Assets (GAAP) 19,854,612 $ 19,799,882 $ Less: Intangible assets 989,031 989,031 Tangible assets (non-GAAP) 18,865,581 $ 18,810,851 $ Less: PPP loans 1,512,714 1,512,714 Tangible assets, excl PPP (non-GAAP) 17,352,867 $ 17,298,137 $ Common equity (GAAP) 2,543,375 $ 2,872,541 $ Less: Intangible assets 989,031 989,031 Tangible common equity (non-GAAP) 1,554,344 $ 1,883,510 $ Common equity to assets (GAAP) 12.8% 14.5% Tangible common equity to tangible assets (non-GAAP) 8.2% 10.0% Tangible common equity to tangible assets, excl PPP (non-GAAP) 9.0% 10.9% Book value per common share (GAAP) 32.37 $ Tangible book value per common share (non-GAAP) 19.78 $ Leverage Ratio Tier 1 Capital 1,714,031 $ 1,883,439 $ Total average assets for leverage ratio 18,671,400 $ 18,627,271 $ Less: Average PPP loans 1,309,326 1,309,326 Adjusted average assets for leverage ratio 17,362,074 $ 17,317,945 $ Leverage Ratio 9.2% 10.1% Leverage Ratio, excl PPP 9.9% 10.9% TANGIBLE COMMON EQUITY & LEVERAGE RATIO As of March 31, 2021 |
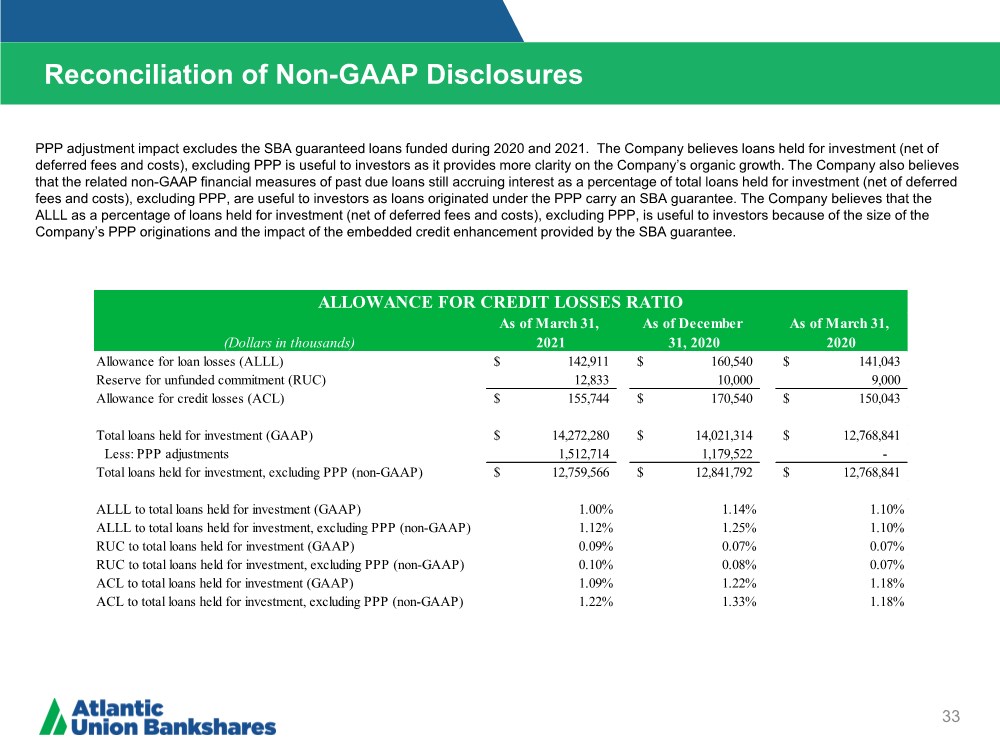
| Reconciliation of Non-GAAP Disclosures 33 ($ IN THOUSANDS) Operating Earnings Per Share (Dollars in thousands) As of March 31, 2021 As of December 31, 2020 As of March 31, 2020 Allowance for loan losses (ALLL) 142,911 $ 160,540 $ 141,043 $ Reserve for unfunded commitment (RUC) 12,833 10,000 9,000 Allowance for credit losses (ACL) 155,744 $ 170,540 $ 150,043 $ Total loans held for investment (GAAP) 14,272,280 $ 14,021,314 $ 12,768,841 $ Less: PPP adjustments 1,512,714 1,179,522 - Total loans held for investment, excluding PPP (non-GAAP) 12,759,566 $ 12,841,792 $ 12,768,841 $ ALLL to total loans held for investment (GAAP) 1.00% 1.14% 1.10% ALLL to total loans held for investment, excluding PPP (non-GAAP) 1.12% 1.25% 1.10% RUC to total loans held for investment (GAAP) 0.09% 0.07% 0.07% RUC to total loans held for investment, excluding PPP (non-GAAP) 0.10% 0.08% 0.07% ACL to total loans held for investment (GAAP) 1.09% 1.22% 1.18% ACL to total loans held for investment, excluding PPP (non-GAAP) 1.22% 1.33% 1.18% ALLOWANCE FOR CREDIT LOSSES RATIO PPP adjustment impact excludes the SBA guaranteed loans funded during 2020 and 2021. The Company believes loans held for investment (net of deferred fees and costs), excluding PPP is useful to investors as it provides more clarity on the Company’s organic growth. The Company also believes that the related non-GAAP financial measures of past due loans still accruing interest as a percentage of total loans held for investment (net of deferred fees and costs), excluding PPP, are useful to investors as loans originated under the PPP carry an SBA guarantee. The Company believes that the ALLL as a percentage of loans held for investment (net of deferred fees and costs), excluding PPP, is useful to investors because of the size of the Company’s PPP originations and the impact of the embedded credit enhancement provided by the SBA guarantee. |