| 3rd Quarter 2020 Earnings Presentation Nasdaq: AUB October 22, 2020 |

| Forward Looking Statements 2 Certain statements in this presentation may constitute “forward-looking statements” within the meaning of the Private Securities Litigation Reform Act of 1995. Forward-looking statements are statements that include, without limitation, projections, predictions, expectations or beliefs about future events or results that are not statements of historical fact. Such forward-looking statements are based on various assumptions as of the time they are made, and are inherently subject to known and unknown risks, uncertainties, and other factors, some of which cannot be predicted or quantified, that may cause actual results, performance or achievements to be materially different from those expressed or implied by such forward- looking statements. Forward-looking statements are often accompanied by words that convey projected future events or outcomes such as “expect,” “believe,” “estimate,” “plan,” “project,” “anticipate,” “intend,” “will,” “may,” “view,” “opportunity,” “potential,” or words of similar meaning or other statements concerning opinions or judgment of Atlantic Union Bankshares Corporation (“Atlantic Union” or the “Company”) and its management about future events. Although Atlantic Union believes that its expectations with respect to forward-looking statements are based upon reasonable assumptions within the bounds of its existing knowledge of its business and operations, there can be no assurance that actual results, performance, or achievements of, or trends affecting, the Company will not differ materially from any projected future results, performance, or achievements or trends expressed or implied by such forward-looking statements. Actual future results, performance, achievements or trends may differ materially from historical results or those anticipated depending on a variety of factors, including, but not limited to: changes in interest rates; general economic and financial market conditions, in the United States generally and particularly in the markets in which the Company operates and which its loans are concentrated, including the effects of declines in real estate values, an increase in unemployment levels and slowdowns in economic growth, including as a result of COVID- 19; the quality or composition of the loan or investment portfolios and changes therein; demand for loan products and financial services in the Company’s market area; the Company’s ability to manage its growth or implement its growth strategy; the effectiveness of expense reduction plans; the introduction of new lines of business or new products and services; the Company’s ability to recruit and retain key employees; the incremental cost and/or decreased revenues associated with exceeding $10 billion in assets; real estate values in the Bank’s lending area; an insufficient ACL; changes in accounting principles relating to loan loss recognition (CECL); the Company’s liquidity and capital positions; concentrations of loans secured by real estate, particularly commercial real estate; the effectiveness of the Company’s credit processes and management of the Company’s credit risk; the Company’s ability to compete in the market for financial services and increased competition relating to fintech; technological risks and developments, and cyber threats, attacks, or events; the potential adverse effects of unusual and infrequently occurring events, such as weather-related disasters, terrorist acts or public health events (such as COVID-19), and of governmental and societal responses thereto; these potential adverse effects may include, without limitation, adverse effects on the ability of the Company's borrowers to satisfy their obligations to the Company, on the value of collateral securing loans, on the demand for the Company's loans or its other products and services, on incidents of cyberattack and fraud, on the Company’s liquidity or capital positions, on risks posed by reliance on third- party service providers, on other aspects of the Company's business operations and on financial markets and economic growth; the effect of steps the Company takes in response to COVID-19, the severity and duration of the pandemic, including whether there is a resurgence of COVID-19 infections in connection with the seasonal flu, the impact of loosening or tightening of government restrictions, the pace of recovery when the pandemic subsides and the heightened impact it has on many of the risks described herein; performance by the Company’s counterparties or vendors; deposit flows; the availability of financing and the terms thereof; the level of prepayments on loans and mortgage-backed securities; legislative or regulatory changes and requirements, including the impact of the CARES Act and other legislative and regulatory reactions to COVID-19; potential claims, damages, and fines related to litigation or government actions, including litigation or actions arising from the Company’s participation in and administration of programs related to COVID-19, including, among other things, the CARES Act; the effects of changes in federal, state or local tax laws and regulations; monetary and fiscal policies of the U.S. government, including policies of the U.S. Department of the Treasury and the Federal Reserve; changes to applicable accounting principles and guidelines; and other factors, many of which are beyond the control of the Company. Please refer to the “Risk Factors” and “Management’s Discussion and Analysis of Financial Condition and Results of Operations” sections of the Company’s Annual Report on Form 10-K for the year ended December 31, 2019, comparable “Risk Factors” sections of the Company’s Quarterly Reports on Form 10-Q, and related disclosures in other filings, which have been filed with the Securities and Exchange Commission (the “SEC”), and are available on the SEC’s website at www.sec.gov. All of the forward-looking statements made in this presentation are expressly qualified by the cautionary statements contained or referred to herein. The actual results or developments anticipated may not be realized or, even if substantially realized, they may not have the expected consequences to or effects on the Company or its businesses or operations. You are cautioned not to rely too heavily on the forward-looking statements contained in this presentation. Forward-looking statements speak only as of the date they are made and the Company does not undertake any obligation to update, revise or clarify these forward-looking statements, whether as a result of new information, future events or otherwise. |
| Additional Information 3 Non-GAAP Financial Measures This presentation contains certain financial information determined by methods other than in accordance with generally accepted accounting principles in the United States (“GAAP”). These non-GAAP disclosures have limitations as an analytical tool and should not be considered in isolation or as a substitute for analysis of our results as reported under GAAP, nor are they necessarily comparable to non-GAAP performance measures that may be presented by other companies. The Company uses the non-GAAP financial measures discussed herein in its analysis of the Company’s performance. The Company’s management believes that these non-GAAP financial measures provide additional understanding of ongoing operations, enhance comparability of results of operations with prior periods and show the effects of significant gains and charges in the periods presented without the impact of items or events that may obscure trends in the Company’s underlying performance. Please see “Reconciliation of Non-GAAP Disclosures” at the end of this presentation for a reconciliation to the nearest GAAP financial measure. No Offer or Solicitation This presentation does not constitute an offer to sell or a solicitation of an offer to buy any securities. No offer of securities shall be made except by means of a prospectus meeting the requirements of the Securities Act of 1933, as amended, and no offer to sell or solicitation of an offer to buy shall be made in any jurisdiction in which such offer, solicitation or sale would be unlawful. About Atlantic Union Bankshares Corporation Headquartered in Richmond, Virginia, Atlantic Union Bankshares Corporation (Nasdaq: AUB) is the holding company for Atlantic Union Bank. Atlantic Union Bank has 135 branches and approximately 155 ATMs located throughout Virginia, and in portions of Maryland and North Carolina. Middleburg Financial is a brand name used by Atlantic Union Bank and certain affiliates when providing trust, wealth management, private banking, and investment advisory products and services. Certain non-bank affiliates of Atlantic Union Bank include: Old Dominion Capital Management, Inc., and its subsidiary, Outfitter Advisors, Ltd., and Dixon, Hubard, Feinour, & Brown, Inc., which provide investment advisory services; Middleburg Investment Services, LLC, which provides brokerage services; and Union Insurance Group, LLC, which offers various lines of insurance products. |
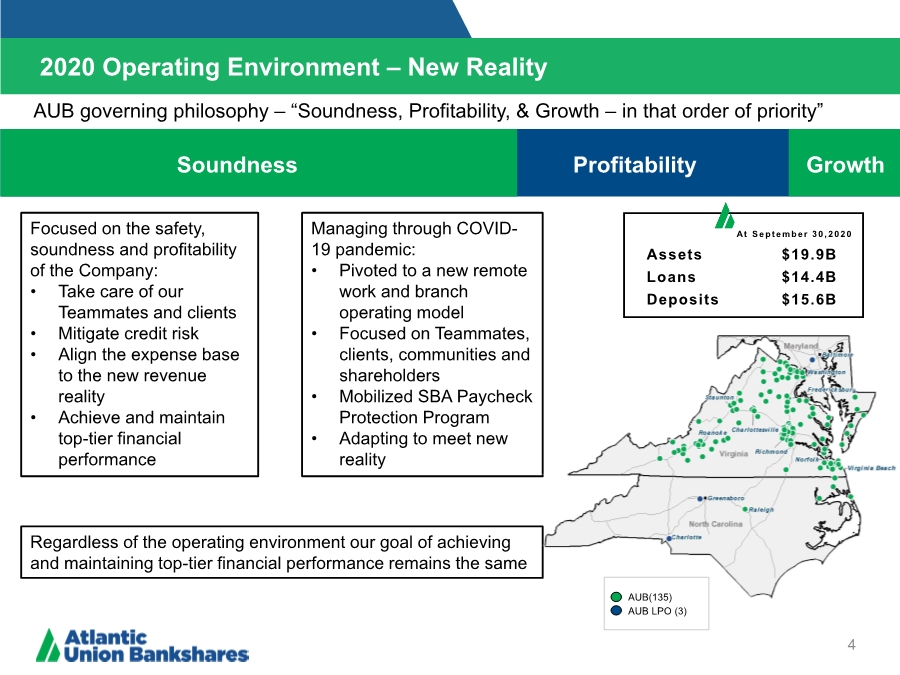
| 2020 Operating Environment – New Reality 4 Soundness Profitability Growth AUB(135) AUB LPO (3) At September 30,2020 Assets $19.9B Loans $14.4B Deposits $15.6B Managing through COVID- 19 pandemic: • Pivoted to a new remote work and branch operating model • Focused on Teammates, clients, communities and shareholders • Mobilized SBA Paycheck Protection Program • Adapting to meet new reality AUB governing philosophy –“Soundness, Profitability, & Growth – in that order of priority” Focused on the safety, soundness and profitability of the Company: • Take care of our Teammates and clients • Mitigate credit risk • Align the expense base to the new revenue reality • Achieve and maintain top-tier financial performance Regardless of the operating environment our goal of achieving and maintaining top-tier financial performance remains the same |
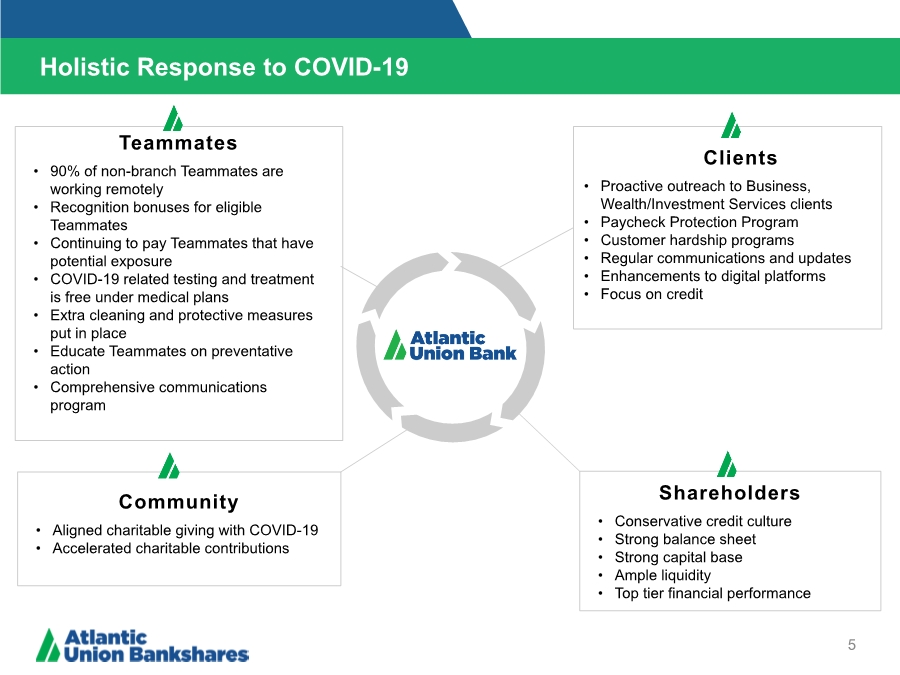
| Teammates • 90% of non-branch Teammates are working remotely • Recognition bonuses for eligible Teammates • Continuing to pay Teammates that have potential exposure • COVID-19 related testing and treatment is free under medical plans • Extra cleaning and protective measures put in place • Educate Teammates on preventative action • Comprehensive communications program Clients • Proactive outreach to Business, Wealth/Investment Services clients • Paycheck Protection Program • Customer hardship programs • Regular communications and updates • Enhancements to digital platforms • Focus on credit Shareholders • Conservative credit culture • Strong balance sheet • Strong capital base • Ample liquidity • Top tier financial performance Community • Aligned charitable giving with COVID-19 • Accelerated charitable contributions Holistic Response to COVID-19 5 |
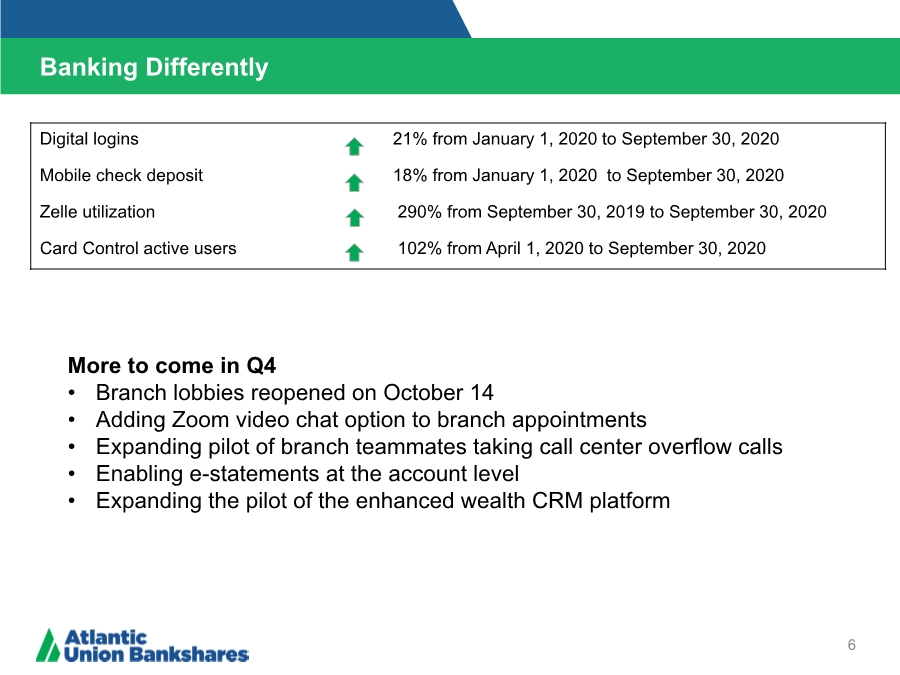
| Banking Differently 6 Digital logins 21% from January 1, 2020 to September 30, 2020 Mobile check deposit 18% from January 1, 2020 to September 30, 2020 Zelle utilization 290% from September 30, 2019 to September 30, 2020 Card Control active users 102% from April 1, 2020 to September 30, 2020 More to come in Q4 • Branch lobbies reopened on October 14 • Adding Zoom video chat option to branch appointments • Expanding pilot of branch teammates taking call center overflow calls • Enabling e-statements at the account level • Expanding the pilot of the enhanced wealth CRM platform |
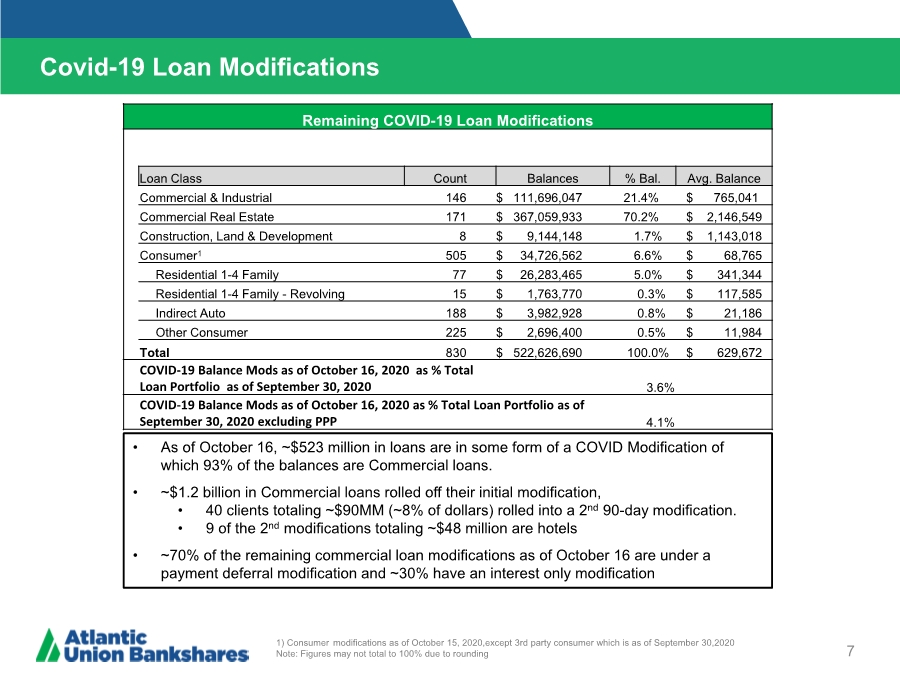
| Covid-19 Loan Modifications 7 • As of October 16, ~$523 million in loans are in some form of a COVID Modification of which 93% of the balances are Commercial loans. • ~$1.2 billion in Commercial loans rolled off their initial modification, • 40 clients totaling ~$90MM (~8% of dollars) rolled into a 2nd 90-day modification. • 9 of the 2nd modifications totaling ~$48 million are hotels • ~70% of the remaining commercial loan modifications as of October 16 are under a payment deferral modification and ~30% have an interest only modification 1) Consumer modifications as of October 15, 2020,except 3rd party consumer which is as of September 30,2020 Note: Figures may not total to 100% due to rounding Remaining COVID-19 Loan Modifications Loan Class Count Balances % Bal. Avg. Balance Commercial & Industrial 146 $ 111,696,047 21.4% $ 765,041 Commercial Real Estate 171 $ 367,059,933 70.2% $ 2,146,549 Construction, Land & Development 8 $ 9,144,148 1.7% $ 1,143,018 Consumer1 505 $ 34,726,562 6.6% $ 68,765 Residential 1-4 Family 77 $ 26,283,465 5.0% $ 341,344 Residential 1-4 Family - Revolving 15 $ 1,763,770 0.3% $ 117,585 Indirect Auto 188 $ 3,982,928 0.8% $ 21,186 Other Consumer 225 $ 2,696,400 0.5% $ 11,984 Total 830 $ 522,626,690 100.0% $ 629,672 COVID-19 Balance Mods as of October 16, 2020 as % Total Loan Portfolio as of September 30, 2020 3.6% COVID-19 Balance Mods as of October 16, 2020 as % Total Loan Portfolio as of September 30, 2020 excluding PPP 4.1% |
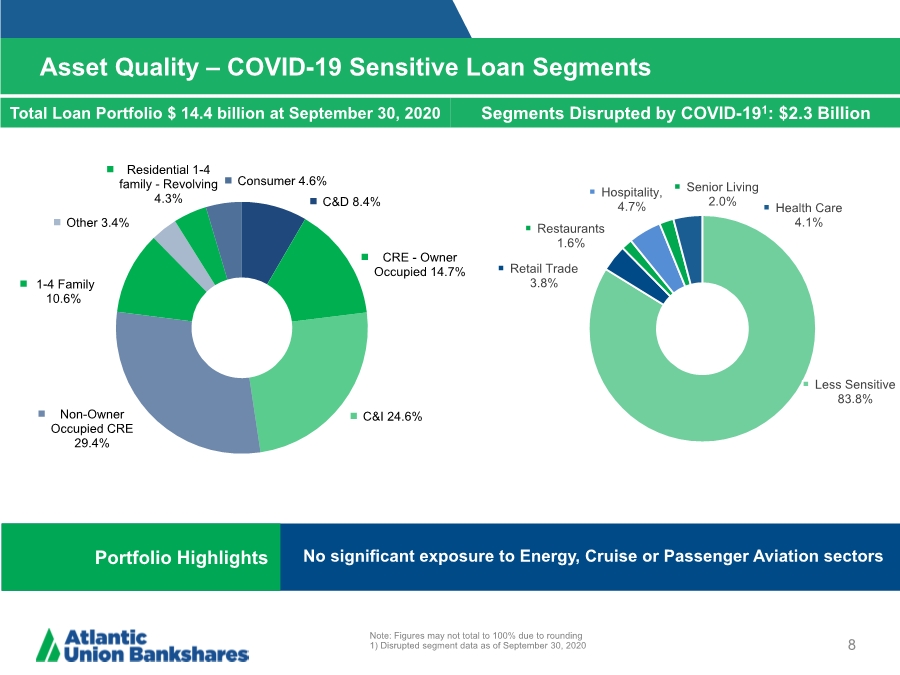
| Asset Quality – COVID-19 Sensitive Loan Segments 8 Note: Figures may not total to 100% due to rounding 1) Disrupted segment data as of September 30, 2020 Total Loan Portfolio $ 14.4 billion at September 30, 2020 Segments Disrupted by COVID-191: $2.3 Billion Portfolio Highlights No significant exposure to Energy, Cruise or Passenger Aviation sectors Less Sensitive 83.8% Retail Trade 3.8% Restaurants 1.6% Hospitality, 4.7% Senior Living 2.0% Health Care 4.1% C&D 8.4% CRE - Owner Occupied 14.7% C&I 24.6% Non-Owner Occupied CRE 29.4% 1-4 Family 10.6% Other 3.4% Residential 1-4 family - Revolving 4.3% Consumer 4.6% |
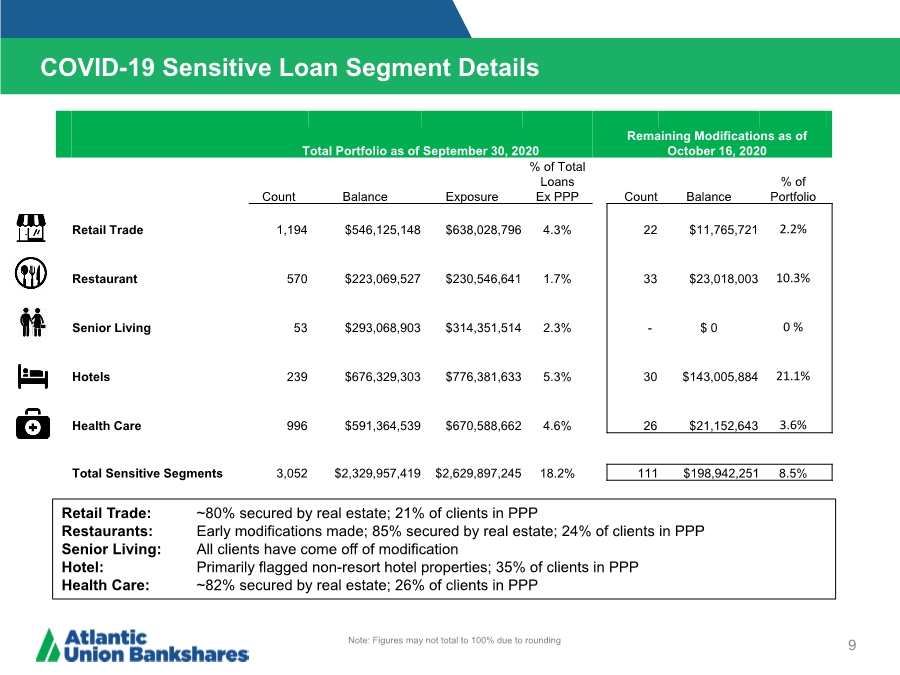
| COVID-19 Sensitive Loan Segment Details 9 Retail Trade: ~80% secured by real estate; 21% of clients in PPP Restaurants: Early modifications made; 85% secured by real estate; 24% of clients in PPP Senior Living: All clients have come off of modification Hotel: Primarily flagged non-resort hotel properties; 35% of clients in PPP Health Care: ~82% secured by real estate; 26% of clients in PPP Note: Figures may not total to 100% due to rounding Total Portfolio as of September 30, 2020 Remaining Modifications as of October 16, 2020 Count Balance Exposure % of Total Loans Ex PPP Count Balance % of Portfolio Retail Trade 1,194 $546,125,148 $638,028,796 4.3% 22 $11,765,721 2.2% Restaurant 570 $223,069,527 $230,546,641 1.7% 33 $23,018,003 10.3% Senior Living 53 $293,068,903 $314,351,514 2.3% - $ 0 0 % Hotels 239 $676,329,303 $776,381,633 5.3% 30 $143,005,884 21.1% Health Care 996 $591,364,539 $670,588,662 4.6% 26 $21,152,643 3.6% Total Sensitive Segments 3,052 $2,329,957,419 $2,629,897,245 18.2% 111 $198,942,251 8.5% |
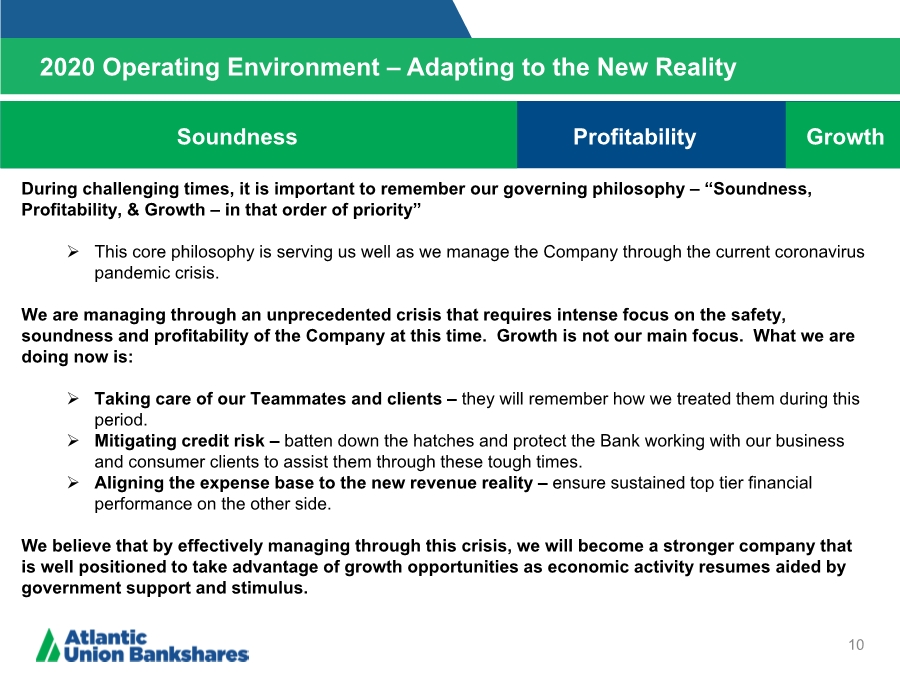
| 2020 Operating Environment – Adapting to the New Reality 10 Soundness Profitability Growth During challenging times, it is important to remember our governing philosophy –“Soundness, Profitability, & Growth – in that order of priority” This core philosophy is serving us well as we manage the Company through the current coronavirus pandemic crisis. We are managing through an unprecedented crisis that requires intense focus on the safety, soundness and profitability of the Company at this time. Growth is not our main focus. What we are doing now is: Taking care of our Teammates and clients – they will remember how we treated them during this period. Mitigating credit risk – batten down the hatches and protect the Bank working with our business and consumer clients to assist them through these tough times. Aligning the expense base to the new revenue reality – ensure sustained top tier financial performance on the other side. We believe that by effectively managing through this crisis, we will become a stronger company that is well positioned to take advantage of growth opportunities as economic activity resumes aided by government support and stimulus. |
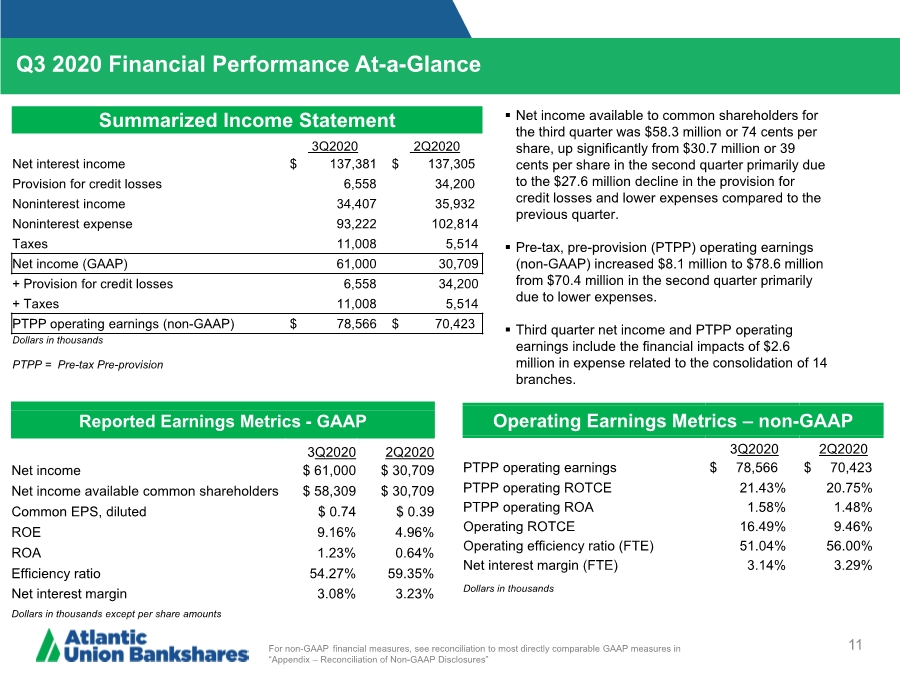
| Q3 2020 Financial Performance At-a-Glance 11 Summarized Income Statement 3Q2020 2Q2020 Net interest income $ 137,381 $ 137,305 Provision for credit losses 6,558 34,200 Noninterest income 34,407 35,932 Noninterest expense 93,222 102,814 Taxes 11,008 5,514 Net income (GAAP) 61,000 30,709 + Provision for credit losses 6,558 34,200 + Taxes 11,008 5,514 PTPP operating earnings (non-GAAP) $ 78,566 $ 70,423 Dollars in thousands PTPP = Pre-tax Pre-provision Reported Earnings Metrics - GAAP 3Q2020 2Q2020 Net income $ 61,000 $ 30,709 Net income available common shareholders $ 58,309 $ 30,709 Common EPS, diluted $ 0.74 $ 0.39 ROE 9.16% 4.96% ROA 1.23% 0.64% Efficiency ratio 54.27% 59.35% Net interest margin 3.08% 3.23% Dollars in thousands except per share amounts Operating Earnings Metrics – non-GAAP 3Q2020 2Q2020 PTPP operating earnings $ 78,566 $ 70,423 PTPP operating ROTCE 21.43% 20.75% PTPP operating ROA 1.58% 1.48% Operating ROTCE 16.49% 9.46% Operating efficiency ratio (FTE) 51.04% 56.00% Net interest margin (FTE) 3.14% 3.29% Dollars in thousands For non-GAAP financial measures, see reconciliation to most directly comparable GAAP measures in “Appendix – Reconciliation of Non-GAAP Disclosures” .. Net income available to common shareholders for the third quarter was $58.3 million or 74 cents per share, up significantly from $30.7 million or 39 cents per share in the second quarter primarily due to the $27.6 million decline in the provision for credit losses and lower expenses compared to the previous quarter. .. Pre-tax, pre-provision (PTPP) operating earnings (non-GAAP) increased $8.1 million to $78.6 million from $70.4 million in the second quarter primarily due to lower expenses. .. Third quarter net income and PTPP operating earnings include the financial impacts of $2.6 million in expense related to the consolidation of 14 branches. |
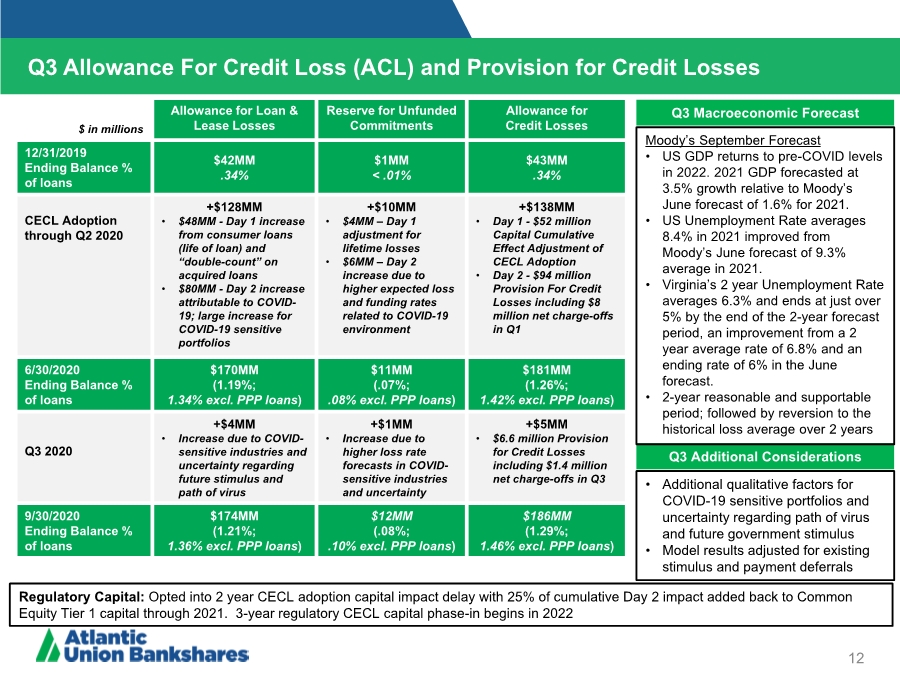
| Q3 Allowance For Credit Loss (ACL) and Provision for Credit Losses 12 Q3 Macroeconomic Forecast Q3 Additional Considerations Moody’s September Forecast • US GDP returns to pre-COVID levels in 2022. 2021 GDP forecasted at 3.5% growth relative to Moody’s June forecast of 1.6% for 2021. • US Unemployment Rate averages 8.4% in 2021 improved from Moody’s June forecast of 9.3% average in 2021. • Virginia’s 2 year Unemployment Rate averages 6.3% and ends at just over 5% by the end of the 2-year forecast period, an improvement from a 2 year average rate of 6.8% and an ending rate of 6% in the June forecast. • 2-year reasonable and supportable period; followed by reversion to the historical loss average over 2 years • Additional qualitative factors for COVID-19 sensitive portfolios and uncertainty regarding path of virus and future government stimulus • Model results adjusted for existing stimulus and payment deferrals Regulatory Capital: Opted into 2 year CECL adoption capital impact delay with 25% of cumulative Day 2 impact added back to Common Equity Tier 1 capital through 2021. 3-year regulatory CECL capital phase-in begins in 2022 $ in millions Allowance for Loan & Lease Losses Reserve for Unfunded Commitments Allowance for Credit Losses 12/31/2019 Ending Balance % of loans $42MM ..34% $1MM < .01% $43MM ..34% CECL Adoption through Q2 2020 +$128MM • $48MM - Day 1 increase from consumer loans (life of loan) and “double-count” on acquired loans • $80MM - Day 2 increase attributable to COVID- 19; large increase for COVID-19 sensitive portfolios +$10MM • $4MM – Day 1 adjustment for lifetime losses • $6MM – Day 2 increase due to higher expected loss and funding rates related to COVID-19 environment +$138MM • Day 1 - $52 million Capital Cumulative Effect Adjustment of CECL Adoption • Day 2 - $94 million Provision For Credit Losses including $8 million net charge-offs in Q1 6/30/2020 Ending Balance % of loans $170MM (1.19%; 1.34% excl. PPP loans) $11MM (.07%; ..08% excl. PPP loans) $181MM (1.26%; 1.42% excl. PPP loans) Q3 2020 +$4MM • Increase due to COVID- sensitive industries and uncertainty regarding future stimulus and path of virus +$1MM • Increase due to higher loss rate forecasts in COVID- sensitive industries and uncertainty +$5MM • $6.6 million Provision for Credit Losses including $1.4 million net charge-offs in Q3 9/30/2020 Ending Balance % of loans $174MM (1.21%; 1.36% excl. PPP loans) $12MM (.08%; ..10% excl. PPP loans) $186MM (1.29%; 1.46% excl. PPP loans) |
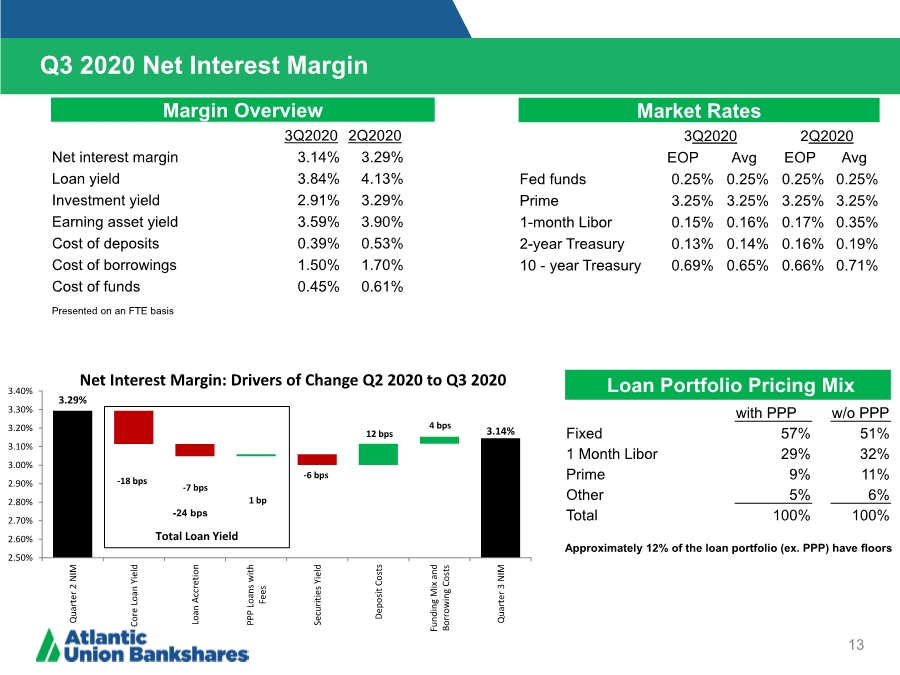
| 3.29% 3.14% 2.50% 2.60% 2.70% 2.80% 2.90% 3.00% 3.10% 3.20% 3.30% 3.40% Quarter 2 NIM Core Loan Yield Loan Accretion PPP Loans with Fees Securities Yield Deposit Costs Funding Mix and Borrowing Costs Quarter 3 NIM Net Interest Margin: Drivers of Change Q2 2020 to Q3 2020 -18 bps -7 bps 1 bp -6 bps 12 bps 4 bps 13 Q3 2020 Net Interest Margin Market Rates 3Q2020 2Q2020 EOP Avg EOP Avg Fed funds 0.25% 0.25% 0.25% 0.25% Prime 3.25% 3.25% 3.25% 3.25% 1-month Libor 0.15% 0.16% 0.17% 0.35% 2-year Treasury 0.13% 0.14% 0.16% 0.19% 10 - year Treasury 0.69% 0.65% 0.66% 0.71% Margin Overview 3Q2020 2Q2020 Net interest margin 3.14% 3.29% Loan yield 3.84% 4.13% Investment yield 2.91% 3.29% Earning asset yield 3.59% 3.90% Cost of deposits 0.39% 0.53% Cost of borrowings 1.50% 1.70% Cost of funds 0.45% 0.61% Presented on an FTE basis Approximately 12% of the loan portfolio (ex. PPP) have floors Loan Portfolio Pricing Mix with PPP w/o PPP Fixed 57% 51% 1 Month Libor 29% 32% Prime 9% 11% Other 5% 6% Total 100% 100% Total Loan Yield -24 bps |
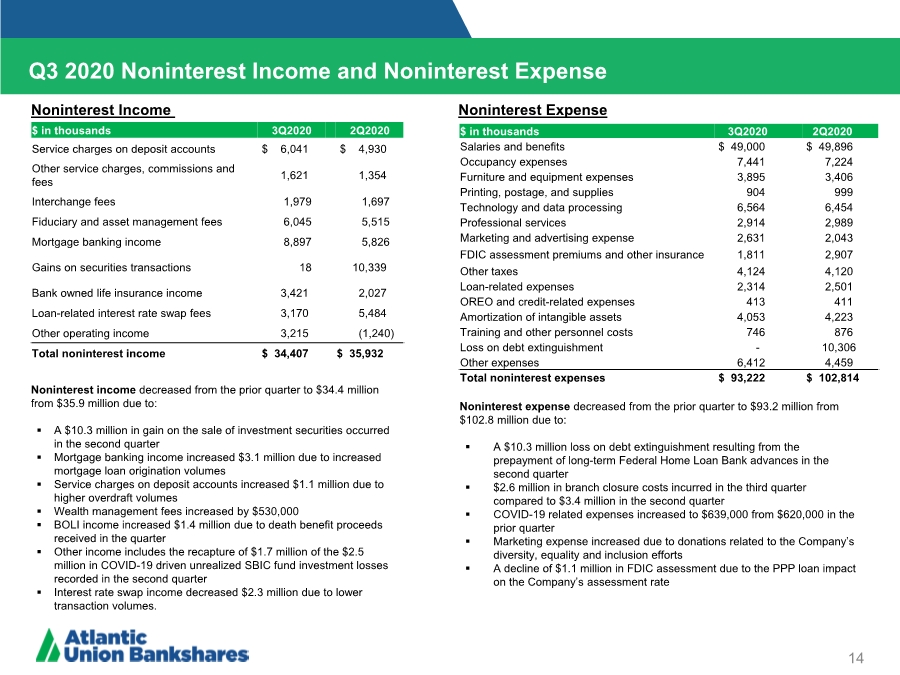
| 14 Noninterest income decreased from the prior quarter to $34.4 million from $35.9 million due to: .. A $10.3 million in gain on the sale of investment securities occurred in the second quarter .. Mortgage banking income increased $3.1 million due to increased mortgage loan origination volumes .. Service charges on deposit accounts increased $1.1 million due to higher overdraft volumes .. Wealth management fees increased by $530,000 .. BOLI income increased $1.4 million due to death benefit proceeds received in the quarter .. Other income includes the recapture of $1.7 million of the $2.5 million in COVID-19 driven unrealized SBIC fund investment losses recorded in the second quarter .. Interest rate swap income decreased $2.3 million due to lower transaction volumes. $ in thousands 3Q2020 2Q2020 Service charges on deposit accounts $ 6,041 $ 4,930 Other service charges, commissions and fees 1,621 1,354 Interchange fees 1,979 1,697 Fiduciary and asset management fees 6,045 5,515 Mortgage banking income 8,897 5,826 Gains on securities transactions 18 10,339 Bank owned life insurance income 3,421 2,027 Loan-related interest rate swap fees 3,170 5,484 Other operating income 3,215 (1,240) Total noninterest income $ 34,407 $ 35,932 $ in thousands 3Q2020 2Q2020 Salaries and benefits $ 49,000 $ 49,896 Occupancy expenses 7,441 7,224 Furniture and equipment expenses 3,895 3,406 Printing, postage, and supplies 904 999 Technology and data processing 6,564 6,454 Professional services 2,914 2,989 Marketing and advertising expense 2,631 2,043 FDIC assessment premiums and other insurance 1,811 2,907 Other taxes 4,124 4,120 Loan-related expenses 2,314 2,501 OREO and credit-related expenses 413 411 Amortization of intangible assets 4,053 4,223 Training and other personnel costs 746 876 Loss on debt extinguishment - 10,306 Other expenses 6,412 4,459 Total noninterest expenses $ 93,222 $ 102,814 Q3 2020 Noninterest Income and Noninterest Expense Noninterest Income Noninterest Expense Noninterest expense decreased from the prior quarter to $93.2 million from $102.8 million due to: .. A $10.3 million loss on debt extinguishment resulting from the prepayment of long-term Federal Home Loan Bank advances in the second quarter .. $2.6 million in branch closure costs incurred in the third quarter compared to $3.4 million in the second quarter .. COVID-19 related expenses increased to $639,000 from $620,000 in the prior quarter .. Marketing expense increased due to donations related to the Company’s diversity, equality and inclusion efforts .. A decline of $1.1 million in FDIC assessment due to the PPP loan impact on the Company’s assessment rate |
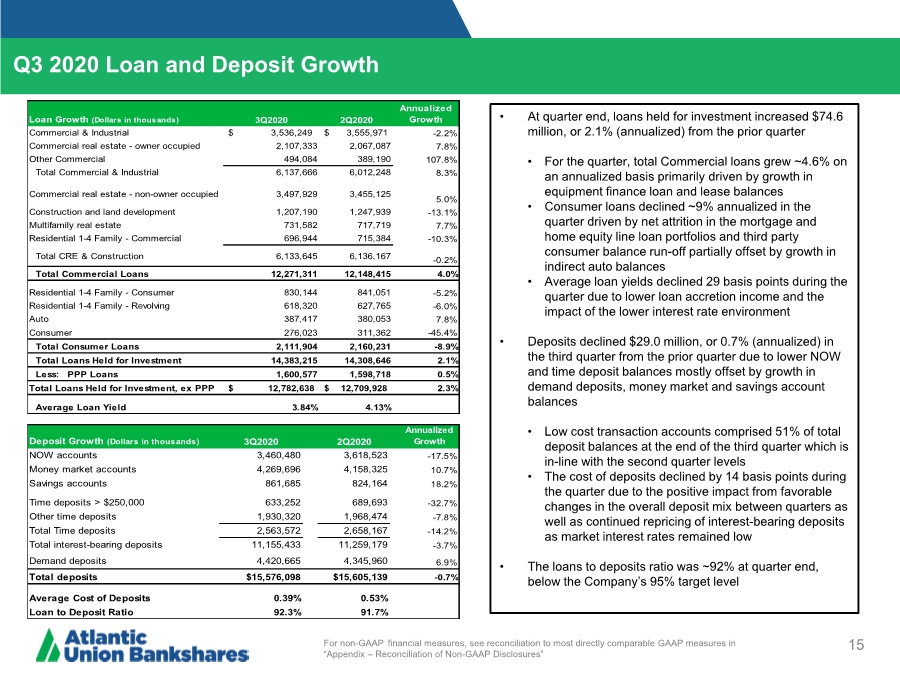
| 15 Q3 2020 Loan and Deposit Growth For non-GAAP financial measures, see reconciliation to most directly comparable GAAP measures in “Appendix – Reconciliation of Non-GAAP Disclosures” • At quarter end, loans held for investment increased $74.6 million, or 2.1% (annualized) from the prior quarter • For the quarter, total Commercial loans grew ~4.6% on an annualized basis primarily driven by growth in equipment finance loan and lease balances • Consumer loans declined ~9% annualized in the quarter driven by net attrition in the mortgage and home equity line loan portfolios and third party consumer balance run-off partially offset by growth in indirect auto balances • Average loan yields declined 29 basis points during the quarter due to lower loan accretion income and the impact of the lower interest rate environment • Deposits declined $29.0 million, or 0.7% (annualized) in the third quarter from the prior quarter due to lower NOW and time deposit balances mostly offset by growth in demand deposits, money market and savings account balances • Low cost transaction accounts comprised 51% of total deposit balances at the end of the third quarter which is in-line with the second quarter levels • The cost of deposits declined by 14 basis points during the quarter due to the positive impact from favorable changes in the overall deposit mix between quarters as well as continued repricing of interest-bearing deposits as market interest rates remained low • The loans to deposits ratio was ~92% at quarter end, below the Company’s 95% target level Loan Growth (Dollars in thousands) 3Q2020 2Q2020 Annualized Growth Commercial & Industrial $ 3,536,249 $ 3,555,971 -2.2% Commercial real estate - owner occupied 2,107,333 2,067,087 7.8% Other Commercial 494,084 389,190 107.8% Total Commercial & Industrial 6,137,666 6,012,248 8.3% Commercial real estate - non-owner occupied 3,497,929 3,455,125 5.0% Construction and land development 1,207,190 1,247,939 -13.1% Multifamily real estate 731,582 717,719 7.7% Residential 1-4 Family - Commercial 696,944 715,384 -10.3% Total CRE & Construction 6,133,645 6,136,167 -0.2% Total Commercial Loans 12,271,311 12,148,415 4.0% Residential 1-4 Family - Consumer 830,144 841,051 -5.2% Residential 1-4 Family - Revolving 618,320 627,765 -6.0% Auto 387,417 380,053 7.8% Consumer 276,023 311,362 -45.4% Total Consumer Loans 2,111,904 2,160,231 -8.9% Total Loans Held for Investment 14,383,215 14,308,646 2.1% Less: PPP Loans 1,600,577 1,598,718 0.5% Total Loans Held for Investment, ex PPP $ 12,782,638 $ 12,709,928 2.3% Average Loan Yield 3.84% 4.13% Deposit Growth (Dollars in thousands) 3Q2020 2Q2020 Annualized Growth NOW accounts 3,460,480 3,618,523 -17.5% Money market accounts 4,269,696 4,158,325 10.7% Savings accounts 861,685 824,164 18.2% Time deposits > $250,000 633,252 689,693 -32.7% Other time deposits 1,930,320 1,968,474 -7.8% Total Time deposits 2,563,572 2,658,167 -14.2% Total interest-bearing deposits 11,155,433 11,259,179 -3.7% Demand deposits 4,420,665 4,345,960 6.9% Total deposits $15,576,098 $15,605,139 -0.7% Average Cost of Deposits 0.39% 0.53% Loan to Deposit Ratio 92.3% 91.7% |
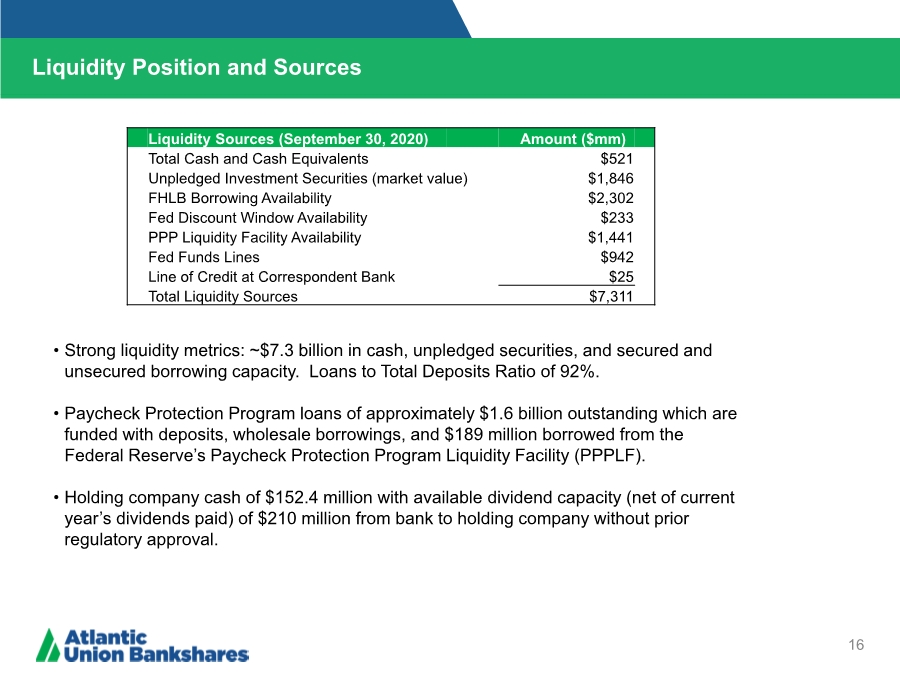
| Liquidity Position and Sources 16 • Strong liquidity metrics: ~$7.3 billion in cash, unpledged securities, and secured and unsecured borrowing capacity. Loans to Total Deposits Ratio of 92%. • Paycheck Protection Program loans of approximately $1.6 billion outstanding which are funded with deposits, wholesale borrowings, and $189 million borrowed from the Federal Reserve’s Paycheck Protection Program Liquidity Facility (PPPLF). • Holding company cash of $152.4 million with available dividend capacity (net of current year’s dividends paid) of $210 million from bank to holding company without prior regulatory approval. Liquidity Sources (September 30, 2020) Amount ($mm) Total Cash and Cash Equivalents $521 Unpledged Investment Securities (market value) $1,846 FHLB Borrowing Availability $2,302 Fed Discount Window Availability $233 PPP Liquidity Facility Availability $1,441 Fed Funds Lines $942 Line of Credit at Correspondent Bank $25 Total Liquidity Sources $7,311 |
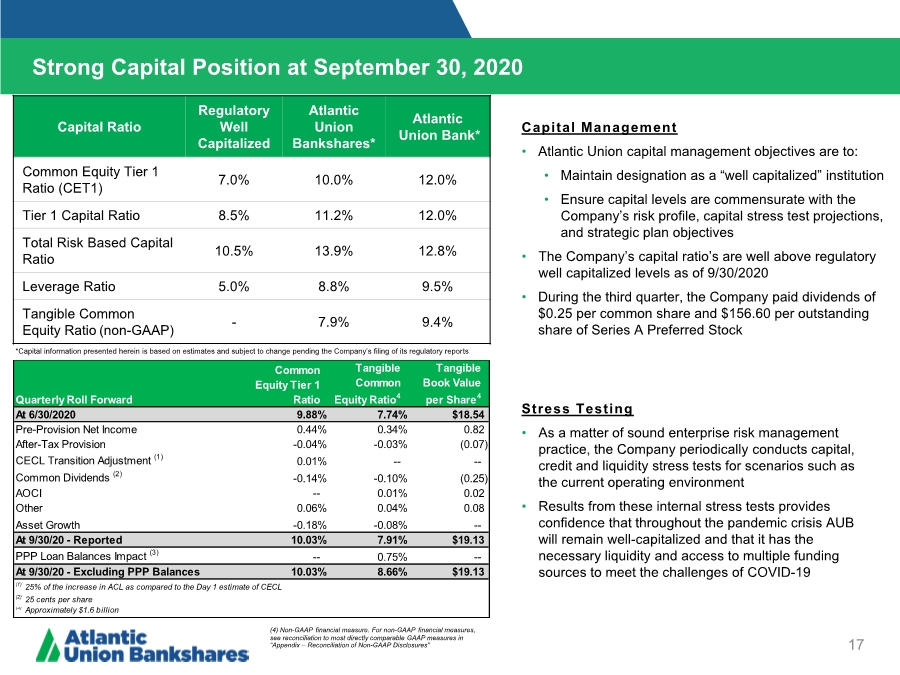
| Strong Capital Position at September 30, 2020 17 Capital Ratio Regulatory Well Capitalized Atlantic Union Bankshares* Atlantic Union Bank* Common Equity Tier 1 Ratio (CET1) 7.0% 10.0% 12.0% Tier 1 Capital Ratio 8.5% 11.2% 12.0% Total Risk Based Capital Ratio 10.5% 13.9% 12.8% Leverage Ratio 5.0% 8.8% 9.5% Tangible Common Equity Ratio (non-GAAP) - 7.9% 9.4% *Capital information presented herein is based on estimates and subject to change pending the Company’s filing of its regulatory reports Stress Testing • As a matter of sound enterprise risk management practice, the Company periodically conducts capital, credit and liquidity stress tests for scenarios such as the current operating environment • Results from these internal stress tests provides confidence that throughout the pandemic crisis AUB will remain well-capitalized and that it has the necessary liquidity and access to multiple funding sources to meet the challenges of COVID-19 Capital Management • Atlantic Union capital management objectives are to: • Maintain designation as a “well capitalized” institution • Ensure capital levels are commensurate with the Company’s risk profile, capital stress test projections, and strategic plan objectives • The Company’s capital ratio’s are well above regulatory well capitalized levels as of 9/30/2020 • During the third quarter, the Company paid dividends of $0.25 per common share and $156.60 per outstanding share of Series A Preferred Stock (4) Non-GAAP financial measure. For non-GAAP financial measures, see reconciliation to most directly comparable GAAP measures in “Appendix – Reconciliation of Non-GAAP Disclosures” Quarterly Roll Forward Common Equity Tier 1 Ratio Tangible Common Equity Ratio4 Tangible Book Value per Share4 At 6/30/2020 9.88% 7.74% $18.54 Pre-Provision Net Income 0.44% 0.34% 0.82 After-Tax Provision -0.04% -0.03% (0.07) CECL Transition Adjustment (1) 0.01% -- -- Common Dividends (2) -0.14% -0.10% (0.25) AOCI -- 0.01% 0.02 Other 0.06% 0.04% 0.08 Asset Growth -0.18% -0.08% -- At 9/30/20 - Reported 10.03% 7.91% $19.13 PPP Loan Balances Impact (3) -- 0.75% -- At 9/30/20 - Excluding PPP Balances 10.03% 8.66% $19.13 (1) 25% of the increase in ACL as compared to the Day 1 estimate of CECL (2) 25 cents per share (3) Approximately $1.6 billion |
| Appendix |
| Reconciliation of Non-GAAP Disclosures 19 Operating Earnings Per Share The Company has provided supplemental performance measures on a tax-equivalent, tangible, operating, or pre- tax pre-provision basis. These non-GAAP financial measures are a supplement to GAAP, which is used to prepare the Company’s financial statements, and should not be considered in isolation or as a substitute for comparable measures calculated in accordance with GAAP. In addition, the Company’s non-GAAP financial measures may not be comparable to non-GAAP financial measures of other companies. The Company uses the non-GAAP financial measures discussed herein in its analysis of the Company’s performance. The Company’s management believes that these non-GAAP financial measures provide additional understanding of ongoing operations, enhance comparability of results of operations with prior periods and show the effects of significant gains and charges in the periods presented without the impact of items or events that may obscure trends in the Company’s underlying performance. |
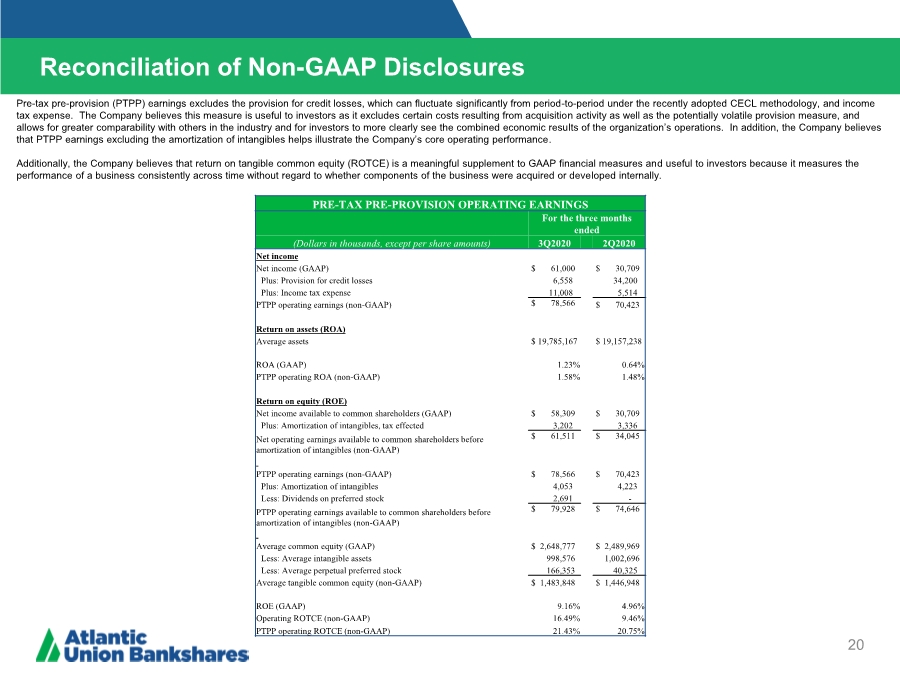
| Reconciliation of Non-GAAP Disclosures 20 Operating Earnings Per Share Pre-tax pre-provision (PTPP) earnings excludes the provision for credit losses, which can fluctuate significantly from period-to-period under the recently adopted CECL methodology, and income tax expense. The Company believes this measure is useful to investors as it excludes certain costs resulting from acquisition activity as well as the potentially volatile provision measure, and allows for greater comparability with others in the industry and for investors to more clearly see the combined economic results of the organization’s operations. In addition, the Company believes that PTPP earnings excluding the amortization of intangibles helps illustrate the Company’s core operating performance. Additionally, the Company believes that return on tangible common equity (ROTCE) is a meaningful supplement to GAAP financial measures and useful to investors because it measures the performance of a business consistently across time without regard to whether components of the business were acquired or developed internally. PRE-TAX PRE-PROVISION OPERATING EARNINGS For the three months ended (Dollars in thousands, except per share amounts) 3Q2020 2Q2020 Net income Net income (GAAP) $ 61,000 $ 30,709 Plus: Provision for credit losses 6,558 34,200 Plus: Income tax expense 11,008 5,514 PTPP operating earnings (non-GAAP) $ 78,566 $ 70,423 Return on assets (ROA) Average assets $ 19,785,167 $ 19,157,238 ROA (GAAP) 1.23% 0.64% PTPP operating ROA (non-GAAP) 1.58% 1.48% Return on equity (ROE) Net income available to common shareholders (GAAP) $ 58,309 $ 30,709 Plus: Amortization of intangibles, tax effected 3,202 3,336 Net operating earnings available to common shareholders before amortization of intangibles (non-GAAP) $ 61,511 $ 34,045 PTPP operating earnings (non-GAAP) $ 78,566 $ 70,423 Plus: Amortization of intangibles 4,053 4,223 Less: Dividends on preferred stock 2,691 - PTPP operating earnings available to common shareholders before amortization of intangibles (non-GAAP) $ 79,928 $ 74,646 Average common equity (GAAP) $ 2,648,777 $ 2,489,969 Less: Average intangible assets 998,576 1,002,696 Less: Average perpetual preferred stock 166,353 40,325 Average tangible common equity (non-GAAP) $ 1,483,848 $ 1,446,948 ROE (GAAP) 9.16% 4.96% Operating ROTCE (non-GAAP) 16.49% 9.46% PTPP operating ROTCE (non-GAAP) 21.43% 20.75% |
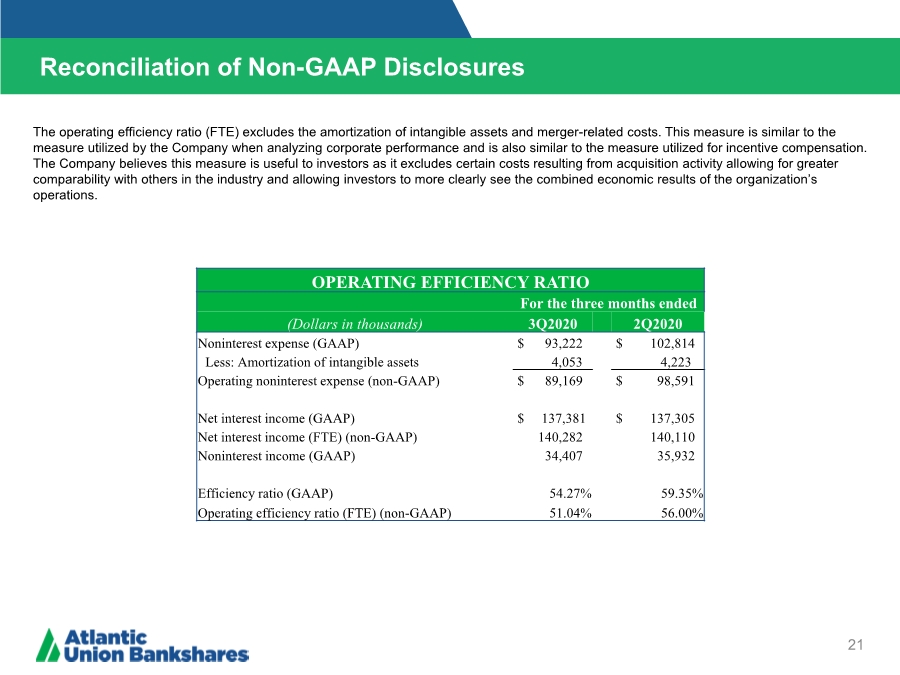
| Reconciliation of Non-GAAP Disclosures 21 Operating Earnings Per Share The operating efficiency ratio (FTE) excludes the amortization of intangible assets and merger-related costs. This measure is similar to the measure utilized by the Company when analyzing corporate performance and is also similar to the measure utilized for incentive compensation. The Company believes this measure is useful to investors as it excludes certain costs resulting from acquisition activity allowing for greater comparability with others in the industry and allowing investors to more clearly see the combined economic results of the organization’s operations. OPERATING EFFICIENCY RATIO For the three months ended (Dollars in thousands) 3Q2020 2Q2020 Noninterest expense (GAAP) $ 93,222 $ 102,814 Less: Amortization of intangible assets 4,053 4,223 Operating noninterest expense (non-GAAP) $ 89,169 $ 98,591 Net interest income (GAAP) $ 137,381 $ 137,305 Net interest income (FTE) (non-GAAP) 140,282 140,110 Noninterest income (GAAP) 34,407 35,932 Efficiency ratio (GAAP) 54.27% 59.35% Operating efficiency ratio (FTE) (non-GAAP) 51.04% 56.00% |
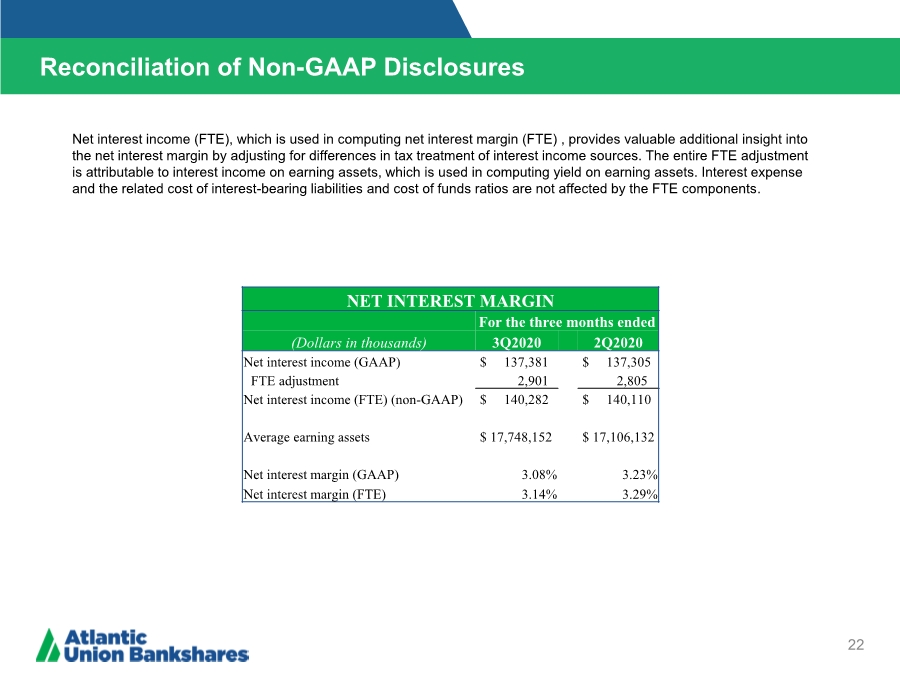
| Reconciliation of Non-GAAP Disclosures 22 Operating Earnings Per Share Net interest income (FTE), which is used in computing net interest margin (FTE) , provides valuable additional insight into the net interest margin by adjusting for differences in tax treatment of interest income sources. The entire FTE adjustment is attributable to interest income on earning assets, which is used in computing yield on earning assets. Interest expense and the related cost of interest-bearing liabilities and cost of funds ratios are not affected by the FTE components. NET INTEREST MARGIN For the three months ended (Dollars in thousands) 3Q2020 2Q2020 Net interest income (GAAP) $ 137,381 $ 137,305 FTE adjustment 2,901 2,805 Net interest income (FTE) (non-GAAP) $ 140,282 $ 140,110 Average earning assets $ 17,748,152 $ 17,106,132 Net interest margin (GAAP) 3.08% 3.23% Net interest margin (FTE) 3.14% 3.29% |
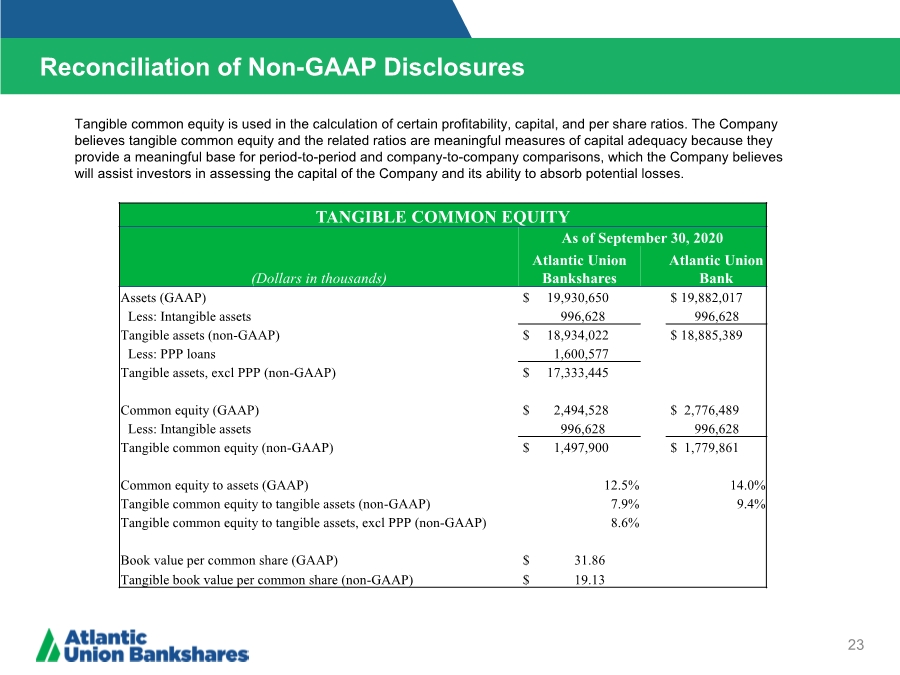
| Reconciliation of Non-GAAP Disclosures 23 Operating Earnings Per Share Tangible common equity is used in the calculation of certain profitability, capital, and per share ratios. The Company believes tangible common equity and the related ratios are meaningful measures of capital adequacy because they provide a meaningful base for period-to-period and company-to-company comparisons, which the Company believes will assist investors in assessing the capital of the Company and its ability to absorb potential losses. TANGIBLE COMMON EQUITY As of September 30, 2020 (Dollars in thousands) Atlantic Union Bankshares Atlantic Union Bank Assets (GAAP) $ 19,930,650 $ 19,882,017 Less: Intangible assets 996,628 996,628 Tangible assets (non-GAAP) $ 18,934,022 $ 18,885,389 Less: PPP loans 1,600,577 Tangible assets, excl PPP (non-GAAP) $ 17,333,445 Common equity (GAAP) $ 2,494,528 $ 2,776,489 Less: Intangible assets 996,628 996,628 Tangible common equity (non-GAAP) $ 1,497,900 $ 1,779,861 Common equity to assets (GAAP) 12.5% 14.0% Tangible common equity to tangible assets (non-GAAP) 7.9% 9.4% Tangible common equity to tangible assets, excl PPP (non-GAAP) 8.6% Book value per common share (GAAP) $ 31.86 Tangible book value per common share (non-GAAP) $ 19.13 |
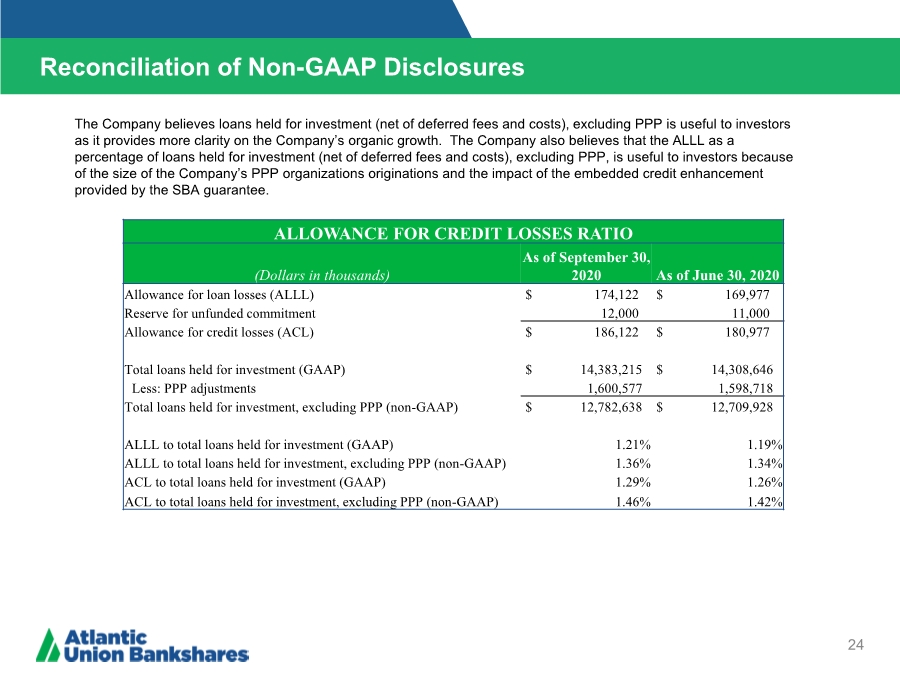
| Reconciliation of Non-GAAP Disclosures 24 ($ IN THOUSANDS) Operating Earnings Per Share The Company believes loans held for investment (net of deferred fees and costs), excluding PPP is useful to investors as it provides more clarity on the Company’s organic growth. The Company also believes that the ALLL as a percentage of loans held for investment (net of deferred fees and costs), excluding PPP, is useful to investors because of the size of the Company’s PPP organizations originations and the impact of the embedded credit enhancement provided by the SBA guarantee. ALLOWANCE FOR CREDIT LOSSES RATIO (Dollars in thousands) As of September 30, 2020 As of June 30, 2020 Allowance for loan losses (ALLL) $ 174,122 $ 169,977 Reserve for unfunded commitment 12,000 11,000 Allowance for credit losses (ACL) $ 186,122 $ 180,977 Total loans held for investment (GAAP) $ 14,383,215 $ 14,308,646 Less: PPP adjustments 1,600,577 1,598,718 Total loans held for investment, excluding PPP (non-GAAP) $ 12,782,638 $ 12,709,928 ALLL to total loans held for investment (GAAP) 1.21% 1.19% ALLL to total loans held for investment, excluding PPP (non-GAAP) 1.36% 1.34% ACL to total loans held for investment (GAAP) 1.29% 1.26% ACL to total loans held for investment, excluding PPP (non-GAAP) 1.46% 1.42% |
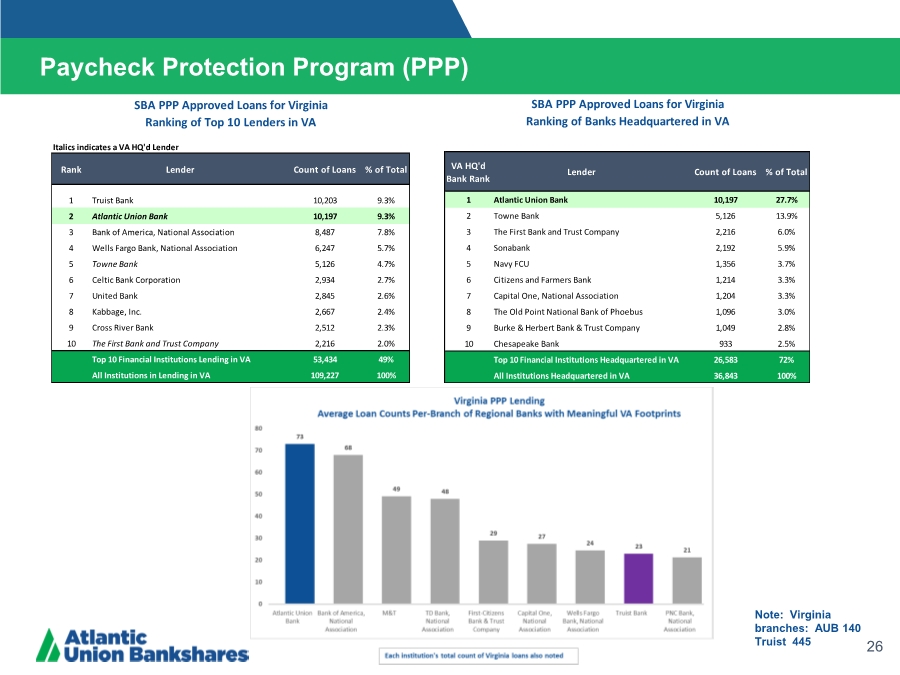
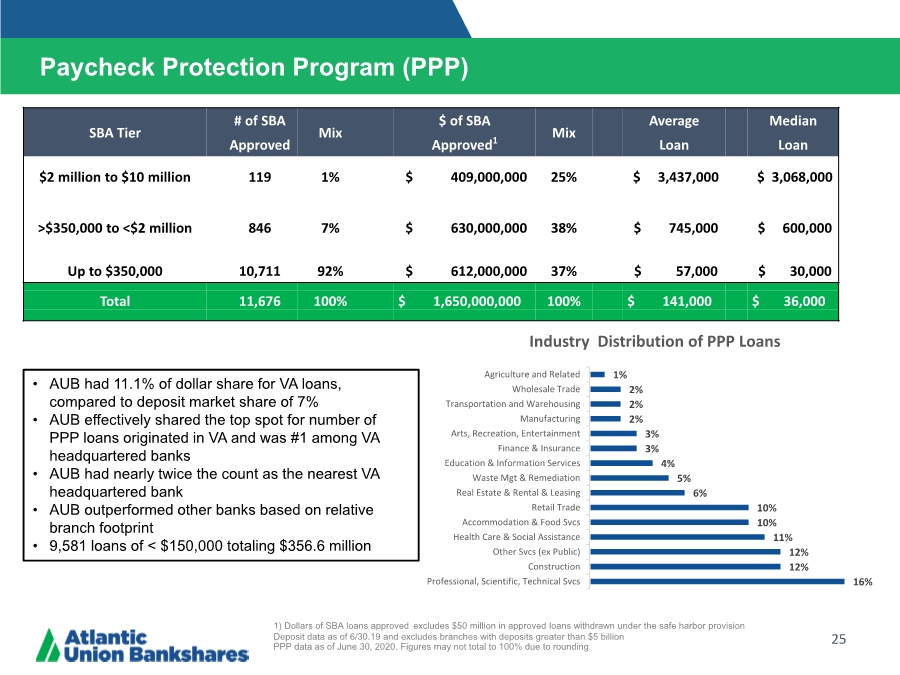
| 25 Paycheck Protection Program (PPP) • AUB had 11.1% of dollar share for VA loans, compared to deposit market share of 7% • AUB effectively shared the top spot for number of PPP loans originated in VA and was #1 among VA headquartered banks • AUB had nearly twice the count as the nearest VA headquartered bank • AUB outperformed other banks based on relative branch footprint • 9,581 loans of < $150,000 totaling $356.6 million 1) Dollars of SBA loans approved excludes $50 million in approved loans withdrawn under the safe harbor provision Deposit data as of 6/30.19 and excludes branches with deposits greater than $5 billion PPP data as of June 30, 2020. Figures may not total to 100% due to rounding 16% 12% 12% 11% 10% 10% 6% 5% 4% 3% 3% 2% 2% 2% 1% Professional, Scientific, Technical Svcs Construction Other Svcs (ex Public) Health Care & Social Assistance Accommodation & Food Svcs Retail Trade Real Estate & Rental & Leasing Waste Mgt & Remediation Education & Information Services Finance & Insurance Arts, Recreation, Entertainment Manufacturing Transportation and Warehousing Wholesale Trade Agriculture and Related Industry Distribution of PPP Loans SBA Tier # of SBA Mix $ of SBA Mix Average Median Approved Approved1 Loan Loan $2 million to $10 million 119 1% $ 409,000,000 25% $ 3,437,000 $ 3,068,000 >$350,000 to <$2 million 846 7% $ 630,000,000 38% $ 745,000 $ 600,000 Up to $350,000 10,711 92% $ 612,000,000 37% $ 57,000 $ 30,000 Total 11,676 100% $ 1,650,000,000 100% $ 141,000 $ 36,000 |
| 26 Paycheck Protection Program (PPP) Note: Virginia branches: AUB 140 Truist 445 Italics indicates a VA HQ'd Lender Rank Lender Count of Loans % of Total 1 Truist Bank 10,203 9.3% 2 Atlantic Union Bank 10,197 9.3% 3 Bank of America, National Association 8,487 7.8% 4 Wells Fargo Bank, National Association 6,247 5.7% 5 Towne Bank 5,126 4.7% 6 Celtic Bank Corporation 2,934 2.7% 7 United Bank 2,845 2.6% 8 Kabbage, Inc. 2,667 2.4% 9 Cross River Bank 2,512 2.3% 10 The First Bank and Trust Company 2,216 2.0% Top 10 Financial Institutions Lending in VA 53,434 49% All Institutions in Lending in VA 109,227 100% SBA PPP Approved Loans for Virginia Ranking of Top 10 Lenders in VA VA HQ'd Bank Rank Lender Count of Loans % of Total 1 Atlantic Union Bank 10,197 27.7% 2 Towne Bank 5,126 13.9% 3 The First Bank and Trust Company 2,216 6.0% 4 Sonabank 2,192 5.9% 5 Navy FCU 1,356 3.7% 6 Citizens and Farmers Bank 1,214 3.3% 7 Capital One, National Association 1,204 3.3% 8 The Old Point National Bank of Phoebus 1,096 3.0% 9 Burke & Herbert Bank & Trust Company 1,049 2.8% 10 Chesapeake Bank 933 2.5% Top 10 Financial Institutions Headquartered in VA 26,583 72% All Institutions Headquartered in VA 36,843 100% SBA PPP Approved Loans for Virginia Ranking of Banks Headquartered in VA |