| Investor Presentation Nasdaq: AUB August – September 2020 |

| Forward Looking Statements 2 Certain statements in this presentation may constitute “forward-looking statements” within the meaning of the Private Securities Litigation Reform Act of 1995. Forward-looking statements are statements that include, without limitation, projections, predictions, expectations or beliefs about future events or results that are not statements of historical fact. Such forward-looking statements are based on various assumptions as of the time they are made, and are inherently subject to known and unknown risks, uncertainties, and other factors, some of which cannot be predicted or quantified, that may cause actual results, performance or achievements to be materially different from those expressed or implied by such forward- looking statements. Forward-looking statements are often accompanied by words that convey projected future events or outcomes such as “expect,” “believe,” “estimate,” “plan,” “project,” “anticipate,” “intend,” “will,” “may,” “view,” “opportunity,” “potential,” or words of similar meaning or other statements concerning opinions or judgment of Atlantic Union Bankshares Corporation (“Atlantic Union” or the “Company”) and its management about future events. Although Atlantic Union believes that its expectations with respect to forward-looking statements are based upon reasonable assumptions within the bounds of its existing knowledge of its business and operations, there can be no assurance that actual results, performance, or achievements of, or trends affecting, the Company will not differ materially from any projected future results, performance, or achievements or trends expressed or implied by such forward-looking statements. Actual future results, performance, achievements or trends may differ materially from historical results or those anticipated depending on a variety of factors, including, but not limited to: • changes in interest rates; • general economic and financial market conditions, in the United States generally and particularly in the markets in which the Company operates and which its loans are concentrated, including the effects of declines in real estate values, an increase in unemployment levels and slowdowns in economic growth, including as a result of COVID- 19; • the quality or composition of the loan or investment portfolios and changes therein; • demand for loan products and financial services in the Company’s market area; • the Company’s ability to manage its growth or implement its growth strategy; • planned branch consolidations; • the introduction of new lines of business or new products and services; • the Company’s ability to recruit and retain key employees; • the incremental cost and/or decreased revenues associated with exceeding $10 billion in assets; • real estate values in the Bank’s lending area; • an insufficient ACL; • changes in accounting principles relating to loan loss recognition (CECL); • the Company’s liquidity and capital positions; • concentrations of loans secured by real estate, particularly commercial real estate; • the effectiveness of the Company’s credit processes and management of the Company’s credit risk; • the Company’s ability to compete in the market for financial services; • technological risks and developments, and cyber threats, attacks, or events; • the potential adverse effects of unusual and infrequently occurring events, such as weather-related disasters, terrorist acts or public health events (such as COVID-19), and of governmental and societal responses thereto; these potential adverse effects may include, without limitation, adverse effects on the ability of the Company's borrowers to satisfy their obligations to the Company, on the value of collateral securing loans, on the demand for the Company's loans or its other products and services, on incidents of cyberattack and fraud, on the Company’s liquidity or capital positions, on risks posed by reliance on third- party service providers, on other aspects of the Company's business operations and on financial markets and economic growth; • the effect of steps the Company takes in response to COVID-19, the severity and duration of the pandemic, including whether there is a “second wave” as a result of the loosening of governmental restrictions, the pace of recovery when the pandemic subsides and the heightened impact it has on many of the risks described herein; • performance by the Company’s counterparties or vendors; • deposit flows; • the availability of financing and the terms thereof; • the level of prepayments on loans and mortgage-backed securities; • legislative or regulatory changes and requirements, including the impact of the CARES Act and other legislative and regulatory reactions to COVID-19; • potential claims, damages, and fines related to litigation or government actions, including litigation or actions arising from the Company’s participation in and administration of programs related to COVID-19, including, among other things, the CARES Act; • the effects of changes in federal, state or local tax laws and regulations; • monetary and fiscal policies of the U.S. government including policies of the U.S. Department of the Treasury and the Federal Reserve; • changes to applicable accounting principles and guidelines; and • other factors, many of which are beyond the control of the Company Please refer to the “Risk Factors” and “Management’s Discussion and Analysis of Financial Condition and Results of Operations” sections of the Company’s Annual Report on Form 10-K for the year ended December 31, 2019, comparable “Risk Factors” sections of the Company’s Quarterly Reports on Form 10-Q, and related disclosures in other filings, which have been filed with the Securities and Exchange Commission (the “SEC”), and are available on the SEC’s website at www.sec.gov. All of the forward-looking statements made in this presentation are expressly qualified by the cautionary statements contained or referred to herein. The actual results or developments anticipated may not be realized or, even if substantially realized, they may not have the expected consequences to or effects on the Company or its businesses or operations. You are cautioned not to rely too heavily on the forward-looking statements contained in this presentation. Forward-looking statements speak only as of the date they are made and the Company does not undertake any obligation to update, revise or clarify these forward-looking statements, whether as a result of new information, future events or otherwise. |
| Additional Information 3 Financial Information This presentation contains financial information about the Company as of June 30, 2020 and the Company’s COVID-19 loan modification program as of August 28, 2020. Nothing contained in this presentation shall imply that the information contained herein will be correct as of any future date or that there has been no change in the information after the date thereof. Nothing contained in this presentation is or should be relied upon as a promise or representation as to future performance. The Company undertakes no obligation to update or revise this presentation after the date hereof. Annualized, pro forma, projected and estimated numbers contained in this presentation are used for illustrative purpose only, are not forecasts and may not reflect actual results. The information presented as of June 30, 2020 and August 28, 2020 may not be indicative of the Company’s financial condition or results as of or for the quarter ended September 30, 2020 or the year ended December 31, 2020, including because the events, factors and trends that have affected the Company’s results as of and through June 30, 2020 and August 28, 2020 may significantly change or not continue. Unaudited Pro Forma Financial Information Any unaudited pro forma financial information included in, or discussed in connection with this presentation, is presented for informational purposes only and does not necessarily reflect the financial results of the combined company had the companies actually been combined during periods presented. The adjustments included in any such unaudited pro forma financial information are preliminary and may be significantly revised and may not agree to actual amounts finally recorded by Atlantic Union. This financial information does not reflect the benefits of the Access merger’s expected cost savings and expense efficiencies, opportunities to earn additional revenue, potential impacts of current market conditions on revenues or asset dispositions, among other factors, and includes various preliminary estimates and may not necessarily be indicative of the financial position or results of operations that would have occurred if the merger had been completed on the date or at the beginning of the period indicated or which may be attained in the future. Non-GAAP Financial Measures This presentation contains certain financial information determined by methods other than in accordance with generally accepted accounting principles in the United States (“GAAP”). These non-GAAP disclosures have limitations as an analytical tool and should not be considered in isolation or as a substitute for analysis of our results as reported under GAAP, nor are they necessarily comparable to non-GAAP performance measures that may be presented by other companies. The Company uses the non-GAAP financial measures discussed herein in its analysis of the Company’s performance. The Company’s management believes that these non-GAAP financial measures provide additional understanding of ongoing operations, enhance comparability of results of operations with prior periods and show the effects of significant gains and charges in the periods presented without the impact of items or events that may obscure trends in the Company’s underlying performance. Please see “Reconciliation of Non-GAAP Disclosures” at the end of this presentation for a reconciliation to the nearest GAAP financial measure. No Offer or Solicitation This presentation does not constitute an offer to sell or a solicitation of an offer to buy any securities. No offer of securities shall be made except by means of a prospectus meeting the requirements of the Securities Act of 1933, as amended, and no offer to sell or solicitation of an offer to buy shall be made in any jurisdiction in which such offer, solicitation or sale would be unlawful. About Atlantic Union Bankshares Corporation Headquartered in Richmond, Virginia, Atlantic Union Bankshares Corporation (Nasdaq: AUB) is the holding company for Atlantic Union Bank. Atlantic Union Bank has 149 branches and approximately 170 ATMs located throughout Virginia, and in portions of Maryland and North Carolina. Middleburg Financial is a brand name used by Atlantic Union Bank and certain affiliates when providing trust, wealth management, private banking, and investment advisory products and services. Certain non-bank affiliates of Atlantic Union Bank include: Old Dominion Capital Management, Inc., and its subsidiary, Outfitter Advisors, Ltd., Dixon, Hubard, Feinour & Brown, Inc., and Middleburg Investment Services, LLC, which provide investment advisory and/or brokerage services; and Union Insurance Group, LLC, which offers various lines of insurance products. |
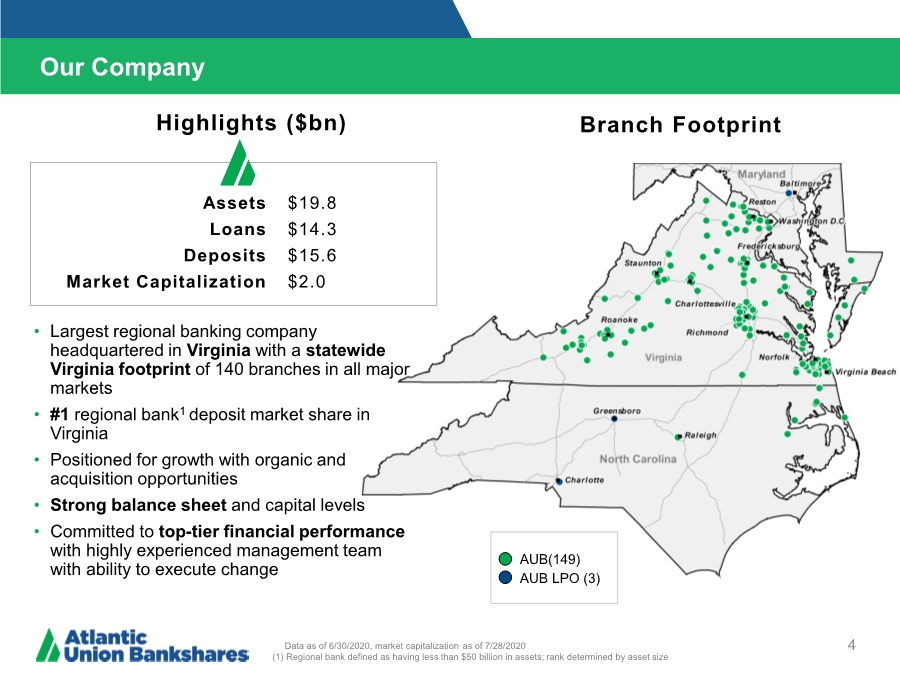
| Our Company 4 Branch Footprint Data as of 6/30/2020, market capitalization as of 7/28/2020 (1) Regional bank defined as having less than $50 billion in assets; rank determined by asset size Assets Loans Deposits Market Capitalization $19.8 $14.3 $15.6 $2.0 • Largest regional banking company headquartered in Virginia with a statewide Virginia footprint of 140 branches in all major markets •#1 regional bank1 deposit market share in Virginia • Positioned for growth with organic and acquisition opportunities • Strong balance sheet and capital levels • Committed to top-tier financial performance with highly experienced management team with ability to execute change Highlights ($bn) AUB(149) AUB LPO (3) |
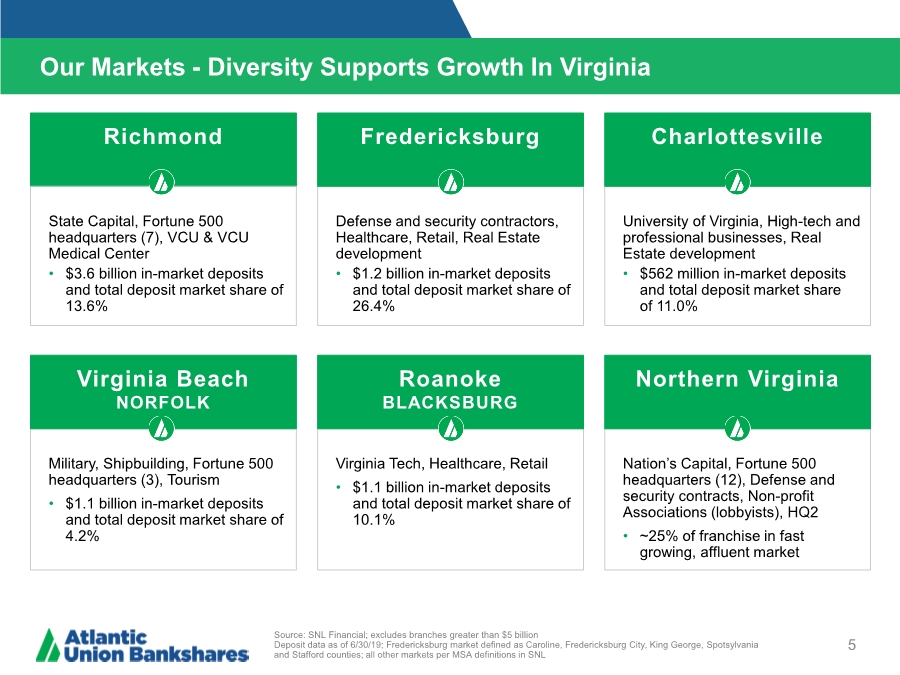
| Richmond Our Markets - Diversity Supports Growth In Virginia 5 Source: SNL Financial; excludes branches greater than $5 billion Deposit data as of 6/30/19; Fredericksburg market defined as Caroline, Fredericksburg City, King George, Spotsylvania and Stafford counties; all other markets per MSA definitions in SNL State Capital, Fortune 500 headquarters (7), VCU & VCU Medical Center • $3.6 billion in-market deposits and total deposit market share of 13.6% Defense and security contractors, Healthcare, Retail, Real Estate development • $1.2 billion in-market deposits and total deposit market share of 26.4% Fredericksburg University of Virginia, High-tech and professional businesses, Real Estate development • $562 million in-market deposits and total deposit market share of 11.0% Charlottesville Military, Shipbuilding, Fortune 500 headquarters (3), Tourism • $1.1 billion in-market deposits and total deposit market share of 4.2% Virginia Tech, Healthcare, Retail • $1.1 billion in-market deposits and total deposit market share of 10.1% Nation’s Capital, Fortune 500 headquarters (12), Defense and security contracts, Non-profit Associations (lobbyists), HQ2 • ~25% of franchise in fast growing, affluent market Virginia Beach NORFOLK Roanoke BLACKSBURG Northern Virginia |
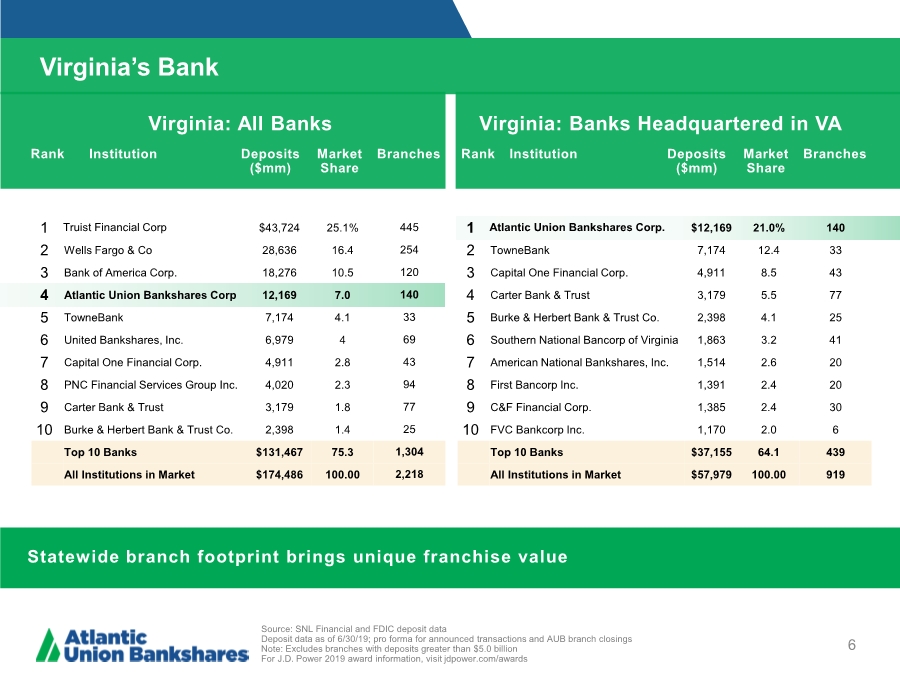
| Virginia’s Bank 6 Virginia: All Banks Virginia: Banks Headquartered in VA Rank Institution Deposits ($mm) Market Share Branches 1 Truist Financial Corp $43,724 25.1% 445 2 Wells Fargo & Co 28,636 16.4 254 3 Bank of America Corp. 18,276 10.5 120 4 Atlantic Union Bankshares Corp 12,169 7.0 140 5 TowneBank 7,174 4.1 33 6 United Bankshares, Inc. 6,979 4 69 7 Capital One Financial Corp. 4,911 2.8 43 8 PNC Financial Services Group Inc. 4,020 2.3 94 9 Carter Bank & Trust 3,179 1.8 77 10 Burke & Herbert Bank & Trust Co. 2,398 1.4 25 Top 10 Banks $131,467 75.3 1,304 All Institutions in Market $174,486 100.00 2,218 Rank Institution Deposits ($mm) Market Share Branches 1 Atlantic Union Bankshares Corp. $12,169 21.0% 140 2 TowneBank 7,174 12.4 33 3 Capital One Financial Corp. 4,911 8.5 43 4 Carter Bank & Trust 3,179 5.5 77 5 Burke & Herbert Bank & Trust Co. 2,398 4.1 25 6 Southern National Bancorp of Virginia 1,863 3.2 41 7 American National Bankshares, Inc. 1,514 2.6 20 8 First Bancorp Inc. 1,391 2.4 20 9 C&F Financial Corp. 1,385 2.4 30 10 FVC Bankcorp Inc. 1,170 2.0 6 Top 10 Banks $37,155 64.1 439 All Institutions in Market $57,979 100.00 919 Source: SNL Financial and FDIC deposit data Deposit data as of 6/30/19; pro forma for announced transactions and AUB branch closings Note: Excludes branches with deposits greater than $5.0 billion For J.D. Power 2019 award information, visit jdpower.com/awards Statewide branch footprint brings unique franchise value |
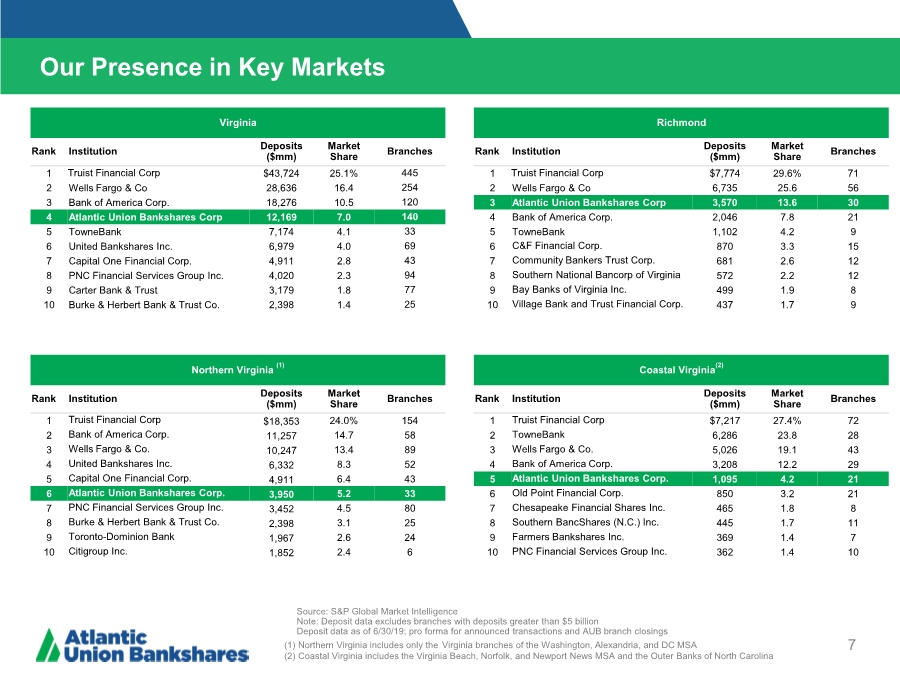
| Our Presence in Key Markets 7 Source: S&P Global Market Intelligence Note: Deposit data excludes branches with deposits greater than $5 billion Deposit data as of 6/30/19; pro forma for announced transactions and AUB branch closings (1) Northern Virginia includes only the Virginia branches of the Washington, Alexandria, and DC MSA (2) Coastal Virginia includes the Virginia Beach, Norfolk, and Newport News MSA and the Outer Banks of North Carolina Northern Virginia (1) Rank Institution Deposits ($mm) Market Share Branches 1 Truist Financial Corp $18,353 24.0% 154 2 Bank of America Corp. 11,257 14.7 58 3 Wells Fargo & Co. 10,247 13.4 89 4 United Bankshares Inc. 6,332 8.3 52 5 Capital One Financial Corp. 4,911 6.4 43 6 Atlantic Union Bankshares Corp. 3,950 5.2 33 7 PNC Financial Services Group Inc. 3,452 4.5 80 8 Burke & Herbert Bank & Trust Co. 2,398 3.1 25 9 Toronto-Dominion Bank 1,967 2.6 24 10 Citigroup Inc. 1,852 2.4 6 Virginia Rank Institution Deposits ($mm) Market Share Branches 1 Truist Financial Corp $43,724 25.1% 445 2 Wells Fargo & Co 28,636 16.4 254 3 Bank of America Corp. 18,276 10.5 120 4 Atlantic Union Bankshares Corp 12,169 7.0 140 5 TowneBank 7,174 4.1 33 6 United Bankshares Inc. 6,979 4.0 69 7 Capital One Financial Corp. 4,911 2.8 43 8 PNC Financial Services Group Inc. 4,020 2.3 94 9 Carter Bank & Trust 3,179 1.8 77 10 Burke & Herbert Bank & Trust Co. 2,398 1.4 25 Richmond Rank Institution Deposits ($mm) Market Share Branches 1 Truist Financial Corp $7,774 29.6% 71 2 Wells Fargo & Co 6,735 25.6 56 3 Atlantic Union Bankshares Corp 3,570 13.6 30 4 Bank of America Corp. 2,046 7.8 21 5 TowneBank 1,102 4.2 9 6 C&F Financial Corp. 870 3.3 15 7 Community Bankers Trust Corp. 681 2.6 12 8 Southern National Bancorp of Virginia 572 2.2 12 9 Bay Banks of Virginia Inc. 499 1.9 8 10 Village Bank and Trust Financial Corp. 437 1.7 9 Coastal Virginia(2) Rank Institution Deposits ($mm) Market Share Branches 1 Truist Financial Corp $7,217 27.4% 72 2 TowneBank 6,286 23.8 28 3 Wells Fargo & Co. 5,026 19.1 43 4 Bank of America Corp. 3,208 12.2 29 5 Atlantic Union Bankshares Corp. 1,095 4.2 21 6 Old Point Financial Corp. 850 3.2 21 7 Chesapeake Financial Shares Inc. 465 1.8 8 8 Southern BancShares (N.C.) Inc. 445 1.7 11 9 Farmers Bankshares Inc. 369 1.4 7 10 PNC Financial Services Group Inc. 362 1.4 10 |
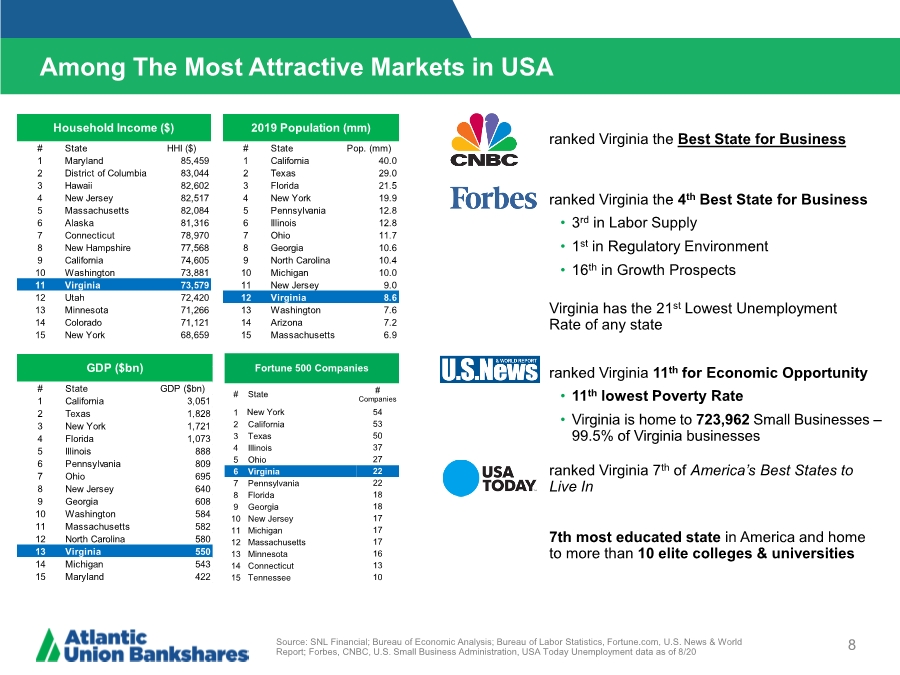
| Among The Most Attractive Markets in USA 8 Fortune 500 Companies # State # Companies 1 New York 54 2 California 53 3 Texas 50 4 Illinois 37 5 Ohio 27 6 Virginia 22 7 Pennsylvania 22 8 Florida 18 9 Georgia 18 10 New Jersey 17 11 Michigan 17 12 Massachusetts 17 13 Minnesota 16 14 Connecticut 13 15 Tennessee 10 • 3rd in Labor Supply • 1st in Regulatory Environment • 16th in Growth Prospects ranked Virginia the Best State for Business ranked Virginia the 4th Best State for Business Virginia has the 21st Lowest Unemployment Rate of any state • 11th lowest Poverty Rate • Virginia is home to 723,962 Small Businesses – 99.5% of Virginia businesses ranked Virginia 11th for Economic Opportunity ranked Virginia 7th of America’s Best States to Live In 7th most educated state in America and home to more than 10 elite colleges & universities Source: SNL Financial; Bureau of Economic Analysis; Bureau of Labor Statistics, Fortune.com, U.S. News & World Report; Forbes, CNBC, U.S. Small Business Administration, USA Today Unemployment data as of 8/20 # State Pop. (mm) 1 California 40.0 2 Texas 29.0 3 Florida 21.5 4 New York 19.9 5 Pennsylvania 12.8 6 Illinois 12.8 7 Ohio 11.7 8 Georgia 10.6 9 North Carolina 10.4 10 Michigan 10.0 11 New Jersey 9.0 12 Virginia 8.6 13 Washington 7.6 14 Arizona 7.2 15 Massachusetts 6.9 2019 Population (mm) # State HHI ($) 1 Maryland 85,459 2 District of Columbia 83,044 3 Hawaii 82,602 4 New Jersey 82,517 5 Massachusetts 82,084 6 Alaska 81,316 7 Connecticut 78,970 8 New Hampshire 77,568 9 California 74,605 10 Washington 73,881 11 Virginia 73,579 12 Utah 72,420 13 Minnesota 71,266 14 Colorado 71,121 15 New York 68,659 Household Income ($) # State GDP ($bn) 1 California 3,051 2 Texas 1,828 3 New York 1,721 4 Florida 1,073 5 Illinois 888 6 Pennsylvania 809 7 Ohio 695 8 New Jersey 640 9 Georgia 608 10 Washington 584 11 Massachusetts 582 12 North Carolina 580 13 Virginia 550 14 Michigan 543 15 Maryland 422 GDP ($bn) |
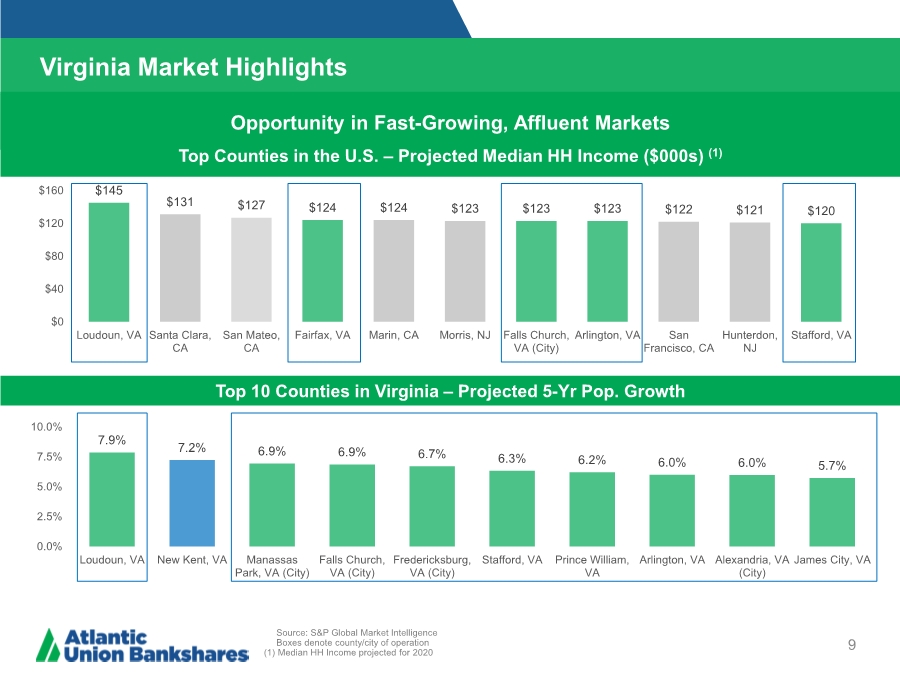
| 7.9% 7.2% 6.9% 6.9% 6.7% 6.3% 6.2% 6.0% 6.0% 5.7% 0.0% 2.5% 5.0% 7.5% 10.0% Loudoun, VA New Kent, VA Manassas Park, VA (City) Falls Church, VA (City) Fredericksburg, VA (City) Stafford, VA Prince William, VA Arlington, VA Alexandria, VA (City) James City, VA $145 $131 $127 $124 $124 $123 $123 $123 $122 $121 $120 $0 $40 $80 $120 $160 Loudoun, VA Santa Clara, CA San Mateo, CA Fairfax, VA Marin, CA Morris, NJ Falls Church, VA (City) Arlington, VA San Francisco, CA Hunterdon, NJ Stafford, VA Virginia Market Highlights 9 Source: S&P Global Market Intelligence Boxes denote county/city of operation (1) Median HH Income projected for 2020 Top 10 Counties in Virginia – Projected 5-Yr Pop. Growth Opportunity in Fast-Growing, Affluent Markets Top Counties in the U.S. – Projected Median HH Income ($000s) (1) |
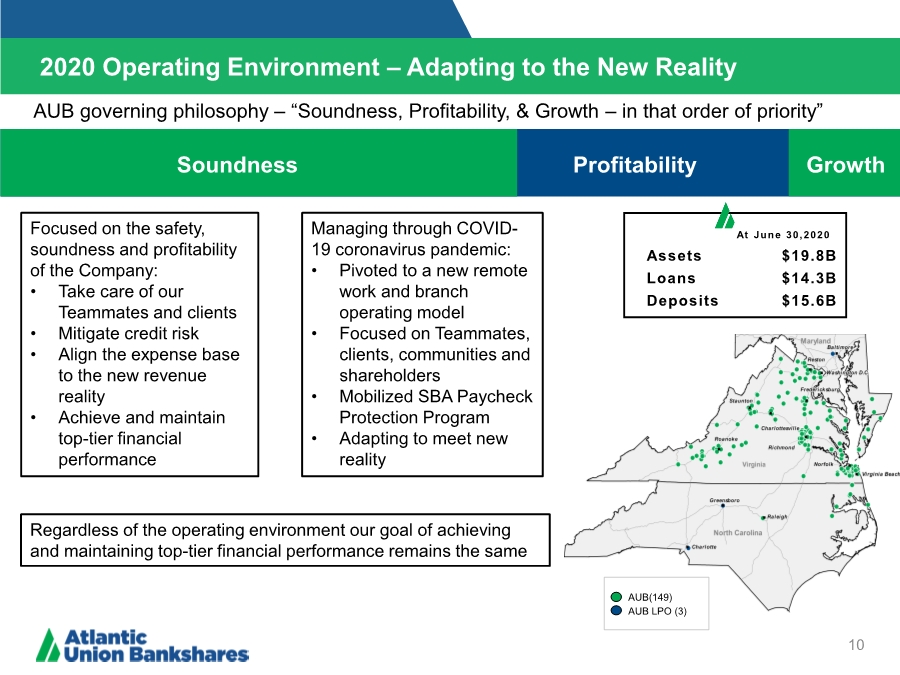
| 2020 Operating Environment – Adapting to the New Reality 10 Soundness Profitability Growth AUB(149) AUB LPO (3) At June 30,2020 Assets $19.8B Loans $14.3B Deposits $15.6B Managing through COVID- 19 coronavirus pandemic: • Pivoted to a new remote work and branch operating model • Focused on Teammates, clients, communities and shareholders • Mobilized SBA Paycheck Protection Program • Adapting to meet new reality AUB governing philosophy –“Soundness, Profitability, & Growth – in that order of priority” Focused on the safety, soundness and profitability of the Company: • Take care of our Teammates and clients • Mitigate credit risk • Align the expense base to the new revenue reality • Achieve and maintain top-tier financial performance Regardless of the operating environment our goal of achieving and maintaining top-tier financial performance remains the same |
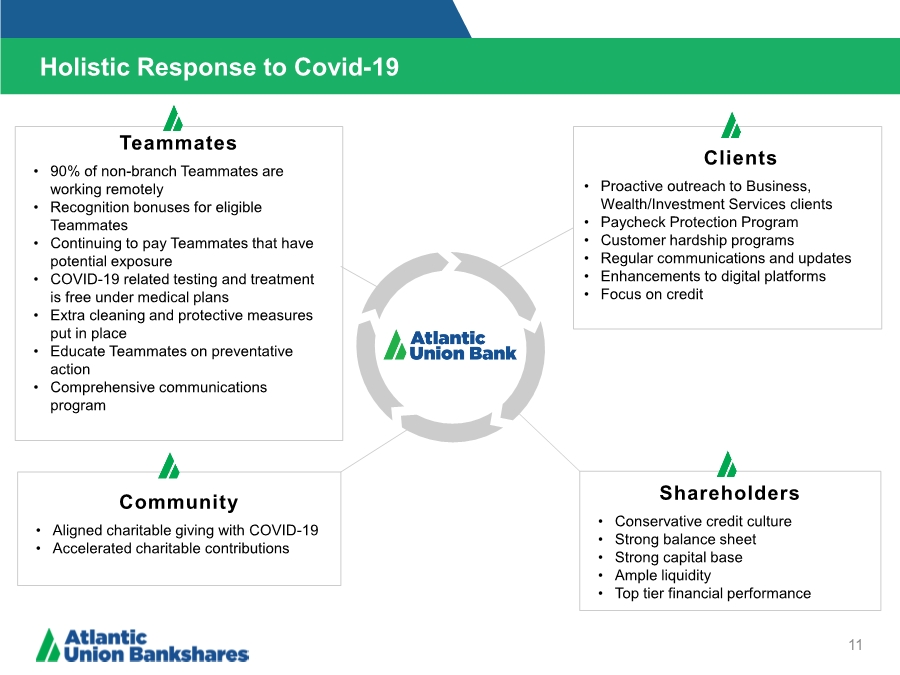
| Teammates • 90% of non-branch Teammates are working remotely • Recognition bonuses for eligible Teammates • Continuing to pay Teammates that have potential exposure • COVID-19 related testing and treatment is free under medical plans • Extra cleaning and protective measures put in place • Educate Teammates on preventative action • Comprehensive communications program Clients • Proactive outreach to Business, Wealth/Investment Services clients • Paycheck Protection Program • Customer hardship programs • Regular communications and updates • Enhancements to digital platforms • Focus on credit Shareholders • Conservative credit culture • Strong balance sheet • Strong capital base • Ample liquidity • Top tier financial performance Community • Aligned charitable giving with COVID-19 • Accelerated charitable contributions Holistic Response to Covid-19 11 |
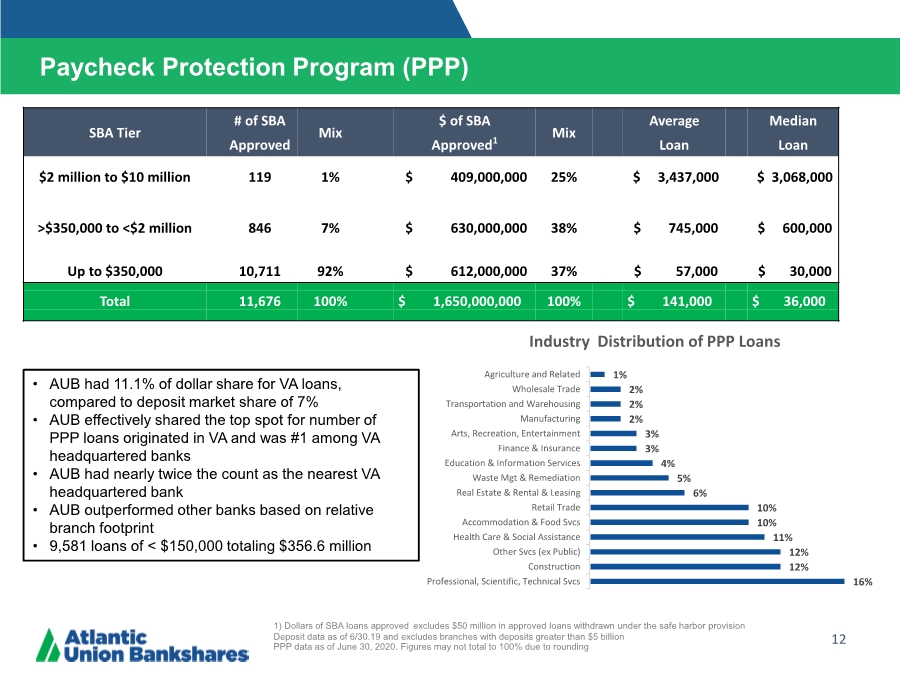
| 12 Paycheck Protection Program (PPP) • AUB had 11.1% of dollar share for VA loans, compared to deposit market share of 7% • AUB effectively shared the top spot for number of PPP loans originated in VA and was #1 among VA headquartered banks • AUB had nearly twice the count as the nearest VA headquartered bank • AUB outperformed other banks based on relative branch footprint • 9,581 loans of < $150,000 totaling $356.6 million 1) Dollars of SBA loans approved excludes $50 million in approved loans withdrawn under the safe harbor provision Deposit data as of 6/30.19 and excludes branches with deposits greater than $5 billion PPP data as of June 30, 2020. Figures may not total to 100% due to rounding 16% 12% 12% 11% 10% 10% 6% 5% 4% 3% 3% 2% 2% 2% 1% Professional, Scientific, Technical Svcs Construction Other Svcs (ex Public) Health Care & Social Assistance Accommodation & Food Svcs Retail Trade Real Estate & Rental & Leasing Waste Mgt & Remediation Education & Information Services Finance & Insurance Arts, Recreation, Entertainment Manufacturing Transportation and Warehousing Wholesale Trade Agriculture and Related Industry Distribution of PPP Loans SBA Tier # of SBA Mix $ of SBA Mix Average Median Approved Approved1 Loan Loan $2 million to $10 million 119 1% $ 409,000,000 25% $ 3,437,000 $ 3,068,000 >$350,000 to <$2 million 846 7% $ 630,000,000 38% $ 745,000 $ 600,000 Up to $350,000 10,711 92% $ 612,000,000 37% $ 57,000 $ 30,000 Total 11,676 100% $ 1,650,000,000 100% $ 141,000 $ 36,000 |
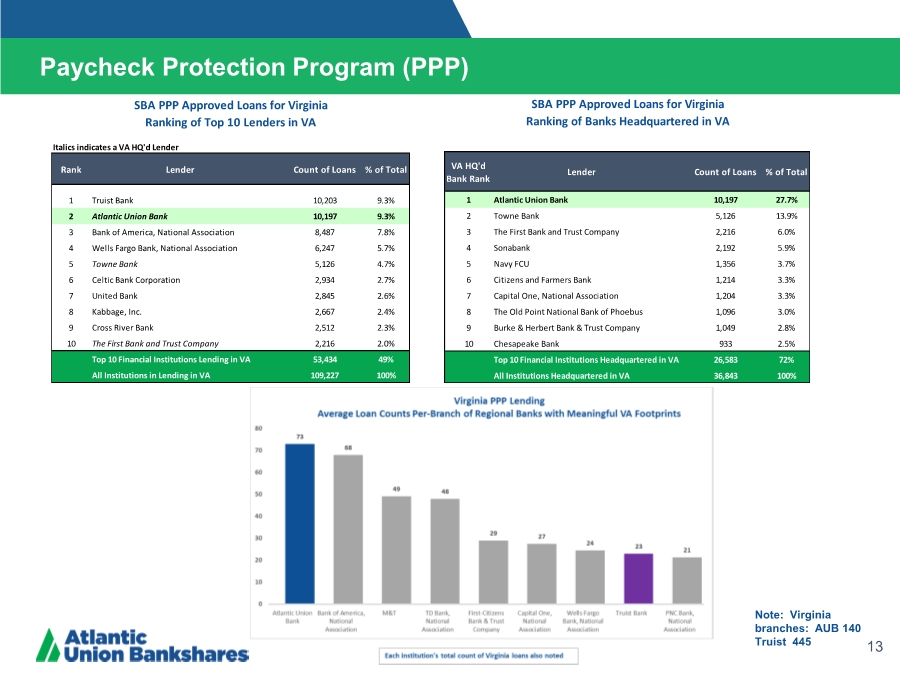
| 13 Paycheck Protection Program (PPP) Note: Virginia branches: AUB 140 Truist 445 Italics indicates a VA HQ'd Lender Rank Lender Count of Loans % of Total 1 Truist Bank 10,203 9.3% 2 Atlantic Union Bank 10,197 9.3% 3 Bank of America, National Association 8,487 7.8% 4 Wells Fargo Bank, National Association 6,247 5.7% 5 Towne Bank 5,126 4.7% 6 Celtic Bank Corporation 2,934 2.7% 7 United Bank 2,845 2.6% 8 Kabbage, Inc. 2,667 2.4% 9 Cross River Bank 2,512 2.3% 10 The First Bank and Trust Company 2,216 2.0% Top 10 Financial Institutions Lending in VA 53,434 49% All Institutions in Lending in VA 109,227 100% SBA PPP Approved Loans for Virginia Ranking of Top 10 Lenders in VA VA HQ'd Bank Rank Lender Count of Loans % of Total 1 Atlantic Union Bank 10,197 27.7% 2 Towne Bank 5,126 13.9% 3 The First Bank and Trust Company 2,216 6.0% 4 Sonabank 2,192 5.9% 5 Navy FCU 1,356 3.7% 6 Citizens and Farmers Bank 1,214 3.3% 7 Capital One, National Association 1,204 3.3% 8 The Old Point National Bank of Phoebus 1,096 3.0% 9 Burke & Herbert Bank & Trust Company 1,049 2.8% 10 Chesapeake Bank 933 2.5% Top 10 Financial Institutions Headquartered in VA 26,583 72% All Institutions Headquartered in VA 36,843 100% SBA PPP Approved Loans for Virginia Ranking of Banks Headquartered in VA |
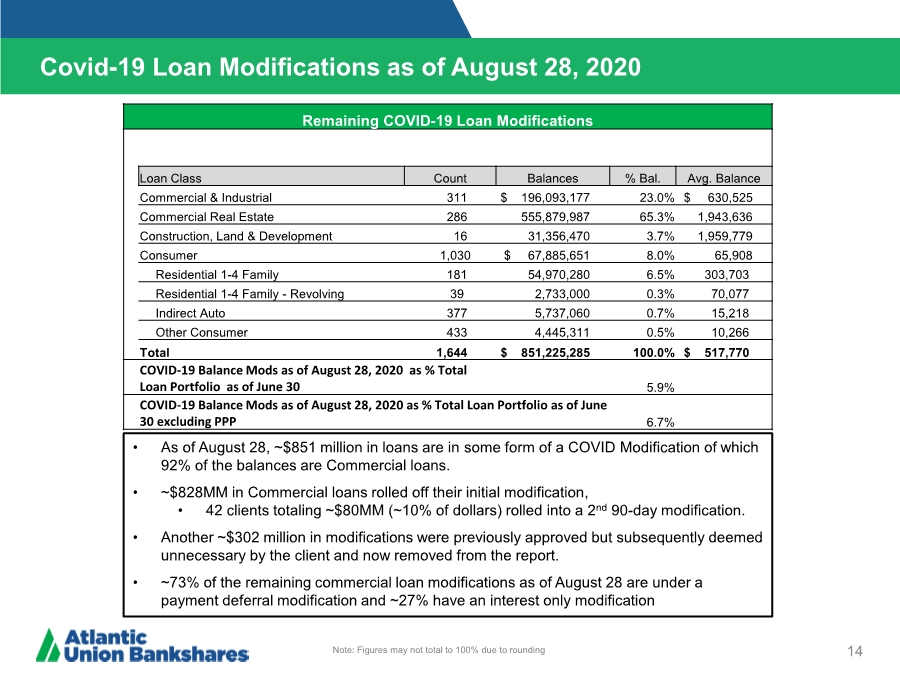
| Covid-19 Loan Modifications as of August 28, 2020 14 • As of August 28, ~$851 million in loans are in some form of a COVID Modification of which 92% of the balances are Commercial loans. • ~$828MM in Commercial loans rolled off their initial modification, • 42 clients totaling ~$80MM (~10% of dollars) rolled into a 2nd 90-day modification. • Another ~$302 million in modifications were previously approved but subsequently deemed unnecessary by the client and now removed from the report. • ~73% of the remaining commercial loan modifications as of August 28 are under a payment deferral modification and ~27% have an interest only modification Note: Figures may not total to 100% due to rounding Remaining COVID-19 Loan Modifications Loan Class Count Balances % Bal. Avg. Balance Commercial & Industrial 311 $ 196,093,177 23.0% $ 630,525 Commercial Real Estate 286 555,879,987 65.3% 1,943,636 Construction, Land & Development 16 31,356,470 3.7% 1,959,779 Consumer 1,030 $ 67,885,651 8.0% 65,908 Residential 1-4 Family 181 54,970,280 6.5% 303,703 Residential 1-4 Family - Revolving 39 2,733,000 0.3% 70,077 Indirect Auto 377 5,737,060 0.7% 15,218 Other Consumer 433 4,445,311 0.5% 10,266 Total 1,644 $ 851,225,285 100.0% $ 517,770 COVID-19 Balance Mods as of August 28, 2020 as % Total Loan Portfolio as of June 30 5.9% COVID-19 Balance Mods as of August 28, 2020 as % Total Loan Portfolio as of June 30 excluding PPP 6.7% |
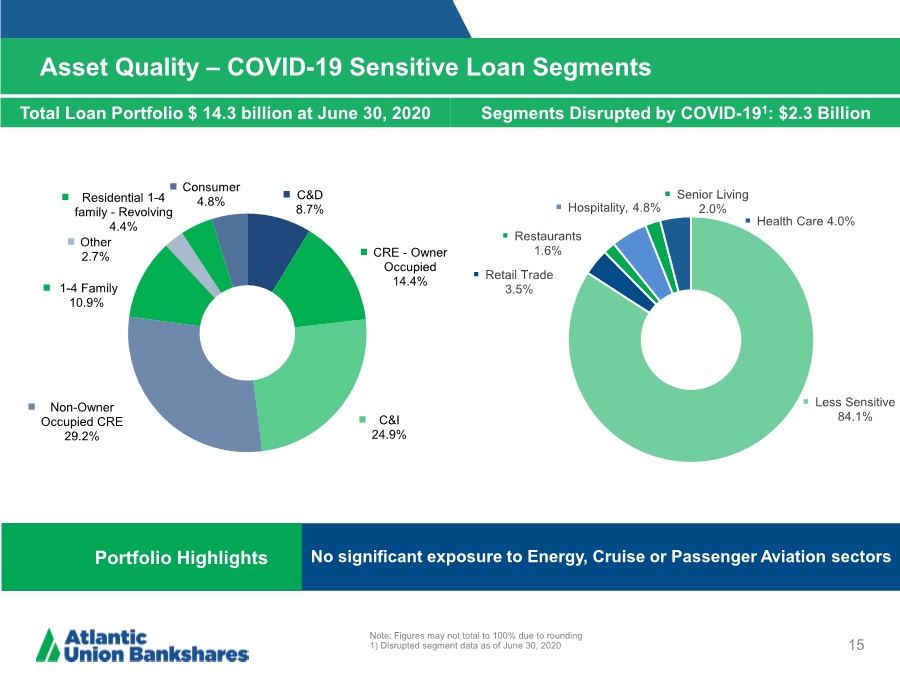
| Asset Quality – COVID-19 Sensitive Loan Segments 15 Note: Figures may not total to 100% due to rounding 1) Disrupted segment data as of June 30, 2020 Total Loan Portfolio $ 14.3 billion at June 30, 2020 Segments Disrupted by COVID-191: $2.3 Billion Portfolio Highlights No significant exposure to Energy, Cruise or Passenger Aviation sectors C&D 8.7% CRE - Owner Occupied 14.4% C&I 24.9% Non-Owner Occupied CRE 29.2% 1-4 Family 10.9% Other 2.7% Residential 1-4 family - Revolving 4.4% Consumer 4.8% Less Sensitive 84.1% Retail Trade 3.5% Restaurants 1.6% Hospitality, 4.8% Senior Living 2.0% Health Care 4.0% |
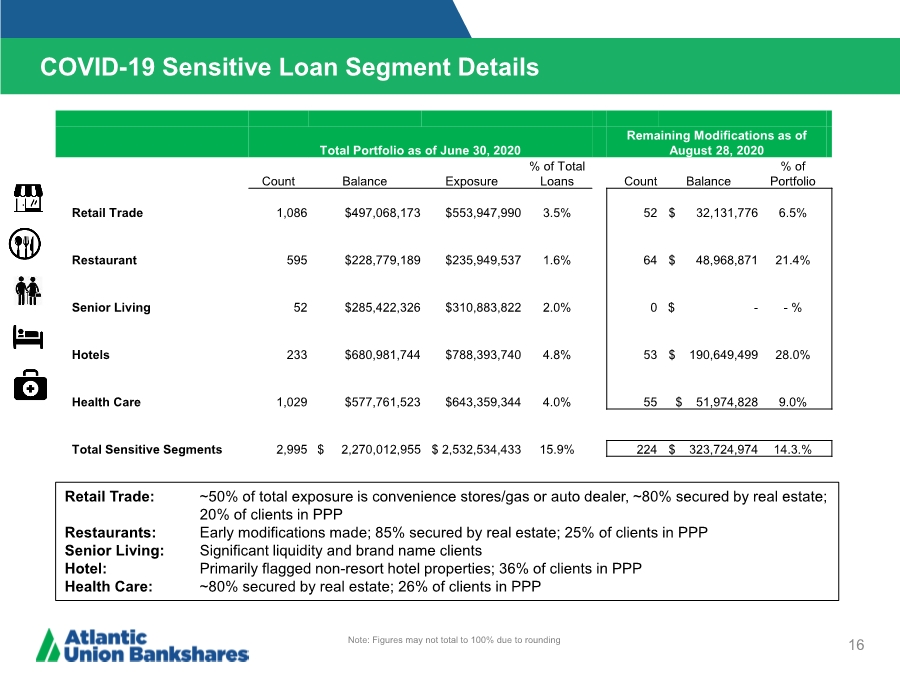
| COVID-19 Sensitive Loan Segment Details 16 Retail Trade: ~50% of total exposure is convenience stores/gas or auto dealer, ~80% secured by real estate; 20% of clients in PPP Restaurants: Early modifications made; 85% secured by real estate; 25% of clients in PPP Senior Living: Significant liquidity and brand name clients Hotel: Primarily flagged non-resort hotel properties; 36% of clients in PPP Health Care: ~80% secured by real estate; 26% of clients in PPP Note: Figures may not total to 100% due to rounding Total Portfolio as of June 30, 2020 Remaining Modifications as of August 28, 2020 Count Balance Exposure % of Total Loans Count Balance % of Portfolio Retail Trade 1,086 $497,068,173 $553,947,990 3.5% 52 $ 32,131,776 6.5% Restaurant 595 $228,779,189 $235,949,537 1.6% 64 $ 48,968,871 21.4% Senior Living 52 $285,422,326 $310,883,822 2.0% 0 $ --% Hotels 233 $680,981,744 $788,393,740 4.8% 53 $ 190,649,499 28.0% Health Care 1,029 $577,761,523 $643,359,344 4.0% 55 $ 51,974,828 9.0% Total Sensitive Segments 2,995 $ 2,270,012,955 $ 2,532,534,433 15.9% 224 $ 323,724,974 14.3.% |
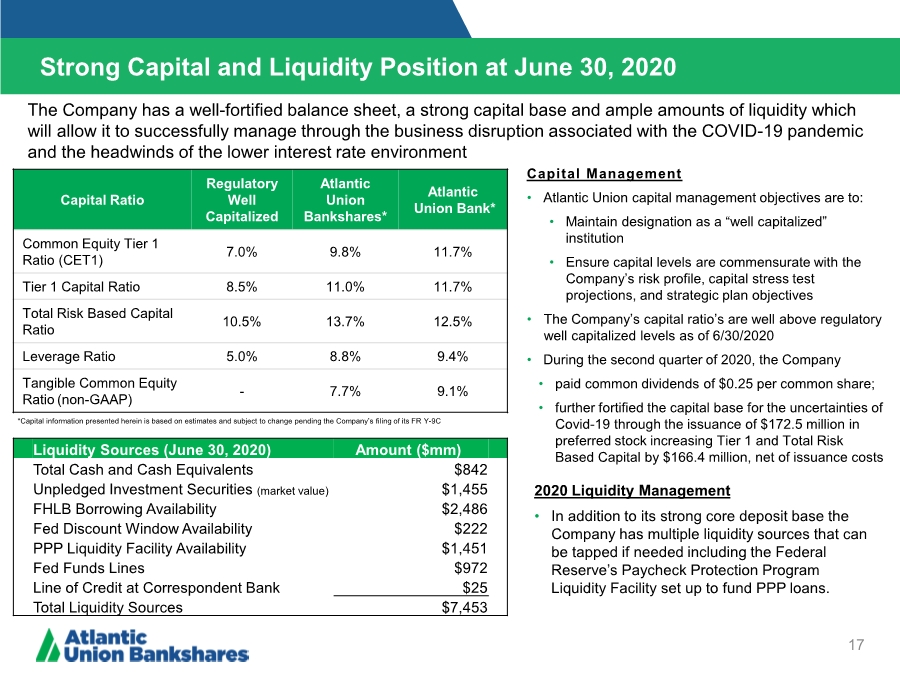
| Strong Capital and Liquidity Position at June 30, 2020 17 Capital Ratio Regulatory Well Capitalized Atlantic Union Bankshares* Atlantic Union Bank* Common Equity Tier 1 Ratio (CET1) 7.0% 9.8% 11.7% Tier 1 Capital Ratio 8.5% 11.0% 11.7% Total Risk Based Capital Ratio 10.5% 13.7% 12.5% Leverage Ratio 5.0% 8.8% 9.4% Tangible Common Equity Ratio (non-GAAP) - 7.7% 9.1% *Capital information presented herein is based on estimates and subject to change pending the Company’s filing of its FR Y-9C Capital Management • Atlantic Union capital management objectives are to: • Maintain designation as a “well capitalized” institution • Ensure capital levels are commensurate with the Company’s risk profile, capital stress test projections, and strategic plan objectives • The Company’s capital ratio’s are well above regulatory well capitalized levels as of 6/30/2020 • During the second quarter of 2020, the Company • paid common dividends of $0.25 per common share; • further fortified the capital base for the uncertainties of Covid-19 through the issuance of $172.5 million in preferred stock increasing Tier 1 and Total Risk Based Capital by $166.4 million, net of issuance costs The Company has a well-fortified balance sheet, a strong capital base and ample amounts of liquidity which will allow it to successfully manage through the business disruption associated with the COVID-19 pandemic and the headwinds of the lower interest rate environment Liquidity Sources (June 30, 2020) Amount ($mm) Total Cash and Cash Equivalents $842 Unpledged Investment Securities (market value) $1,455 FHLB Borrowing Availability $2,486 Fed Discount Window Availability $222 PPP Liquidity Facility Availability $1,451 Fed Funds Lines $972 Line of Credit at Correspondent Bank $25 Total Liquidity Sources $7,453 2020 Liquidity Management • In addition to its strong core deposit base the Company has multiple liquidity sources that can be tapped if needed including the Federal Reserve’s Paycheck Protection Program Liquidity Facility set up to fund PPP loans. |
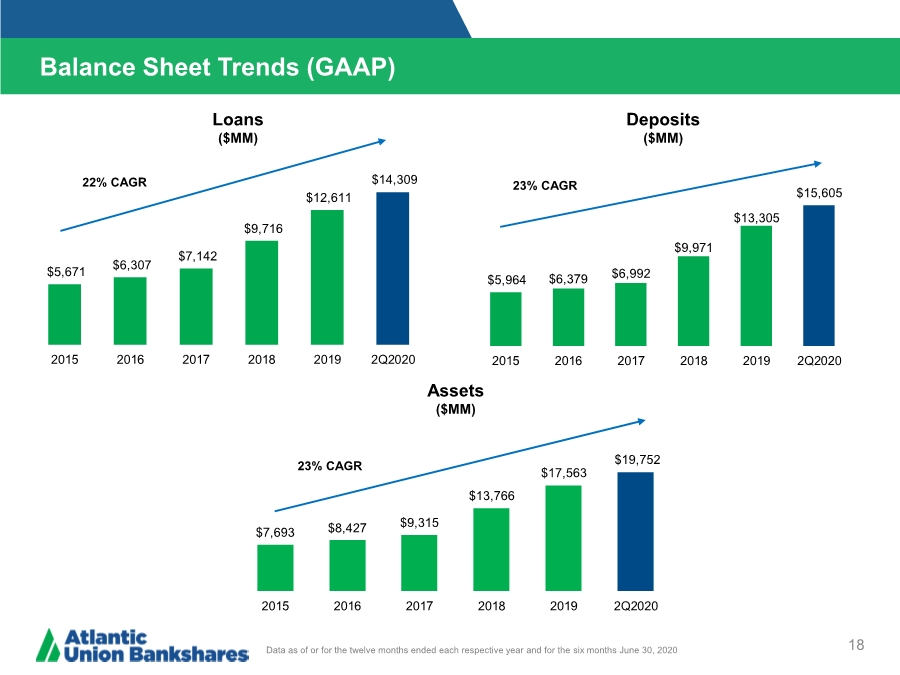
| $5,671 $6,307 $7,142 $9,716 $12,611 $14,309 2015 2016 2017 2018 2019 2Q2020 Balance Sheet Trends (GAAP) 18 Loans ($MM) Deposits ($MM) Assets ($MM) Data as of or for the twelve months ended each respective year and for the six months June 30, 2020 22% CAGR 23% CAGR 23% CAGR $5,964 $6,379 $6,992 $9,971 $13,305 $15,605 2015 2016 2017 2018 2019 2Q2020 $7,693 $8,427 $9,315 $13,766 $17,563 $19,752 2015 2016 2017 2018 2019 2Q2020 |
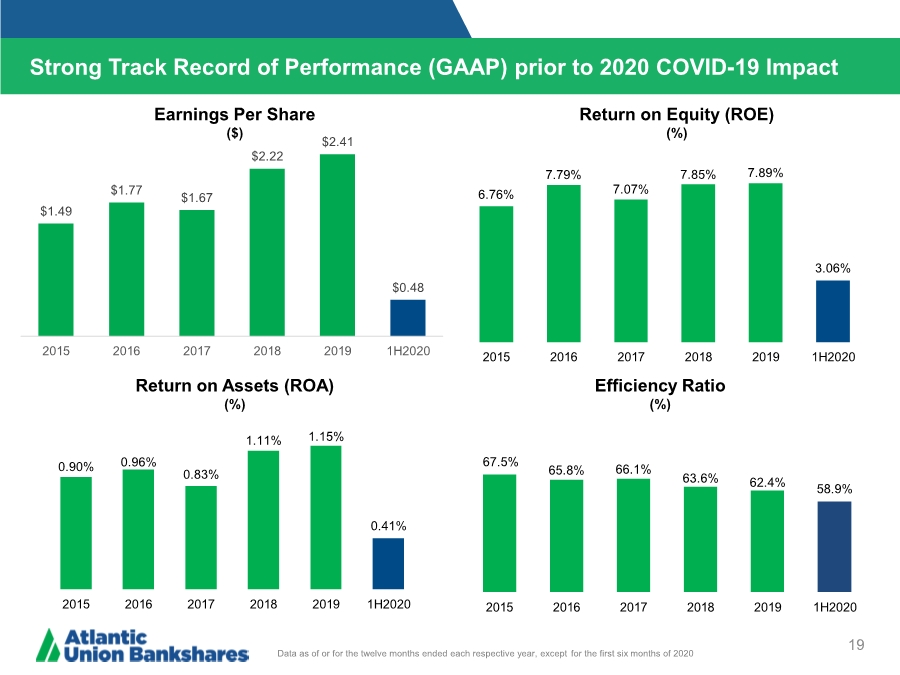
| Strong Track Record of Performance (GAAP) prior to 2020 COVID-19 Impact 19 Data as of or for the twelve months ended each respective year, except for the first six months of 2020 Return on Assets (ROA) (%) Return on Equity (ROE) (%) Efficiency Ratio (%) Earnings Per Share ($) $1.49 $1.77 $1.67 $2.22 $2.41 $0.48 2015 2016 2017 2018 2019 1H2020 6.76% 7.79% 7.07% 7.85% 7.89% 3.06% 2015 2016 2017 2018 2019 1H2020 0.90% 0.96% 0.83% 1.11% 1.15% 0.41% 2015 2016 2017 2018 2019 1H2020 67.5% 65.8% 66.1% 63.6% 62.4% 58.9% 2015 2016 2017 2018 2019 1H2020 |
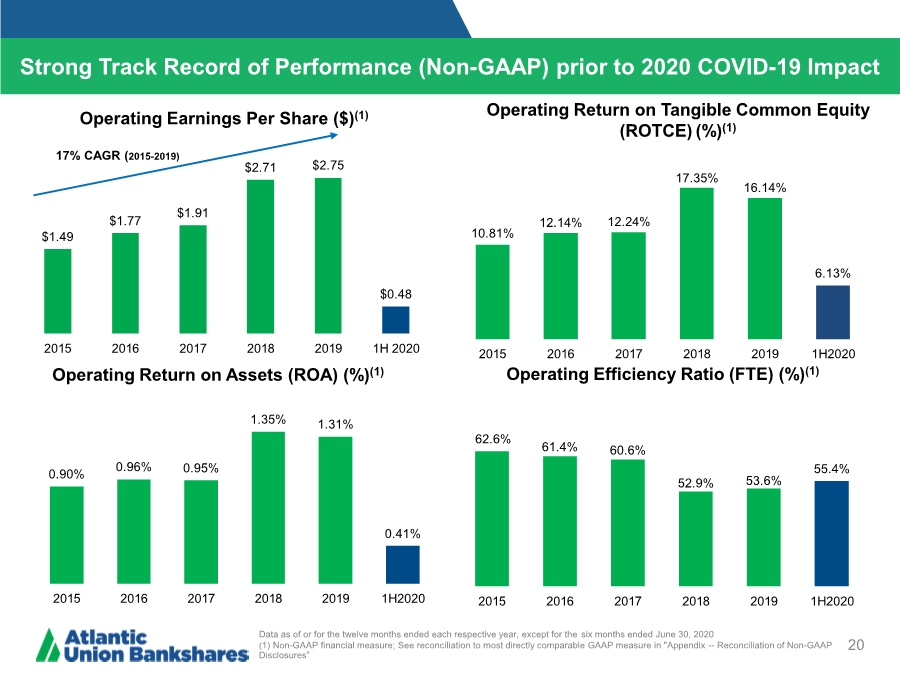
| $1.49 $1.77 $1.91 $2.71 $2.75 $0.48 2015 2016 2017 2018 2019 1H 2020 Strong Track Record of Performance (Non-GAAP) prior to 2020 COVID-19 Impact 20 Data as of or for the twelve months ended each respective year, except for the six months ended June 30, 2020 (1) Non-GAAP financial measure; See reconciliation to most directly comparable GAAP measure in "Appendix -- Reconciliation of Non-GAAP Disclosures” Operating Return on Assets (ROA) (%)(1) Operating Return on Tangible Common Equity (ROTCE)(%)(1) Operating Efficiency Ratio (FTE) (%)(1) Operating Earnings Per Share ($)(1) 17% CAGR (2015-2019) 10.81% 12.14% 12.24% 17.35% 16.14% 6.13% 2015 2016 2017 2018 2019 1H2020 0.90% 0.96% 0.95% 1.35% 1.31% 0.41% 2015 2016 2017 2018 2019 1H2020 62.6% 61.4% 60.6% 52.9% 53.6% 55.4% 2015 2016 2017 2018 2019 1H2020 |
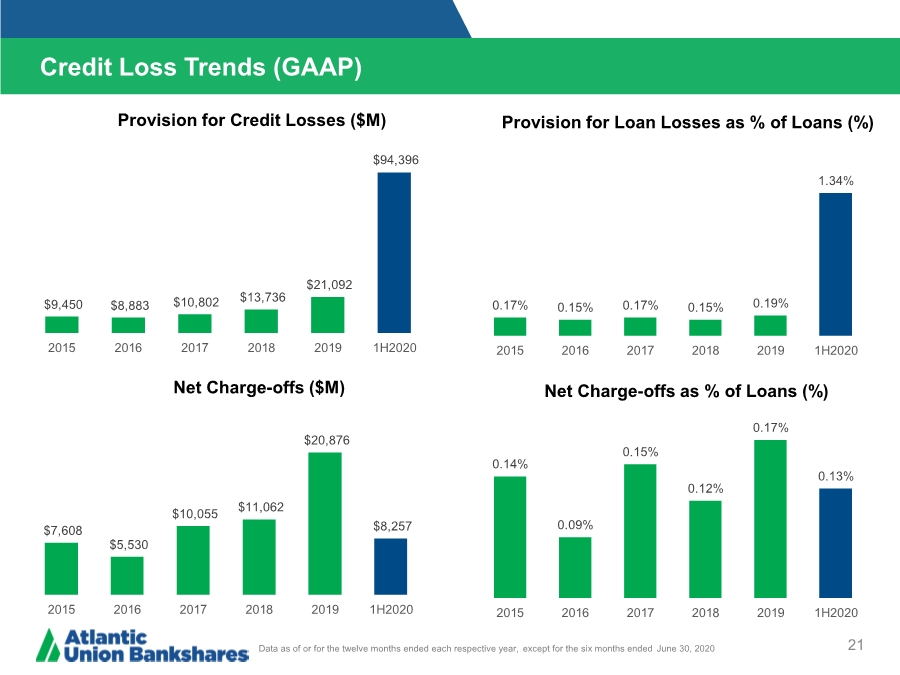
| 21 Provision for Credit Losses ($M) Provision for Loan Losses as % of Loans (%) Credit Loss Trends (GAAP) Net Charge-offs ($M) Net Charge-offs as % of Loans (%) Data as of or for the twelve months ended each respective year, except for the six months ended June 30, 2020 0.17% 0.15% 0.17% 0.15% 0.19% 1.34% 2015 2016 2017 2018 2019 1H2020 0.14% 0.09% 0.15% 0.12% 0.17% 0.13% 2015 2016 2017 2018 2019 1H2020 $9,450 $8,883 $10,802 $13,736 $21,092 $94,396 2015 2016 2017 2018 2019 1H2020 $7,608 $5,530 $10,055 $11,062 $20,876 $8,257 2015 2016 2017 2018 2019 1H2020 |
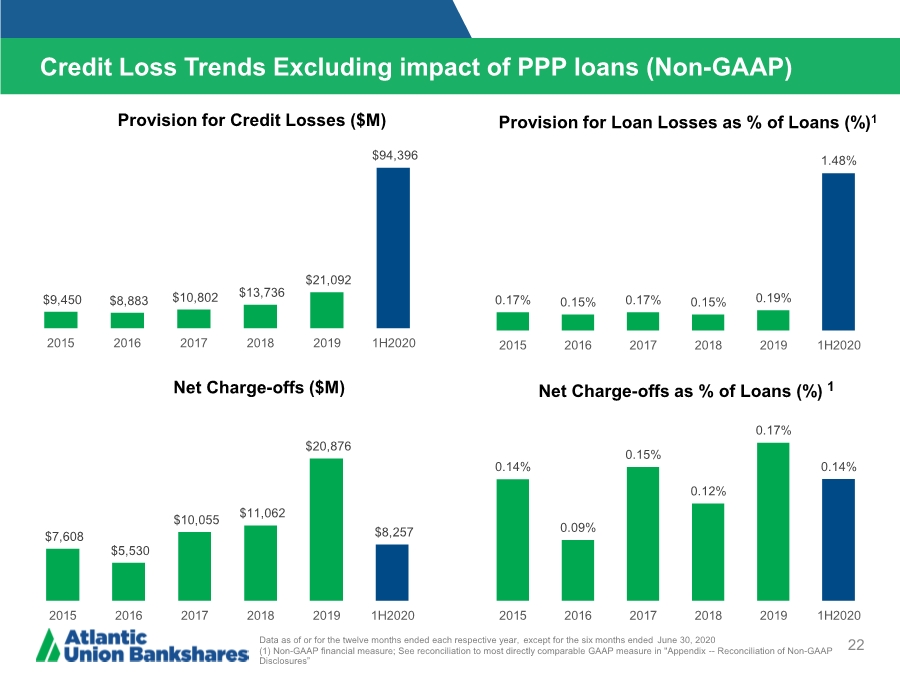
| 22 Provision for Credit Losses ($M) Provision for Loan Losses as % of Loans (%)1 Credit Loss Trends Excluding impact of PPP loans (Non-GAAP) Net Charge-offs ($M) Net Charge-offs as % of Loans (%) 1 Data as of or for the twelve months ended each respective year, except for the six months ended June 30, 2020 (1) Non-GAAP financial measure; See reconciliation to most directly comparable GAAP measure in "Appendix -- Reconciliation of Non-GAAP Disclosures” $9,450 $8,883 $10,802 $13,736 $21,092 $94,396 2015 2016 2017 2018 2019 1H2020 $7,608 $5,530 $10,055 $11,062 $20,876 $8,257 2015 2016 2017 2018 2019 1H2020 0.17% 0.15% 0.17% 0.15% 0.19% 1.48% 2015 2016 2017 2018 2019 1H2020 0.14% 0.09% 0.15% 0.12% 0.17% 0.14% 2015 2016 2017 2018 2019 1H2020 |
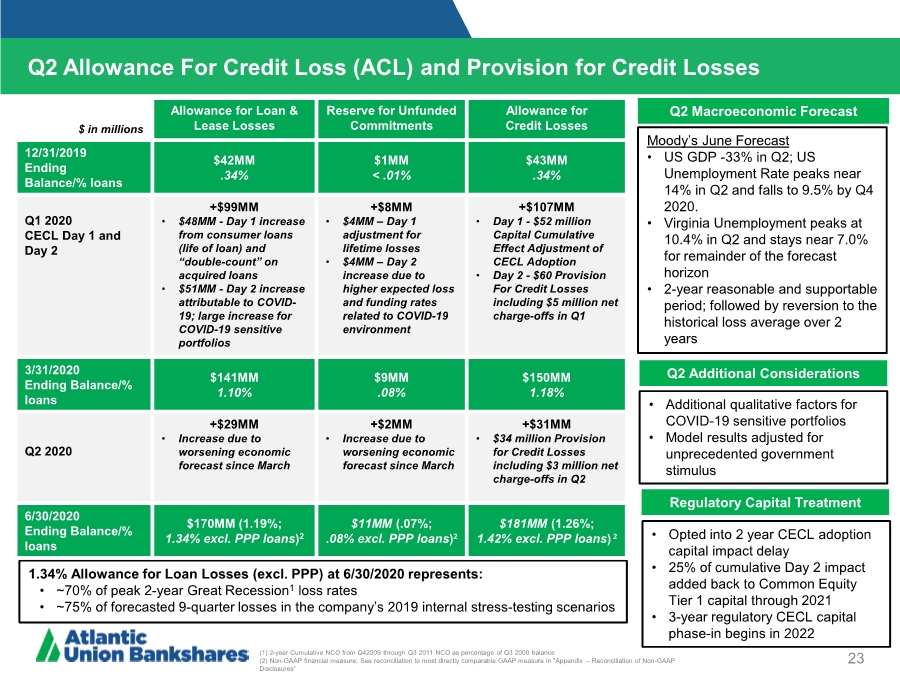
| Q2 Allowance For Credit Loss (ACL) and Provision for Credit Losses 23 Q2 Macroeconomic Forecast Q2 Additional Considerations Regulatory Capital Treatment Moody’s June Forecast • US GDP -33% in Q2; US Unemployment Rate peaks near 14% in Q2 and falls to 9.5% by Q4 2020. • Virginia Unemployment peaks at 10.4% in Q2 and stays near 7.0% for remainder of the forecast horizon • 2-year reasonable and supportable period; followed by reversion to the historical loss average over 2 years • Additional qualitative factors for COVID-19 sensitive portfolios • Model results adjusted for unprecedented government stimulus • Opted into 2 year CECL adoption capital impact delay • 25% of cumulative Day 2 impact added back to Common Equity Tier 1 capital through 2021 • 3-year regulatory CECL capital phase-in begins in 2022 1.34% Allowance for Loan Losses (excl. PPP) at 6/30/2020 represents: • ~70% of peak 2-year Great Recession1 loss rates • ~75% of forecasted 9-quarter losses in the company’s 2019 internal stress-testing scenarios (1) 2-year Cumulative NCO from Q42009 through Q3 2011 NCO as percentage of Q3 2009 balance (2) Non-GAAP financial measure; See reconciliation to most directly comparable GAAP measure in "Appendix -- Reconciliation of Non-GAAP Disclosures” $ in millions Allowance for Loan & Lease Losses Reserve for Unfunded Commitments Allowance for Credit Losses 12/31/2019 Ending Balance/% loans $42MM ..34% $1MM < .01% $43MM ..34% Q1 2020 CECL Day 1 and Day 2 +$99MM • $48MM - Day 1 increase from consumer loans (life of loan) and “double-count” on acquired loans • $51MM - Day 2 increase attributable to COVID- 19; large increase for COVID-19 sensitive portfolios +$8MM • $4MM – Day 1 adjustment for lifetime losses • $4MM – Day 2 increase due to higher expected loss and funding rates related to COVID-19 environment +$107MM • Day 1 - $52 million Capital Cumulative Effect Adjustment of CECL Adoption • Day 2 - $60 Provision For Credit Losses including $5 million net charge-offs in Q1 3/31/2020 Ending Balance/% loans $141MM 1.10% $9MM ..08% $150MM 1.18% Q2 2020 +$29MM • Increase due to worsening economic forecast since March +$2MM • Increase due to worsening economic forecast since March +$31MM • $34 million Provision for Credit Losses including $3 million net charge-offs in Q2 6/30/2020 Ending Balance/% loans $170MM (1.19%; 1.34% excl. PPP loans)2 $11MM (.07%; ..08% excl. PPP loans)2 $181MM (1.26%; 1.42% excl. PPP loans) 2 |
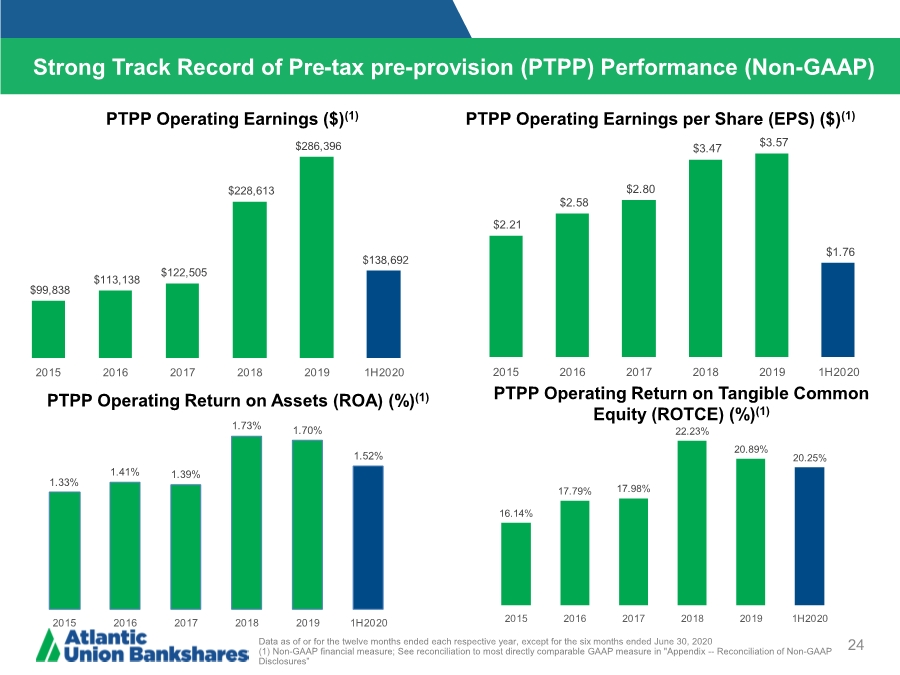
| 24 PTPP Operating Earnings per Share (EPS) ($)(1) Strong Track Record of Pre-tax pre-provision (PTPP) Performance (Non-GAAP) PTPP Operating Return on Assets (ROA) (%)(1) PTPP Operating Earnings ($)(1) PTPP Operating Return on Tangible Common Equity (ROTCE) (%)(1) Data as of or for the twelve months ended each respective year, except for the six months ended June 30, 2020 (1) Non-GAAP financial measure; See reconciliation to most directly comparable GAAP measure in "Appendix -- Reconciliation of Non-GAAP Disclosures” $99,838 $113,138 $122,505 $228,613 $286,396 $138,692 2015 2016 2017 2018 2019 1H2020 $2.21 $2.58 $2.80 $3.47 $3.57 $1.76 2015 2016 2017 2018 2019 1H2020 1.33% 1.41% 1.39% 1.73% 1.70% 1.52% 2015 2016 2017 2018 2019 1H2020 16.14% 17.79% 17.98% 22.23% 20.89% 20.25% 2015 2016 2017 2018 2019 1H2020 |
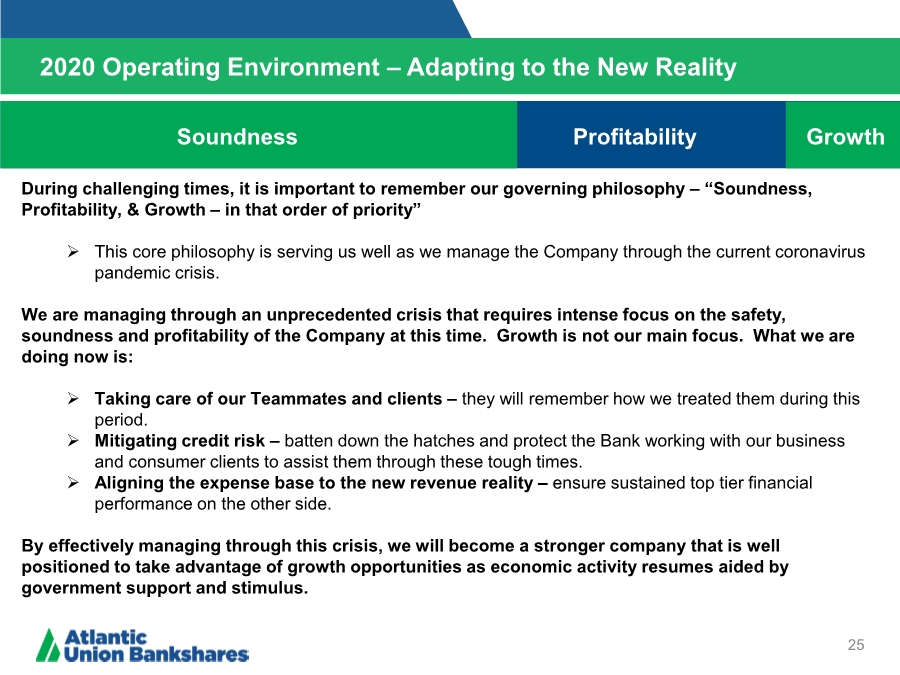
| 2020 Operating Environment – Adapting to the New Reality 25 Soundness Profitability Growth During challenging times, it is important to remember our governing philosophy –“Soundness, Profitability, & Growth – in that order of priority” ➢ This core philosophy is serving us well as we manage the Company through the current coronavirus pandemic crisis. We are managing through an unprecedented crisis that requires intense focus on the safety, soundness and profitability of the Company at this time. Growth is not our main focus. What we are doing now is: ➢ Taking care of our Teammates and clients – they will remember how we treated them during this period. ➢ Mitigating credit risk – batten down the hatches and protect the Bank working with our business and consumer clients to assist them through these tough times. ➢ Aligning the expense base to the new revenue reality – ensure sustained top tier financial performance on the other side. By effectively managing through this crisis, we will become a stronger company that is well positioned to take advantage of growth opportunities as economic activity resumes aided by government support and stimulus. |
| Appendix |
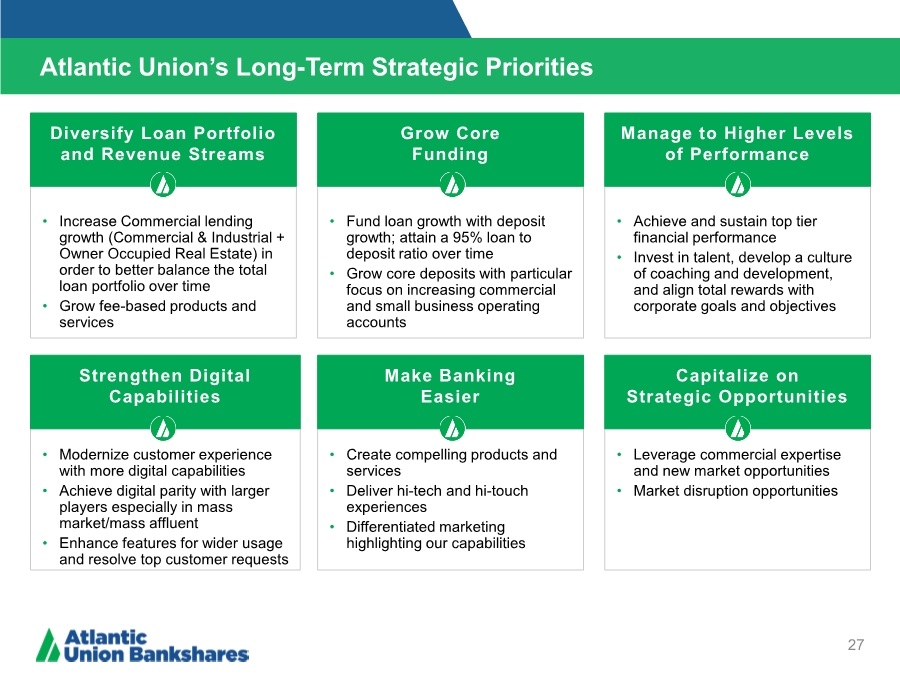
| Atlantic Union’s Long-Term Strategic Priorities 27 • Increase Commercial lending growth (Commercial & Industrial + Owner Occupied Real Estate) in order to better balance the total loan portfolio over time • Grow fee-based products and services Diversify Loan Portfolio and Revenue Streams • Fund loan growth with deposit growth; attain a 95% loan to deposit ratio over time • Grow core deposits with particular focus on increasing commercial and small business operating accounts Grow Core Funding • Achieve and sustain top tier financial performance • Invest in talent, develop a culture of coaching and development, and align total rewards with corporate goals and objectives Manage to Higher Levels of Performance • Modernize customer experience with more digital capabilities • Achieve digital parity with larger players especially in mass market/mass affluent • Enhance features for wider usage and resolve top customer requests • Create compelling products and services • Deliver hi-tech and hi-touch experiences • Differentiated marketing highlighting our capabilities • Leverage commercial expertise and new market opportunities • Market disruption opportunities Strengthen Digital Capabilities Make Banking Easier Capitalize on Strategic Opportunities |
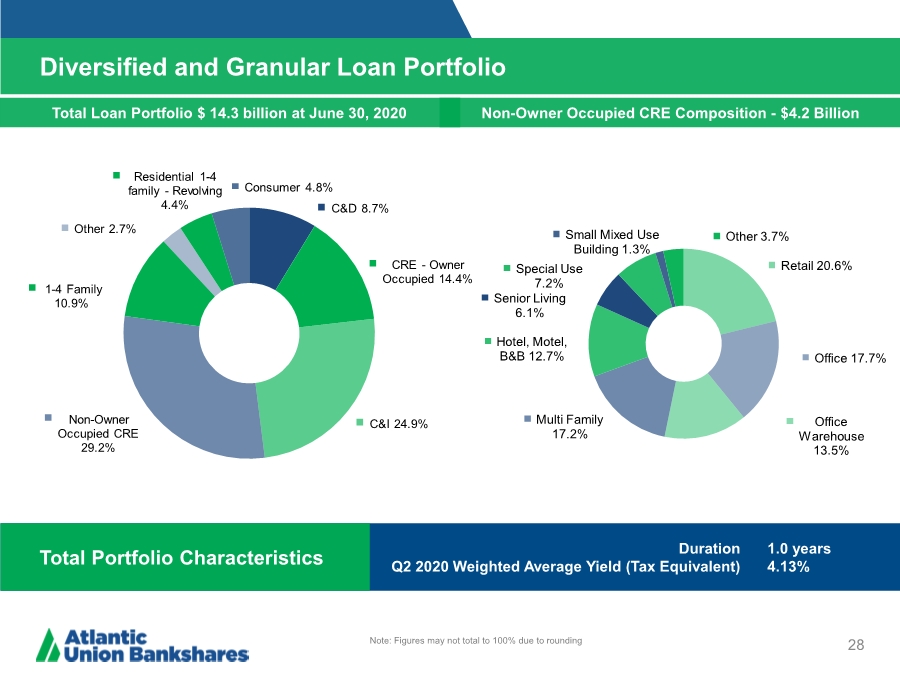
| Diversified and Granular Loan Portfolio 28 Note: Figures may not total to 100% due to rounding Total Loan Portfolio $ 14.3 billion at June 30, 2020 Non-Owner Occupied CRE Composition - $4.2 Billion Total Portfolio Characteristics Duration Q2 2020 Weighted Average Yield (Tax Equivalent) 1.0 years 4.13% C&D 8.7% CRE - Owner Occupied 14.4% C&I 24.9% Non-Owner Occupied CRE 29.2% 1-4 Family 10.9% Other 2.7% Residential 1-4 family - Revolving 4.4% Consumer 4.8% Retail 20.6% Office 17.7% Office Warehouse 13.5% Multi Family 17.2% Hotel, Motel, B&B 12.7% Senior Living 6.1% Special Use 7.2% Small Mixed Use Building 1.3% Other 3.7% |
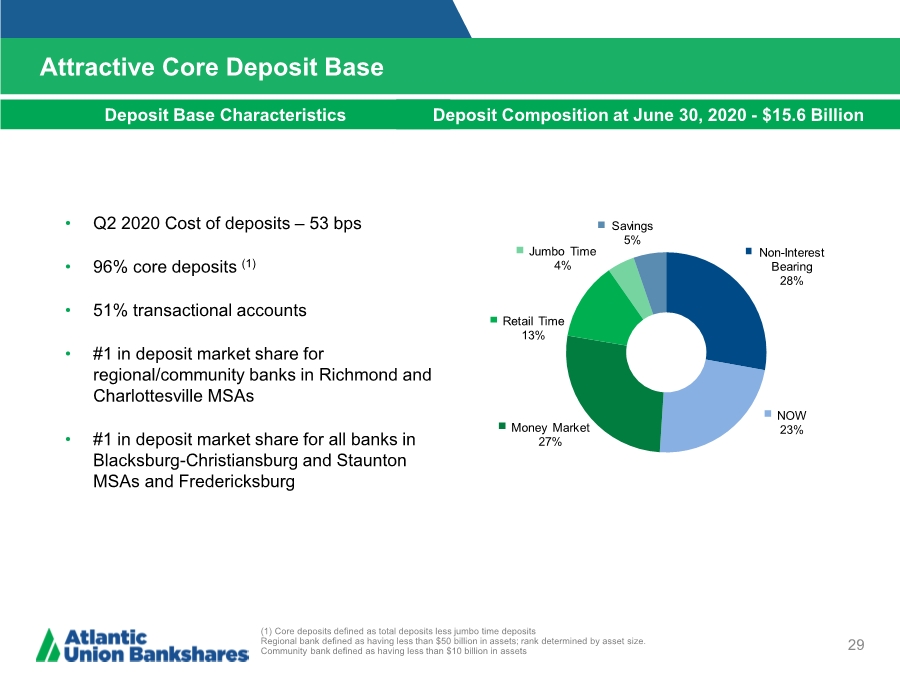
| Attractive Core Deposit Base 29 (1) Core deposits defined as total deposits less jumbo time deposits Regional bank defined as having less than $50 billion in assets; rank determined by asset size. Community bank defined as having less than $10 billion in assets Deposit Base Characteristics Deposit Composition at June 30, 2020 - $15.6 Billion • Q2 2020 Cost of deposits – 53 bps • 96% core deposits (1) • 51% transactional accounts •#1 in deposit market share for regional/community banks in Richmond and Charlottesville MSAs •#1 in deposit market share for all banks in Blacksburg-Christiansburg and Staunton MSAs and Fredericksburg Non-Interest Bearing 28% NOW 23% Money Market 27% Retail Time 13% Jumbo Time 4% Savings 5% |
| Reconciliation of Non-GAAP Disclosures 30 Operating Earnings Per Share The Company has provided supplemental performance measures on a tax-equivalent, tangible, operating, or pre- tax pre-provision basis. These non-GAAP financial measures are a supplement to GAAP, which is used to prepare the Company’s financial statements, and should not be considered in isolation or as a substitute for comparable measures calculated in accordance with GAAP. In addition, the Company’s non-GAAP financial measures may not be comparable to non-GAAP financial measures of other companies. The Company uses the non-GAAP financial measures discussed herein in its analysis of the Company’s performance. The Company’s management believes that these non-GAAP financial measures provide additional understanding of ongoing operations, enhance comparability of results of operations with prior periods and show the effects of significant gains and charges in the periods presented without the impact of items or events that may obscure trends in the Company’s underlying performance. |
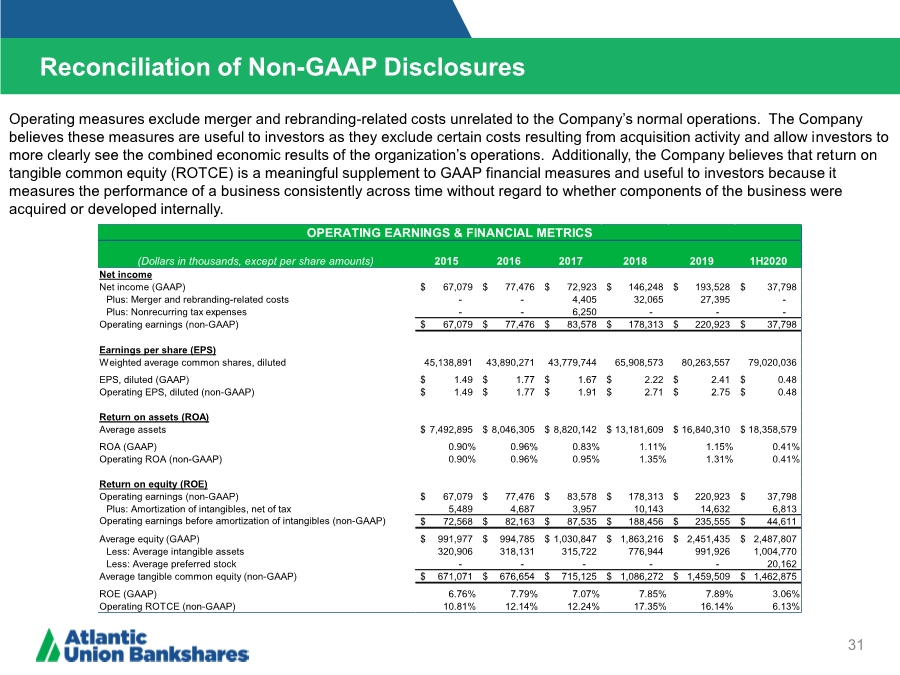
| Reconciliation of Non-GAAP Disclosures 31 Operating measures exclude merger and rebranding-related costs unrelated to the Company’s normal operations. The Company believes these measures are useful to investors as they exclude certain costs resulting from acquisition activity and allow investors to more clearly see the combined economic results of the organization’s operations. Additionally, the Company believes that return on tangible common equity (ROTCE) is a meaningful supplement to GAAP financial measures and useful to investors because it measures the performance of a business consistently across time without regard to whether components of the business were acquired or developed internally. (Dollars in thousands, except per share amounts) 2015 2016 2017 2018 2019 1H2020 Net income Net income (GAAP) 67,079 $ 77,476 $ 72,923 $ 146,248 $ 193,528 $ 37,798 $ Plus: Merger and rebranding-related costs - - 4,405 32,065 27,395 - Plus: Nonrecurring tax expenses - - 6,250 - - - Operating earnings (non-GAAP) 67,079 $ 77,476 $ 83,578 $ 178,313 $ 220,923 $ 37,798 $ Earnings per share (EPS) Weighted average common shares, diluted 45,138,891 43,890,271 43,779,744 65,908,573 80,263,557 79,020,036 EPS, diluted (GAAP) 1.49 $ 1.77 $ 1.67 $ 2.22 $ 2.41 $ 0.48 $ Operating EPS, diluted (non-GAAP) 1.49 $ 1.77 $ 1.91 $ 2.71 $ 2.75 $ 0.48 $ Return on assets (ROA) Average assets 7,492,895 $ 8,046,305 $ 8,820,142 $ 13,181,609 $ 16,840,310 $ 18,358,579 $ ROA (GAAP) 0.90% 0.96% 0.83% 1.11% 1.15% 0.41% Operating ROA (non-GAAP) 0.90% 0.96% 0.95% 1.35% 1.31% 0.41% Return on equity (ROE) Operating earnings (non-GAAP) 67,079 $ 77,476 $ 83,578 $ 178,313 $ 220,923 $ 37,798 $ Plus: Amortization of intangibles, net of tax 5,489 4,687 3,957 10,143 14,632 6,813 Operating earnings before amortization of intangibles (non-GAAP) 72,568 $ 82,163 $ 87,535 $ 188,456 $ 235,555 $ 44,611 $ Average equity (GAAP) 991,977 $ 994,785 $ 1,030,847 $ 1,863,216 $ 2,451,435 $ 2,487,807 $ Less: Average intangible assets 320,906 318,131 315,722 776,944 991,926 1,004,770 Less: Average preferred stock - - - - - 20,162 Average tangible common equity (non-GAAP) 671,071 $ 676,654 $ 715,125 $ 1,086,272 $ 1,459,509 $ 1,462,875 $ ROE (GAAP) 6.76% 7.79% 7.07% 7.85% 7.89% 3.06% Operating ROTCE (non-GAAP) 10.81% 12.14% 12.24% 17.35% 16.14% 6.13% OPERATING EARNINGS & FINANCIAL METRICS |
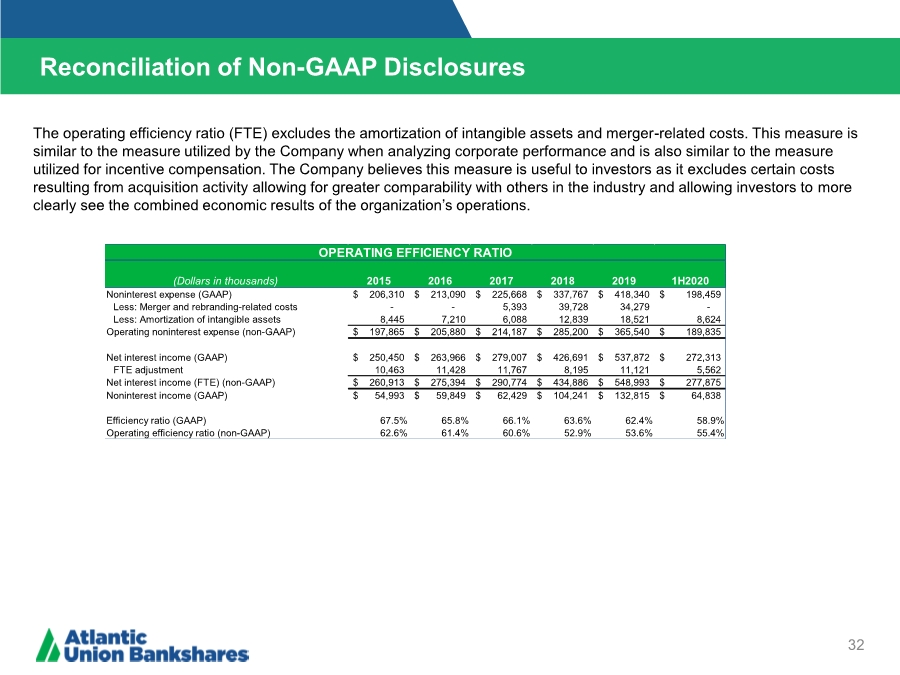
| Reconciliation of Non-GAAP Disclosures 32 Operating Earnings Per Share The operating efficiency ratio (FTE) excludes the amortization of intangible assets and merger-related costs. This measure is similar to the measure utilized by the Company when analyzing corporate performance and is also similar to the measure utilized for incentive compensation. The Company believes this measure is useful to investors as it excludes certain costs resulting from acquisition activity allowing for greater comparability with others in the industry and allowing investors to more clearly see the combined economic results of the organization’s operations. (Dollars in thousands) 2015 2016 2017 2018 2019 1H2020 Noninterest expense (GAAP) 206,310 $ 213,090 $ 225,668 $ 337,767 $ 418,340 $ 198,459 $ Less: Merger and rebranding-related costs - - 5,393 39,728 34,279 - Less: Amortization of intangible assets 8,445 7,210 6,088 12,839 18,521 8,624 Operating noninterest expense (non-GAAP) 197,865 $ 205,880 $ 214,187 $ 285,200 $ 365,540 $ 189,835 $ Net interest income (GAAP) 250,450 $ 263,966 $ 279,007 $ 426,691 $ 537,872 $ 272,313 $ FTE adjustment 10,463 11,428 11,767 8,195 11,121 5,562 Net interest income (FTE) (non-GAAP) 260,913 $ 275,394 $ 290,774 $ 434,886 $ 548,993 $ 277,875 $ Noninterest income (GAAP) 54,993 $ 59,849 $ 62,429 $ 104,241 $ 132,815 $ 64,838 $ Efficiency ratio (GAAP) 67.5% 65.8% 66.1% 63.6% 62.4% 58.9% Operating efficiency ratio (non-GAAP) 62.6% 61.4% 60.6% 52.9% 53.6% 55.4% OPERATING EFFICIENCY RATIO |
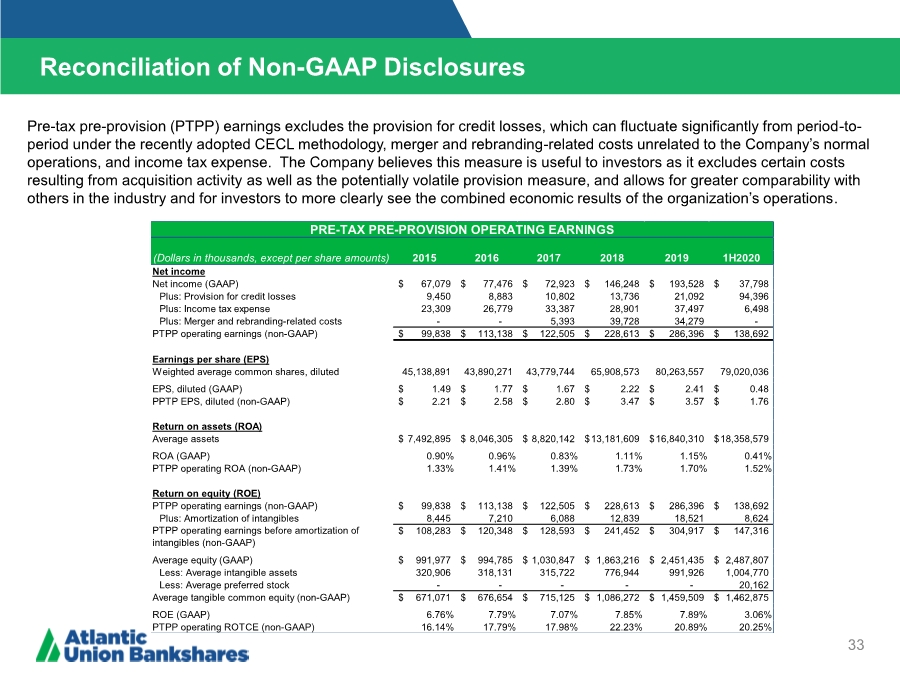
| Reconciliation of Non-GAAP Disclosures 33 Operating Earnings Per Share Pre-tax pre-provision (PTPP) earnings excludes the provision for credit losses, which can fluctuate significantly from period-to- period under the recently adopted CECL methodology, merger and rebranding-related costs unrelated to the Company’s normal operations, and income tax expense. The Company believes this measure is useful to investors as it excludes certain costs resulting from acquisition activity as well as the potentially volatile provision measure, and allows for greater comparability with others in the industry and for investors to more clearly see the combined economic results of the organization’s operations. (Dollars in thousands, except per share amounts) 2015 2016 2017 2018 2019 1H2020 Net income Net income (GAAP) 67,079 $ 77,476 $ 72,923 $ 146,248 $ 193,528 $ 37,798 $ Plus: Provision for credit losses 9,450 8,883 10,802 13,736 21,092 94,396 Plus: Income tax expense 23,309 26,779 33,387 28,901 37,497 6,498 Plus: Merger and rebranding-related costs - - 5,393 39,728 34,279 - PTPP operating earnings (non-GAAP) 99,838 $ 113,138 $ 122,505 $ 228,613 $ 286,396 $ 138,692 $ Earnings per share (EPS) Weighted average common shares, diluted 45,138,891 43,890,271 43,779,744 65,908,573 80,263,557 79,020,036 EPS, diluted (GAAP) 1.49 $ 1.77 $ 1.67 $ 2.22 $ 2.41 $ 0.48 $ PPTP EPS, diluted (non-GAAP) 2.21 $ 2.58 $ 2.80 $ 3.47 $ 3.57 $ 1.76 $ Return on assets (ROA) Average assets 7,492,895 $ 8,046,305 $ 8,820,142 $ 13,181,609 $ 16,840,310 $ 18,358,579 $ ROA (GAAP) 0.90% 0.96% 0.83% 1.11% 1.15% 0.41% PTPP operating ROA (non-GAAP) 1.33% 1.41% 1.39% 1.73% 1.70% 1.52% Return on equity (ROE) PTPP operating earnings (non-GAAP) 99,838 $ 113,138 $ 122,505 $ 228,613 $ 286,396 $ 138,692 $ Plus: Amortization of intangibles 8,445 7,210 6,088 12,839 18,521 8,624 PTPP operating earnings before amortization of intangibles (non-GAAP) 108,283 $ 120,348 $ 128,593 $ 241,452 $ 304,917 $ 147,316 $ Average equity (GAAP) 991,977 $ 994,785 $ 1,030,847 $ 1,863,216 $ 2,451,435 $ 2,487,807 $ Less: Average intangible assets 320,906 318,131 315,722 776,944 991,926 1,004,770 Less: Average preferred stock - - - - - 20,162 Average tangible common equity (non-GAAP) 671,071 $ 676,654 $ 715,125 $ 1,086,272 $ 1,459,509 $ 1,462,875 $ ROE (GAAP) 6.76% 7.79% 7.07% 7.85% 7.89% 3.06% PTPP operating ROTCE (non-GAAP) 16.14% 17.79% 17.98% 22.23% 20.89% 20.25% PRE-TAX PRE-PROVISION OPERATING EARNINGS |
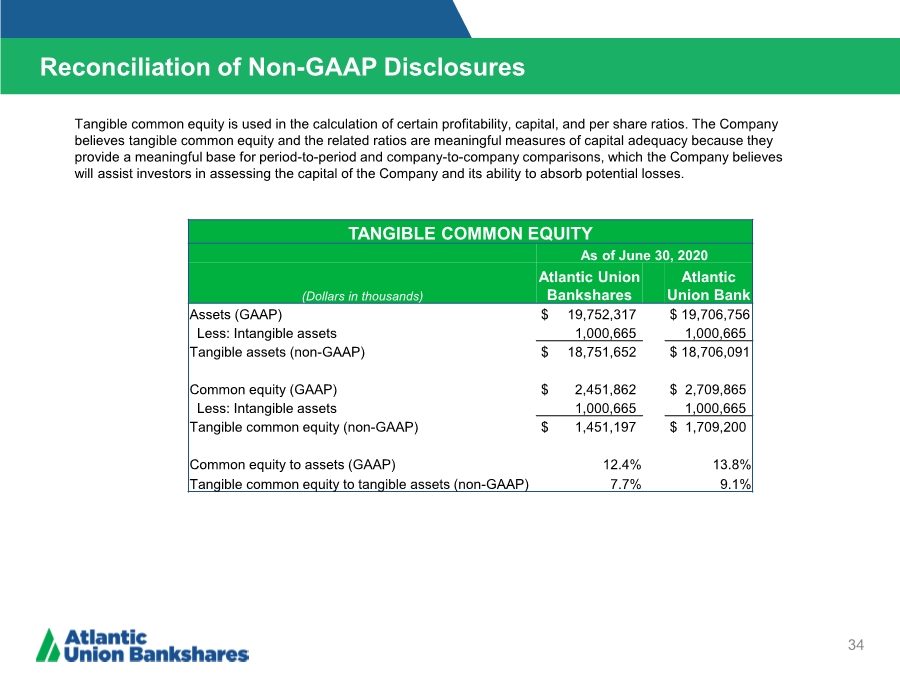
| Reconciliation of Non-GAAP Disclosures 34 Operating Earnings Per Share Tangible common equity is used in the calculation of certain profitability, capital, and per share ratios. The Company believes tangible common equity and the related ratios are meaningful measures of capital adequacy because they provide a meaningful base for period-to-period and company-to-company comparisons, which the Company believes will assist investors in assessing the capital of the Company and its ability to absorb potential losses. TANGIBLE COMMON EQUITY As of June 30, 2020 (Dollars in thousands) Atlantic Union Bankshares Atlantic Union Bank Assets (GAAP) $ 19,752,317 $ 19,706,756 Less: Intangible assets 1,000,665 1,000,665 Tangible assets (non-GAAP) $ 18,751,652 $ 18,706,091 Common equity (GAAP) $ 2,451,862 $ 2,709,865 Less: Intangible assets 1,000,665 1,000,665 Tangible common equity (non-GAAP) $ 1,451,197 $ 1,709,200 Common equity to assets (GAAP) 12.4% 13.8% Tangible common equity to tangible assets (non-GAAP) 7.7% 9.1% |
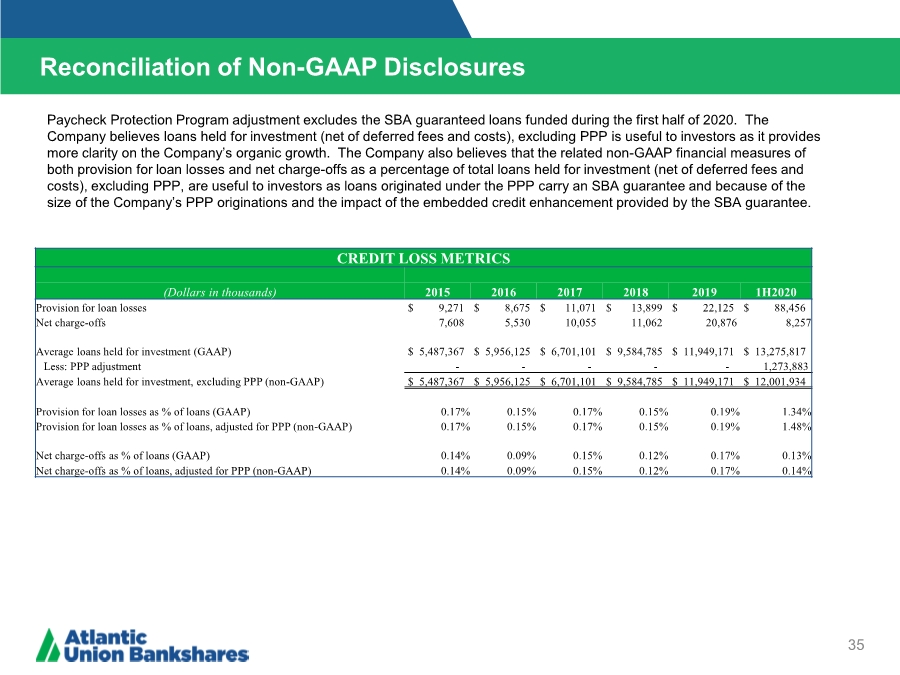
| Reconciliation of Non-GAAP Disclosures 35 ($ IN THOUSANDS) Operating Earnings Per Share Paycheck Protection Program adjustment excludes the SBA guaranteed loans funded during the first half of 2020. The Company believes loans held for investment (net of deferred fees and costs), excluding PPP is useful to investors as it provides more clarity on the Company’s organic growth. The Company also believes that the related non-GAAP financial measures of both provision for loan losses and net charge-offs as a percentage of total loans held for investment (net of deferred fees and costs), excluding PPP, are useful to investors as loans originated under the PPP carry an SBA guarantee and because of the size of the Company’s PPP originations and the impact of the embedded credit enhancement provided by the SBA guarantee. CREDIT LOSS METRICS (Dollars in thousands) 2015 2016 2017 2018 2019 1H2020 Provision for loan losses $ 9,271 $ 8,675 $ 11,071 $ 13,899 $ 22,125 $ 88,456 Net charge-offs 7,608 5,530 10,055 11,062 20,876 8,257 Average loans held for investment (GAAP) $ 5,487,367 $ 5,956,125 $ 6,701,101 $ 9,584,785 $ 11,949,171 $ 13,275,817 Less: PPP adjustment ----- 1,273,883 Average loans held for investment, excluding PPP (non-GAAP) $ 5,487,367 $ 5,956,125 $ 6,701,101 $ 9,584,785 $ 11,949,171 $ 12,001,934 Provision for loan losses as % of loans (GAAP) 0.17% 0.15% 0.17% 0.15% 0.19% 1.34% Provision for loan losses as % of loans, adjusted for PPP (non-GAAP) 0.17% 0.15% 0.17% 0.15% 0.19% 1.48% Net charge-offs as % of loans (GAAP) 0.14% 0.09% 0.15% 0.12% 0.17% 0.13% Net charge-offs as % of loans, adjusted for PPP (non-GAAP) 0.14% 0.09% 0.15% 0.12% 0.17% 0.14% |