| 1st Quarter 2020 Earnings Presentation Nasdaq: AUB April 28, 2020 |

| Forward Looking Statements 2 Certain statements in this presentation may constitute “forward-looking statements” within the meaning of the Private Securities Litigation Reform Act of 1995. Forward-looking statements are statements that include, without limitation, projections, predictions, expectations or beliefs about future events or results that are not statements of historical fact. Such forward-looking statements are based on various assumptions as of the time they are made, and are inherently subject to known and unknown risks, uncertainties, and other factors, some of which cannot be predicted or quantified, that may cause actual results, performance or achievements to be materially different from those expressed or implied by such forward- looking statements. Forward-looking statements are often accompanied by words that convey projected future events or outcomes such as “expect,” “believe,” “estimate,” “plan,” “project,” “anticipate,” “intend,” “will,” “may,” “view,” “opportunity,” “potential,” or words of similar meaning or other statements concerning opinions or judgment of Atlantic Union Bankshares Corporation (“Atlantic Union” or the “Company”) and its management about future events. Although Atlantic Union believes that its expectations with respect to forward-looking statements are based upon reasonable assumptions within the bounds of its existing knowledge of its business and operations, there can be no assurance that actual results, performance, or achievements of, or trends affecting, the Company will not differ materially from any projected future results, performance, or achievements or trends expressed or implied by such forward-looking statements. Actual future results, performance, achievements or trends may differ materially from historical results or those anticipated depending on a variety of factors, including, but not limited to: • changes in interest rates; • general economic and financial market conditions, in the United States generally and particularly in the markets in which the Company operates and which its loans are concentrated, including the effects of declines in real estate values, an increase in unemployment levels and slowdowns in economic growth, including as a result of COVID- 19; • the quality or composition of the loan or investment portfolios and changes therein; • demand for loan products and financial services in the Company’s market area; • the Company’s ability to manage its growth or implement its growth strategy; • the introduction of new lines of business or new products and services; • the Company’s ability to recruit and retain key employees; • the incremental cost and/or decreased revenues associated with exceeding $10 billion in assets; • real estate values in the Bank’s lending area; • an insufficient ACL; • changes in accounting principles relating to loan loss recognition (CECL); • the Company’s liquidity and capital positions; • concentrations of loans secured by real estate, particularly commercial real estate; • the effectiveness of the Company’s credit processes and management of the Company’s credit risk; • the Company’s ability to compete in the market for financial services; • technological risks and developments, and cyber threats, attacks, or events; • the potential adverse effects of unusual and infrequently occurring events, such as weather-related disasters, terrorist acts or public health events (such as COVID-19), and of governmental and societal responses thereto; these potential adverse effects may include, without limitation, adverse effects on the ability of the Company's borrowers to satisfy their obligations to the Company, on the value of collateral securing loans, on the demand for the Company's loans or its other products and services, on incidents of cyberattack and fraud, on the Company’s liquidity or capital positions, on risks posed by reliance on third- party service providers, on other aspects of the Company's business operations and on financial markets and economic growth; • performance by the Company’s counterparties or vendors; • deposit flows; • the availability of financing and the terms thereof; • the level of prepayments on loans and mortgage-backed securities; • legislative or regulatory changes and requirements, including the impact of the CARES Act and other legislative and regulatory reactions to COVID-19; • potential claims, damages, and fines related to litigation or government actions, including litigation or actions arising from the Company’s participation in and administration of programs related to COVID-19, including, among other things, the CARES Act; • the effects of changes in federal, state or local tax laws and regulations; • monetary and fiscal policies of the U.S. government including policies of the U.S. Department of the Treasury and the Federal Reserve; • changes to applicable accounting principles and guidelines; and • other factors, many of which are beyond the control of the Company Please refer to the “Risk Factors” and “Management’s Discussion and Analysis of Financial Condition and Results of Operations” sections of the Company’s Annual Report on Form 10-K for the year ended December 31, 2019, comparable “Risk Factors” sections of the Company’s Quarterly Reports on Form 10-Q, and related disclosures in other filings, which have been filed with the Securities and Exchange Commission (the “SEC”), and are available on the SEC’s website at www.sec.gov. All of the forward-looking statements made in this presentation are expressly qualified by the cautionary statements contained or referred to herein. The actual results or developments anticipated may not be realized or, even if substantially realized, they may not have the expected consequences to or effects on the Company or its businesses or operations. You are cautioned not to rely too heavily on the forward-looking statements contained in this presentation. Forward-looking statements speak only as of the date they are made and the Company does not undertake any obligation to update, revise or clarify these forward-looking statements, whether as a result of new information, future events or otherwise. |
| Additional Information 3 Unaudited Pro Forma Financial Information Any unaudited pro forma financial information included in, or discussed in connection with this presentation, is presented for informational purposes only and does not necessarily reflect the financial results of the combined company had the companies actually been combined during periods presented. The adjustments included in any such unaudited pro forma financial information are preliminary and may be significantly revised and may not agree to actual amounts finally recorded by Atlantic Union. This financial information does not reflect the benefits of the Access merger’s expected cost savings and expense efficiencies, opportunities to earn additional revenue, potential impacts of current market conditions on revenues or asset dispositions, among other factors, and includes various preliminary estimates and may not necessarily be indicative of the financial position or results of operations that would have occurred if the merger had been completed on the date or at the beginning of the period indicated or which may be attained in the future. Non-GAAP Financial Measures This presentation contains certain financial information determined by methods other than in accordance with generally accepted accounting principles in the United States (“GAAP”). These non-GAAP disclosures have limitations as an analytical tool and should not be considered in isolation or as a substitute for analysis of our results as reported under GAAP, nor are they necessarily comparable to non-GAAP performance measures that may be presented by other companies. The Company uses the non-GAAP financial measures discussed herein in its analysis of the Company’s performance. The Company’s management believes that these non-GAAP financial measures provide additional understanding of ongoing operations, enhance comparability of results of operations with prior periods and show the effects of significant gains and charges in the periods presented without the impact of items or events that may obscure trends in the Company’s underlying performance. Please see “Reconciliation of Non-GAAP Disclosures” at the end of this presentation for a reconciliation to the nearest GAAP financial measure. No Offer or Solicitation This presentation does not constitute an offer to sell or a solicitation of an offer to buy any securities. No offer of securities shall be made except by means of a prospectus meeting the requirements of the Securities Act of 1933, as amended, and no offer to sell or solicitation of an offer to buy shall be made in any jurisdiction in which such offer, solicitation or sale would be unlawful. About Atlantic Union Bankshares Corporation Headquartered in Richmond, Virginia, Atlantic Union Bankshares Corporation (Nasdaq: AUB) is the holding company for Atlantic Union Bank. Atlantic Union Bank has 149 branches and approximately 200 ATMs located throughout Virginia, and in portions of Maryland and North Carolina. Middleburg Financial is a brand name used by Atlantic Union Bank and certain affiliates when providing trust, wealth management, private banking, and investment advisory products and services. Certain non-bank affiliates of Atlantic Union Bank include: Old Dominion Capital Management, Inc., and its subsidiary, Outfitter Advisors, Ltd., Dixon, Hubard, Feinour & Brown, Inc., and Middleburg Investment Services, LLC, which provide investment advisory and/or brokerage services; and Union Insurance Group, LLC, which offers various lines of insurance products. |
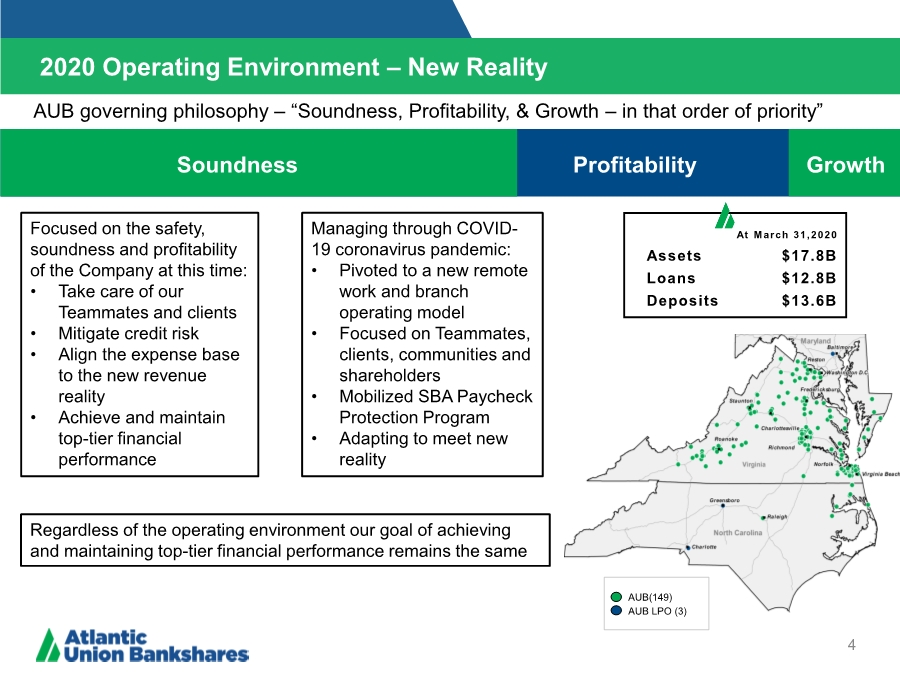
| 2020 Operating Environment – New Reality 4 Soundness Profitability Growth AUB(149) AUB LPO (3) At March 31,2020 Assets $17.8B Loans $12.8B Deposits $13.6B Managing through COVID- 19 coronavirus pandemic: • Pivoted to a new remote work and branch operating model • Focused on Teammates, clients, communities and shareholders • Mobilized SBA Paycheck Protection Program • Adapting to meet new reality AUB governing philosophy –“Soundness, Profitability, & Growth – in that order of priority” Focused on the safety, soundness and profitability of the Company at this time: • Take care of our Teammates and clients • Mitigate credit risk • Align the expense base to the new revenue reality • Achieve and maintain top-tier financial performance Regardless of the operating environment our goal of achieving and maintaining top-tier financial performance remains the same |
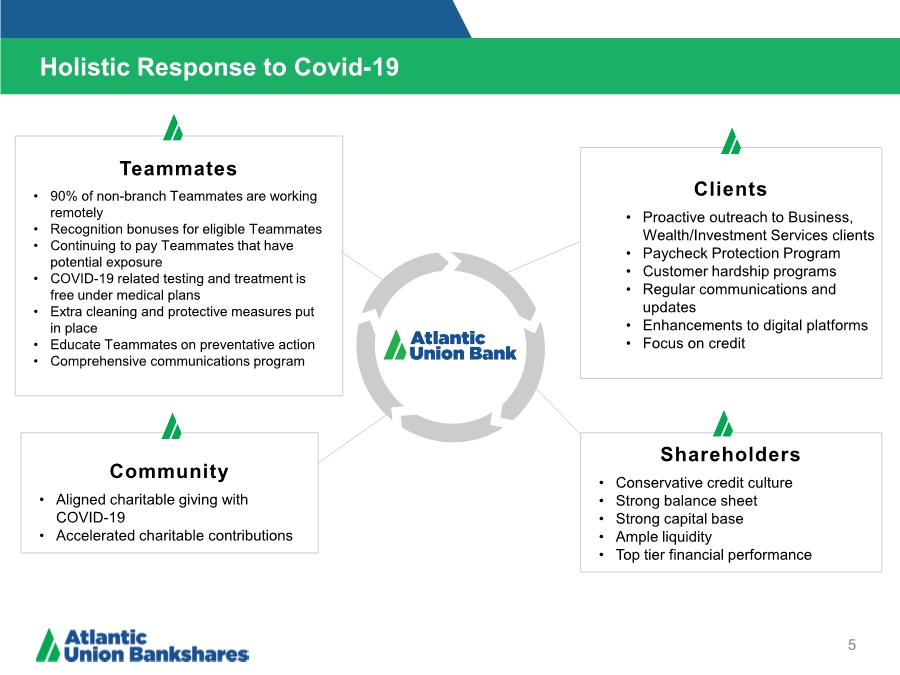
| Teammates • 90% of non-branch Teammates are working remotely • Recognition bonuses for eligible Teammates • Continuing to pay Teammates that have potential exposure • COVID-19 related testing and treatment is free under medical plans • Extra cleaning and protective measures put in place • Educate Teammates on preventative action • Comprehensive communications program Clients • Proactive outreach to Business, Wealth/Investment Services clients • Paycheck Protection Program • Customer hardship programs • Regular communications and updates • Enhancements to digital platforms • Focus on credit Shareholders • Conservative credit culture • Strong balance sheet • Strong capital base • Ample liquidity • Top tier financial performance Community • Aligned charitable giving with COVID-19 • Accelerated charitable contributions Holistic Response to Covid-19 5 |
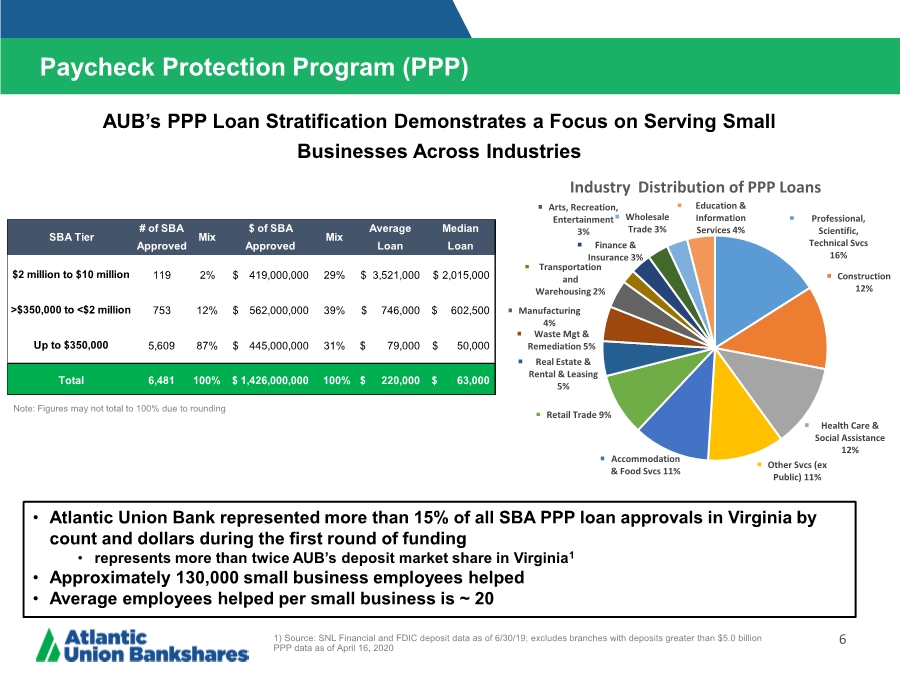
| 6 AUB’s PPP Loan Stratification Demonstrates a Focus on Serving Small Businesses Across Industries Paycheck Protection Program (PPP) Data as of April 16, 2020 Professional, Scientific, Technical Svcs 16% Construction 12% Health Care & Social Assistance 12% Other Svcs (ex Public) 11% Accommodation & Food Svcs 11% Retail Trade 9% Real Estate & Rental & Leasing 5% Waste Mgt & Remediation 5% Manufacturing 4% Transportation and Warehousing 2% Finance & Insurance 3% Arts, Recreation, Entertainment 3% Wholesale Trade 3% Education & Information Services 4% Industry Distribution of PPP Loans # of SBA $ of SBA Average Median Approved Approved Loan Loan $2 million to $10 million 119 2% 419,000,000 $ 29% 3,521,000 $ 2,015,000 $ >$350,000 to <$2 million 753 12% 562,000,000 $ 39% 746,000 $ 602,500 $ Up to $350,000 5,609 87% 445,000,000 $ 31% 79,000 $ 50,000 $ Total 6,481 100% 1,426,000,000 $ 100% 220,000 $ 63,000 $ SBA Tier Mix Mix Note: Figures may not total to 100% due to rounding • Atlantic Union Bank represented more than 15% of all SBA PPP loan approvals in Virginia by count and dollars during the first round of funding • represents more than twice AUB’s deposit market share in Virginia1 • Approximately 130,000 small business employees helped • Average employees helped per small business is ~ 20 1) Source: SNL Financial and FDIC deposit data as of 6/30/19; excludes branches with deposits greater than $5.0 billion PPP data as of April 16, 2020 |
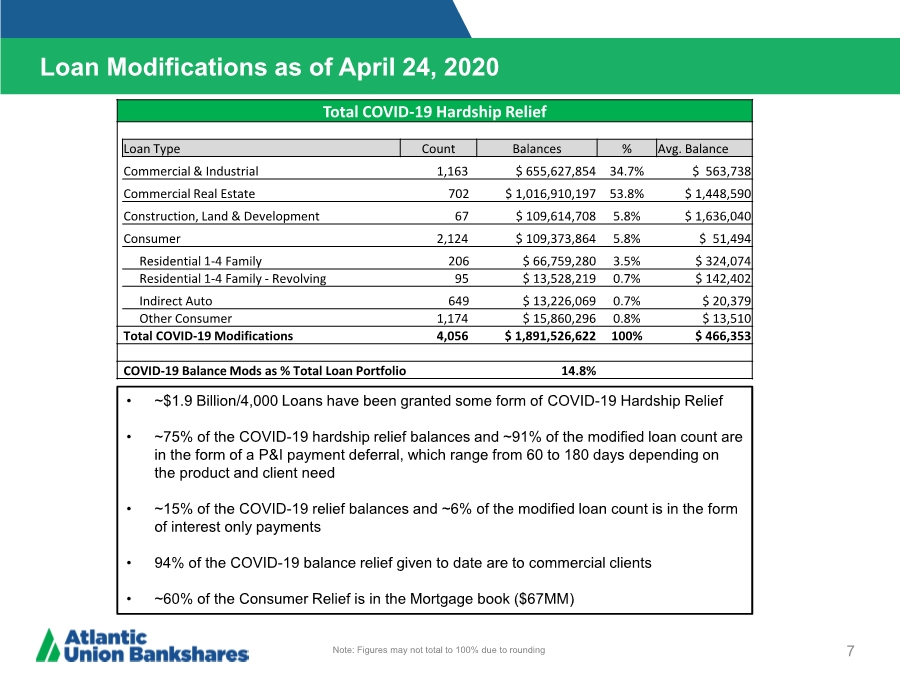
| Loan Modifications as of April 24, 2020 7 • ~$1.9 Billion/4,000 Loans have been granted some form of COVID-19 Hardship Relief • ~75% of the COVID-19 hardship relief balances and ~91% of the modified loan count are in the form of a P&I payment deferral, which range from 60 to 180 days depending on the product and client need • ~15% of the COVID-19 relief balances and ~6% of the modified loan count is in the form of interest only payments • 94% of the COVID-19 balance relief given to date are to commercial clients • ~60% of the Consumer Relief is in the Mortgage book ($67MM) Note: Figures may not total to 100% due to rounding Total COVID-19 Hardship Relief Loan Type Count Balances % Avg. Balance Commercial & Industrial 1,163 $ 655,627,854 34.7% $ 563,738 Commercial Real Estate 702 $ 1,016,910,197 53.8% $ 1,448,590 Construction, Land & Development 67 $ 109,614,708 5.8% $ 1,636,040 Consumer 2,124 $ 109,373,864 5.8% $ 51,494 Residential 1-4 Family 206 $ 66,759,280 3.5% $ 324,074 Residential 1-4 Family - Revolving 95 $ 13,528,219 0.7% $ 142,402 Indirect Auto 649 $ 13,226,069 0.7% $ 20,379 Other Consumer 1,174 $ 15,860,296 0.8% $ 13,510 Total COVID-19 Modifications 4,056 $ 1,891,526,622 100% $ 466,353 COVID-19 Balance Mods as % Total Loan Portfolio 14.8% |
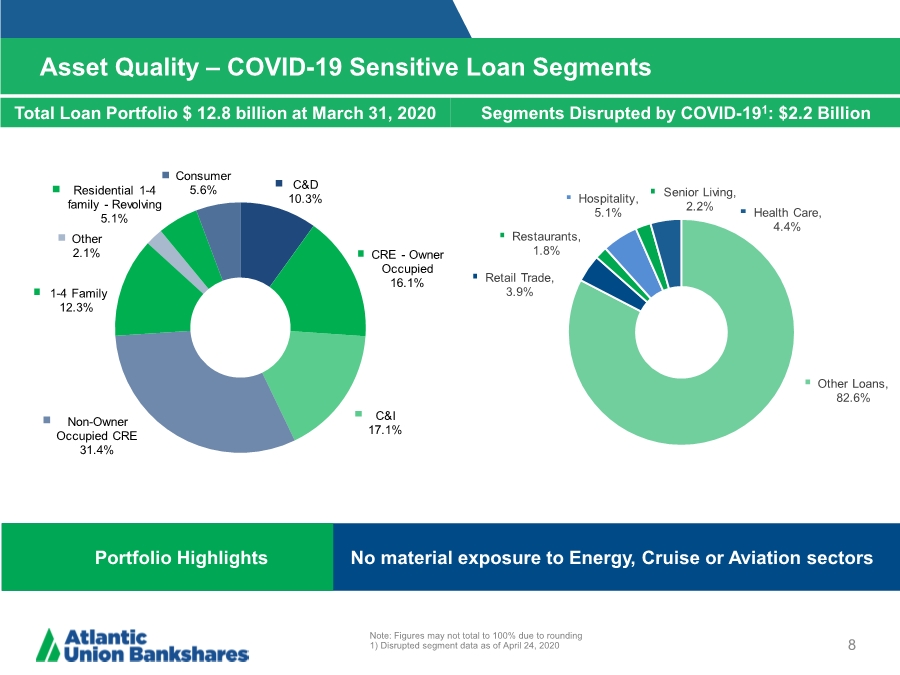
| Asset Quality – COVID-19 Sensitive Loan Segments 8 Note: Figures may not total to 100% due to rounding 1) Disrupted segment data as of April 24, 2020 Total Loan Portfolio $ 12.8 billion at March 31, 2020 Segments Disrupted by COVID-191: $2.2 Billion Portfolio Highlights No material exposure to Energy, Cruise or Aviation sectors C&D 10.3% CRE - Owner Occupied 16.1% C&I 17.1% Non-Owner Occupied CRE 31.4% 1-4 Family 12.3% Other 2.1% Residential 1-4 family - Revolving 5.1% Consumer 5.6% Other Loans, 82.6% Retail Trade, 3.9% Restaurants, 1.8% Hospitality, 5.1% Senior Living, 2.2% Health Care, 4.4% |
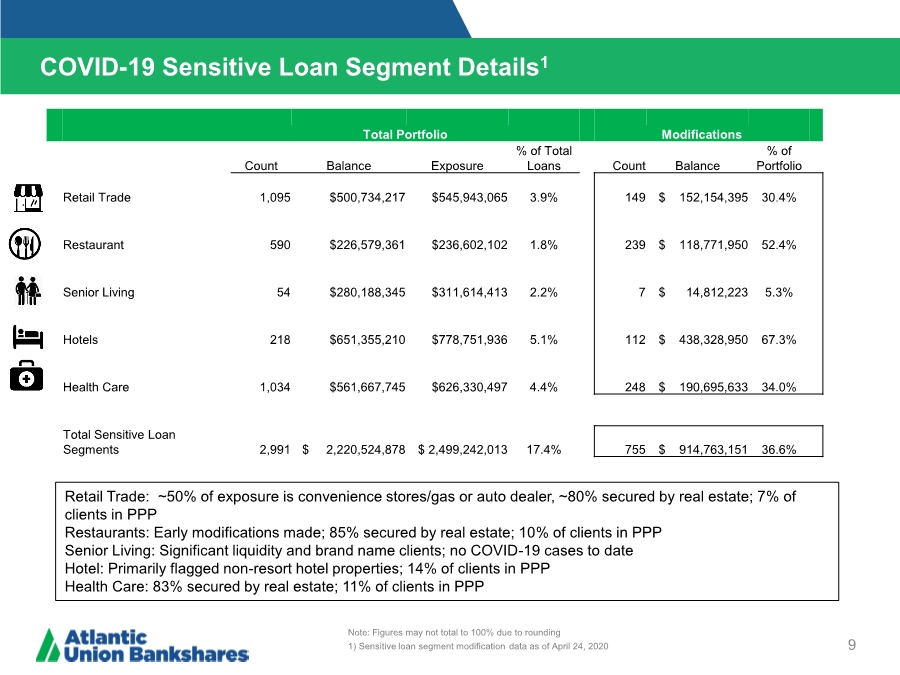
| COVID-19 Sensitive Loan Segment Details1 9 Retail Trade: ~50% of exposure is convenience stores/gas or auto dealer, ~80% secured by real estate; 7% of clients in PPP Restaurants: Early modifications made; 85% secured by real estate; 10% of clients in PPP Senior Living: Significant liquidity and brand name clients; no COVID-19 cases to date Hotel: Primarily flagged non-resort hotel properties; 14% of clients in PPP Health Care: 83% secured by real estate; 11% of clients in PPP Note: Figures may not total to 100% due to rounding 1) Sensitive loan segment modification data as of April 24, 2020 Total Portfolio Modifications Count Balance Exposure % of Total Loans Count Balance % of Portfolio Retail Trade 1,095 $500,734,217 $545,943,065 3.9% 149 $ 152,154,395 30.4% Restaurant 590 $226,579,361 $236,602,102 1.8% 239 $ 118,771,950 52.4% Senior Living 54 $280,188,345 $311,614,413 2.2% 7 $ 14,812,223 5.3% Hotels 218 $651,355,210 $778,751,936 5.1% 112 $ 438,328,950 67.3% Health Care 1,034 $561,667,745 $626,330,497 4.4% 248 $ 190,695,633 34.0% Total Sensitive Loan Segments 2,991 $ 2,220,524,878 $ 2,499,242,013 17.4% 755 $ 914,763,151 36.6% |
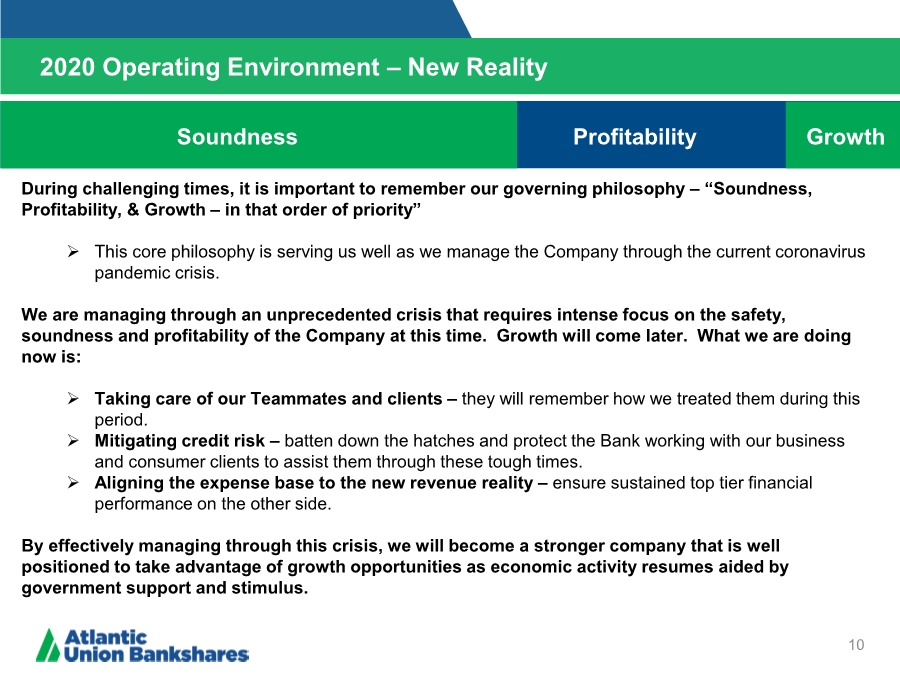
| 2020 Operating Environment – New Reality 10 Soundness Profitability Growth During challenging times, it is important to remember our governing philosophy –“Soundness, Profitability, & Growth – in that order of priority” ➢ This core philosophy is serving us well as we manage the Company through the current coronavirus pandemic crisis. We are managing through an unprecedented crisis that requires intense focus on the safety, soundness and profitability of the Company at this time. Growth will come later. What we are doing now is: ➢ Taking care of our Teammates and clients – they will remember how we treated them during this period. ➢ Mitigating credit risk – batten down the hatches and protect the Bank working with our business and consumer clients to assist them through these tough times. ➢ Aligning the expense base to the new revenue reality – ensure sustained top tier financial performance on the other side. By effectively managing through this crisis, we will become a stronger company that is well positioned to take advantage of growth opportunities as economic activity resumes aided by government support and stimulus. |
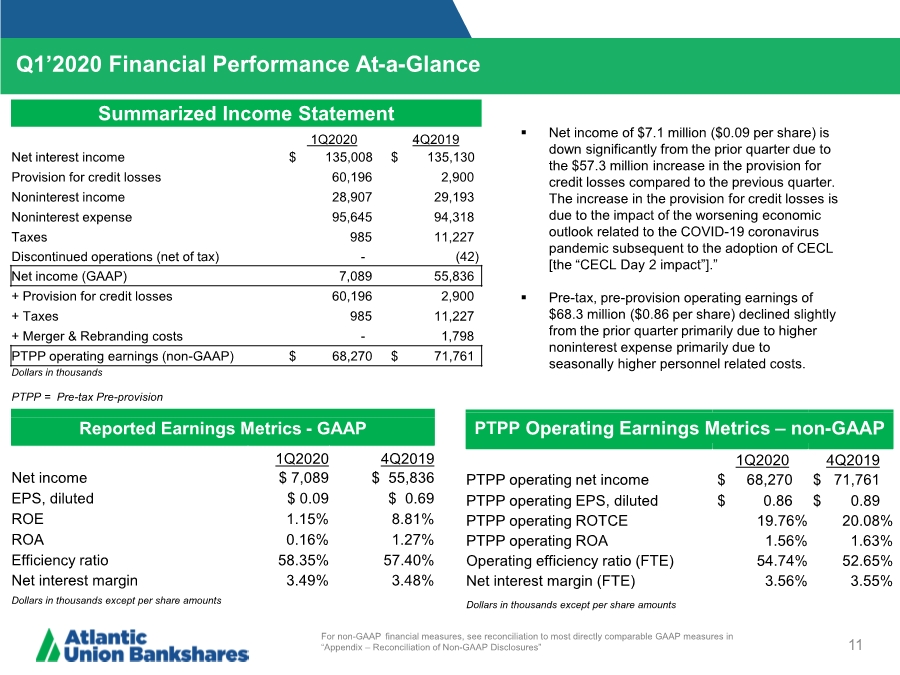
| Q1’2020 Financial Performance At-a-Glance 11 ▪ Net income of $7.1 million ($0.09 per share) is down significantly from the prior quarter due to the $57.3 million increase in the provision for credit losses compared to the previous quarter. The increase in the provision for credit losses is due to the impact of the worsening economic outlook related to the COVID-19 coronavirus pandemic subsequent to the adoption of CECL [the “CECL Day 2 impact”].” ▪ Pre-tax, pre-provision operating earnings of $68.3 million ($0.86 per share) declined slightly from the prior quarter primarily due to higher noninterest expense primarily due to seasonally higher personnel related costs. Summarized Income Statement 1Q2020 4Q2019 Net interest income $ 135,008 $ 135,130 Provision for credit losses 60,196 2,900 Noninterest income 28,907 29,193 Noninterest expense 95,645 94,318 Taxes 985 11,227 Discontinued operations (net of tax) -(42) Net income (GAAP) 7,089 55,836 + Provision for credit losses 60,196 2,900 + Taxes 985 11,227 + Merger & Rebranding costs - 1,798 PTPP operating earnings (non-GAAP) $ 68,270 $ 71,761 Dollars in thousands PTPP = Pre-tax Pre-provision Reported Earnings Metrics - GAAP 1Q2020 4Q2019 Net income $ 7,089 $ 55,836 EPS, diluted $ 0.09 $ 0.69 ROE 1.15% 8.81% ROA 0.16% 1.27% Efficiency ratio 58.35% 57.40% Net interest margin 3.49% 3.48% Dollars in thousands except per share amounts PTPP Operating Earnings Metrics – non-GAAP 1Q2020 4Q2019 PTPP operating net income $ 68,270 $ 71,761 PTPP operating EPS, diluted $ 0.86 $ 0.89 PTPP operating ROTCE 19.76% 20.08% PTPP operating ROA 1.56% 1.63% Operating efficiency ratio (FTE) 54.74% 52.65% Net interest margin (FTE) 3.56% 3.55% Dollars in thousands except per share amounts For non-GAAP financial measures, see reconciliation to most directly comparable GAAP measures in “Appendix – Reconciliation of Non-GAAP Disclosures” |
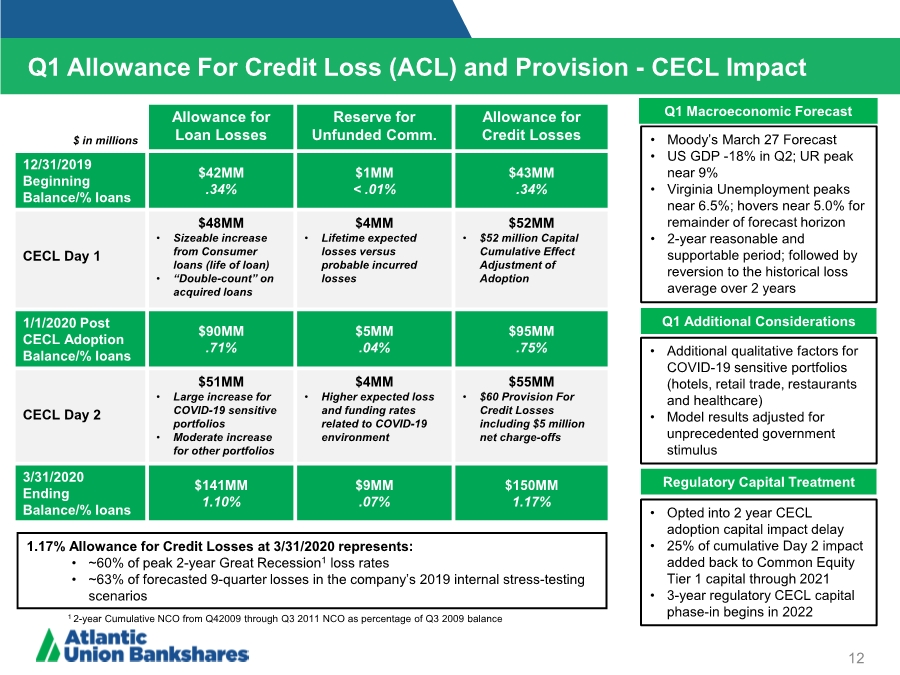
| Q1 Allowance For Credit Loss (ACL) and Provision - CECL Impact 12 Q1 Macroeconomic Forecast Q1 Additional Considerations Regulatory Capital Treatment • Moody’s March 27 Forecast •US GDP -18% in Q2; UR peak near 9% • Virginia Unemployment peaks near 6.5%; hovers near 5.0% for remainder of forecast horizon • 2-year reasonable and supportable period; followed by reversion to the historical loss average over 2 years • Additional qualitative factors for COVID-19 sensitive portfolios (hotels, retail trade, restaurants and healthcare) • Model results adjusted for unprecedented government stimulus • Opted into 2 year CECL adoption capital impact delay • 25% of cumulative Day 2 impact added back to Common Equity Tier 1 capital through 2021 • 3-year regulatory CECL capital phase-in begins in 2022 $ in millions Allowance for Loan Losses Reserve for Unfunded Comm. Allowance for Credit Losses 12/31/2019 Beginning Balance/% loans $42MM ..34% $1MM < .01% $43MM ..34% CECL Day 1 $48MM • Sizeable increase from Consumer loans (life of loan) •“Double-count” on acquired loans $4MM • Lifetime expected losses versus probable incurred losses $52MM • $52 million Capital Cumulative Effect Adjustment of Adoption 1/1/2020 Post CECL Adoption Balance/% loans $90MM ..71% $5MM ..04% $95MM ..75% CECL Day 2 $51MM • Large increase for COVID-19 sensitive portfolios • Moderate increase for other portfolios $4MM • Higher expected loss and funding rates related to COVID-19 environment $55MM • $60 Provision For Credit Losses including $5 million net charge-offs 3/31/2020 Ending Balance/% loans $141MM 1.10% $9MM ..07% $150MM 1.17% 1.17% Allowance for Credit Losses at 3/31/2020 represents: • ~60% of peak 2-year Great Recession1 loss rates • ~63% of forecasted 9-quarter losses in the company’s 2019 internal stress-testing scenarios 1 2-year Cumulative NCO from Q42009 through Q3 2011 NCO as percentage of Q3 2009 balance |
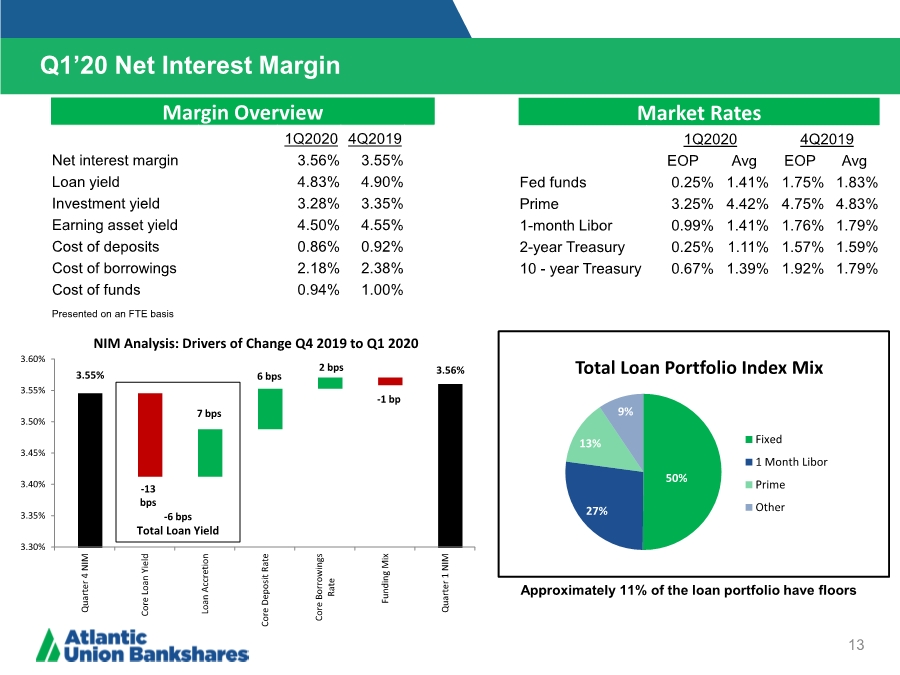
| 13 Q1’20 Net Interest Margin Market Rates 1Q2020 4Q2019 EOP Avg EOP Avg Fed funds 0.25% 1.41% 1.75% 1.83% Prime 3.25% 4.42% 4.75% 4.83% 1-month Libor 0.99% 1.41% 1.76% 1.79% 2-year Treasury 0.25% 1.11% 1.57% 1.59% 10 - year Treasury 0.67% 1.39% 1.92% 1.79% Margin Overview 1Q2020 4Q2019 Net interest margin 3.56% 3.55% Loan yield 4.83% 4.90% Investment yield 3.28% 3.35% Earning asset yield 4.50% 4.55% Cost of deposits 0.86% 0.92% Cost of borrowings 2.18% 2.38% Cost of funds 0.94% 1.00% Presented on an FTE basis Approximately 11% of the loan portfolio have floors 50% 27% 13% 9% Total Loan Portfolio Index Mix Fixed 1 Month Libor Prime Other 3.55% 3.56% 3.30% 3.35% 3.40% 3.45% 3.50% 3.55% 3.60% Quarter 4 NIM Core Loan Yield Loan Accretion Core Deposit Rate Core Borrowings Rate Funding Mix Quarter 1 NIM NIM Analysis: Drivers of Change Q4 2019 to Q1 2020 -13 bps 7 bps 6 bps 2 bps -1 bp Total Loan Yield -6 bps |
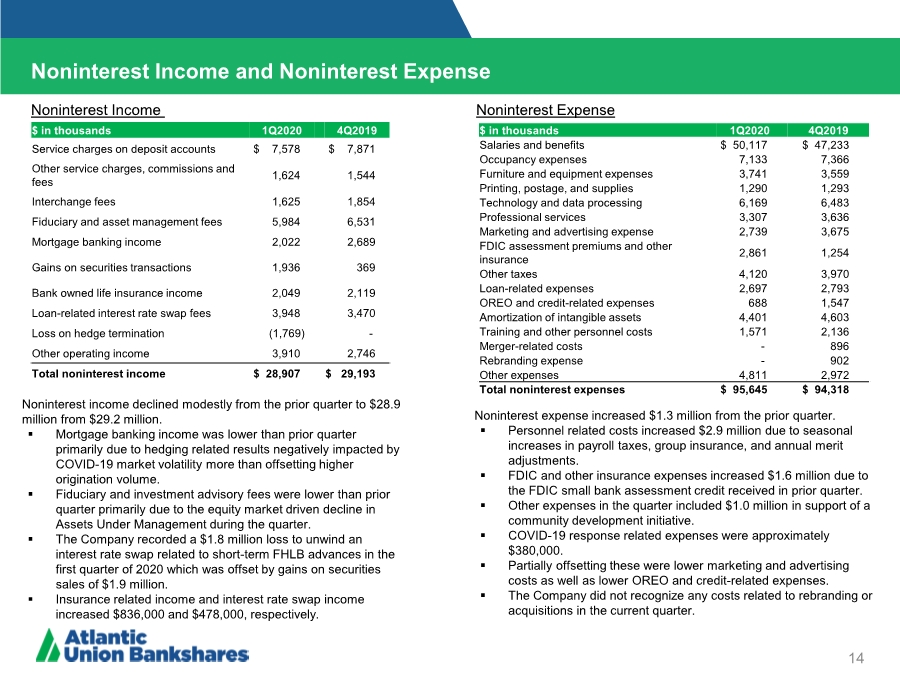
| 14 Noninterest income declined modestly from the prior quarter to $28.9 million from $29.2 million. ▪ Mortgage banking income was lower than prior quarter primarily due to hedging related results negatively impacted by COVID-19 market volatility more than offsetting higher origination volume. ▪ Fiduciary and investment advisory fees were lower than prior quarter primarily due to the equity market driven decline in Assets Under Management during the quarter. ▪ The Company recorded a $1.8 million loss to unwind an interest rate swap related to short-term FHLB advances in the first quarter of 2020 which was offset by gains on securities sales of $1.9 million. ▪ Insurance related income and interest rate swap income increased $836,000 and $478,000, respectively. $ in thousands 1Q2020 4Q2019 Service charges on deposit accounts $ 7,578 $ 7,871 Other service charges, commissions and fees 1,624 1,544 Interchange fees 1,625 1,854 Fiduciary and asset management fees 5,984 6,531 Mortgage banking income 2,022 2,689 Gains on securities transactions 1,936 369 Bank owned life insurance income 2,049 2,119 Loan-related interest rate swap fees 3,948 3,470 Loss on hedge termination (1,769) - Other operating income 3,910 2,746 Total noninterest income $ 28,907 $ 29,193 $ in thousands 1Q2020 4Q2019 Salaries and benefits $ 50,117 $ 47,233 Occupancy expenses 7,133 7,366 Furniture and equipment expenses 3,741 3,559 Printing, postage, and supplies 1,290 1,293 Technology and data processing 6,169 6,483 Professional services 3,307 3,636 Marketing and advertising expense 2,739 3,675 FDIC assessment premiums and other insurance 2,861 1,254 Other taxes 4,120 3,970 Loan-related expenses 2,697 2,793 OREO and credit-related expenses 688 1,547 Amortization of intangible assets 4,401 4,603 Training and other personnel costs 1,571 2,136 Merger-related costs - 896 Rebranding expense - 902 Other expenses 4,811 2,972 Total noninterest expenses $ 95,645 $ 94,318 Noninterest Income and Noninterest Expense Noninterest Income Noninterest Expense Noninterest expense increased $1.3 million from the prior quarter. ▪ Personnel related costs increased $2.9 million due to seasonal increases in payroll taxes, group insurance, and annual merit adjustments. ▪ FDIC and other insurance expenses increased $1.6 million due to the FDIC small bank assessment credit received in prior quarter. ▪ Other expenses in the quarter included $1.0 million in support of a community development initiative. ▪ COVID-19 response related expenses were approximately $380,000. ▪ Partially offsetting these were lower marketing and advertising costs as well as lower OREO and credit-related expenses. ▪ The Company did not recognize any costs related to rebranding or acquisitions in the current quarter. |
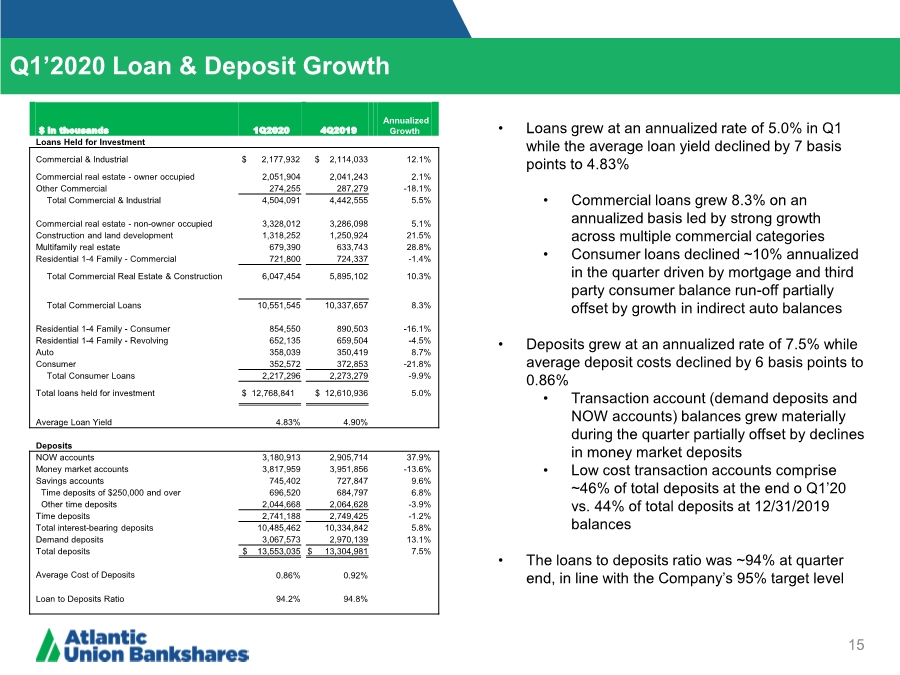
| 15 Q1’2020 Loan & Deposit Growth • Loans grew at an annualized rate of 5.0% in Q1 while the average loan yield declined by 7 basis points to 4.83% • Commercial loans grew 8.3% on an annualized basis led by strong growth across multiple commercial categories • Consumer loans declined ~10% annualized in the quarter driven by mortgage and third party consumer balance run-off partially offset by growth in indirect auto balances • Deposits grew at an annualized rate of 7.5% while average deposit costs declined by 6 basis points to 0.86% • Transaction account (demand deposits and NOW accounts) balances grew materially during the quarter partially offset by declines in money market deposits • Low cost transaction accounts comprise ~46% of total deposits at the end o Q1’20 vs. 44% of total deposits at 12/31/2019 balances • The loans to deposits ratio was ~94% at quarter end, in line with the Company’s 95% target level $ in thousands 1Q2020 4Q2019 Annualized Growth Loans Held for Investment Commercial & Industrial $ 2,177,932 $ 2,114,033 12.1% Commercial real estate - owner occupied 2,051,904 2,041,243 2.1% Other Commercial 274,255 287,279 -18.1% Total Commercial & Industrial 4,504,091 4,442,555 5.5% Commercial real estate - non-owner occupied 3,328,012 3,286,098 5.1% Construction and land development 1,318,252 1,250,924 21.5% Multifamily real estate 679,390 633,743 28.8% Residential 1-4 Family - Commercial 721,800 724,337 -1.4% Total Commercial Real Estate & Construction 6,047,454 5,895,102 10.3% Total Commercial Loans 10,551,545 10,337,657 8.3% Residential 1-4 Family - Consumer 854,550 890,503 -16.1% Residential 1-4 Family - Revolving 652,135 659,504 -4.5% Auto 358,039 350,419 8.7% Consumer 352,572 372,853 -21.8% Total Consumer Loans 2,217,296 2,273,279 -9.9% Total loans held for investment $ 12,768,841 $ 12,610,936 5.0% Average Loan Yield 4.83% 4.90% Deposits NOW accounts 3,180,913 2,905,714 37.9% Money market accounts 3,817,959 3,951,856 -13.6% Savings accounts 745,402 727,847 9.6% Time deposits of $250,000 and over 696,520 684,797 6.8% Other time deposits 2,044,668 2,064,628 -3.9% Time deposits 2,741,188 2,749,425 -1.2% Total interest-bearing deposits 10,485,462 10,334,842 5.8% Demand deposits 3,067,573 2,970,139 13.1% Total deposits $ 13,553,035 $ 13,304,981 7.5% Average Cost of Deposits 0.86% 0.92% Loan to Deposits Ratio 94.2% 94.8% |
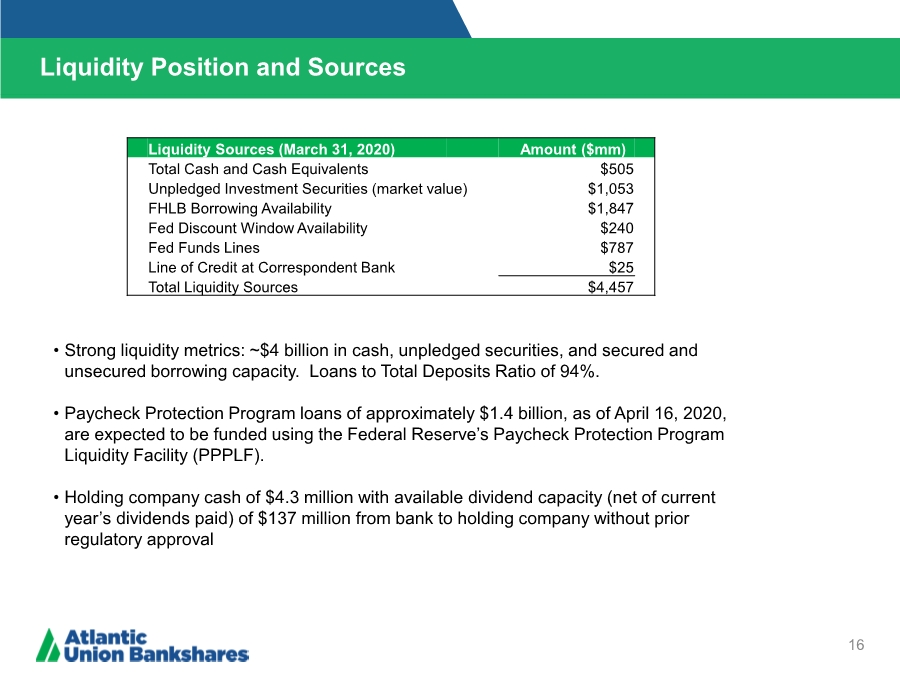
| Liquidity Position and Sources 16 • Strong liquidity metrics: ~$4 billion in cash, unpledged securities, and secured and unsecured borrowing capacity. Loans to Total Deposits Ratio of 94%. • Paycheck Protection Program loans of approximately $1.4 billion, as of April 16, 2020, are expected to be funded using the Federal Reserve’s Paycheck Protection Program Liquidity Facility (PPPLF). • Holding company cash of $4.3 million with available dividend capacity (net of current year’s dividends paid) of $137 million from bank to holding company without prior regulatory approval Liquidity Sources (March 31, 2020) Amount ($mm) Total Cash and Cash Equivalents $505 Unpledged Investment Securities (market value) $1,053 FHLB Borrowing Availability $1,847 Fed Discount Window Availability $240 Fed Funds Lines $787 Line of Credit at Correspondent Bank $25 Total Liquidity Sources $4,457 |
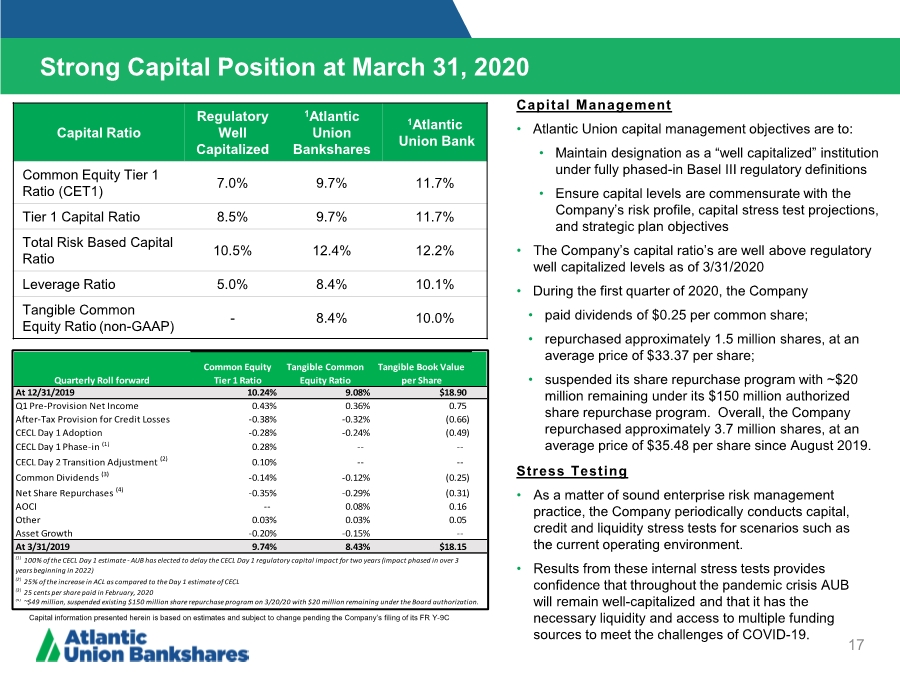
| Strong Capital Position at March 31, 2020 17 Capital Ratio Regulatory Well Capitalized 1Atlantic Union Bankshares 1Atlantic Union Bank Common Equity Tier 1 Ratio (CET1) 7.0% 9.7% 11.7% Tier 1 Capital Ratio 8.5% 9.7% 11.7% Total Risk Based Capital Ratio 10.5% 12.4% 12.2% Leverage Ratio 5.0% 8.4% 10.1% Tangible Common Equity Ratio (non-GAAP) - 8.4% 10.0% Common Equity Tier 1 Ratio Tangible Common Equity Ratio Tangible Book Value per Share At 12/31/2019 10.24% 9.08% $18.90 Q1 Pre-Provision Net Income 0.43% 0.36% 0.75 After-Tax Provision for Credit Losses -0.38% -0.32% (0.66) CECL Day 1 Adoption -0.28% -0.24% (0.49) CECL Day 1 Phase-in (1) 0.28% -- -- CECL Day 2 Transition Adjustment (2) 0.10% -- -- Common Dividends (3) -0.14% -0.12% (0.25) Net Share Repurchases (4) -0.35% -0.29% (0.31) AOCI -- 0.08% 0.16 Other 0.03% 0.03% 0.05 Asset Growth -0.20% -0.15% -- At 3/31/2019 9.74% 8.43% $18.15 (2) 25% of the increase in ACL as compared to the Day 1 estimate of CECL (3) 25 cents per share paid in February, 2020 (4) ~$49 million, suspended existing $150 million share repurchase program on 3/20/20 with $20 million remaining under the Board authorization. (1) 100% of the CECL Day 1 estimate - AUB has elected to delay the CECL Day 1 regulatory capital impact for two years (impact phased in over 3 years beginning in 2022) Quarterly Roll forward Stress Testing • As a matter of sound enterprise risk management practice, the Company periodically conducts capital, credit and liquidity stress tests for scenarios such as the current operating environment. • Results from these internal stress tests provides confidence that throughout the pandemic crisis AUB will remain well-capitalized and that it has the necessary liquidity and access to multiple funding sources to meet the challenges of COVID-19. Capital information presented herein is based on estimates and subject to change pending the Company’s filing of its FR Y-9C Capital Management • Atlantic Union capital management objectives are to: • Maintain designation as a “well capitalized” institution under fully phased-in Basel III regulatory definitions • Ensure capital levels are commensurate with the Company’s risk profile, capital stress test projections, and strategic plan objectives • The Company’s capital ratio’s are well above regulatory well capitalized levels as of 3/31/2020 • During the first quarter of 2020, the Company • paid dividends of $0.25 per common share; • repurchased approximately 1.5 million shares, at an average price of $33.37 per share; • suspended its share repurchase program with ~$20 million remaining under its $150 million authorized share repurchase program. Overall, the Company repurchased approximately 3.7 million shares, at an average price of $35.48 per share since August 2019. |
| Appendix |
| Reconciliation of Non-GAAP Disclosures 19 ($ IN THOUSANDS) Operating Earnings Per Share For the 12 Months Ended 2016 2017 2018 2015 2014 2019 The Company has provided supplemental performance measures on a tax-equivalent, tangible, operating, or pre- tax pre-provision basis. These non-GAAP financial measures are a supplement to GAAP, which is used to prepare the Company’s financial statements, and should not be considered in isolation or as a substitute for comparable measures calculated in accordance with GAAP. In addition, the Company’s non-GAAP financial measures may not be comparable to non-GAAP financial measures of other companies. The Company uses the non-GAAP financial measures discussed herein in its analysis of the Company’s performance. The Company’s management believes that these non-GAAP financial measures provide additional understanding of ongoing operations, enhance comparability of results of operations with prior periods and show the effects of significant gains and charges in the periods presented without the impact of items or events that may obscure trends in the Company’s underlying performance. |
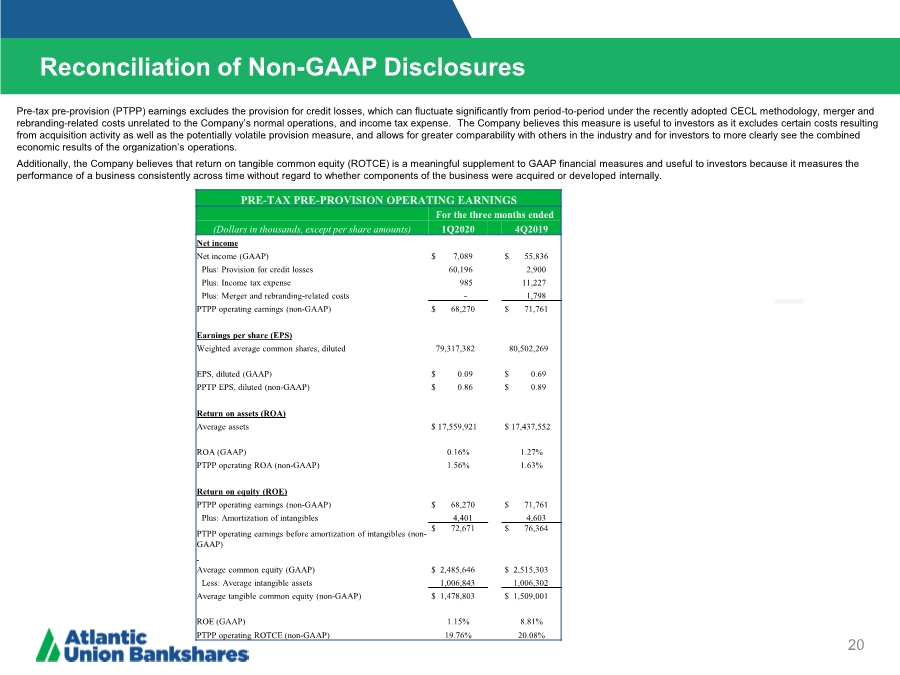
| Reconciliation of Non-GAAP Disclosures 20 ($ IN THOUSANDS) Operating Earnings Per Share For the 12 Months Ended 2016 2017 2018 2015 2014 2019 PRE-TAX PRE-PROVISION OPERATING EARNINGS For the three months ended (Dollars in thousands, except per share amounts) 1Q2020 4Q2019 Net income Net income (GAAP) $ 7,089 $ 55,836 Plus: Provision for credit losses 60,196 2,900 Plus: Income tax expense 985 11,227 Plus: Merger and rebranding-related costs - 1,798 PTPP operating earnings (non-GAAP) $ 68,270 $ 71,761 Earnings per share (EPS) Weighted average common shares, diluted 79,317,382 80,502,269 EPS, diluted (GAAP) $ 0.09 $ 0.69 PPTP EPS, diluted (non-GAAP) $ 0.86 $ 0.89 Return on assets (ROA) Average assets $ 17,559,921 $ 17,437,552 ROA (GAAP) 0.16% 1.27% PTPP operating ROA (non-GAAP) 1.56% 1.63% Return on equity (ROE) PTPP operating earnings (non-GAAP) $ 68,270 $ 71,761 Plus: Amortization of intangibles 4,401 4,603 PTPP operating earnings before amortization of intangibles (non- GAAP) $ 72,671 $ 76,364 Average common equity (GAAP) $ 2,485,646 $ 2,515,303 Less: Average intangible assets 1,006,843 1,006,302 Average tangible common equity (non-GAAP) $ 1,478,803 $ 1,509,001 ROE (GAAP) 1.15% 8.81% PTPP operating ROTCE (non-GAAP) 19.76% 20.08% Pre-tax pre-provision (PTPP) earnings excludes the provision for credit losses, which can fluctuate significantly from period-to-period under the recently adopted CECL methodology, merger and rebranding-related costs unrelated to the Company’s normal operations, and income tax expense. The Company believes this measure is useful to investors as it excludes certain costs resulting from acquisition activity as well as the potentially volatile provision measure, and allows for greater comparability with others in the industry and for investors to more clearly see the combined economic results of the organization’s operations. Additionally, the Company believes that return on tangible common equity (ROTCE) is a meaningful supplement to GAAP financial measures and useful to investors because it measures the performance of a business consistently across time without regard to whether components of the business were acquired or developed internally. |
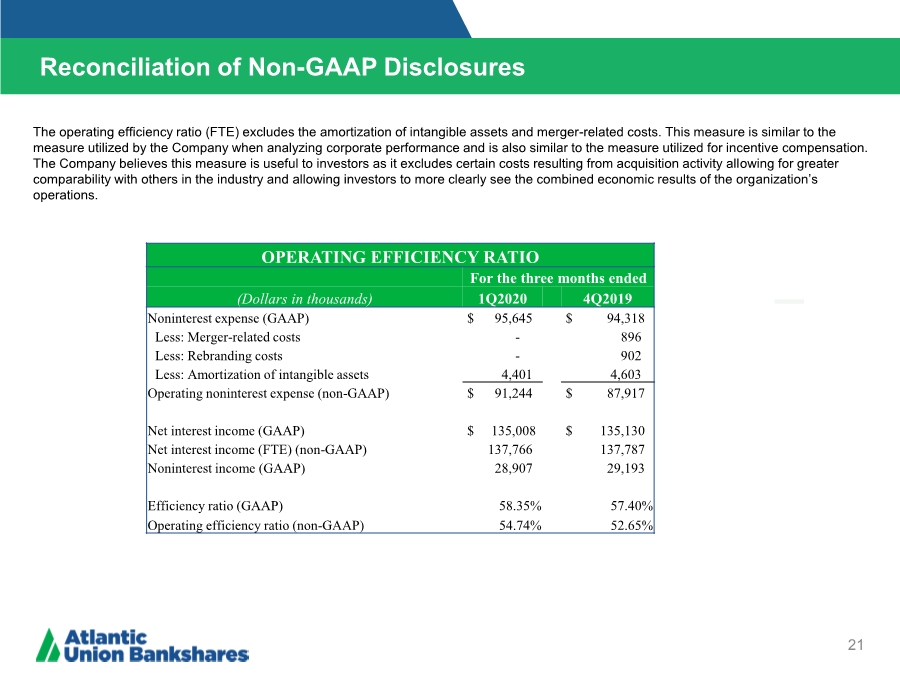
| Reconciliation of Non-GAAP Disclosures 21 ($ IN THOUSANDS) Operating Earnings Per Share For the 12 Months Ended 2016 2017 2018 2015 2014 2019 OPERATING EFFICIENCY RATIO For the three months ended (Dollars in thousands) 1Q2020 4Q2019 Noninterest expense (GAAP) $ 95,645 $ 94,318 Less: Merger-related costs - 896 Less: Rebranding costs - 902 Less: Amortization of intangible assets 4,401 4,603 Operating noninterest expense (non-GAAP) $ 91,244 $ 87,917 Net interest income (GAAP) $ 135,008 $ 135,130 Net interest income (FTE) (non-GAAP) 137,766 137,787 Noninterest income (GAAP) 28,907 29,193 Efficiency ratio (GAAP) 58.35% 57.40% Operating efficiency ratio (non-GAAP) 54.74% 52.65% The operating efficiency ratio (FTE) excludes the amortization of intangible assets and merger-related costs. This measure is similar to the measure utilized by the Company when analyzing corporate performance and is also similar to the measure utilized for incentive compensation. The Company believes this measure is useful to investors as it excludes certain costs resulting from acquisition activity allowing for greater comparability with others in the industry and allowing investors to more clearly see the combined economic results of the organization’s operations. |
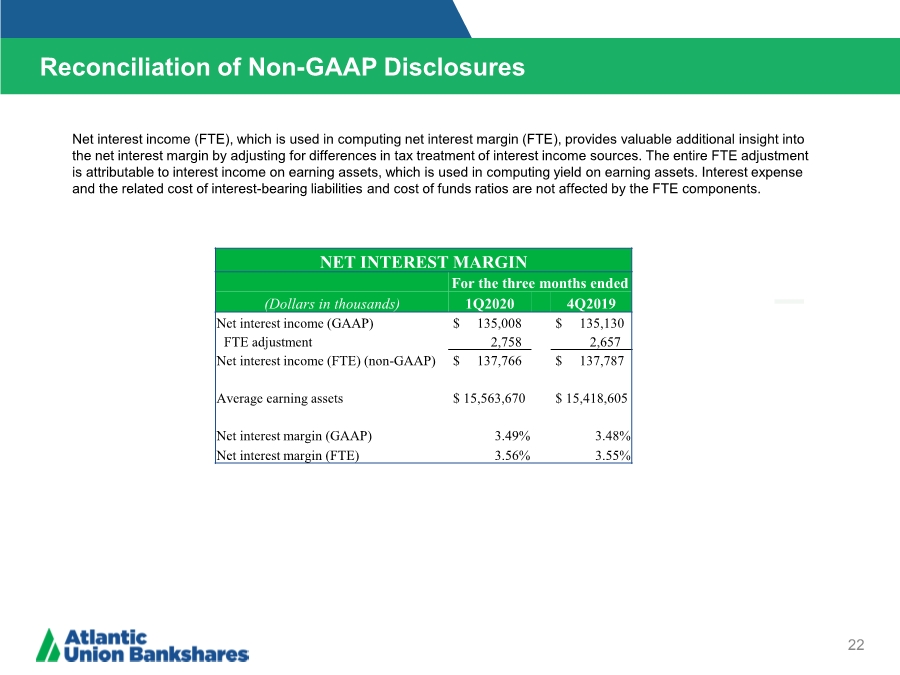
| Reconciliation of Non-GAAP Disclosures 22 ($ IN THOUSANDS) Operating Earnings Per Share For the 12 Months Ended 2016 2017 2018 2015 2014 2019 NET INTEREST MARGIN For the three months ended (Dollars in thousands) 1Q2020 4Q2019 Net interest income (GAAP) $ 135,008 $ 135,130 FTE adjustment 2,758 2,657 Net interest income (FTE) (non-GAAP) $ 137,766 $ 137,787 Average earning assets $ 15,563,670 $ 15,418,605 Net interest margin (GAAP) 3.49% 3.48% Net interest margin (FTE) 3.56% 3.55% Net interest income (FTE), which is used in computing net interest margin (FTE), provides valuable additional insight into the net interest margin by adjusting for differences in tax treatment of interest income sources. The entire FTE adjustment is attributable to interest income on earning assets, which is used in computing yield on earning assets. Interest expense and the related cost of interest-bearing liabilities and cost of funds ratios are not affected by the FTE components. |
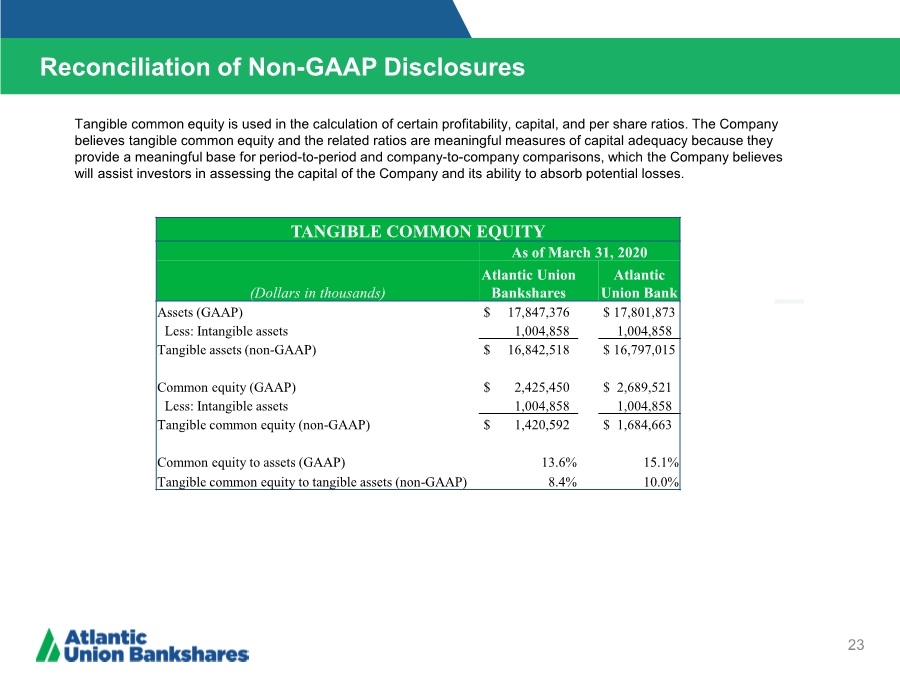
| Reconciliation of Non-GAAP Disclosures 23 ($ IN THOUSANDS) Operating Earnings Per Share For the 12 Months Ended 2016 2017 2018 2015 2014 2019 TANGIBLE COMMON EQUITY As of March 31, 2020 (Dollars in thousands) Atlantic Union Bankshares Atlantic Union Bank Assets (GAAP) $ 17,847,376 $ 17,801,873 Less: Intangible assets 1,004,858 1,004,858 Tangible assets (non-GAAP) $ 16,842,518 $ 16,797,015 Common equity (GAAP) $ 2,425,450 $ 2,689,521 Less: Intangible assets 1,004,858 1,004,858 Tangible common equity (non-GAAP) $ 1,420,592 $ 1,684,663 Common equity to assets (GAAP) 13.6% 15.1% Tangible common equity to tangible assets (non-GAAP) 8.4% 10.0% Tangible common equity is used in the calculation of certain profitability, capital, and per share ratios. The Company believes tangible common equity and the related ratios are meaningful measures of capital adequacy because they provide a meaningful base for period-to-period and company-to-company comparisons, which the Company believes will assist investors in assessing the capital of the Company and its ability to absorb potential losses. |