| Investor Presentation Nasdaq: AUB August – September 2019 |

| Forward Looking Statements 2 Certain statements in this presentation may constitute “forward-looking statements” within the meaning of the Private Securities Litigation Reform Act of 1995. Forward- looking statements include, without limitation, projections, predictions, expectations or beliefs about future events or results that are not statements of historical fact. Such forward-looking statements are based on various assumptions as of the time they are made, and are inherently subject to known and unknown risks, uncertainties, and other factors that may cause actual results, performance or achievements to be materially different from those expressed or implied by such forward-looking statements. Forward-looking statements are often accompanied by words that convey projected future events or outcomes such as “expect,” “believe,” “estimate,” “plan,” “project,” “anticipate,” “intend,” “will,” “may,” “view,” “opportunity,” “potential,” or words of similar meaning or other statements concerning opinions or judgment of Atlantic Union Bankshares Corporation (“Atlantic Union” or the “Company”) and its management about future events. Although Atlantic Union believes that its expectations with respect to forward-looking statements are based upon reasonable assumptions within the bounds of its existing knowledge of its business and operations, there can be no assurance that actual results, performance, or achievements of, or trends affecting, the Company will not differ materially from any projected future results, performance, or achievements or trends expressed or implied by such forward-looking statements. Actual future results, performance, achievements or trends may differ materially from historical results or those anticipated depending on a variety of factors, including, but not limited to: changes in interest rates; general economic and financial market conditions in the United States generally and particularly in the markets in which the Company operates and which its loans are concentrated, including the effects of declines in real estate values, an increase in unemployment levels and slowdowns in economic growth; the Company’s ability to manage its growth or implement its growth strategy; the possibility that any of the anticipated benefits of the acquisition of Access National Corporation (together with subsidiaries, “Access”) will not be realized or will not be realized within the expected time period, the expected revenue synergies and cost savings from the acquisition may not be fully realized or realized within the expected time frame, revenues following the acquisition may be lower than expected, or customer and employee relationships and business operations may be disrupted by the acquisition; the Company’s ability to recruit and retain key employees; the incremental cost and/or decreased revenues associated with exceeding $10 billion in assets; real estate values in the Company’s lending area; an insufficient allowance for loan losses; the quality or composition of the loan or investment portfolios; concentrations of loans secured by real estate, particularly commercial real estate; the effectiveness of the Company’s credit processes and management of the Company’s credit risk; demand for loan products and financial services in the Company’s market area; the Company’s ability to compete in the market for financial services; technological risks and developments, and cyber threats, attacks, or events; performance by the Company’s counterparties or vendors; deposit flows; the availability of financing and the terms thereof; the level of prepayments on loans and mortgage-backed securities; legislative or regulatory changes and requirements; the impact of the Tax Cuts and Jobs Act of 2017 (the “Tax Act”), including, but not limited to, the effect of the lower corporate tax rate, including on the valuation of the Company’s tax assets and liabilities; changes in the effect of the Tax Act due to issuance of interpretive regulatory guidance or enactment of corrective or supplement legislation; monetary and fiscal policies of the U.S. government including policies of the U.S. Department of the Treasury and the Board of Governors of the Federal Reserve System; changes to applicable accounting principles and guidelines; and other factors, many of which are beyond the control of the Company. Please refer to the “Risk Factors” and “Management’s Discussion and Analysis of Financial Condition and Results of Operations” sections of the Company’s Annual Report on Form 10-K for the year ended December 31, 2018, comparable “Risk Factors” sections of the Company’s Quarterly Reports on Form 10-Q, and related disclosures in other filings, which have been filed with the Securities and Exchange Commission (the “SEC”), and are available on the SEC’s website at www.sec.gov. All of the forward-looking statements made in this presentation are expressly qualified by the cautionary statements contained or referred to herein. The actual results or developments anticipated may not be realized or, even if substantially realized, they may not have the expected consequences to or effects on the Company or its businesses or operations. You are cautioned not to rely too heavily on the forward- looking statements contained in this presentation. Forward-looking statements speak only as of the date they are made and the Company does not undertake any obligation to update, revise or clarify these forward-looking statements, whether as a result of new information, future events or otherwise. |
| Additional Information 3 Unaudited Pro Forma Financial Information Any unaudited pro forma financial information included herein, or discussed in connection with, is presented for informational purposes only and does not necessarily reflect the financial results of the combined company had the companies actually been combined during periods presented. The adjustments included in any such unaudited pro forma financial information are preliminary and may be significantly revised and may not agree to actual amounts finally recorded by Atlantic Union. This financial information does not reflect the benefits of the Access merger’s expected cost savings and expense efficiencies, opportunities to earn additional revenue, potential impacts of current market conditions on revenues or asset dispositions, among other factors, and includes various preliminary estimates and may not necessarily be indicative of the financial position or results of operations that would have occurred if the merger had been completed on the date or at the beginning of the period indicated or which may be attained in the future. Non-GAAP Financial Measures This presentation contains certain financial information determined by methods other than in accordance with generally accepted accounting principles in the United States (“GAAP”). These non-GAAP disclosures have limitations as an analytical tool and should not be considered in isolation or as a substitute for analysis of our results as reported under GAAP, nor are they necessarily comparable to non-GAAP performance measures that may be presented by other companies. The Company uses the non-GAAP financial measures discussed herein in its analysis of the Company’s performance. The Company’s management believes that these non-GAAP financial measures provide additional understanding of ongoing operations, enhance comparability of results of operations with prior periods and show the effects of significant gains and charges in the periods presented without the impact of items or events that may obscure trends in the Company’s underlying performance. Please see “Reconciliation of Non-GAAP Disclosures” at the end of this presentation for a reconciliation to the nearest GAAP financial measure. No Offer or Solicitation This presentation does not constitute an offer to sell or a solicitation of an offer to buy any securities. No offer of securities shall be made except by means of a prospectus meeting the requirements of the Securities Act of 1933, as amended, and no offer to sell or solicitation of an offer to buy shall be made in any jurisdiction in which such offer, solicitation or sale would be unlawful. About Atlantic Union Bankshares Corporation Headquartered in Richmond, Virginia, Atlantic Union Bankshares Corporation (Nasdaq: AUB) is the holding company for Atlantic Union Bank. Atlantic Union Bank has 153 branches, seven of which are operated as Xenith Bank, a division of Atlantic Union Bank, and approximately 200 ATMs located throughout Virginia, and in portions of Maryland and North Carolina. Middleburg Financial is a brand name used by Atlantic Union Bank and certain affiliates when providing trust, wealth management, private banking, investment advisory and brokerage products and services. Certain non-bank affiliates of Atlantic Union Bank include: Old Dominion Capital Management, Inc., and its subsidiary, Outfitter Advisors, Ltd., Dixon, Hubard, Feinour & Brown, Inc., and Middleburg Investment Services, LLC, which provide investment advisory and/or brokerage services; and Union Insurance Group, LLC, which offers various lines of insurance products. |
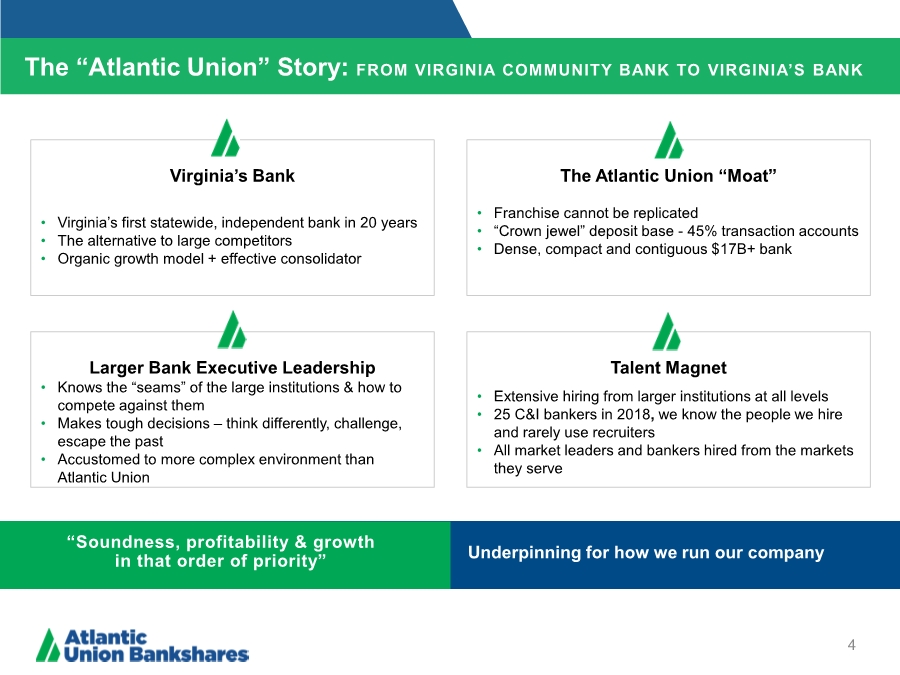
| The “Atlantic Union” Story: FROM VIRGINIA COMMUNITY BANK TO VIRGINIA’S BANK 4 Virginia’s Bank The Atlantic Union “Moat” Larger Bank Executive Leadership Talent Magnet • Virginia’s first statewide, independent bank in 20 years • The alternative to large competitors • Organic growth model + effective consolidator • Franchise cannot be replicated •“Crown jewel” deposit base - 45% transaction accounts • Dense, compact and contiguous $17B+ bank • Knows the “seams” of the large institutions & how to compete against them • Makes tough decisions – think differently, challenge, escape the past • Accustomed to more complex environment than Atlantic Union • Extensive hiring from larger institutions at all levels • 25 C&I bankers in 2018, we know the people we hire and rarely use recruiters • All market leaders and bankers hired from the markets they serve “Soundness, profitability & growth in that order of priority” Underpinning for how we run our company |
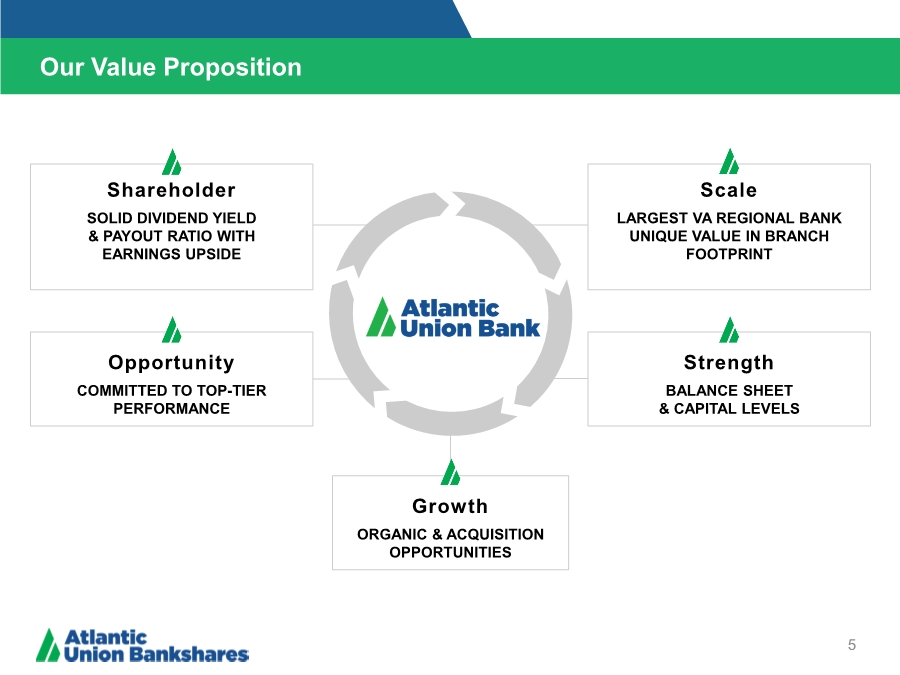
| Shareholder SOLID DIVIDEND YIELD & PAYOUT RATIO WITH EARNINGS UPSIDE Scale LARGEST VA REGIONAL BANK UNIQUE VALUE IN BRANCH FOOTPRINT Strength BALANCE SHEET & CAPITAL LEVELS Opportunity COMMITTED TO TOP-TIER PERFORMANCE Our Value Proposition 5 Growth ORGANIC & ACQUISITION OPPORTUNITIES |
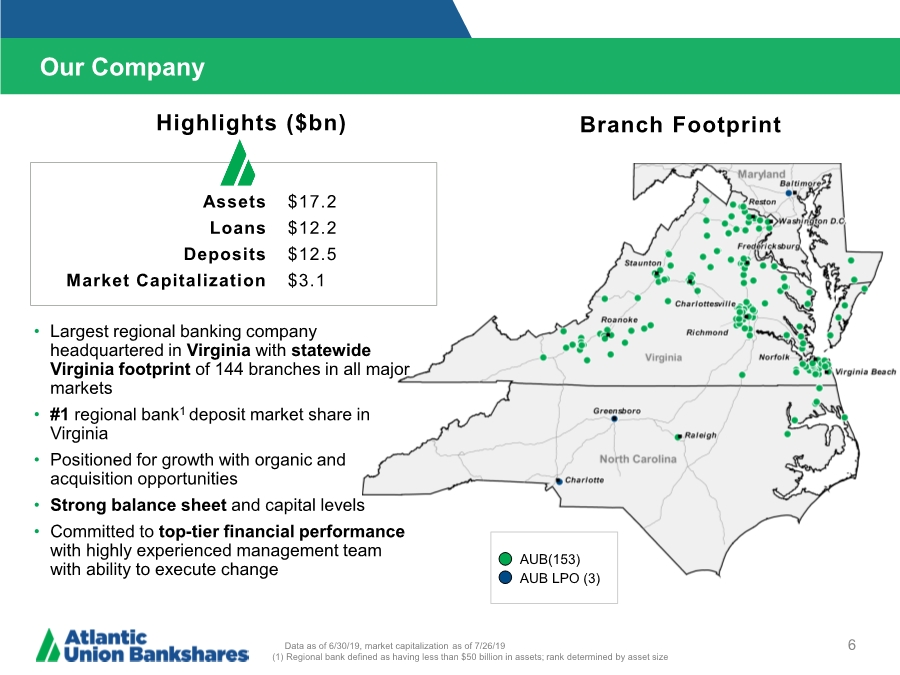
| Our Company 6 Branch Footprint AUB(153) AUB LPO (3) Data as of 6/30/19, market capitalization as of 7/26/19 (1) Regional bank defined as having less than $50 billion in assets; rank determined by asset size Assets Loans Deposits Market Capitalization $17.2 $12.2 $12.5 $3.1 • Largest regional banking company headquartered in Virginia with statewide Virginia footprint of 144 branches in all major markets •#1 regional bank1 deposit market share in Virginia • Positioned for growth with organic and acquisition opportunities • Strong balance sheet and capital levels • Committed to top-tier financial performance with highly experienced management team with ability to execute change Highlights ($bn) |
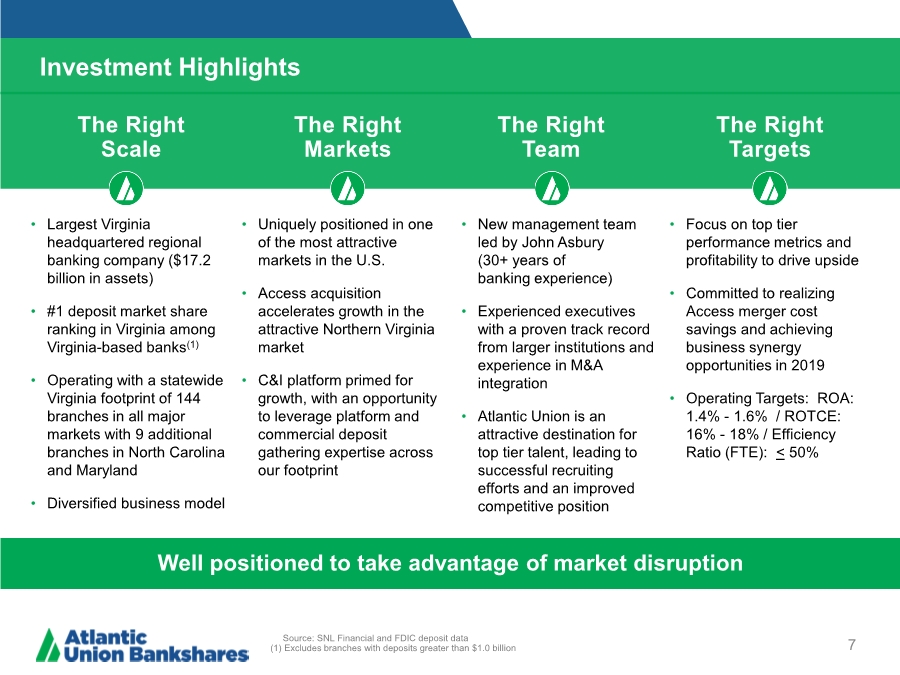
| Investment Highlights 7 The Right Scale The Right Markets The Right Team The Right Targets • Largest Virginia headquartered regional banking company ($17.2 billion in assets) •#1 deposit market share ranking in Virginia among Virginia-based banks(1) • Operating with a statewide Virginia footprint of 144 branches in all major markets with 9 additional branches in North Carolina and Maryland • Diversified business model • Uniquely positioned in one of the most attractive markets in the U.S. • Access acquisition accelerates growth in the attractive Northern Virginia market • C&I platform primed for growth, with an opportunity to leverage platform and commercial deposit gathering expertise across our footprint • New management team led by John Asbury (30+ years of banking experience) • Experienced executives with a proven track record from larger institutions and experience in M&A integration • Atlantic Union is an attractive destination for top tier talent, leading to successful recruiting efforts and an improved competitive position • Focus on top tier performance metrics and profitability to drive upside • Committed to realizing Access merger cost savings and achieving business synergy opportunities in 2019 • Operating Targets: ROA: 1.4% - 1.6% / ROTCE: 16% - 18% / Efficiency Ratio (FTE): < 50% Source: SNL Financial and FDIC deposit data (1) Excludes branches with deposits greater than $1.0 billion Well positioned to take advantage of market disruption |
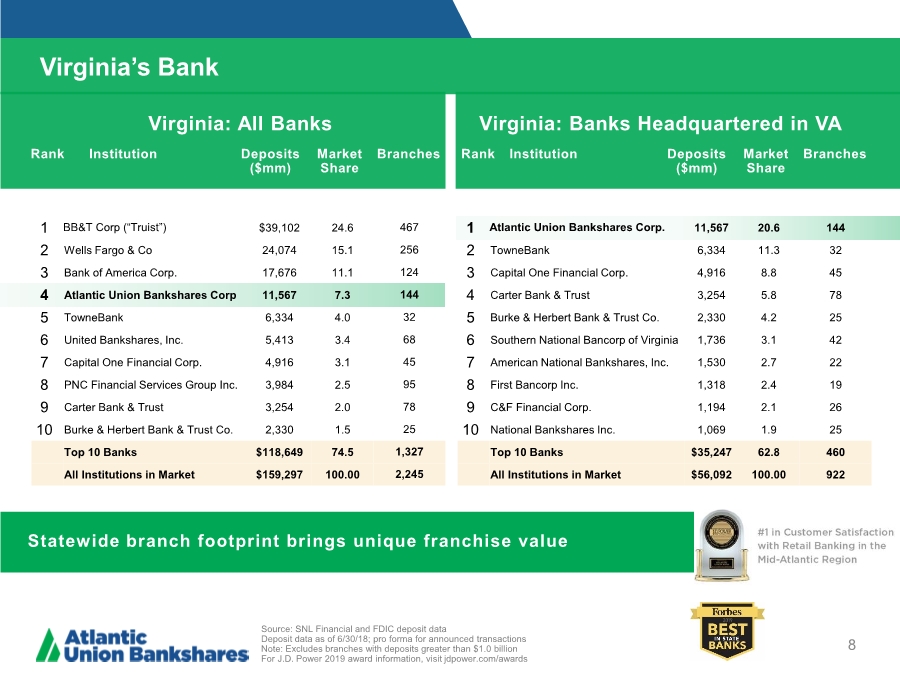
| Virginia’s Bank 8 Virginia: All Banks Virginia: Banks Headquartered in VA Rank Institution Deposits ($mm) Market Share Branches 1 BB&T Corp (“Truist”) $39,102 24.6 467 2 Wells Fargo & Co 24,074 15.1 256 3 Bank of America Corp. 17,676 11.1 124 4 Atlantic Union Bankshares Corp 11,567 7.3 144 5 TowneBank 6,334 4.0 32 6 United Bankshares, Inc. 5,413 3.4 68 7 Capital One Financial Corp. 4,916 3.1 45 8 PNC Financial Services Group Inc. 3,984 2.5 95 9 Carter Bank & Trust 3,254 2.0 78 10 Burke & Herbert Bank & Trust Co. 2,330 1.5 25 Top 10 Banks $118,649 74.5 1,327 All Institutions in Market $159,297 100.00 2,245 Rank Institution Deposits ($mm) Market Share Branches 1 Atlantic Union Bankshares Corp. 11,567 20.6 144 2 TowneBank 6,334 11.3 32 3 Capital One Financial Corp. 4,916 8.8 45 4 Carter Bank & Trust 3,254 5.8 78 5 Burke & Herbert Bank & Trust Co. 2,330 4.2 25 6 Southern National Bancorp of Virginia 1,736 3.1 42 7 American National Bankshares, Inc. 1,530 2.7 22 8 First Bancorp Inc. 1,318 2.4 19 9 C&F Financial Corp. 1,194 2.1 26 10 National Bankshares Inc. 1,069 1.9 25 Top 10 Banks $35,247 62.8 460 All Institutions in Market $56,092 100.00 922 Source: SNL Financial and FDIC deposit data Deposit data as of 6/30/18; pro forma for announced transactions Note: Excludes branches with deposits greater than $1.0 billion For J.D. Power 2019 award information, visit jdpower.com/awards Statewide branch footprint brings unique franchise value |
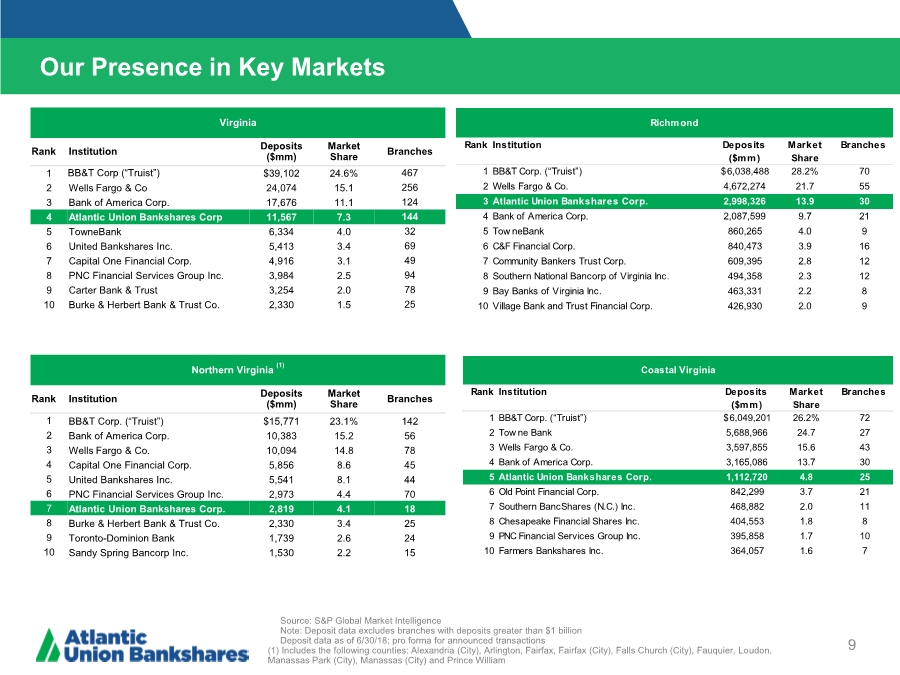
| Our Presence in Key Markets 9 Source: S&P Global Market Intelligence Note: Deposit data excludes branches with deposits greater than $1 billion Deposit data as of 6/30/18; pro forma for announced transactions (1) Includes the following counties: Alexandria (City), Arlington, Fairfax, Fairfax (City), Falls Church (City), Fauquier, Loudon, Manassas Park (City), Manassas (City) and Prince William Northern Virginia (1) Rank Institution Deposits ($mm) Market Share Branches 1 BB&T Corp. (“Truist”) $15,771 23.1% 142 2 Bank of America Corp. 10,383 15.2 56 3 Wells Fargo & Co. 10,094 14.8 78 4 Capital One Financial Corp. 5,856 8.6 45 5 United Bankshares Inc. 5,541 8.1 44 6 PNC Financial Services Group Inc. 2,973 4.4 70 7 Atlantic Union Bankshares Corp. 2,819 4.1 18 8 Burke & Herbert Bank & Trust Co. 2,330 3.4 25 9 Toronto-Dominion Bank 1,739 2.6 24 10 Sandy Spring Bancorp Inc. 1,530 2.2 15 Virginia Rank Institution Deposits ($mm) Market Share Branches 1 BB&T Corp (“Truist”) $39,102 24.6% 467 2 Wells Fargo & Co 24,074 15.1 256 3 Bank of America Corp. 17,676 11.1 124 4 Atlantic Union Bankshares Corp 11,567 7.3 144 5 TowneBank 6,334 4.0 32 6 United Bankshares Inc. 5,413 3.4 69 7 Capital One Financial Corp. 4,916 3.1 49 8 PNC Financial Services Group Inc. 3,984 2.5 94 9 Carter Bank & Trust 3,254 2.0 78 10 Burke & Herbert Bank & Trust Co. 2,330 1.5 25 Rank Institution Deposits ($mm) Market Share Branches 1 BB&T Corp. (“Truist”) 6,038,488 $ 28.2% 70 2 Wells Fargo & Co. 4,672,274 21.7 55 3 Atlantic Union Bankshares Corp. 2,998,326 13.9 30 4 Bank of America Corp. 2,087,599 9.7 21 5 Tow neBank 860,265 4.0 9 6 C&F Financial Corp. 840,473 3.9 16 7 Community Bankers Trust Corp. 609,395 2.8 12 8 Southern National Bancorp of Virginia Inc. 494,358 2.3 12 9 Bay Banks of Virginia Inc. 463,331 2.2 8 10 Village Bank and Trust Financial Corp. 426,930 2.0 9 Richmond Rank Institution Deposits ($mm) Market Share Branches 1 BB&T Corp. (“Truist”) 6,049,201 $ 26.2% 72 2 Tow ne Bank 5,688,966 24.7 27 3 Wells Fargo & Co. 3,597,855 15.6 43 4 Bank of America Corp. 3,165,086 13.7 30 5 Atlantic Union Bankshares Corp. 1,112,720 4.8 25 6 Old Point Financial Corp. 842,299 3.7 21 7 Southern BancShares (N.C.) Inc. 468,882 2.0 11 8 Chesapeake Financial Shares Inc. 404,553 1.8 8 9 PNC Financial Services Group Inc. 395,858 1.7 10 10 Farmers Bankshares Inc. 364,057 1.6 7 Coastal Virginia |
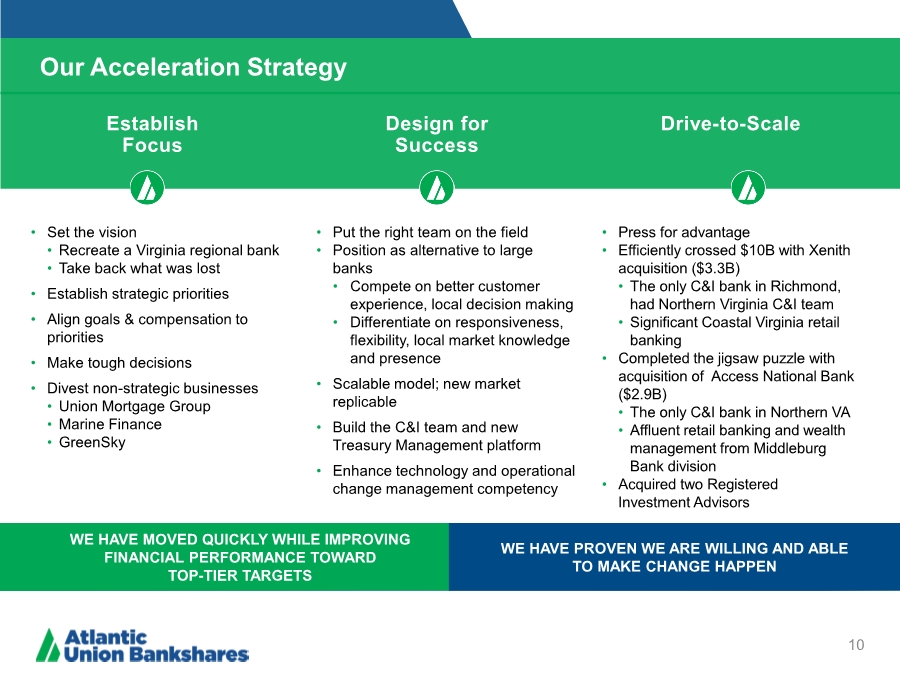
| Our Acceleration Strategy 10 Establish Focus Design for Success Drive-to-Scale • Set the vision • Recreate a Virginia regional bank • Take back what was lost • Establish strategic priorities • Align goals & compensation to priorities • Make tough decisions • Divest non-strategic businesses • Union Mortgage Group • Marine Finance • GreenSky • Put the right team on the field • Position as alternative to large banks • Compete on better customer experience, local decision making • Differentiate on responsiveness, flexibility, local market knowledge and presence • Scalable model; new market replicable • Build the C&I team and new Treasury Management platform • Enhance technology and operational change management competency • Press for advantage • Efficiently crossed $10B with Xenith acquisition ($3.3B) • The only C&I bank in Richmond, had Northern Virginia C&I team • Significant Coastal Virginia retail banking • Completed the jigsaw puzzle with acquisition of Access National Bank ($2.9B) • The only C&I bank in Northern VA • Affluent retail banking and wealth management from Middleburg Bank division • Acquired two Registered Investment Advisors WE HAVE MOVED QUICKLY WHILE IMPROVING FINANCIAL PERFORMANCE TOWARD TOP-TIER TARGETS WE HAVE PROVEN WE ARE WILLING AND ABLE TO MAKE CHANGE HAPPEN |
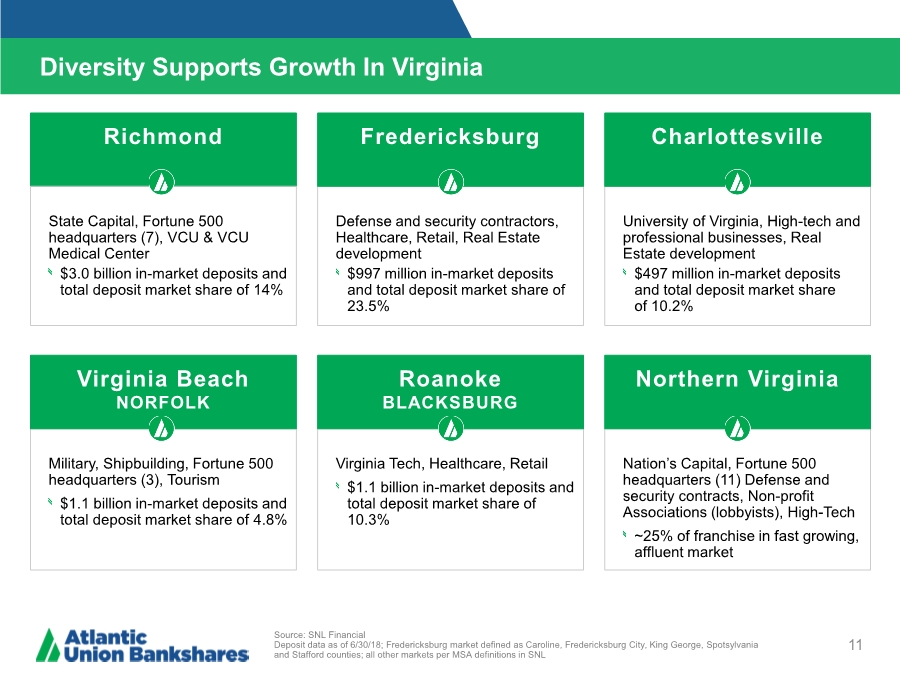
| Richmond Diversity Supports Growth In Virginia 11 Source: SNL Financial Deposit data as of 6/30/18; Fredericksburg market defined as Caroline, Fredericksburg City, King George, Spotsylvania and Stafford counties; all other markets per MSA definitions in SNL State Capital, Fortune 500 headquarters (7), VCU & VCU Medical Center $3.0 billion in-market deposits and total deposit market share of 14% Defense and security contractors, Healthcare, Retail, Real Estate development $997 million in-market deposits and total deposit market share of 23.5% Fredericksburg University of Virginia, High-tech and professional businesses, Real Estate development $497 million in-market deposits and total deposit market share of 10.2% Charlottesville Military, Shipbuilding, Fortune 500 headquarters (3), Tourism $1.1 billion in-market deposits and total deposit market share of 4.8% Virginia Tech, Healthcare, Retail $1.1 billion in-market deposits and total deposit market share of 10.3% Nation’s Capital, Fortune 500 headquarters (11) Defense and security contracts, Non-profit Associations (lobbyists), High-Tech ~25% of franchise in fast growing, affluent market Virginia Beach NORFOLK Roanoke BLACKSBURG Northern Virginia |
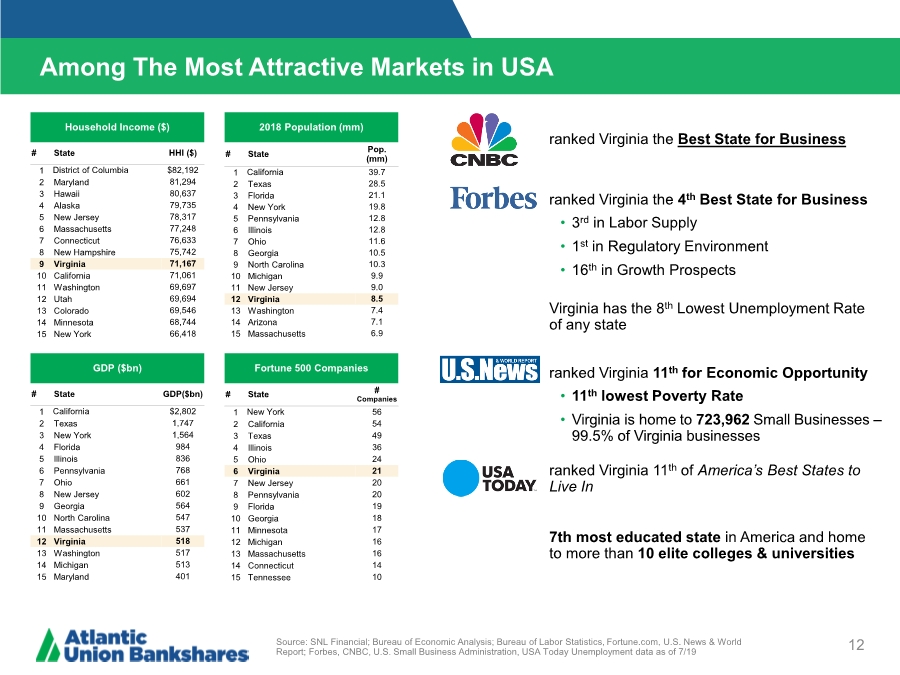
| Among The Most Attractive Markets in USA 12 Household Income ($) # State HHI ($) 1 District of Columbia $82,192 2 Maryland 81,294 3 Hawaii 80,637 4 Alaska 79,735 5 New Jersey 78,317 6 Massachusetts 77,248 7 Connecticut 76,633 8 New Hampshire 75,742 9 Virginia 71,167 10 California 71,061 11 Washington 69,697 12 Utah 69,694 13 Colorado 69,546 14 Minnesota 68,744 15 New York 66,418 GDP ($bn) # State GDP($bn) 1 California $2,802 2 Texas 1,747 3 New York 1,564 4 Florida 984 5 Illinois 836 6 Pennsylvania 768 7 Ohio 661 8 New Jersey 602 9 Georgia 564 10 North Carolina 547 11 Massachusetts 537 12 Virginia 518 13 Washington 517 14 Michigan 513 15 Maryland 401 2018 Population (mm) # State Pop. (mm) 1 California 39.7 2 Texas 28.5 3 Florida 21.1 4 New York 19.8 5 Pennsylvania 12.8 6 Illinois 12.8 7 Ohio 11.6 8 Georgia 10.5 9 North Carolina 10.3 10 Michigan 9.9 11 New Jersey 9.0 12 Virginia 8.5 13 Washington 7.4 14 Arizona 7.1 15 Massachusetts 6.9 Fortune 500 Companies # State # Companies 1 New York 56 2 California 54 3 Texas 49 4 Illinois 36 5 Ohio 24 6 Virginia 21 7 New Jersey 20 8 Pennsylvania 20 9 Florida 19 10 Georgia 18 11 Minnesota 17 12 Michigan 16 13 Massachusetts 16 14 Connecticut 14 15 Tennessee 10 • 3rd in Labor Supply • 1st in Regulatory Environment • 16th in Growth Prospects ranked Virginia the Best State for Business ranked Virginia the 4th Best State for Business Virginia has the 8th Lowest Unemployment Rate of any state • 11th lowest Poverty Rate • Virginia is home to 723,962 Small Businesses – 99.5% of Virginia businesses ranked Virginia 11th for Economic Opportunity ranked Virginia 11th of America’s Best States to Live In 7th most educated state in America and home to more than 10 elite colleges & universities Source: SNL Financial; Bureau of Economic Analysis; Bureau of Labor Statistics, Fortune.com, U.S. News & World Report; Forbes, CNBC, U.S. Small Business Administration, USA Today Unemployment data as of 7/19 |
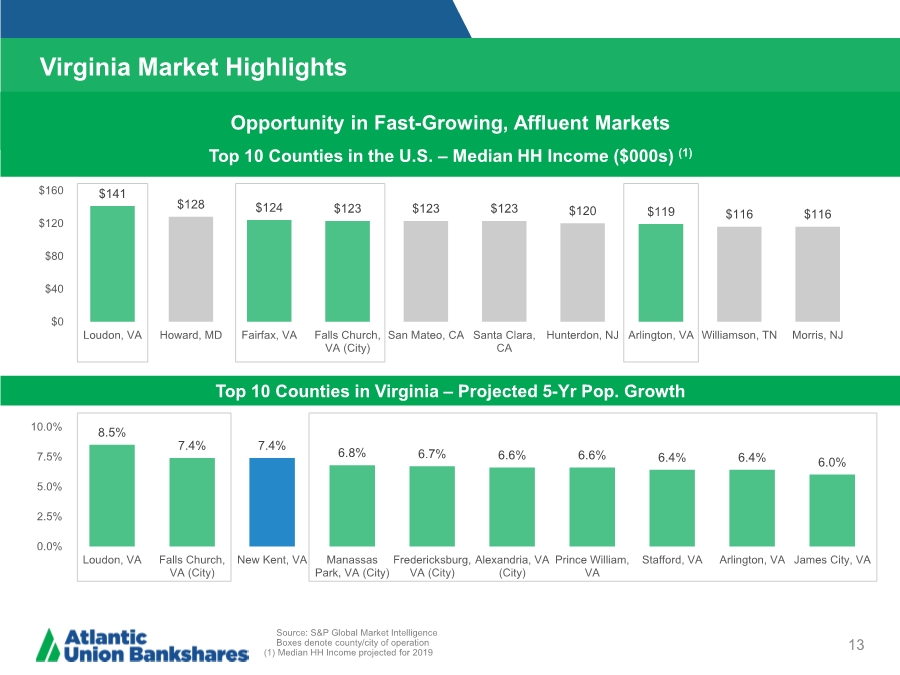
| 8.5% 7.4% 7.4% 6.8% 6.7% 6.6% 6.6% 6.4% 6.4% 6.0% 0.0% 2.5% 5.0% 7.5% 10.0% Loudon, VA Falls Church, VA (City) New Kent, VA Manassas Park, VA (City) Fredericksburg, VA (City) Alexandria, VA (City) Prince William, VA Stafford, VA Arlington, VA James City, VA $141 $128 $124 $123 $123 $123 $120 $119 $116 $116 $0 $40 $80 $120 $160 Loudon, VA Howard, MD Fairfax, VA Falls Church, VA (City) San Mateo, CA Santa Clara, CA Hunterdon, NJ Arlington, VA Williamson, TN Morris, NJ Virginia Market Highlights 13 Source: S&P Global Market Intelligence Boxes denote county/city of operation (1) Median HH Income projected for 2019 Top 10 Counties in Virginia – Projected 5-Yr Pop. Growth Opportunity in Fast-Growing, Affluent Markets Top 10 Counties in the U.S. – Median HH Income ($000s) (1) |
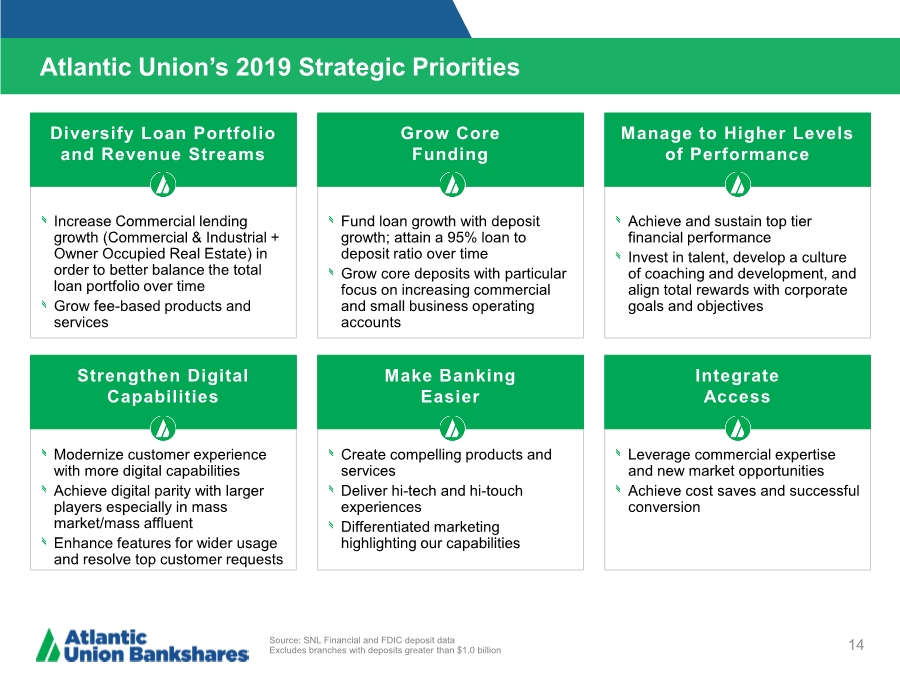
| Atlantic Union’s 2019 Strategic Priorities 14 Source: SNL Financial and FDIC deposit data Excludes branches with deposits greater than $1.0 billion Increase Commercial lending growth (Commercial & Industrial + Owner Occupied Real Estate) in order to better balance the total loan portfolio over time Grow fee-based products and services Diversify Loan Portfolio and Revenue Streams Fund loan growth with deposit growth; attain a 95% loan to deposit ratio over time Grow core deposits with particular focus on increasing commercial and small business operating accounts Grow Core Funding Achieve and sustain top tier financial performance Invest in talent, develop a culture of coaching and development, and align total rewards with corporate goals and objectives Manage to Higher Levels of Performance Modernize customer experience with more digital capabilities Achieve digital parity with larger players especially in mass market/mass affluent Enhance features for wider usage and resolve top customer requests Create compelling products and services Deliver hi-tech and hi-touch experiences Differentiated marketing highlighting our capabilities Leverage commercial expertise and new market opportunities Achieve cost saves and successful conversion Strengthen Digital Capabilities Make Banking Easier Integrate Access |
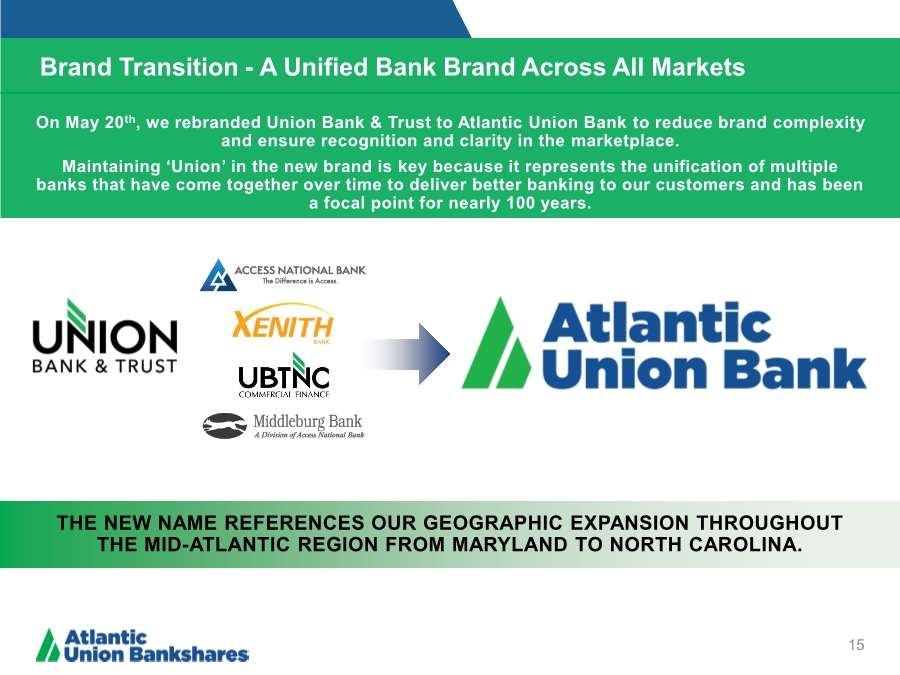
| Brand Transition - A Unified Bank Brand Across All Markets 15 On May 20th, we rebranded Union Bank & Trust to Atlantic Union Bank to reduce brand complexity and ensure recognition and clarity in the marketplace. Maintaining ‘Union’ in the new brand is key because it represents the unification of multiple banks that have come together over time to deliver better banking to our customers and has been a focal point for nearly 100 years. THE NEW NAME REFERENCES OUR GEOGRAPHIC EXPANSION THROUGHOUT THE MID-ATLANTIC REGION FROM MARYLAND TO NORTH CAROLINA. |
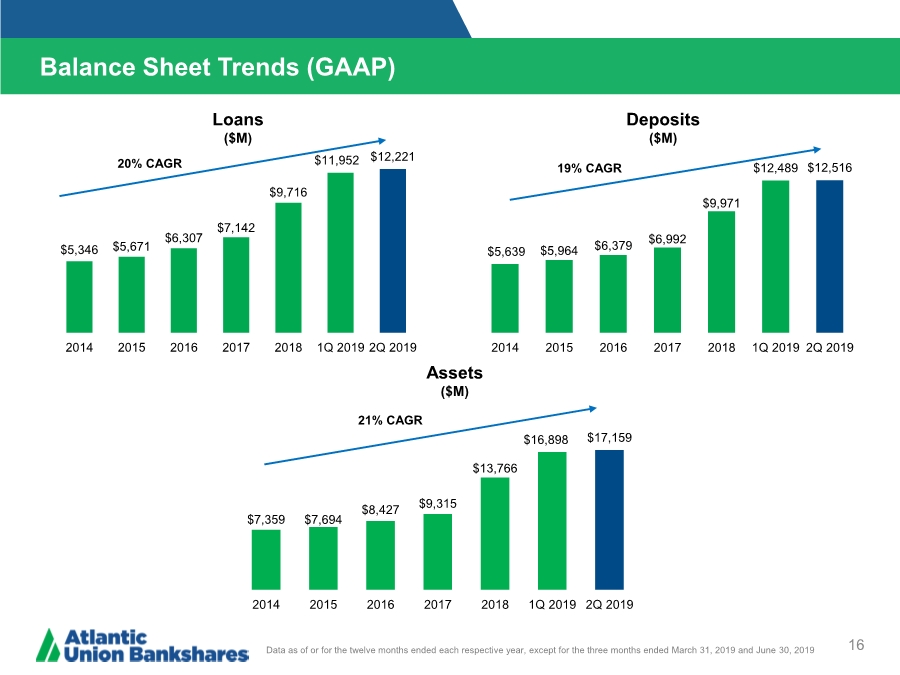
| $7,359 $7,694 $8,427 $9,315 $13,766 $16,898 $17,159 2014 2015 2016 2017 2018 1Q 2019 2Q 2019 $5,639 $5,964 $6,379 $6,992 $9,971 $12,489 $12,516 2014 2015 2016 2017 2018 1Q 2019 2Q 2019 $5,346 $5,671 $6,307 $7,142 $9,716 $11,952 $12,221 2014 2015 2016 2017 2018 1Q 2019 2Q 2019 Balance Sheet Trends (GAAP) 16 Loans ($M) Deposits ($M) Assets ($M) Data as of or for the twelve months ended each respective year, except for the three months ended March 31, 2019 and June 30, 2019 20% CAGR 19% CAGR 21% CAGR |
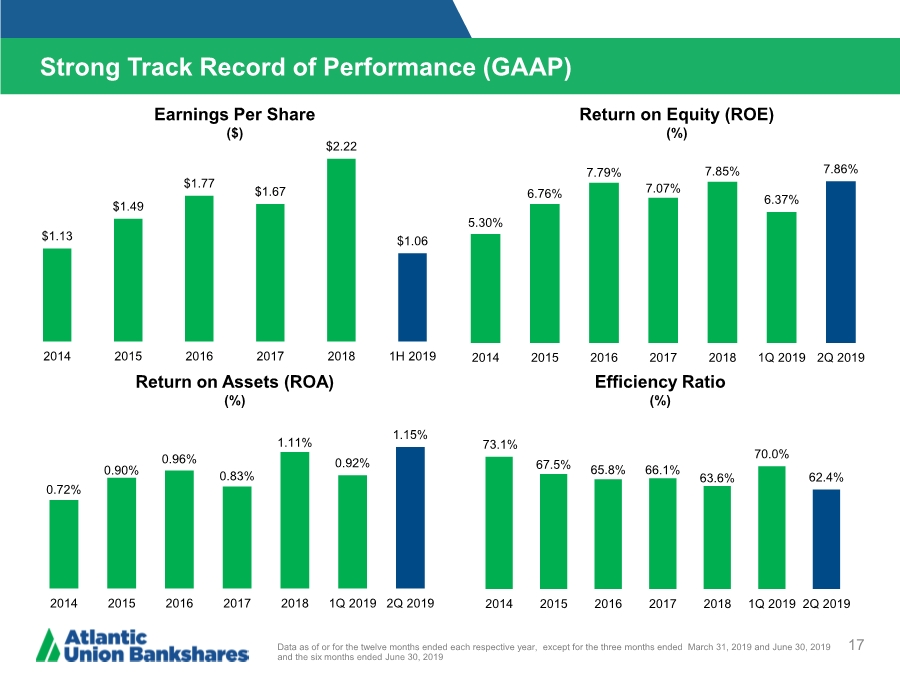
| Strong Track Record of Performance (GAAP) 17 Data as of or for the twelve months ended each respective year, except for the three months ended March 31, 2019 and June 30, 2019 and the six months ended June 30, 2019 Return on Assets (ROA) (%) Return on Equity (ROE) (%) Efficiency Ratio (%) Earnings Per Share ($) $1.13 $1.49 $1.77 $1.67 $2.22 $1.06 2014 2015 2016 2017 2018 1H 2019 5.30% 6.76% 7.79% 7.07% 7.85% 6.37% 7.86% 2014 2015 2016 2017 2018 1Q 2019 2Q 2019 0.72% 0.90% 0.96% 0.83% 1.11% 0.92% 1.15% 2014 2015 2016 2017 2018 1Q 2019 2Q 2019 73.1% 67.5% 65.8% 66.1% 63.6% 70.0% 62.4% 2014 2015 2016 2017 2018 1Q 2019 2Q 2019 |
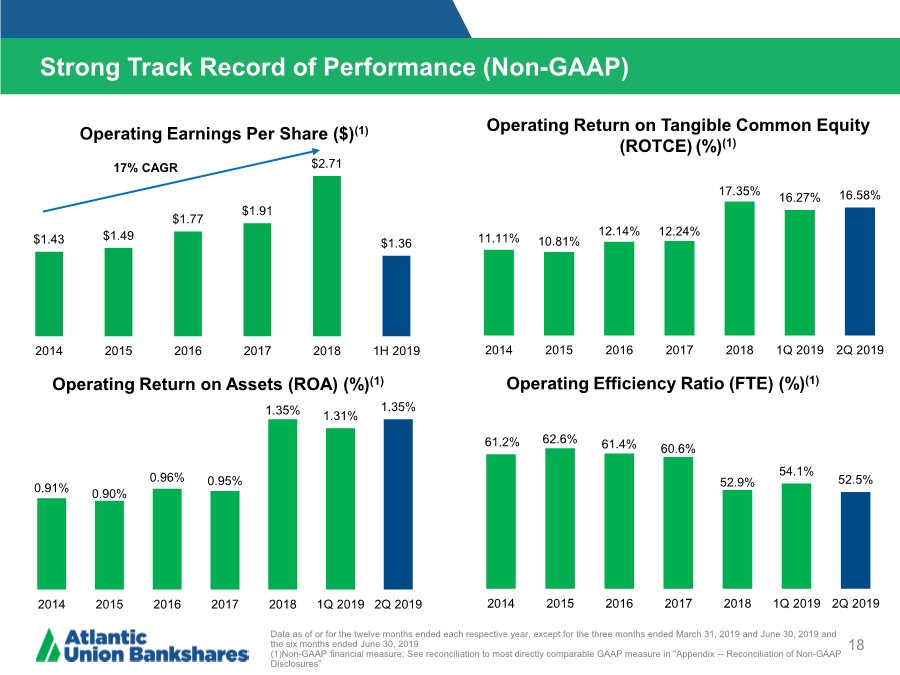
| Strong Track Record of Performance (Non-GAAP) 18 Data as of or for the twelve months ended each respective year, except for the three months ended March 31, 2019 and June 30, 2019 and the six months ended June 30, 2019 (1)Non-GAAP financial measure; See reconciliation to most directly comparable GAAP measure in "Appendix -- Reconciliation of Non-GAAP Disclosures” Operating Return on Assets (ROA) (%)(1) Operating Return on Tangible Common Equity (ROTCE)(%)(1) Operating Efficiency Ratio (FTE) (%)(1) Operating Earnings Per Share ($)(1) 17% CAGR $1.43 $1.49 $1.77 $1.91 $2.71 $1.36 2014 2015 2016 2017 2018 1H 2019 11.11% 10.81% 12.14% 12.24% 17.35% 16.27% 16.58% 2014 2015 2016 2017 2018 1Q 2019 2Q 2019 61.2% 62.6% 61.4% 60.6% 52.9% 54.1% 52.5% 2014 2015 2016 2017 2018 1Q 2019 2Q 2019 0.91% 0.90% 0.96% 0.95% 1.35% 1.31% 1.35% 2014 2015 2016 2017 2018 1Q 2019 2Q 2019 |
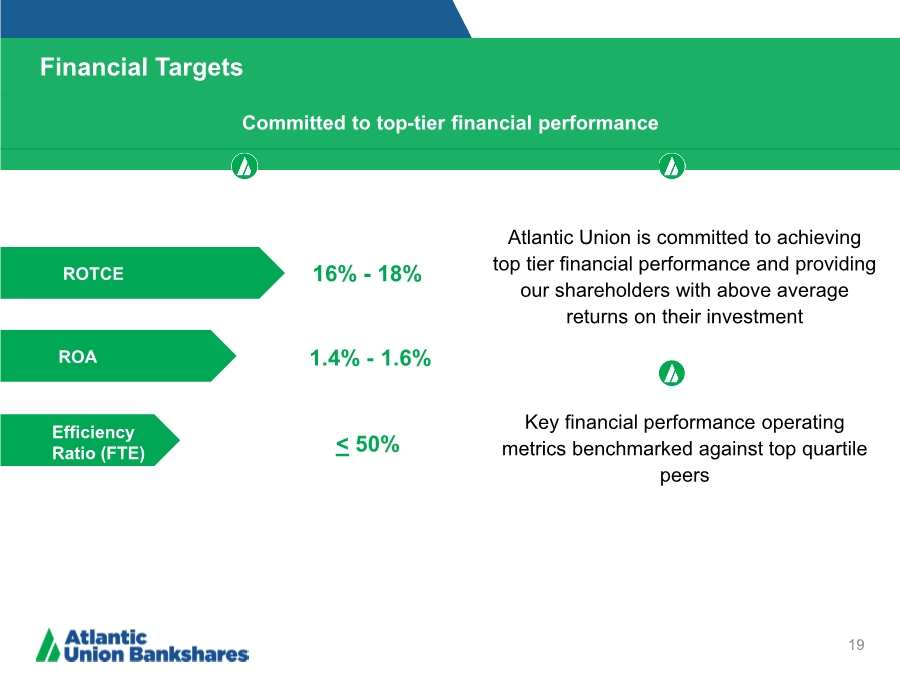
| Financial Targets 19 ROTCE ROA Efficiency Ratio (FTE) 1.4% - 1.6% 16% - 18% < 50% Atlantic Union is committed to achieving top tier financial performance and providing our shareholders with above average returns on their investment Key financial performance operating metrics benchmarked against top quartile peers Committed to top-tier financial performance |
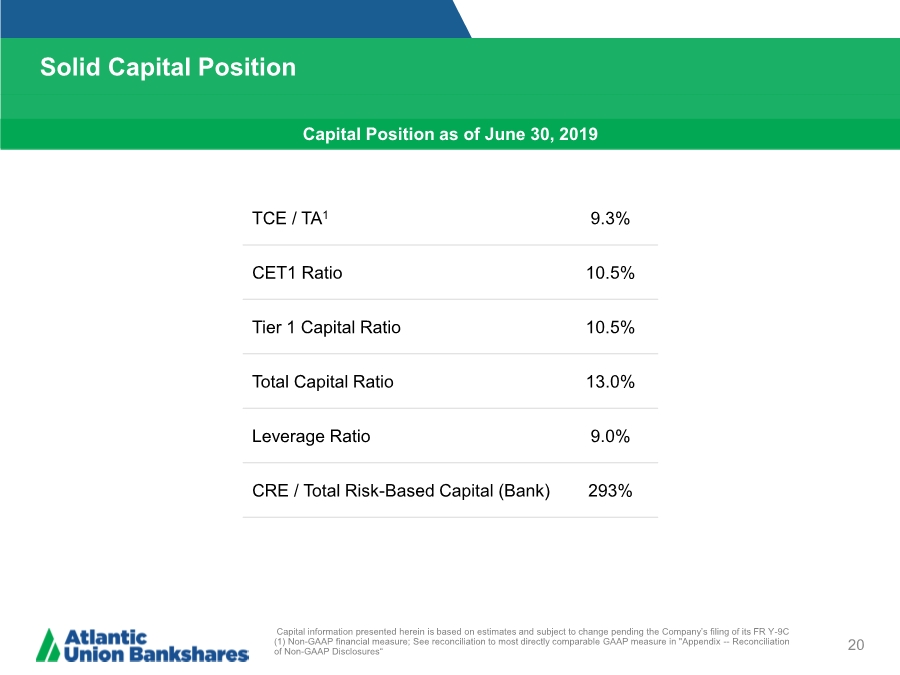
| Solid Capital Position 20 Capital information presented herein is based on estimates and subject to change pending the Company’s filing of its FR Y-9C (1) Non-GAAP financial measure; See reconciliation to most directly comparable GAAP measure in "Appendix -- Reconciliation of Non-GAAP Disclosures“ TCE / TA1 9.3% CET1 Ratio 10.5% Tier 1 Capital Ratio 10.5% Total Capital Ratio 13.0% Leverage Ratio 9.0% CRE / Total Risk-Based Capital (Bank) 293% Capital Position as of June 30, 2019 |
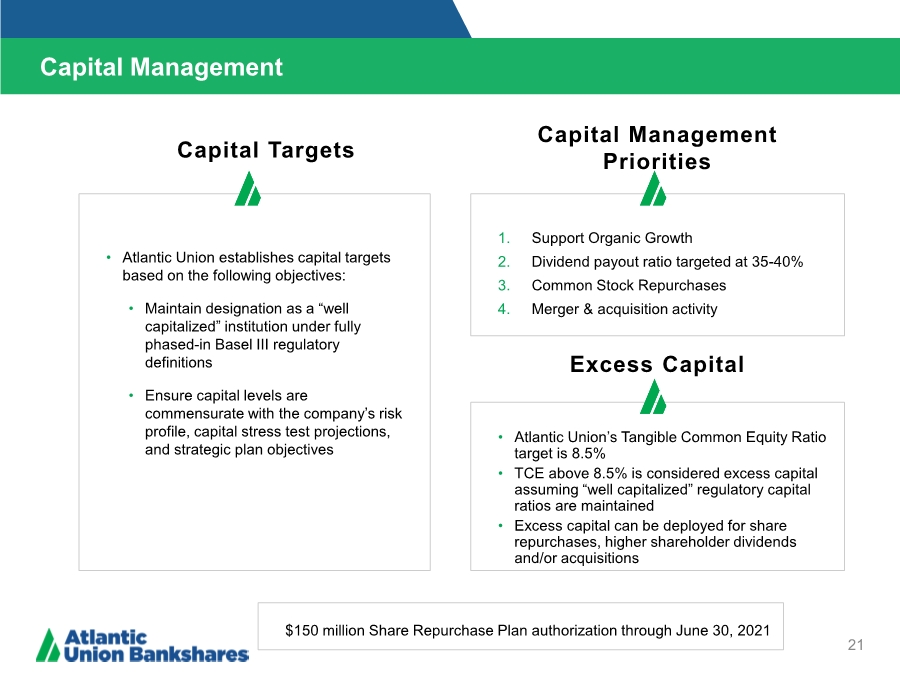
| Capital Management 21 Capital Management Priorities • Atlantic Union establishes capital targets based on the following objectives: • Maintain designation as a “well capitalized” institution under fully phased-in Basel III regulatory definitions • Ensure capital levels are commensurate with the company’s risk profile, capital stress test projections, and strategic plan objectives Capital Targets 1. Support Organic Growth 2. Dividend payout ratio targeted at 35-40% 3. Common Stock Repurchases 4. Merger & acquisition activity Excess Capital • Atlantic Union’s Tangible Common Equity Ratio target is 8.5% • TCE above 8.5% is considered excess capital assuming “well capitalized” regulatory capital ratios are maintained • Excess capital can be deployed for share repurchases, higher shareholder dividends and/or acquisitions $150 million Share Repurchase Plan authorization through June 30, 2021 |
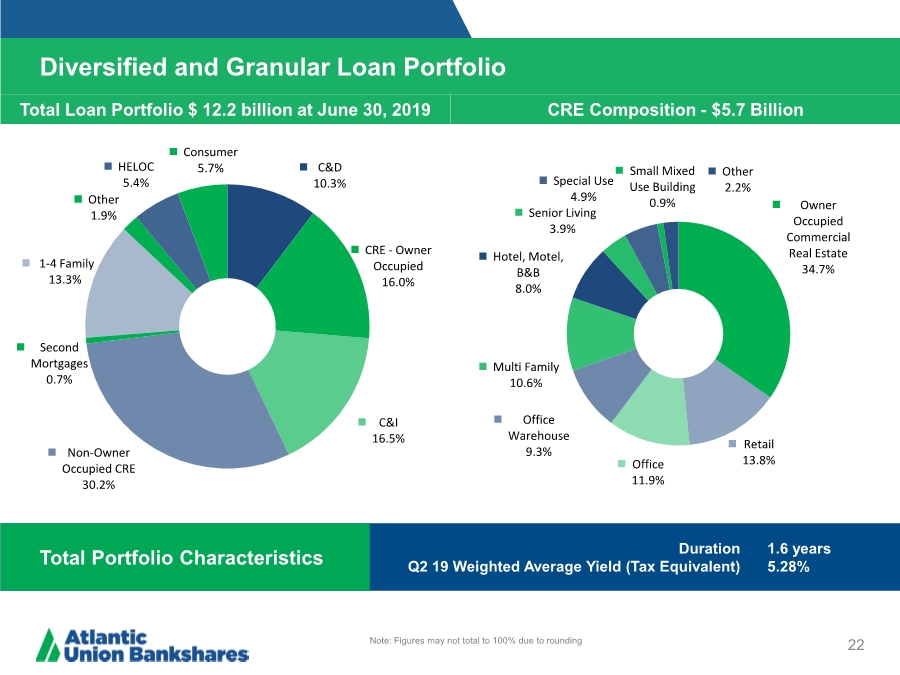
| Diversified and Granular Loan Portfolio 22 Note: Figures may not total to 100% due to rounding Total Loan Portfolio $ 12.2 billion at June 30, 2019 CRE Composition - $5.7 Billion Total Portfolio Characteristics Duration Q2 19 Weighted Average Yield (Tax Equivalent) 1.6 years 5.28% C&D 10.3% CRE - Owner Occupied 16.0% C&I 16.5% Non-Owner Occupied CRE 30.2% Second Mortgages 0.7% 1-4 Family 13.3% Other 1.9% HELOC 5.4% Consumer 5.7% Owner Occupied Commercial Real Estate 34.7% Retail 13.8% Office 11.9% Office Warehouse 9.3% Multi Family 10.6% Hotel, Motel, B&B 8.0% Senior Living 3.9% Special Use 4.9% Small Mixed Use Building 0.9% Other 2.2% |
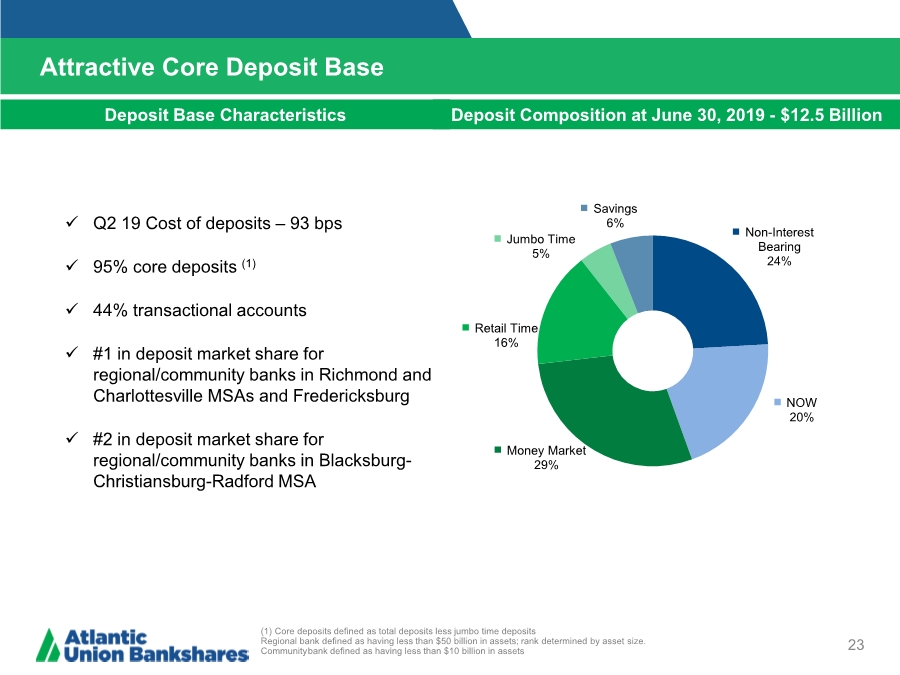
| Attractive Core Deposit Base 23 (1) Core deposits defined as total deposits less jumbo time deposits Regional bank defined as having less than $50 billion in assets; rank determined by asset size. Communitybank defined as having less than $10 billion in assets Deposit Base Characteristics Deposit Composition at June 30, 2019 - $12.5 Billion Q2 19 Cost of deposits – 93 bps 95% core deposits (1) 44% transactional accounts #1 in deposit market share for regional/community banks in Richmond and Charlottesville MSAs and Fredericksburg #2 in deposit market share for regional/community banks in Blacksburg- Christiansburg-Radford MSA Non-Interest Bearing 24% NOW 20% Money Market 29% Retail Time 16% Jumbo Time 5% Savings 6% |
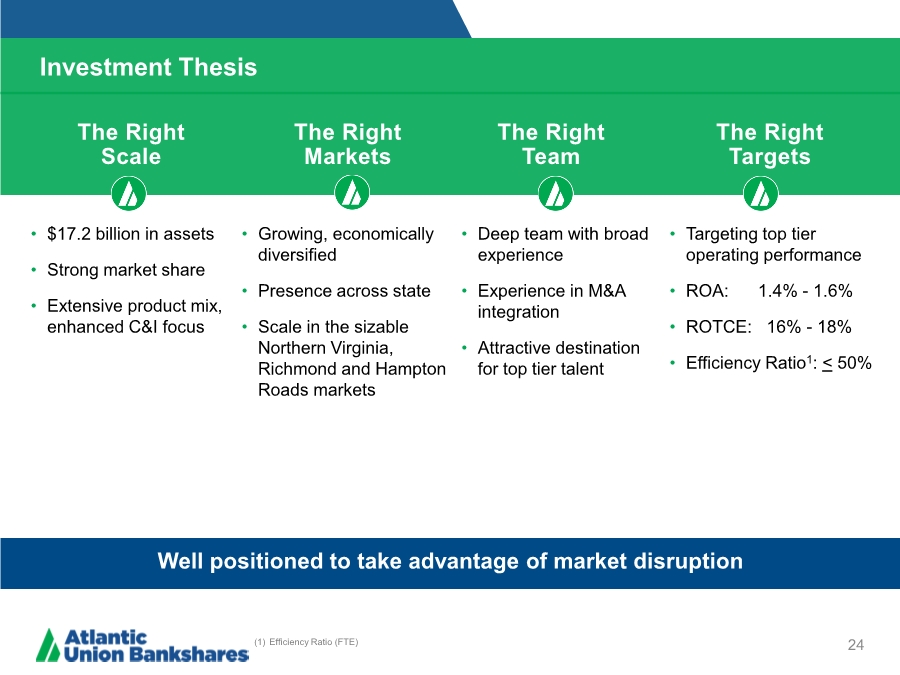
| Investment Thesis 24 The Right Scale The Right Markets The Right Team The Right Targets • $17.2 billion in assets • Strong market share • Extensive product mix, enhanced C&I focus • Growing, economically diversified • Presence across state • Scale in the sizable Northern Virginia, Richmond and Hampton Roads markets • Deep team with broad experience • Experience in M&A integration • Attractive destination for top tier talent • Targeting top tier operating performance • ROA: 1.4% - 1.6% • ROTCE: 16% - 18% • Efficiency Ratio1: < 50% (1) Efficiency Ratio (FTE) Well positioned to take advantage of market disruption |
| Appendix |
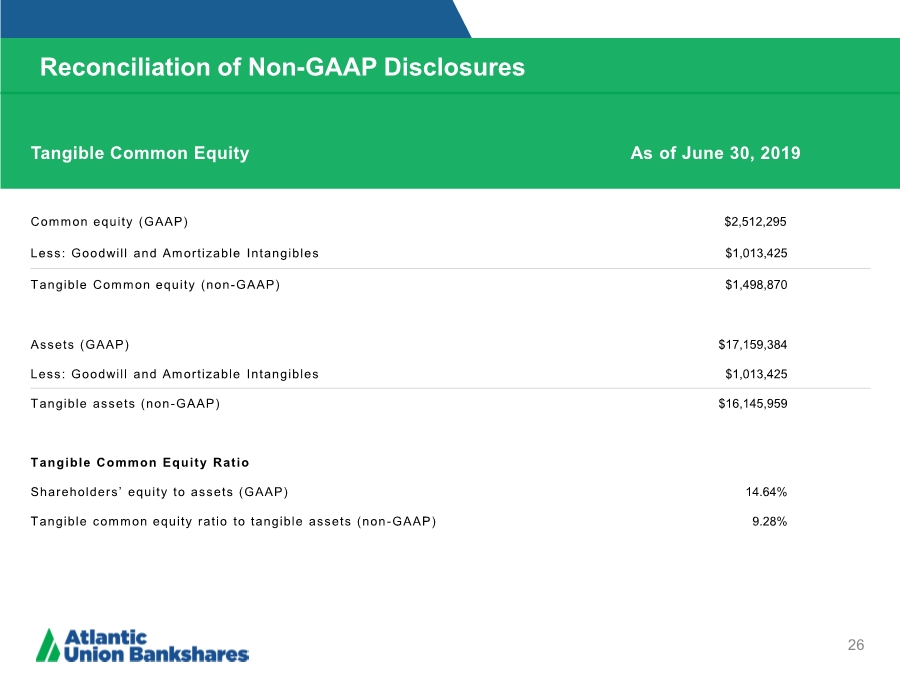
| Reconciliation of Non-GAAP Disclosures 26 Tangible Common Equity As of June 30, 2019 Common equity (GAAP) $2,512,295 Less: Goodwill and Amortizable Intangibles $1,013,425 Tangible Common equity (non-GAAP) $1,498,870 Assets (GAAP) $17,159,384 Less: Goodwill and Amortizable Intangibles $1,013,425 Tangible assets (non-GAAP) $16,145,959 Tangible Common Equity Ratio Shareholders’ equity to assets (GAAP) 14.64% Tangible common equity ratio to tangible assets (non-GAAP) 9.28% |
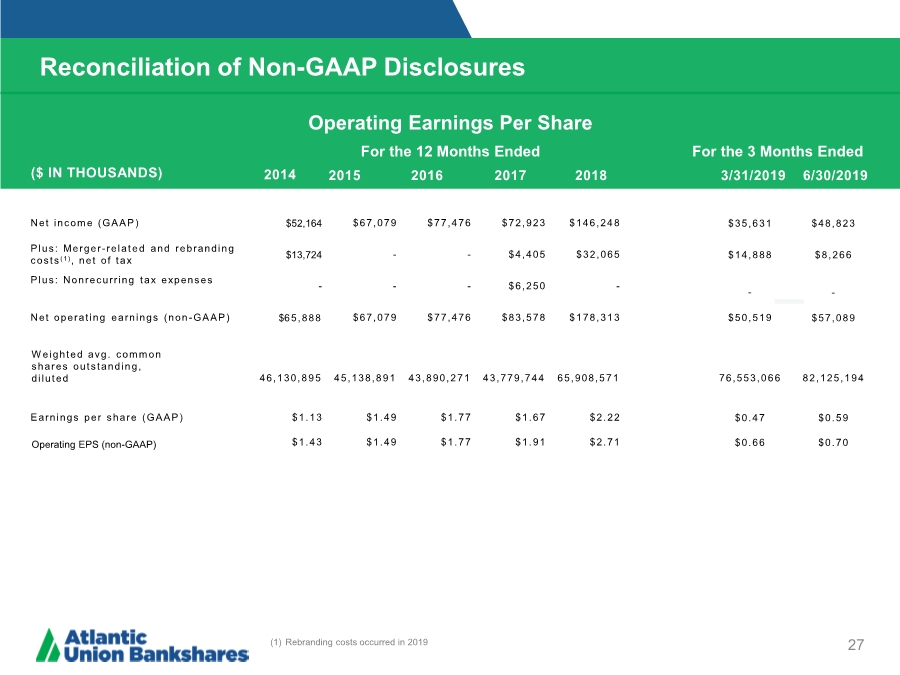
| Reconciliation of Non-GAAP Disclosures 27 ($ IN THOUSANDS) Operating Earnings Per Share For the 12 Months Ended For the 3 Months Ended 3/31/2019 2016 2017 2018 Net income (GAAP) $52,164 $67,079 $77,476 $72,923 $146,24 8 $35,631 $48,823 Plus: Merger-relat e d and rebranding costs ( 1), net of tax $13,724 -- $4,405 $32,065 $14,888 $8,266 Plus: Nonrecurring tax expenses --- $6,250 --- Net operating earnings (non-GAAP) $65,888 $67,079 $77,476 $83,578 $178,31 3 $50,519 $57,089 Weighted avg. common shares outstanding, diluted 46,130,895 45,138,891 43,890,2 7 1 43,779,744 65,908,571 76,553,0 6 6 82,125,194 Earnings per share (GAAP) $1.13 $1.49 $1.77 $1.67 $2.22 $0.47 $0.59 Operating EPS (non-GAAP) $1.43 $1.49 $1.77 $1.91 $2.71 $0.66 $0.70 2015 2014 6/30/2019 (1) Rebranding costs occurred in 2019 |
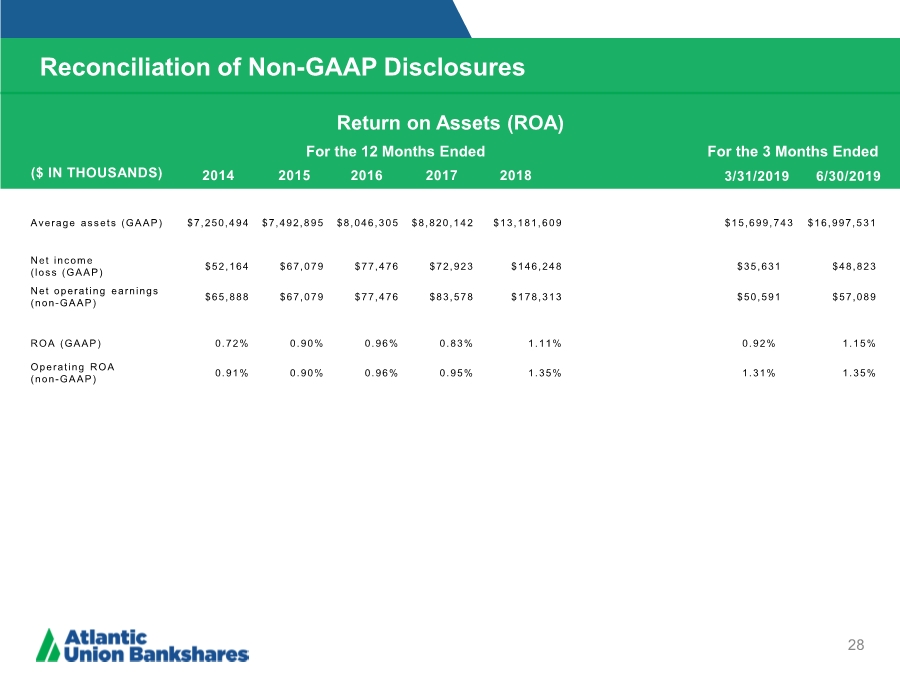
| Reconciliation of Non-GAAP Disclosures 28 ($ IN THOUSANDS) Average assets (GAAP) $7,250,4 9 4 $7,492,8 9 5 $8,046,3 0 5 $8,820,1 4 2 $13,181,609 $15,699,743 $16,997,531 Net incom e (loss (GAAP) $52,164 $67,079 $77,476 $72,923 $146,24 8 $35,631 $48,823 Net operating earnings (non-GAAP) $65,888 $67,079 $77,476 $83,578 $178,31 3 $50,591 $57,089 ROA (GAAP) 0.72% 0.90% 0.96% 0.83% 1.11% 0.92% 1.15% Operating ROA (non-GAAP) 0.91% 0.90% 0.96% 0.95% 1.35% 1.31% 1.35% 2015 For the 12 Months Ended For the 3 Months Ended 2014 3/31/2019 Return on Assets (ROA) 2016 2017 2018 6/30/2019 |
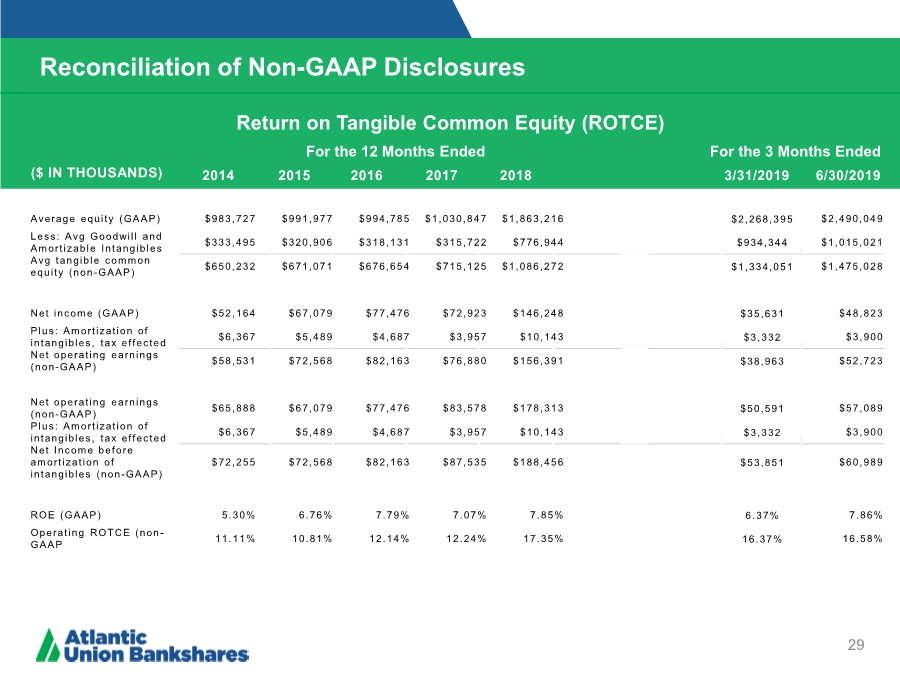
| Reconciliation of Non-GAAP Disclosures 29 ($ IN THOUSANDS) Average equity (GAAP) $983,72 7 $991,97 7 $994,78 5 $1,030,8 4 7 $1,863,2 1 6 $2,268,395 $2,490,049 Less: Avg Goodwill and Amortizable Intangibles $333,49 5 $320,90 6 $318,13 1 $315,72 2 $776,94 4 $934,34 4 $1,015,021 Avg tangible common equity (non-GAAP) $650,23 2 $671,07 1 $676,65 4 $715,12 5 $1,086,2 7 2 $1,334,051 $1,475,028 Net income (GAAP) $52,164 $67,079 $77,476 $72,923 $146,24 8 $35,631 $48,823 Plus: Amortization of intangibles, tax effected $6,367 $5,489 $4,687 $3,957 $10,143 $3,332 $3,900 Net operating earnings (non-GAAP) $58,531 $72,568 $82,163 $76,880 $156,39 1 $38,963 $52,723 Net operating earnings (non-GAAP) $65,888 $67,079 $77,476 $83,578 $178,31 3 $50,591 $57,089 Plus: Amortization of intangibles, tax effected $6,367 $5,489 $4,687 $3,957 $10,143 $3,332 $3,900 Net Income before amortization of intangibles (non-GAAP) $72,255 $72,568 $82,163 $87,535 $188,45 6 $53,851 $60,989 ROE (GAAP) 5.30% 6.76% 7.79% 7.07% 7.85% 6.37% 7.86% Operating ROTCE (non- GAAP 11.11% 10.81% 12.14% 12.24% 17.35% 16.37% 16.58% For the 12 Months Ended For the 3 Months Ended Return on Tangible Common Equity (ROTCE) 2015 2014 3/31/2019 2016 2017 2018 6/30/2019 |
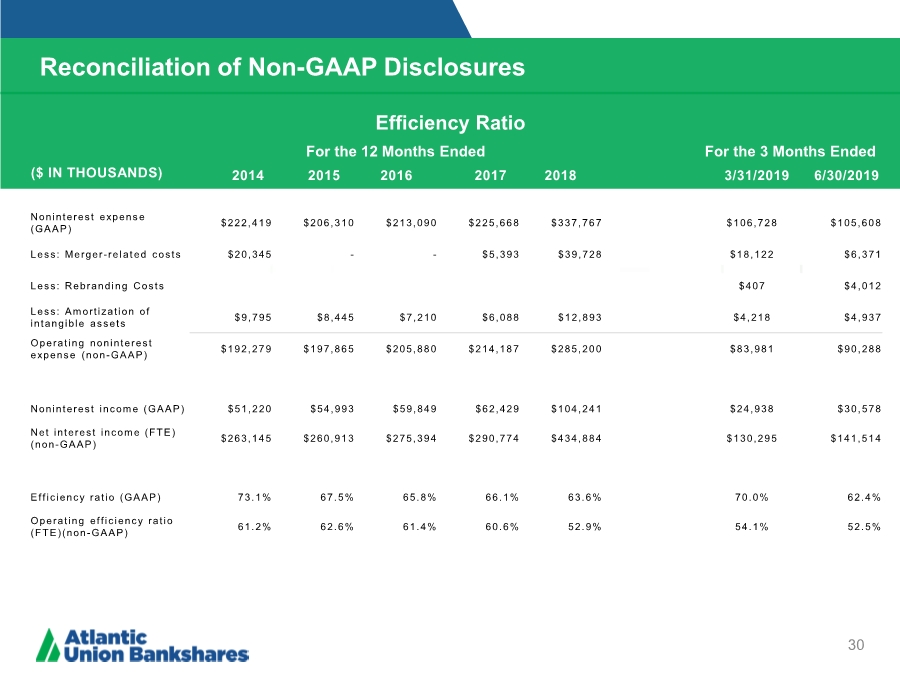
| Reconciliation of Non-GAAP Disclosures 30 ($ IN THOUSANDS) Noninterest expense (GAAP) $222,41 9 $206,31 0 $213,09 0 $225,66 8 $337,76 7 $106,72 8 $105,60 8 Less: Merger-related costs $20,345 -- $5,393 $39,728 $18,122 $6,371 Less: Rebranding Costs $407 $4,012 Less: Amortization of intangible assets $9,795 $8,445 $7,210 $6,088 $12,893 $4,218 $4,937 Operating noninterest expense (non-GAAP) $192,27 9 $197,86 5 $205,88 0 $214,18 7 $285,20 0 $83,981 $90,288 Noninterest income (GAAP) $51,220 $54,993 $59,849 $62,429 $104,241 $24,938 $30,578 Net interest income (FTE) (non-GAAP) $263,14 5 $260,91 3 $275,39 4 $290,77 4 $434,88 4 $130,29 5 $141,51 4 Efficiency ratio (GAAP) 73.1% 67.5% 65.8% 66.1% 63.6% 70.0% 62.4% Operating efficiency ratio (FTE)(non-GAAP) 61.2% 62.6% 61.4% 60.6% 52.9% 54.1% 52.5% For the 12 Months Ended For the 3 Months Ended Efficiency Ratio 2015 2014 3/31/2019 2016 2017 2018 6/30/2019 |
| Reconciliation of Non-GAAP Disclosures 31 ($ IN THOUSANDS) Net interest income (GAAP) $253,21 3 $250,45 0 $263,96 6 $279,00 7 $426,69 1 $127,54 7 $138,59 4 FTE adjustment $9,932 $10,463 $11,428 $11,767 $8,193 $2,748 $2,920 Net interest income (FTE) (non-GAAP) $263,14 5 $260,91 3 $275,39 4 $290,77 4 $434,88 4 $130,29 5 $141,51 4 Average earning assets $6,437,681 $6,713,239 $7,249,090 $8,016,311 $11,620,893 $13,891,248 $15,002,726 Net interest margin (GAAP) 3.93% 3.73% 3.64% 3.48% 3.67% 3.72% 3.71% Net interest margin (FTE) (non-GAAP) 4.09% 3.89% 3.80% 3.63% 3.74% 3.80% 3.78% For the 12 Months Ended Net Interest Margin 2015 3/31/2019 2016 2017 2018 For the 3 Months Ended 2014 6/30/2019 |
