
Exhibit 99.1
UNION Union First Market Bankshares Investor Presentation May/June 2013

UNION Union First Market Bankshares [Graphic Appears Here] Overview Financial Performance Near-Term Outlook 2
F UNION Union First Market Bankshares orward-Looking Statement Certain statements in this report may constitute _forward-looking statements_ within the meaning of the Private Securities Litigation Reform Act of 1995. Forward-looking statements are statements that include projections, predictions, expectations or beliefs about future events or results or otherwise and are not statements of historical fact. Such statements are often characterized by the use of qualified words (and their derivatives) such as _expect,believe,estimate,plan,project,anticipate_ or other statements concerning opinions or judgment of the Company and its management about future events. Although the Company believes that its expectations with respect to forward-looking statements are based upon reasonable assumptions within the bounds of its existing knowledge of its business and operations, there can be no assurance that actual results, performance or achievements of the Company will not differ materially from any future results, performance or achievements expressed or implied by such forward-looking statements. Actual future results and trends may differ materially from historical results or those anticipated depending on a variety of factors, including, but not limited to, the effects of and changes in: general economic and bank industry conditions, the interest rate environment, legislative and regulatory requirements, competitive pressures, new products and delivery systems, inflation, changes in the stock and bond markets, accounting standards or interpretations of existing standards, mergers and acquisitions, technology, and consumer spending and savings habits. The Company does not update any forward-looking statements that may be made from time to time by or on behalf of the Company. 3
UNION Union First Market Bankshares One of the largest financial services organizations headquartered in Virginia Holding company formed in 1993 _ Banking history in our communities goes back more than 100 years Assets of $4.1 Billion Comprehensive financial services provider offering commercial and retail banking, mortgage, investment, trust and insurance products and services 4
U UNION Union First Market Bankshares nion First Market_s Strengths Excellent branch network, competitive banking products and services and a loyal client base Well positioned for organic growth given commercial activity, household income levels and population growth in its footprint Strong balance sheet and solid capital base Conservative lender with improving asset quality metrics Experienced management team, building depth Successful acquirer and integrator Proven financial performance in both good and bad economic climates 5
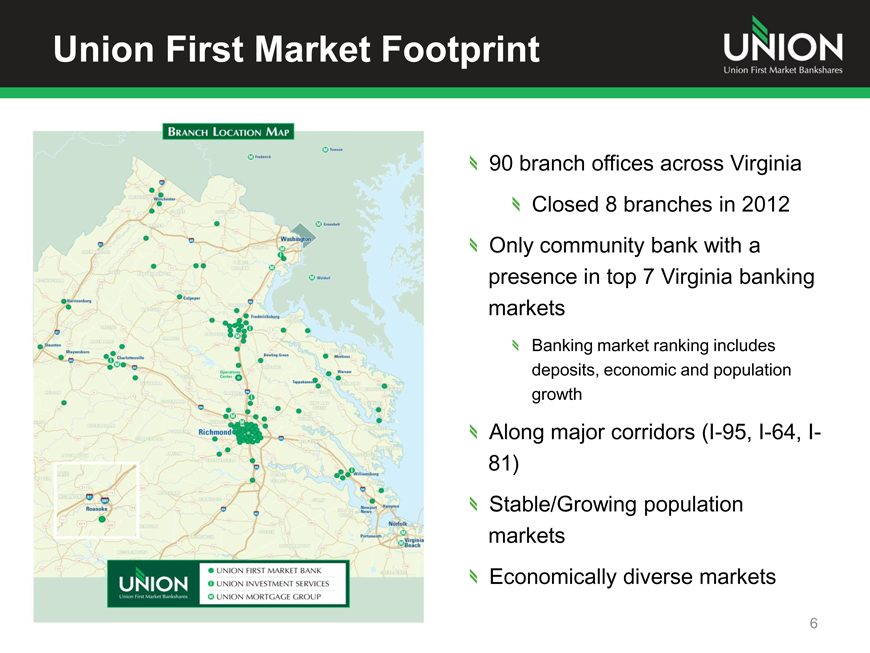
UNION Union First Market Bankshares Union First Marketootprint 90 branch offices across Virginia Closed 8 branches in 2012 UNION FIRST MARKET BANK UNION INVESTMENT SERVICES UNION MORTGAGE GROUP Only community bank with a presence in top 7 Virginia banking markets Banking market ranking includes deposits, economic and population growth Along major corridors (I-95, I-64, I- 81) Stable/Growing population markets Economically diverse markets 6
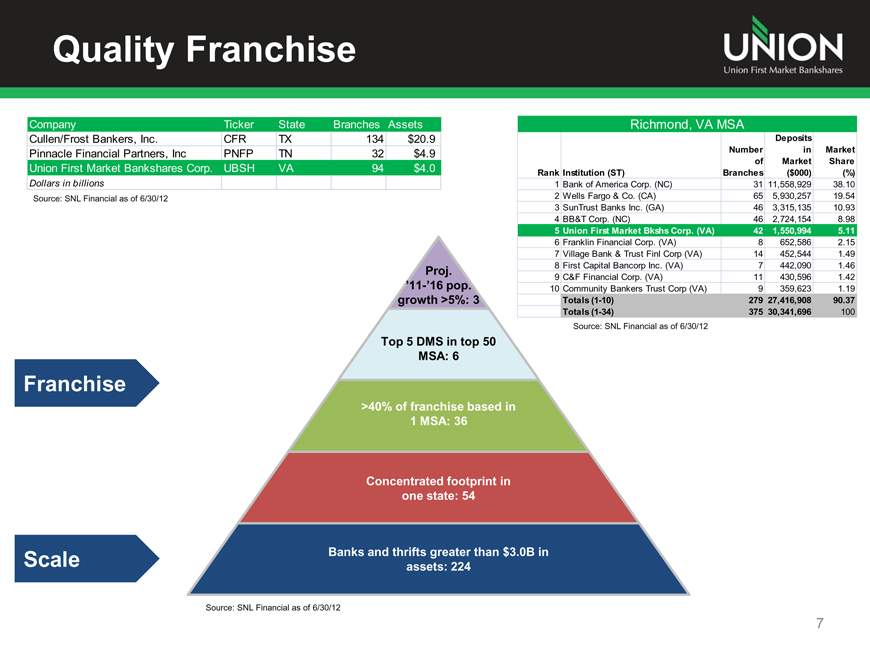
UNION Union First Market Bankshares [Graphic Appears Here] Company Ticker State Branches Assets Richmond, VA MSA Cullen/Frost Bankers, Inc. CFR TX 134 $20.9 Deposits Pinnacle Financial Partners, Inc PNFP TN 32 $4.9 Number in Market of Market Share Union First Market Bankshares Corp. UBSH VA 94 $4.0 Rank Institution (ST) Branches($000)(%) Dollars in billions 1 Bank of America Corp. (NC) 31 11,558,929 38.10 Source: SNL Financial as of 6/30/12 2 Wells Fargo & Co. (CA) 65 5,930,257 19.54 3 SunTrust Banks Inc. (GA) 46 3,315,135 10.93 4 BB&T Corp. (NC) 46 2,724,154 8.98 5 Union First Market Bkshs Corp. (VA) 42 1,550,994 5.11 6 Franklin Financial Corp. (VA) 8 652,586 2.15 7 Village Bank & Trust Finl Corp (VA) 14 452,544 1.49 Proj. 8 First Capital Bancorp Inc. (VA) 7 442,090 1.46 9 C&F Financial Corp. (VA) 11 430,596 1.42 _11-_16 pop. 10 Community Bankers Trust Corp (VA) 9 359,623 1.19 growth >5%: 3 Totals (1-10) 279 27,416,908 90.37 Totals (1-34) 375 30,341,696 100 Source: SNL Financial as of 6/30/12 Top 5 DMS in top 50 MSA: 6 Franchise >40% of franchise >40% based of franchise in based in 1 MSA: 35 1 MSA: 36 Concentrated fo Concentrated tprint in footprint in one state: 47 one state: 54 Scale Banks and thrift Banks greaterand than thrifts $3.0B greater in than $3.0B in assets: 220 assets: 224 Source: SNL Financial as of 6/30/12 7
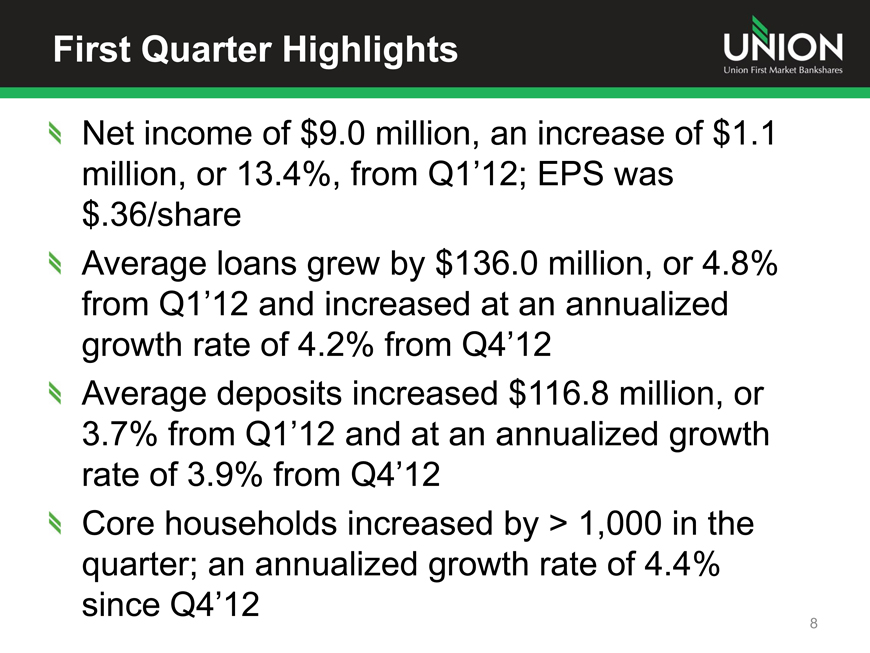
UNION Union First Market Bankshares First Quarter Highlights Net income of $9.0 million, an increase of $1.1 million, or 13.4%, from Q1_12; EPS was $.36/share Average loans grew by $136.0 million, or 4.8% from Q1_12 and increased at an annualized growth rate of 4.2% from Q4_12 Average deposits increased $116.8 million, or 3.7% from Q1_12 and at an annualized growth rate of 3.9% from Q4_12 Core households increased by > 1,000 in the quarter; an annualized growth rate of 4.4% since Q4_12 8
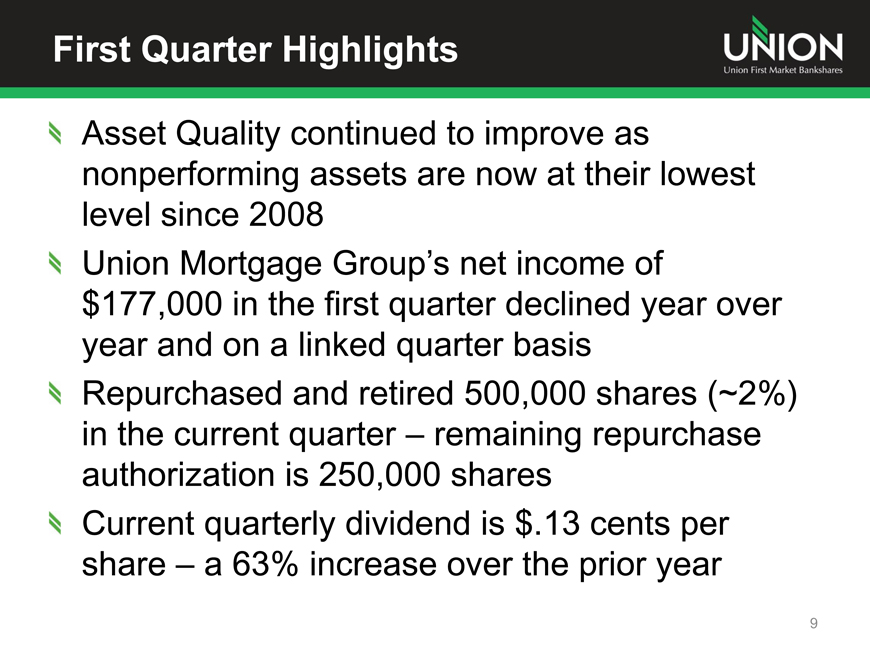
Fi UNION Union First Market Bankshares rst Quarter Highlights Asset Quality continued to improve as nonperforming assets are now at their lowest level since 2008 Union Mortgage Group_s net income of $177,000 in the first quarter declined year over year and on a linked quarter basis Repurchased and retired 500,000 shares (~2%) in the current quarter _ remaining repurchase authorization is 250,000 shares Current quarterly dividend is $.13 cents per share _ a 63% increase over the prior year 9
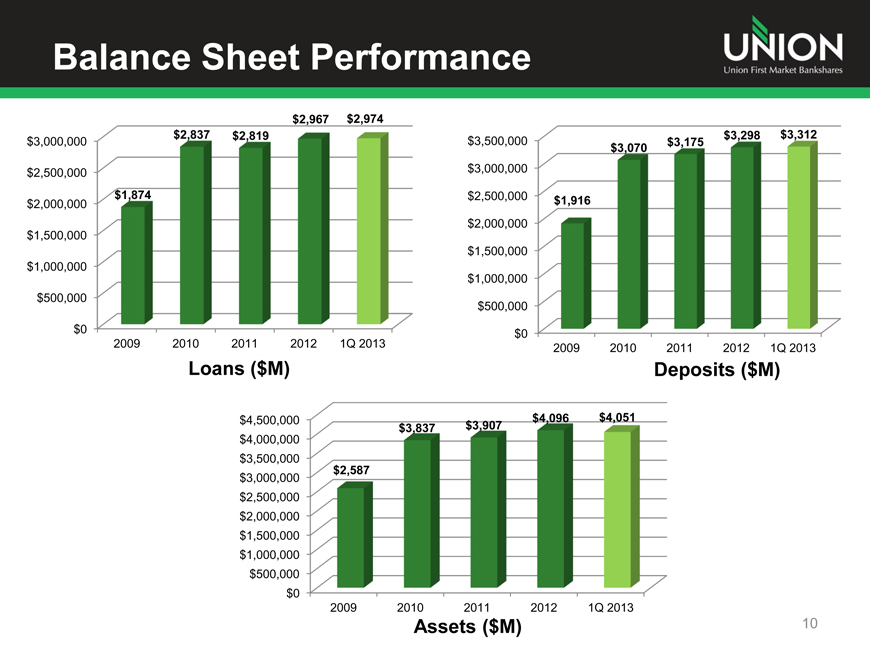
UNION Union First Market Bankshares Balance Sheet Performance $2,967 $2,974 $2,837 $2,819 $3,298 $3,312 $3,000,000 $3,500,000 $3,175 $3,070 $2,500,000 $3,000,000 $2,000,000 $1,874 $2,500,000 $1,916 $2,000,000 $1,500,000 $1,500,000 $1,000,000 $1,000,000 $500,000 $500,000 $0 $0 2009 2010 2011 2012 1Q 2013 2009 2010 2011 2012 1Q 2013 Loans ($M) Deposits ($M) $4,500,000 $4,096 $4,051 $3,837 $3,907 $4,000,000 $3,500,000 $3,000,000 $2,587 $2,500,000 $2,000,000 $1,500,000 $1,000,000 $500,000 $0 2009 2010 2011 2012 1Q 2013 Assets ($M) 10
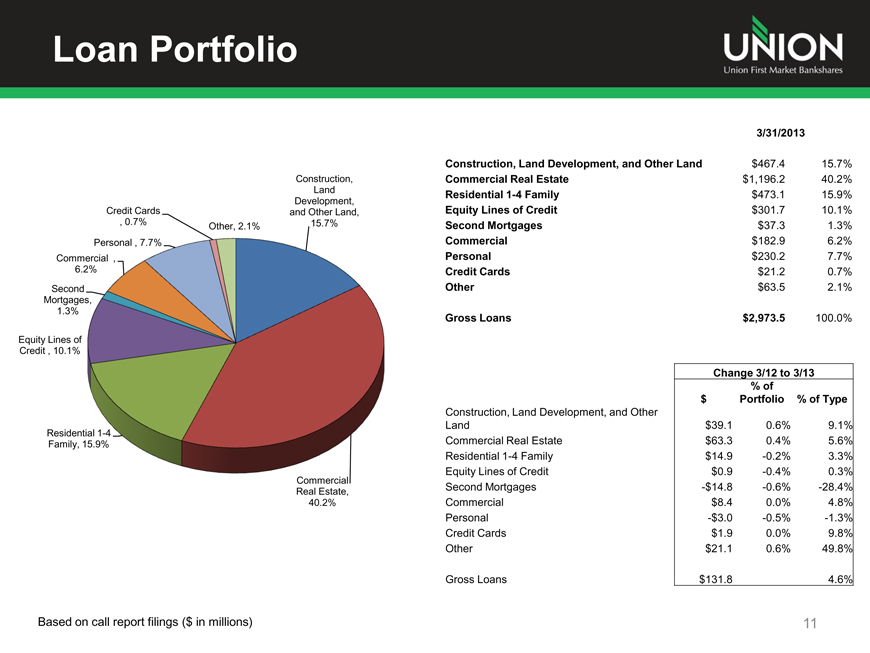
UNION Union First Market Bankshares Loan Portfolio 3/31/2013 Construction, Land Development, and Other Land $467.4 15.7% Construction, Commercial Real Estate $1,196.2 40.2% Land Residential 1-4 Family $473.1 15.9% Development, Equity Lines of Credit $301.7 10.1% Credit Cards and Other Land, , 0.7% 15.7% Second Mortgages $37.3 1.3% Other, 2.1% Personal , 7.7% Commercial $182.9 6.2% Commercial , Personal $230.2 7.7% 6.2% Credit Cards $21.2 0.7% Second Other $63.5 2.1% Mortgages, 1.3% Gross Loans $2,973.5 100.0% Equity Lines of Credit , 10.1% Change 3/12 to 3/13 % of $ Portfolio % of Type Construction, Land Development, and Other Land $39.1 0.6% 9.1% Residential 1-4 Family, 15.9% Commercial Real Estate $63.3 0.4% 5.6% Residential 1-4 Family $14.9 -0.2% 3.3% Commercial Equity Lines of Credit $0.9 -0.4% 0.3% Real Estate, Second Mortgages -$14.8 -0.6% -28.4% 40.2% Commercial $8.4 0.0% 4.8% Personal -$3.0 -0.5% -1.3% Credit Cards $1.9 0.0% 9.8% Other $21.1 0.6% 49.8% Gross Loans $131.8 4.6% Based on call report filings ($ in millions) 11
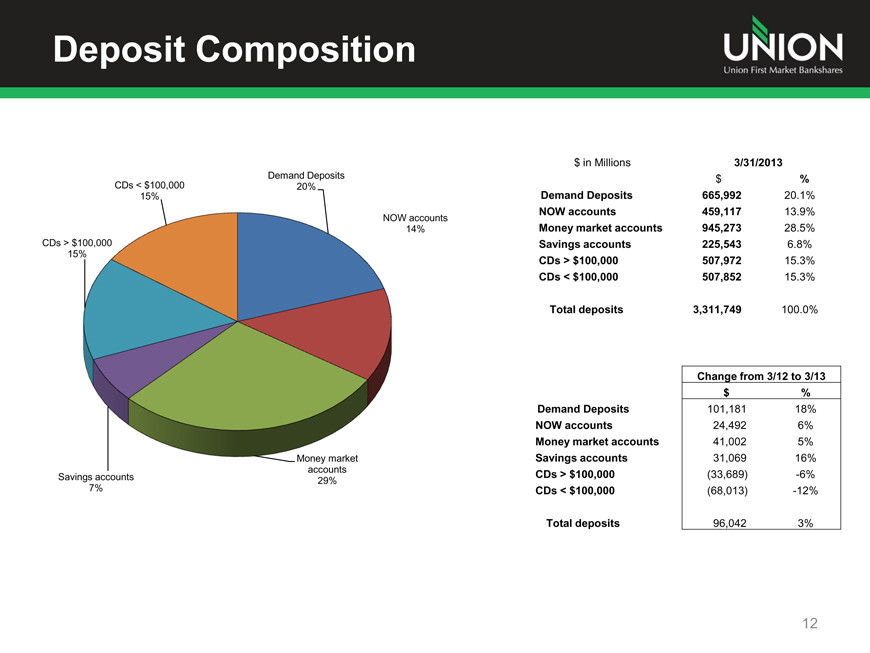
UNION Union First Market Bankshares Deposit Composition $ in Millions 3/31/2013 Demand Deposits $ % CDs < $100,000 20% 15% Demand Deposits 665,992 20.1% NOW accounts 459,117 13.9% NOW accounts 14% Money market accounts 945,273 28.5% CDs > $100,000 Savings accounts 225,543 6.8% 15% CDs > $100,000 507,972 15.3% CDs < $100,000 507,852 15.3% Total deposits 3,311,749 100.0% Change from 3/12 to 3/13 $ % Demand Deposits 101,181 18% NOW accounts 24,492 6% Money market accounts 41,002 5% Money market Savings accounts 31,069 16% accounts CDs > $100,000 (33,689) -6% Savings accounts 29% 7% CDs < $100,000 (68,013) -12% Total deposits 96,042 3% 12
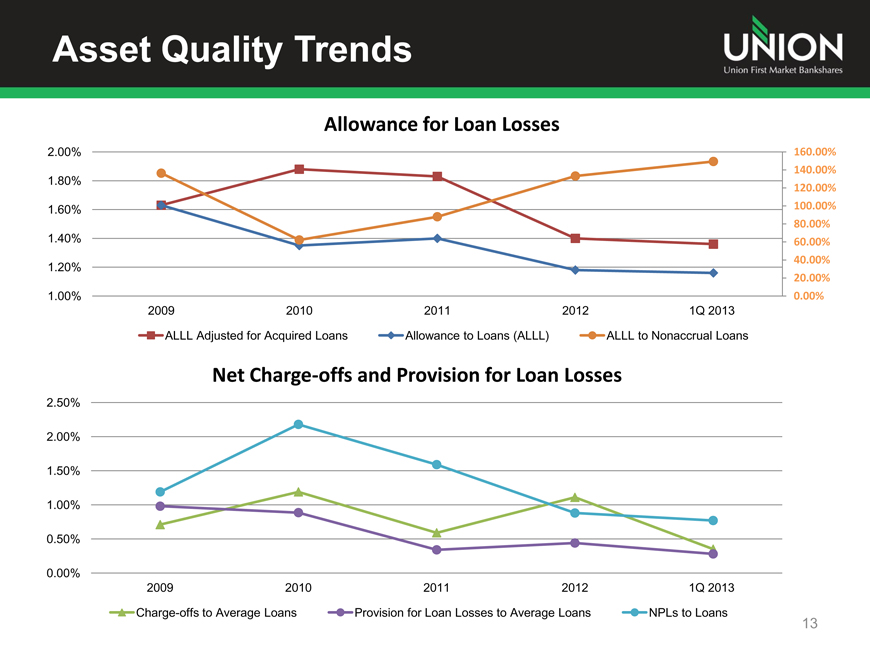
UNION Union First Market Bankshares Asset Quality Trends Allowance for Loan Losses 2.00% 160.00% 140.00% 1.80% 120.00% 1.60% 100.00% 80.00% 1.40% 60.00% 40.00% 1.20% 20.00% 1.00% 0.00% 2009 2010 2011 2012 1Q 2013 ALLL Adjusted for Acquired Loans Allowance to Loans (ALLL) ALLL to Nonaccrual Loans Net Charge-offs and Provision for Loan Losses 2.50% 2.00% 1.50% 1.00% 0.50% 0.00% 2009 2010 2011 2012 1Q 2013 Charge-offs to Average Loans Provision for Loan Losses to Average Loans NPLs to Loans 13
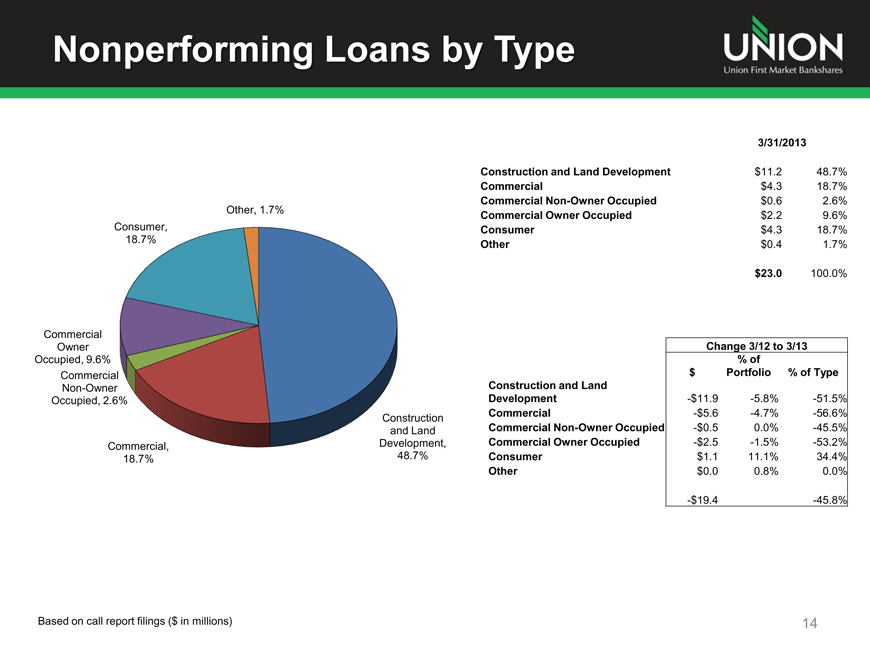
UNION Union First Market Bankshares Nonperforming Loans by Type Other, 1.7% Consumer, 18.7% Commercial Owner Occupied, 9.6% Commercial Non-Owner Occupied, 2.6% Commercial, 18.7% 3/31/2013 Construction and Land Development $11.2 48.7% Commercial $4.3 18.7% Commercial Non-Owner Occupied $0.6 2.6% Commercial Owner Occupied $2.2 9.6% Consumer $4.3 18.7% Other $0.4 1.7% $23.0 100.0% Change 3/12 to 3/13 % of $ Portfolio % of Type Construction and Land Development -$11.9 -5.8% -51.5% Commercial -$5.6 -4.7% -56.6% Construction Commercial Non-Owner Occupied -$0.5 0.0% -45.5% and Land Development, Commercial Owner Occupied -$2.5 -1.5% -53.2% 48.7% Consumer $1.1 11.1% 34.4% Other $0.0 0.8% 0.0% -$19.4 -45.8% Based on call report filings ($ in millions) 14
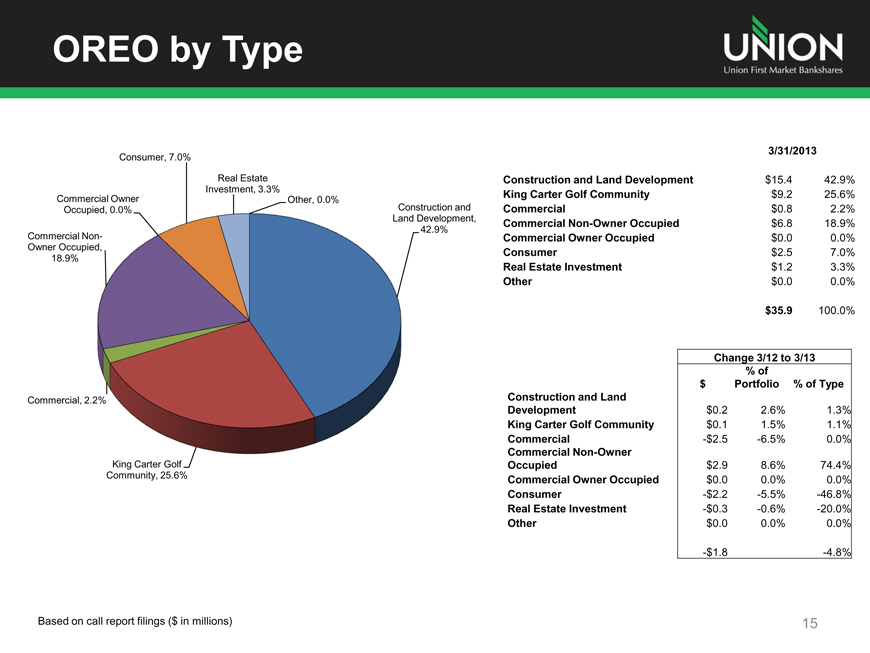
UNION Union First Market Bankshares [Graphic Appears Here] 3/31/2013 Consumer, 7.0% Real Estate Construction and Land Development $15.4 42.9% Investment, 3.3% Commercial Owner King Carter Golf Community $9.2 25.6% Other, 0.0% Occupied, 0.0% Construction and Commercial $0.8 2.2% Land Development, Commercial Non-Owner Occupied $6.8 18.9% 42.9% Commercial Non- Commercial Owner Occupied $0.0 0.0% Owner Occupied, Consumer $2.5 7.0% 18.9% Real Estate Investment $1.2 3.3% Other $0.0 0.0% $35.9 100.0% Change 3/12 to 3/13 % of $ Portfolio % of Type Commercial, 2.2% Construction and Land Development $0.2 2.6% 1.3% King Carter Golf Community $0.1 1.5% 1.1% Commercial -$2.5 -6.5% 0.0% Commercial Non-Owner King Carter Golf Occupied $2.9 8.6% 74.4% Community, 25.6% Commercial Owner Occupied $0.0 0.0% 0.0% Consumer -$2.2 -5.5% -46.8% Real Estate Investment -$0.3 -0.6% -20.0% Other $0.0 0.0% 0.0% -$1.8 -4.8% Based on call report filings ($ in millions) 15
p
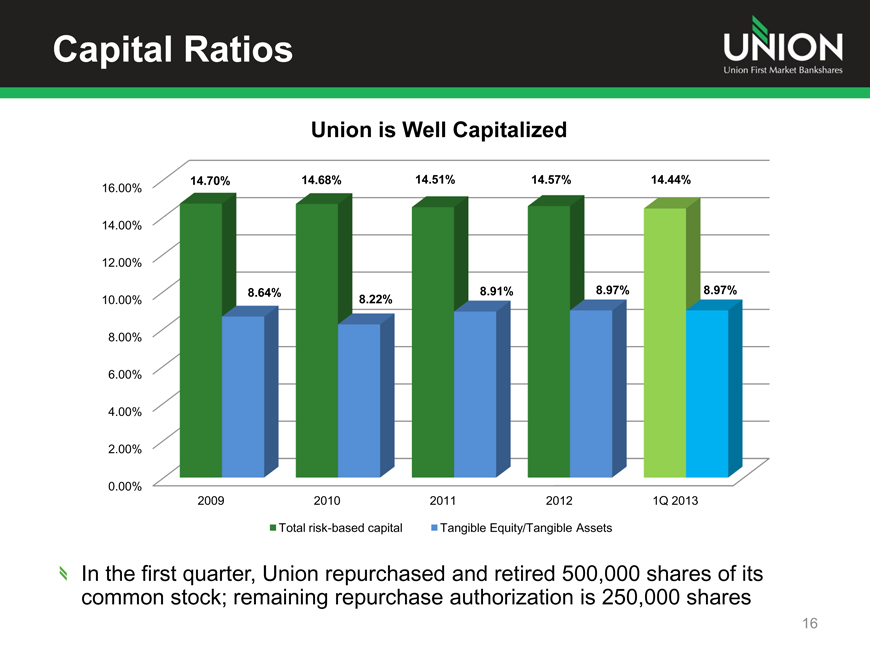
UNION Union First Market Bankshares Capital Ratios Union is Well Capitalized 14.70% 14.68% 14.51% 14.57% 14.44% 16.00% 14.00% 12.00% 8.64% 8.91% 8.97% 8.97% 10.00% 8.22% 8.00% 6.00% 4.00% 2.00% 0.00% 2009 2010 2011 2012 1Q 2013 Total risk-based capital Tangible Equity/Tangible Assets In the first quarter, Union repurchased and retired 500,000 shares of its common stock; remaining repurchase authorization is 250,000 shares 16
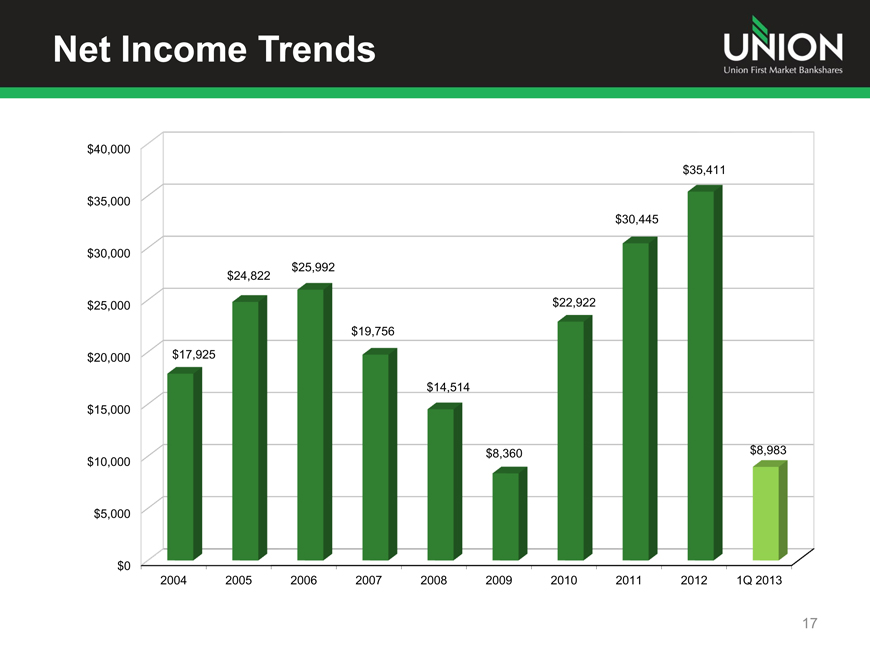
UNION Union First Market Bankshares [Graphic Appears Here] $40,000 $35,411 $35,000 $30,445 $30,000 $25,992 $24,822 $25,000 $22,922 $19,756 $20,000 $17,925 $14,514 $15,000 $8,360 $8,983 $10,000 $5,000 $0 2004 2005 2006 2007 2008 2009 2010 2011 2012 1Q 2013 17
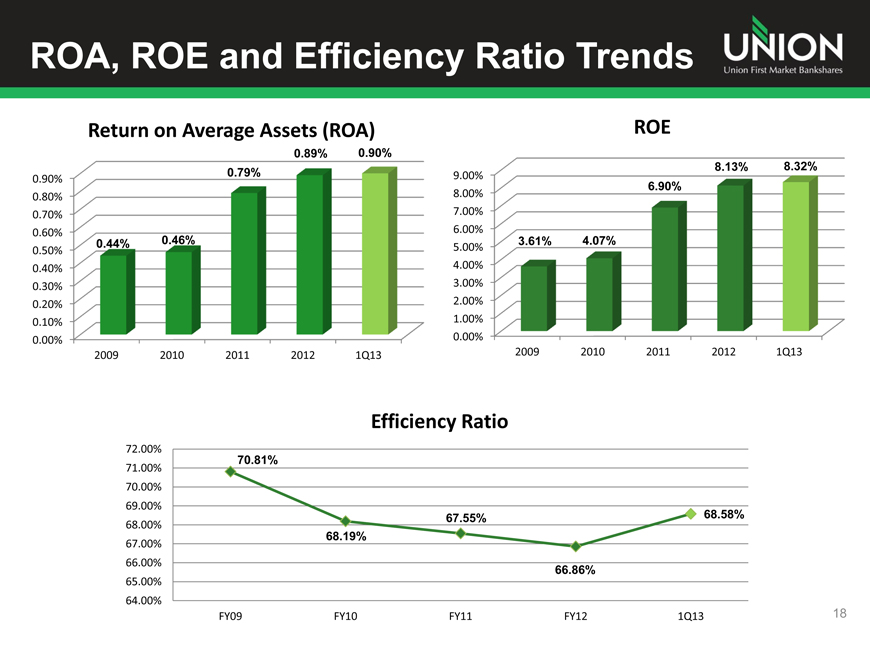
UNION Union First Market Bankshares ROA, ROE and Efficiency Ratio Trends Return on Average Assets (ROA) ROE 0.89% 0.90% 8.13% 8.32% 0.79% 9.00% 0.90% 6.90% 0.80% 8.00% 0.70% 7.00% 0.60% 6.00% 0.44% 0.46% 3.61% 4.07% 0.50% 5.00% 0.40% 4.00% 0.30% 3.00% 0.20% 2.00% 0.10% 1.00% 0.00% 0.00% 2009 2010 2011 2012 1Q13 2009 2010 2011 2012 1Q13 Efficiency Ratio 72.00% 70.81% 71.00% 70.00% 69.00% 67.55% 68.58% 68.00% 68.19% 67.00% 66.00% 66.86% 65.00% 64.00% FY09 FY10 FY11 FY12 1Q13 18
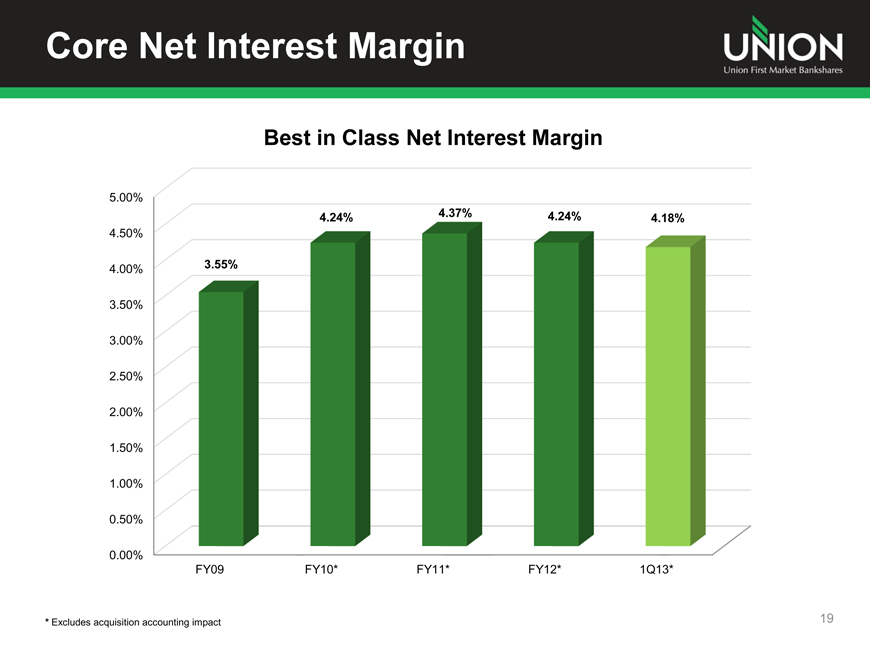
UNION Union First Market Bankshares Core Net Interest Margin Best in Class Net Interest Margin 5.00% 4.24% 4.37% 4.24% 4.18% 4.50% 4.00% 3.55% 3.50% 3.00% 2.50% 2.00% 1.50% 1.00% 0.50% 0.00% FY09 FY10* FY11* FY12* 1Q13* * Excludes acquisition accounting impact 19
UNION Union First Market Bankshares [Graphic Appears Here] Union Mortgage Group (UMG) generated net income of $177,000 in the first quarter - a decrease of $55,000 from Q1 2012 First quarter originations increased by $84 million, or ~45%, to $268 million from the prior year_s first quarter, but declined by 19% on a linked quarter basis New management team hired in late 2012 and Q1 2013 focused on improving mortgage profitability For example, UMG is implementing a new loan origination system that will enhance and automate current end to end processes, increase productivity, provide efficiencies and improve information flow for decision-making 20
UNION Union First Market Bankshares Top-Tier Financial Performance Focus Union is committed to achieving top tier financial performance and providing our shareholders with above average returns on their investment In 2012, Union developed key financial performance metrics benchmarked against top quartile peers Minimum targets were set for ROA (>1%), ROE (>10%) and efficiency ratio (<65%) 21
UNION Union First Market Bankshares [Graphic Appears Here] Stable to growing economy in footprint Mid-single digit loan growth Modest margin compression Continued asset quality improvement Operational improvements at Union Mortgage Group Improving ROA, ROE and Efficiency Ratio 22
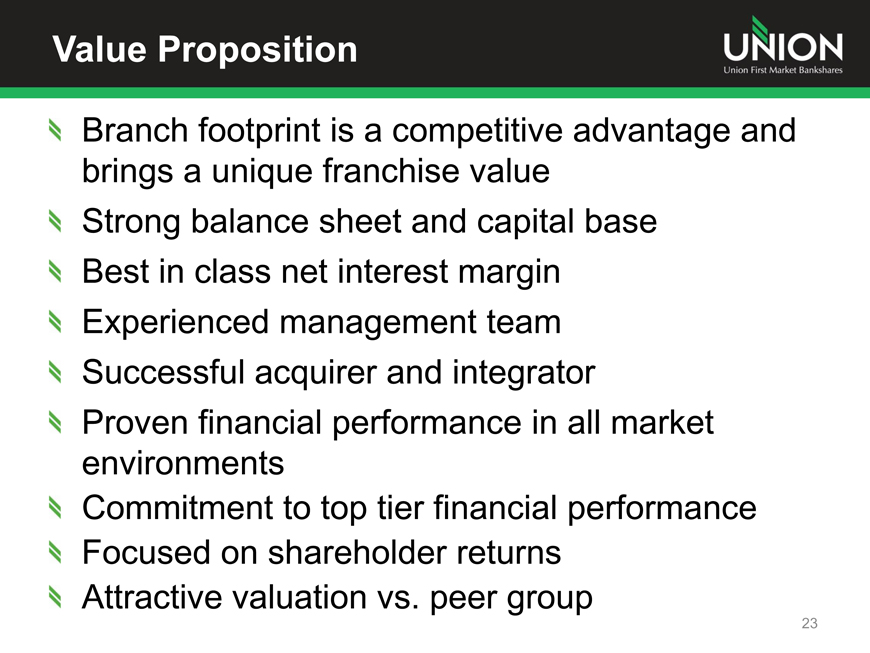
UNION Union First Market Bankshares [Graphic Appears Here] Branch footprint is a competitive advantage and brings a unique franchise value Strong balance sheet and capital base Best in class net interest margin Experienced management team Successful acquirer and integrator Proven financial performance in all market environments Commitment to top tier financial performance Focused on shareholder returns Attractive valuation vs. peer group 23

[Graphic Appears Here] UNION Union First Market Bankshares APPENDIX
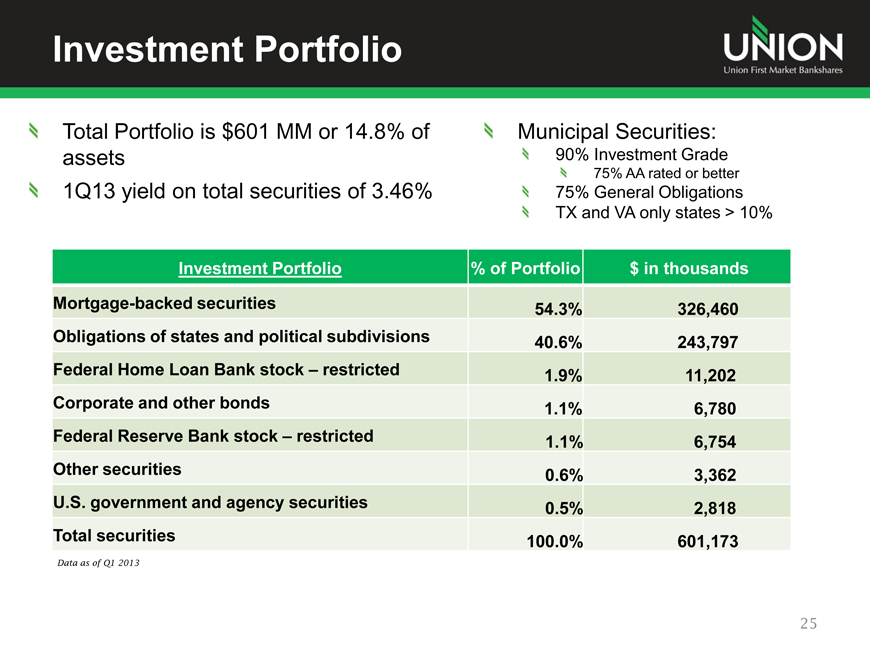
UNION Union First Market Bankshares Investment Portfolio Total Portfolio is $601 MM or 14.8% of Municipal Securities: assets 90% Investment Grade 75% AA rated or better 1Q13 yield on total securities of 3.46% 75% General Obligations TX and VA only states > 10% Investment Portfolio % of Portfolio $ in thousands Mortgage-backed securities 54.3% 326,460 Obligations of states and political subdivisions 40.6% 243,797 Federal Home Loan Bank stock _ restricted 1.9% 11,202 Corporate and other bonds 1.1% 6,780 Federal Reserve Bank stock _ restricted 1.1% 6,754 Other securities 0.6% 3,362 U.S. government and agency securities 0.5% 2,818 Total securities 100.0% 601,173 Data as of Q1 2013 25
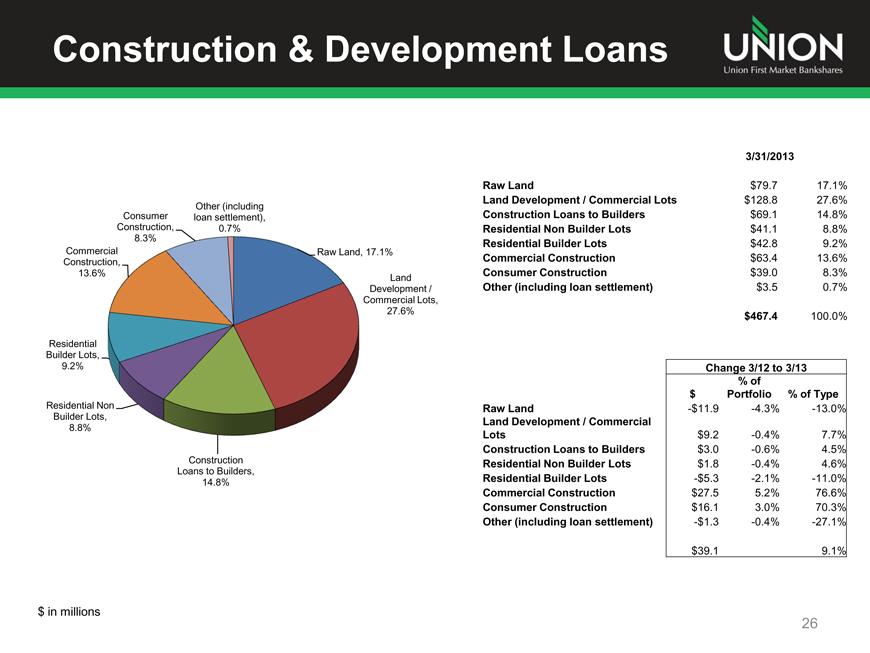
UNION Union First Market Bankshares Construction & Development Loans [Graphic Appears Here] Residential Builder Lots, 9.2% Residential Non Builder Lots, 8.8% Construction Loans to Builders, 14.8% $ in millions 3/31/2013 Raw Land $79.7 17.1% Land Development / Commercial Lots $128.8 27.6% Construction Loans to Builders $69.1 14.8% Residential Non Builder Lots $41.1 8.8% Raw Land, 17.1% Residential Builder Lots $42.8 9.2% Commercial Construction $63.4 13.6% Consumer Construction $39.0 8.3% Land Other (including loan settlement) $3.5 0.7% Development / Commercial Lots, 27.6% $467.4 100.0% Change 3/12 to 3/13 % of $ Portfolio % of Type Raw Land -$11.9 -4.3% -13.0% Land Development / Commercial Lots $9.2 -0.4% 7.7% Construction Loans to Builders $3.0 -0.6% 4.5% Residential Non Builder Lots $1.8 -0.4% 4.6% Residential Builder Lots -$5.3 -2.1% -11.0% Commercial Construction $27.5 5.2% 76.6% Consumer Construction $16.1 3.0% 70.3% Other (including loan settlement) -$1.3 -0.4% -27.1% $39.1 9.1% 26
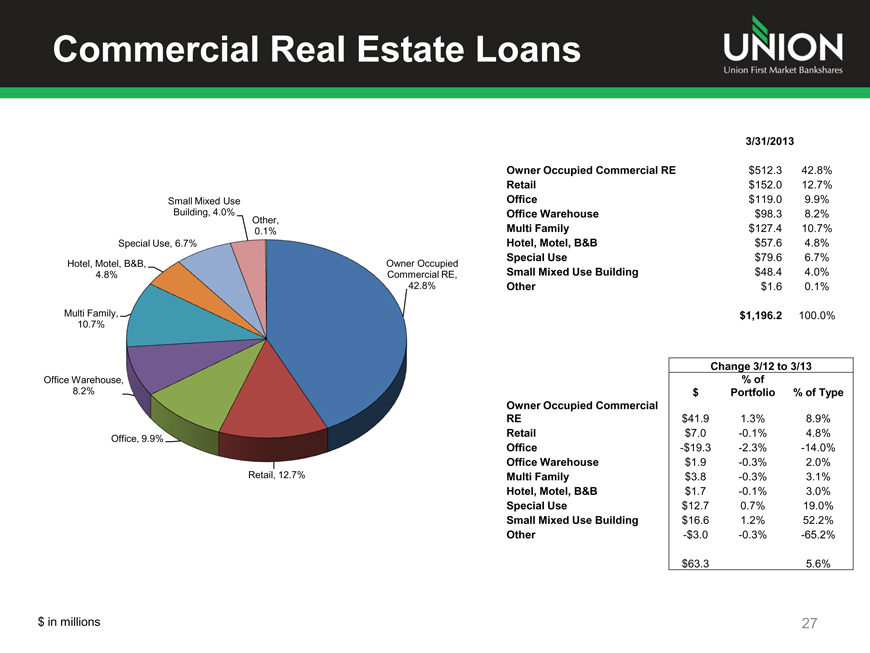
UNION Union First Market Bankshares Commercial Real Estate Loans [Graphic Appears Here] 3/31/2013 Owner Occupied Commercial RE $512.3 42.8% Retail $152.0 12.7% Office $119.0 9.9% Office Warehouse $98.3 8.2% Multi Family $127.4 10.7% Hotel, Motel, B&B $57.6 4.8% Special Use $79.6 6.7% Owner Occupied Commercial RE, Small Mixed Use Building $48.4 4.0% 42.8% Other $1.6 0.1% $1,196.2 100.0% Change 3/12 to 3/13 % of $ Portfolio % of Type Owner Occupied Commercial RE $41.9 1.3% 8.9% Retail $7.0 -0.1% 4.8% Office -$19.3 -2.3% -14.0% Office Warehouse $1.9 -0.3% 2.0% Multi Family $3.8 -0.3% 3.1% Hotel, Motel, B&B $1.7 -0.1% 3.0% Special Use $12.7 0.7% 19.0% Small Mixed Use Building $16.6 1.2% 52.2% Other -$3.0 -0.3% -65.2% $63.3 5.6% $ in millions 27