Exhibit 99.1
|
|
UNION
Union First Market Bankshares
Investor Presentation July 2012
|
|
UNION
Union First Market Bankshares
Overview
Financial Performance
Near-Term
Outlook Q&A
2
|
|
Forward-Looking Statement
UNION
Union First Market Bankshares
Certain statements in this report may constitute “forward-looking statements” within the meaning of the Private Securities Litigation Reform Act of 1995. Forward-looking statements are statements that include projections, predictions, expectations or beliefs about future events or results or otherwise and are not statements of historical fact. Such statements are often characterized by the use of qualified words (and their derivatives) such as “expect,” “believe,” “estimate,” “plan,” “project,” “anticipate” or other statements concerning opinions or judgment of the Company and its management about future events. Although the Company believes that its expectations with respect to forward-looking statements are based upon reasonable assumptions within the bounds of its existing knowledge of its business and operations, there can be no assurance that actual results, performance or achievements of the Company will not differ materially from any future results, performance or achievements expressed or implied by such forward-looking statements. Actual future results and trends may differ materially from historical results or those anticipated depending on a variety of factors, including, but not limited to, the effects of and changes in: general economic and bank industry conditions, the interest rate environment, legislative and regulatory requirements, competitive pressures, new products and delivery systems, inflation, changes in the stock and bond markets, accounting standards or interpretations of existing standards, mergers and acquisitions, technology, and consumer spending and savings habits. The Company does not update any forward-looking statements that may be made from time to time by or on behalf of the Company.
3
|
|
Company Overview
UNION
Union First Market Bankshares
One of the largest financial services organizations headquartered in Virginia
Holding company formed in 1993 Banking history in some communities goes back more than 100 years
Assets of $4.0 Billion
Comprehensive financial services provider offering: banking, mortgage, investment, trust and insurance
4
|
|
Investment Highlights
UNION
Union First Market Bankshares
Uniquely positioned in Virginia – locations, products and services
Branch footprint provides a competitive advantage and unique franchise value
Experienced management team
Successful acquirer and integrator
Proven financial performance in good and bad economic climates
5
|
|
Virginia Population Expansion
UNION
Union First Market Bankshares
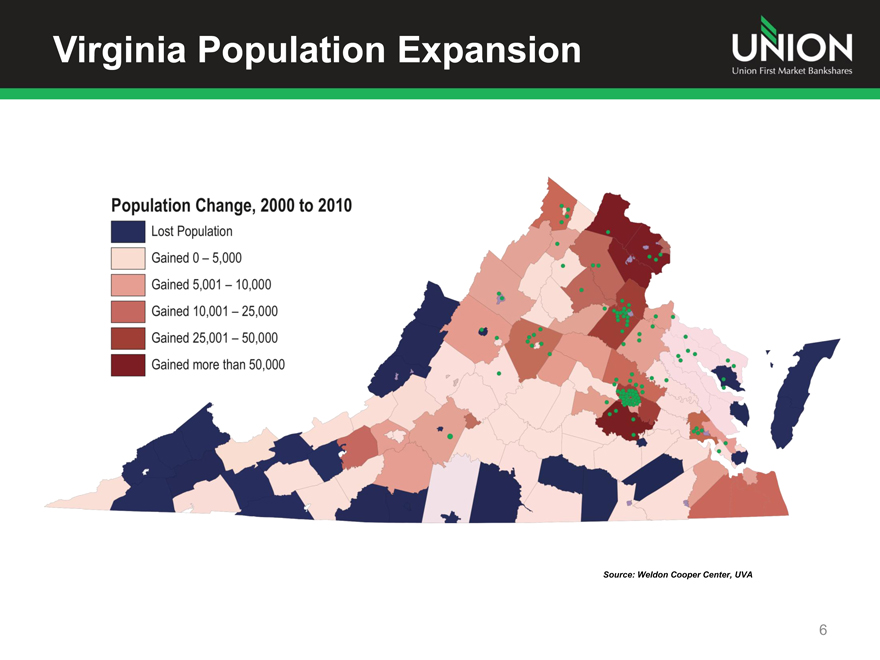
Population Change, 2000 to 2010
Lost Population
Gained 0- 5,000
Gained 5,001 -10,000
Gained 10,001 – 25,000
Gained 25,001 – 50,000
Gained more than 50,000
Source: Weldon Cooper Center, UVA
6
|
|
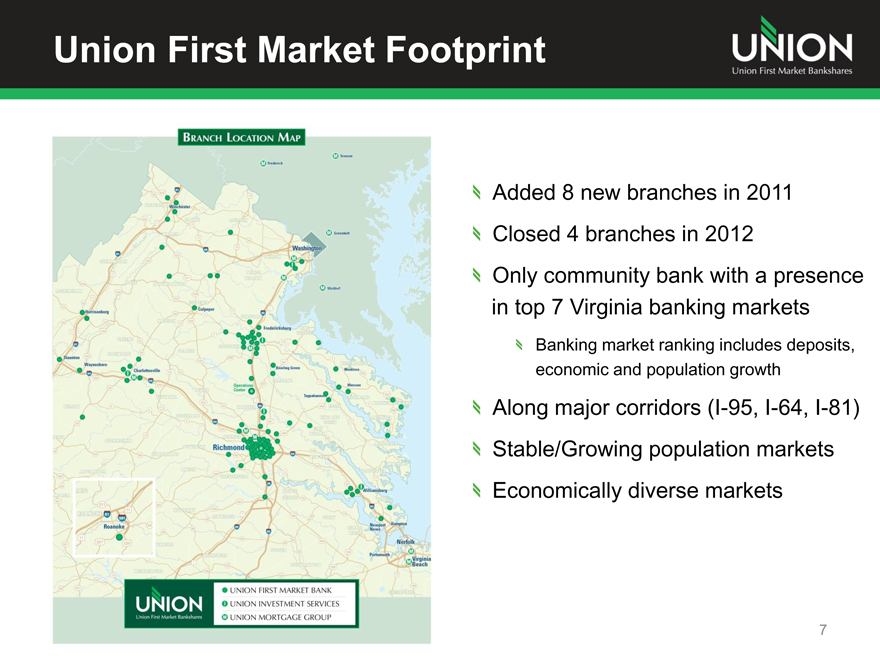
Union First Market Footprint
UNION
Union First Market Bankshares
Branch Location Map
UNION
Union First Market Bankshares
UNION FIRST MARKET BANK
UNION INVESTMENT SERVICES
UNION MORTGAGE GROUP
Added 8 new branches in 2011 Closed 4 branches in 2012
Only community bank with a presence in top 7 Virginia banking markets
Banking market ranking includes deposits, economic and population growth
Along major corridors (I-95, I-64, I-81) Stable/Growing population markets Economically diverse markets
7
|
|
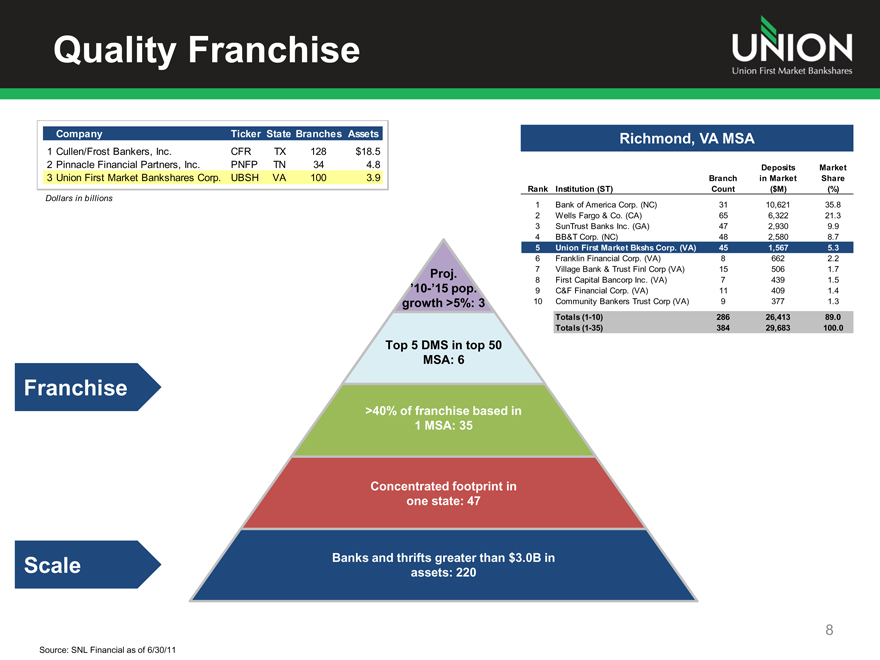
Quality Franchise
UNION
Union First Market Bankshares
Company Ticker State Branches Assets
1 Cullen/Frost Bankers, Inc. CFR TX 128 $18.5
2 Pinnacle Financial Partners, Inc. PNFP TN 34 4.8
3 Union First Market Bankshares Corp. UBSH VA 100 3.9
Dollars in billions
Franchise
Scale
Source: SNL Financial as of 6/30/11
Proj.
’10-’15 pop.
growth >5%: 3
Top 5 DMS in top 50 MSA: 6
>40% of franchise based in
1 MSA: 35
Concentrated in footprint in one state: 47
Banks and thrifts greater than $3.0B in assets: 220
Richmond, VA MSA
Rank Institution (ST) Branch Count Deposits in Market ($M) Market Share (%)
1 Bank of America Corp. (NC) 31 10,621 35.8
2 Wells Fargo & Co. (CA) 65 6,322 21.3
3 SunTrust Banks Inc. (GA) 47 2,930 9.9
4 BB&T Corp. (NC) 48 2,580 8.7
5 Union First Market Bkshs Corp. (VA) 45 1,567 5.3
6 Franklin Financial Corp. (VA) 8 662 2.2
7 Village Bank & Trust Finl Corp (VA) 15 506 1.7
8 First Capital Bancorp Inc. (VA) 7 439 1.5
9 C&F Financial Corp. (VA) 11 409 1.4
10 Community Bankers Trust Corp (VA) 9 377 1.3
Totals (1-10) 286 26,413 89.0
Totals (1-35) 384 29,683 100.0
8
|
|
First Half Highlights
UNION
Union First Market Bankshares
More than 2,200 new households in the first half
Continued deposit and loan growth
Closed 4 branches as part of branch rationalization analysis
New mortgage originators and low rate environment driving growth
Asset quality continues to improve
Capital levels are strong
Raised Quarterly Dividend twice in 2012 – now at 10 cents a share
9
|
|
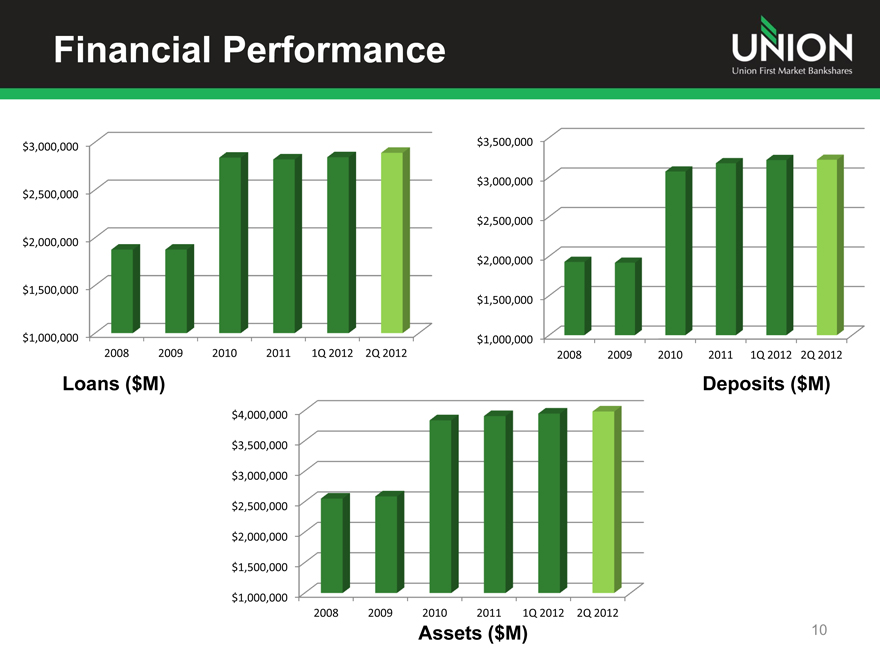
Financial Performance
UNION
Union First Market Bankshares
$3,000,000
$3,500,000
$3,000,000
$2,500,000
$2,500,000
$2,000,000
$2,000,000
$1,500,000
$1,500,000
$1,000,000
$1,000,000
2008
2009
2010
2011
1Q 2012
2Q 2012
2008
2009
2010
2011 1Q 2012 2Q 2012
Loans ($M)
Deposits ($M)
$4,000,000
$3,500,000
$3,000,000
$2,500,000
$2,000,000
$1,500,000
$1,000,000
2008
2009
2010
2011
1Q 2012
2Q 2012
Assets ($M)
10
|
|
Financial Performance
UNION
Union First Market Bankshares
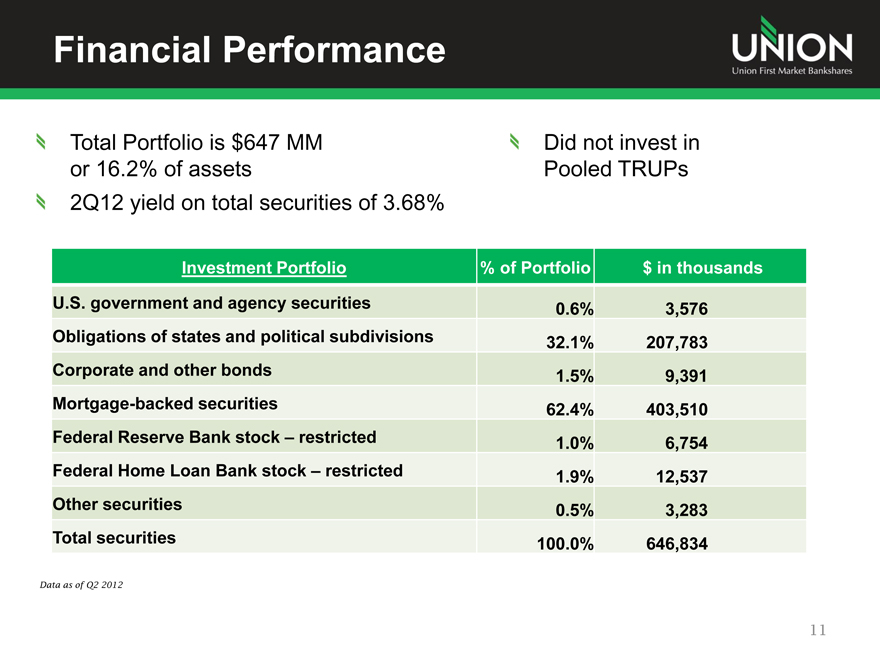
Total Portfolio is $647 MM
Did not invest in
or 16.2% of assets
Pooled TRUPs
2Q12 yield on total securities of 3.68%
Investment Portfolio
% of Portfolio
$ in thousands
U.S. government and agency securities
0.6%
3,576
Obligations of states and political subdivisions
32.1%
207,783
Corporate and other bonds
1.5%
9,391
Mortgage-backed securities
62.4%
403,510
Federal Reserve Bank stock – restricted
1.0%
6,754
Federal Home Loan Bank stock – restricted
1.9%
12,537
Other securities
0.5%
3,283
Total securities
100.0%
646,834
Data as of Q2 2012
11
|
|
Loan Portfolio
UNION
Union First Market Bankshares
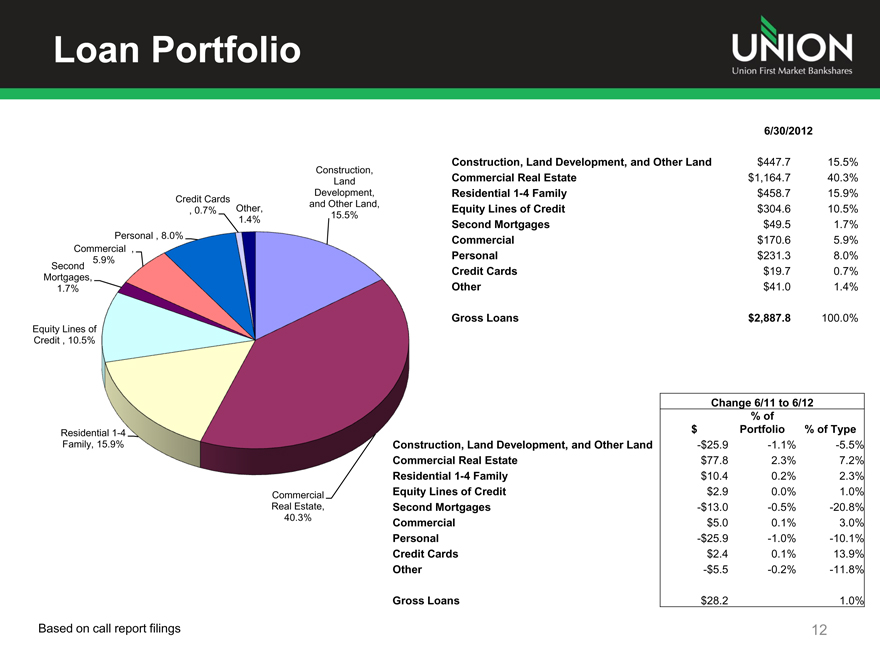
Construction, Land Development, and Other Land, 15.5%
Credit Cards , 0.7%
Other, 1.4%
Personal , 8.0%
Commercial , 5.9%
Second Mortgages,
1.7%
Equity Lines of Credit , 10.5%
Residential 1-4 Family, 15.9%
Commercial Real Estate,
40.3%
6/30/2012
Construction, Land Development, and Other Land
$447.7
15.5%
Commercial Real Estate
$1,164.7
40.3%
Residential 1-4 Family
$458.7
15.9%
Equity Lines of Credit
$304.6
10.5%
Second Mortgages
$49.5
1.7%
Commercial
$170.6
5.9%
Personal
$231.3
8.0%
Credit Cards
$19.7
0.7%
Other
$41.0
1.4%
Gross Loans
$2,887.8
100.0%
Change 6/11 to 6/12
% of
$
Portfolio
% of Type
Construction, Land Development, and Other Land
-$25.9
-1.1%
-5.5%
Commercial Real Estate
$77.8
2.3%
7.2%
Residential 1-4 Family
$10.4
0.2%
2.3%
Equity Lines of Credit
$2.9
0.0%
1.0%
Second Mortgages
-$13.0
-0.5%
-20.8%
Commercial
$5.0
0.1%
3.0%
Personal
-$25.9
-1.0%
-10.1%
Credit Cards
$2.4
0.1%
13.9%
Other
-$5.5
-0.2%
-11.8%
Gross Loans
$28.2
1.0%
Based on call report filings
12
|
|
Construction & Development
UNION
Union First Market Bankshares
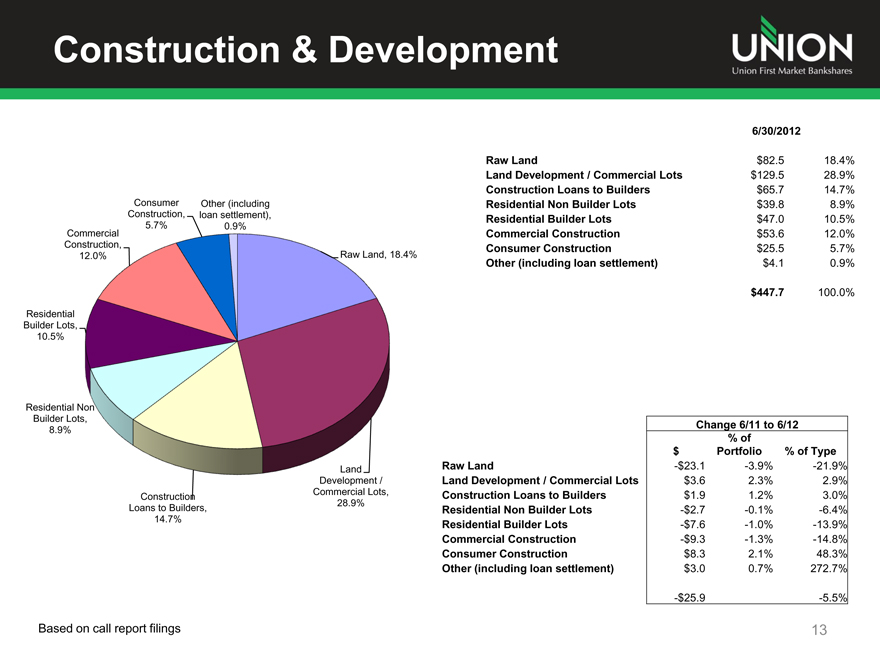
6/30/2012
Raw Land, 18.4%
Other (including loan settlement), 0.9%
Consumer Construction, 5.7%
Commercial Construction, 12.0%
Residential Builder Lots, 10.5%
Residential Non Builder Lots, 8.9%
Construction Loans to Builders, 14.7%
Land Development / Commercial Lots, 28.9%
Raw Land $82.5 18.4%
Land Development / Commercial Lots $129.5 28.9%
Construction Loans to Builders $65.7 14.7%
Residential Non Builder Lots $39.8 8.9%
Residential Builder Lots $47.0 10.5%
Commercial Construction $53.6 12.0%
Consumer Construction $25.5 5.7%
Other (including loan settlement) $4.1 0.9%
$447.7 100.0%
Change 6/11 to 6/12
% of
$ Portfolio % of Type
Raw Land -$23.1 -3.9% -21.9%
Land Development / Commercial Lots $3.6 2.3% 2.9%
Construction Loans to Builders $1.9 1.2% 3.0%
Residential Non Builder Lots -$2.7 -0.1% -6.4%
Residential Builder Lots -$7.6 -1.0% -13.9%
Commercial Construction -$9.3 -1.3% -14.8%
Consumer Construction $8.3 2.1% 48.3%
Other (including loan settlement) $3.0 0.7% 272.7%
-$25.9 -5.5%
Based on call report filings
13
|
|
Commercial Real Estate
UNION
Union First Market Bankshares
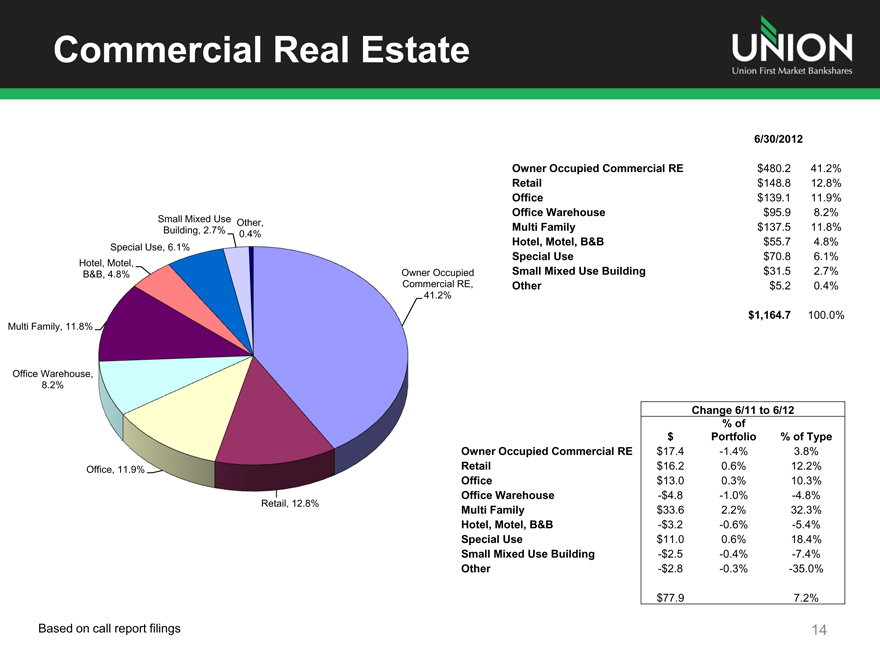
Owner Occupied Commercial RE, 41.2%
Other, 0.4%
Small Mixed Use Building, 2.7%
Special Use, 6.1%
Hotel, Motel, B&B, 4.8%
Multi Family, 11.8%
Office Warehouse, 8.2%
Office, 11.9%
6/30/2012
Owner Occupied Commercial RE
$480.2
41.2%
Retail
$148.8
12.8%
Office
$139.1
11.9%
Office Warehouse
$95.9
8.2%
Multi Family
$137.5
11.8%
Hotel, Motel, B&B
$55.7
4.8%
Special Use
$70.8
6.1%
Small Mixed Use Building
$31.5
2.7%
Other
$5.2
0.4%
$1,164.7
100.0%
Retail, 12.8%
Change 6/11 to 6/12
% of
$
Portfolio
% of Type
Owner Occupied Commercial RE
$17.4
-1.4%
3.8%
Retail
$16.2
0.6%
12.2%
Office
$13.0
0.3%
10.3%
Office Warehouse
-$4.8
-1.0%
-4.8%
Multi Family
$33.6
2.2%
32.3%
Hotel, Motel, B&B
-$3.2
-0.6%
-5.4%
Special Use
$11.0
0.6%
18.4%
Small Mixed Use Building
-$2.5
-0.4%
-7.4%
Other
-$2.8
-0.3%
-35.0%
$77.9
7.2%
Based on call report filings
14
|
|
Risk Management
UNION
Union First Market Bankshares
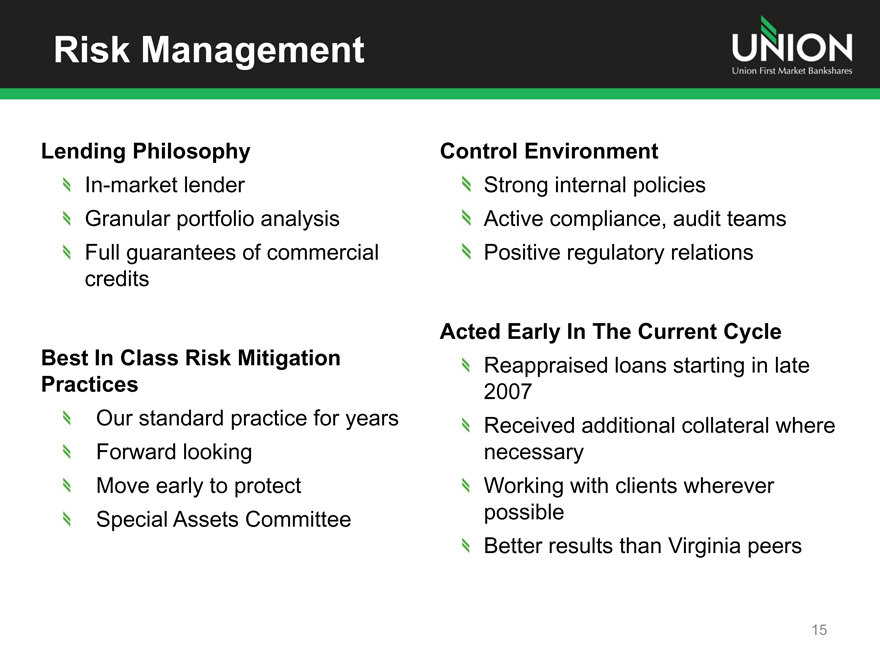
Lending Philosophy
In-market lender
Granular portfolio analysis Full guarantees of commercial credits
Best In Class Risk Mitigation Practices
Our standard practice for years Forward looking Move early to protect Special Assets Committee
Control Environment
Strong internal policies
Active compliance, audit teams Positive regulatory relations
Acted Early In The Current Cycle
Reappraised loans starting in late 2007 Received additional collateral where necessary Working with clients wherever possible Better results than Virginia peers
15
|
|
Asset Quality Trends
UNION
Union First Market Bankshares
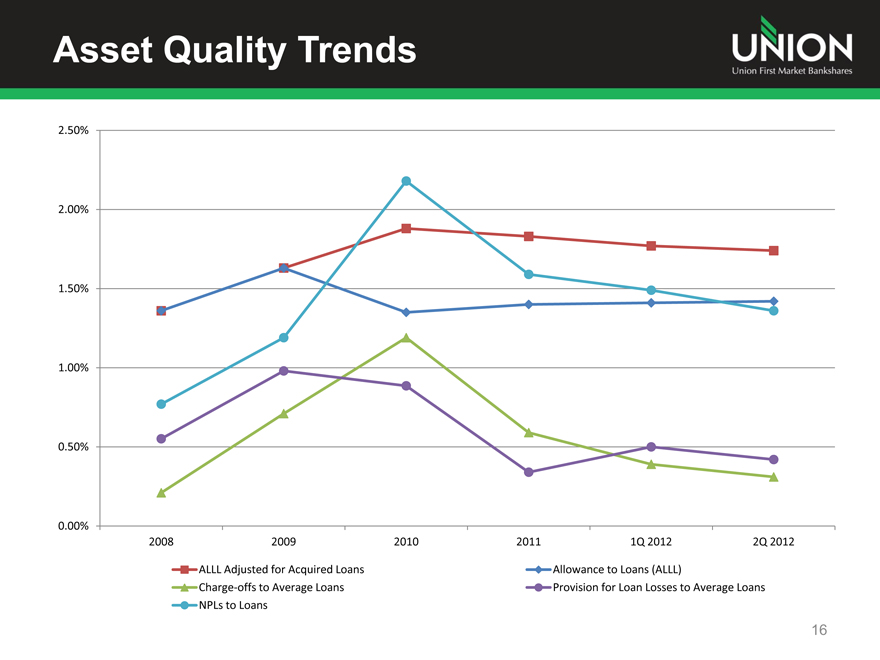
2.50% 2.00% 1.50% 1.00% 0.50% 0.00%
2008
2009
2010
2011
1Q 2012
2Q 2012
ALLL Adjusted for Acquired Loans
Allowance to Loans (ALLL)
Charge-offs to Average Loans
Provision for Loan Losses to Average Loans
NPLs to Loans
16
|
|
NPAs by Type
UNION
Union First Market Bankshares
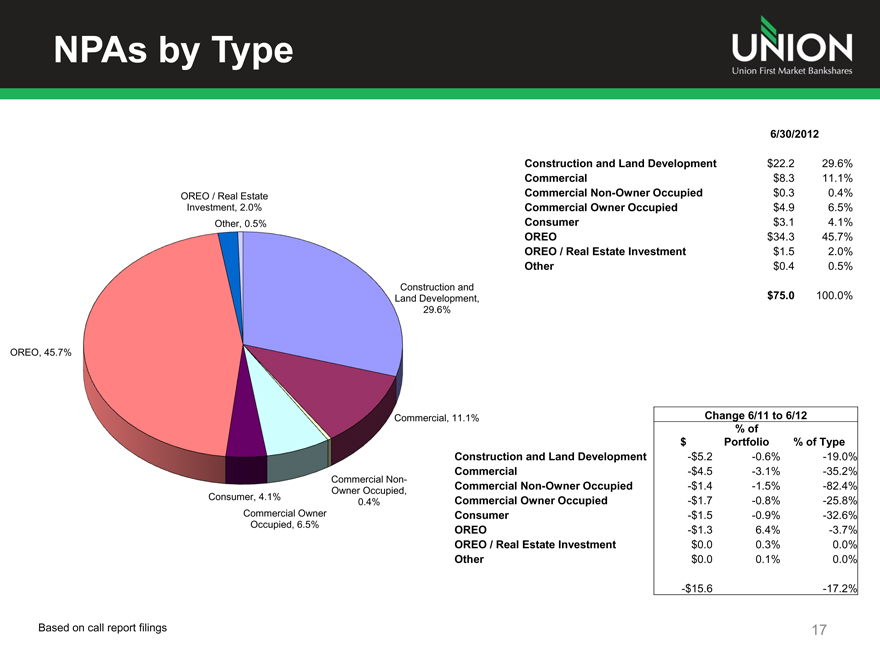
OREO / Real Estate Investment, 2.0% Other, 0.5%
OREO, 45.7%
Construction and Land Development, 29.6%
Commercial, 11.1%
Commercial Non-Owner Occupied, 0.4%
Consumer, 4.1%
Commercial Owner Occupied, 6.5%
6/30/2012
Construction and Land Development $22.2 29.6%
Commercial $8.3 11.1%
Commercial Non-Owner Occupied $0.3 0.4%
Commercial Owner Occupied $4.9 6.5%
Consumer $3.1 4.1%
OREO $34.3 45.7%
OREO / Real Estate Investment $1.5 2.0%
Other $0.4 0.5%
$75.0 100.0%
Change 6/11 to 6/12
% of
$ Portfolio
% of Type
Construction and Land Development
-$5.2
-0.6%
-19.0%
Commercial
-$4.5
-3.1%
-35.2%
Commercial Non-Owner Occupied
-$1.4
-1.5%
-82.4%
Commercial Owner Occupied
-$1.7
-0.8%
-25.8%
Consumer
-$1.5
-0.9%
-32.6%
OREO
-$1.3
6.4%
-3.7%
OREO / Real Estate Investment
$0.0
0.3%
0.0%
Other
$0.0
0.1%
0.0%
-$15.6
-17.2%
Based on call report filings
17
|
|
NPAs by Market
UNION
Union First Market Bankshares
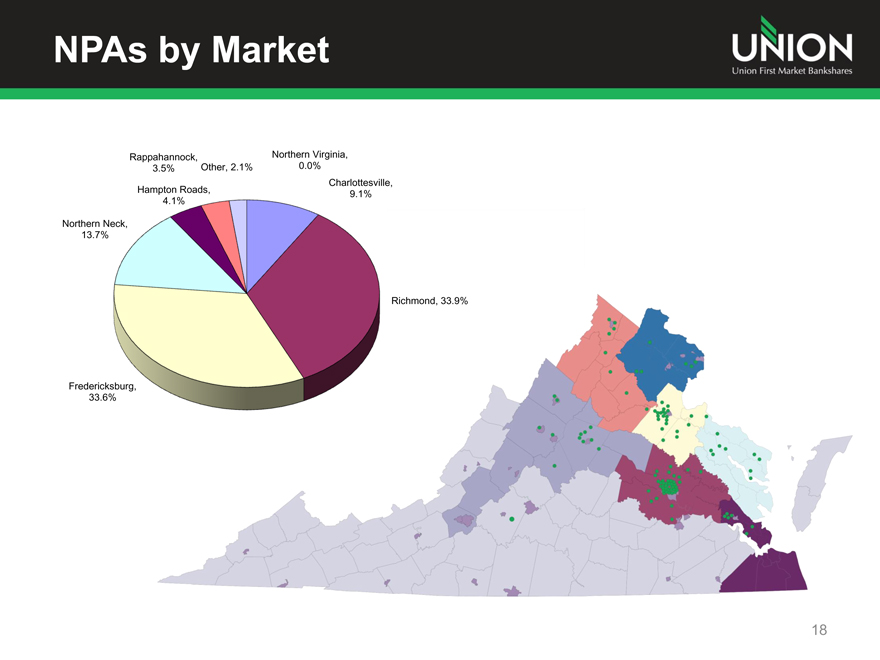
Richmond, 33.9%
Charlottesville, 9.1%
Northern Virginia, 0.0%
Other, 2.1%
Rappahannock, 3.5%
Hampton Roads, 4.1%
Northern Neck, 13.7%
Fredericksburg, 33.6%
18
|
|
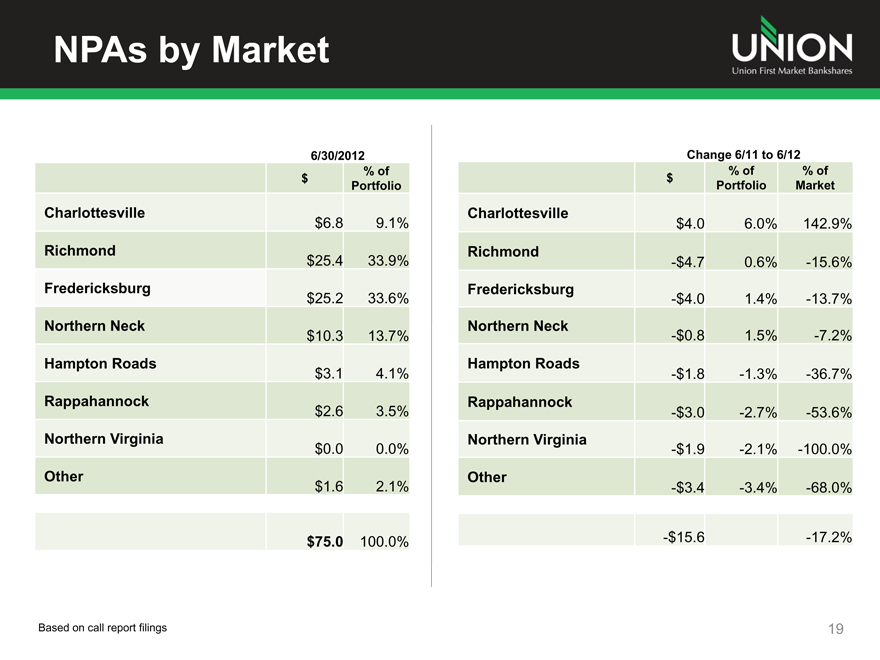
NPAs by Market
UNION
Union First Market Bankshares
6/30/2012
$ % of Portfolio
Charlottesville
$6.8 9.1%
Richmond
$25.4 33.9%
Fredericksburg
$25.2 33.6%
Northern Neck
$10.3 13.7%
Hampton Roads
$3.1 4.1%
Rappahannock
$2.6 3.5%
Northern Virginia
$0.0 0.0%
Other
$1.6 2.1%
$75.0 100.0%
Change 6/11 to 6/12
$ % of
% of Portfolio
Market
Charlottesville
$4.0 6.0% 142.9%
Richmond
-$4.7 0.6% -15.6%
Fredericksburg
-$4.0 1.4% -13.7%
Northern Neck
-$0.8 1.5% -7.2%
Hampton Roads
-$1.8 -1.3% -36.7%
Rappahannock
-$3.0 -2.7% -53.6%
Northern Virginia
-$1.9 -2.1%
-100.0%
Other
-$3.4 -3.4% -68.0% -$15.6 -17.2%
Based on call report filings
19
|
|
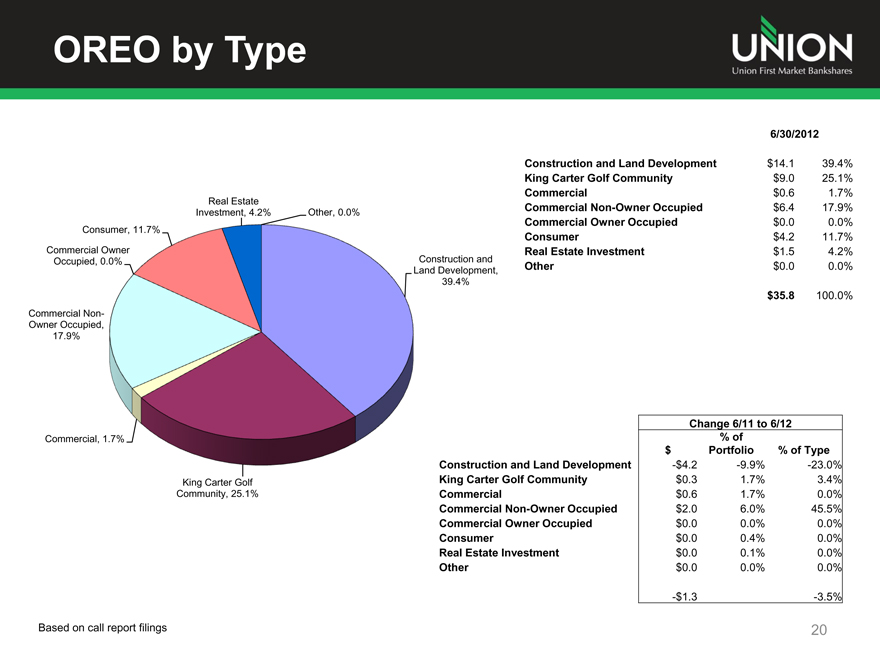
OREO by Type
UNION
Union First Market Bankshares
6/30/2012
Construction and Land Development, $14.1 39.4%
Other, 0.0%
Real Estate Investment, 4.2%
Consumer, 11.7%
Commercial Owner Occupied, 0.0%
Commercial Non-Owner Occupied, 17.9%
Commercial, 1.7%
King Carter Golf Community, 25.1%
Construction and Land Development 39.4%
King Carter Golf Community $9.0 25.1%
Commercial $0.6 1.7%
Commercial Non-Owner Occupied $6.4 17.9%
Commercial Owner Occupied $0.0 0.0%
Consumer $4.2 11.7%
Real Estate Investment $1.5 4.2%
Other $0.0 0.0%
$35.8 100.0%
Change 6/11 to 6/12
% of
$ Portfolio % of Type
Construction and Land Development -$4.2 -9.9% -23.0%
King Carter Golf Community $0.3 1.7% 3.4%
Commercial $0.6 1.7% 0.0%
Commercial Non-Owner Occupied $2.0 6.0% 45.5%
Commercial Owner Occupied $0.0 0.0% 0.0%
Consumer $0.0 0.4% 0.0%
Real Estate Investment $0.0 0.1% 0.0%
Other $0.0 0.0% 0.0%
-$1.3 -3.5%
Based on call report filings
20
|
|
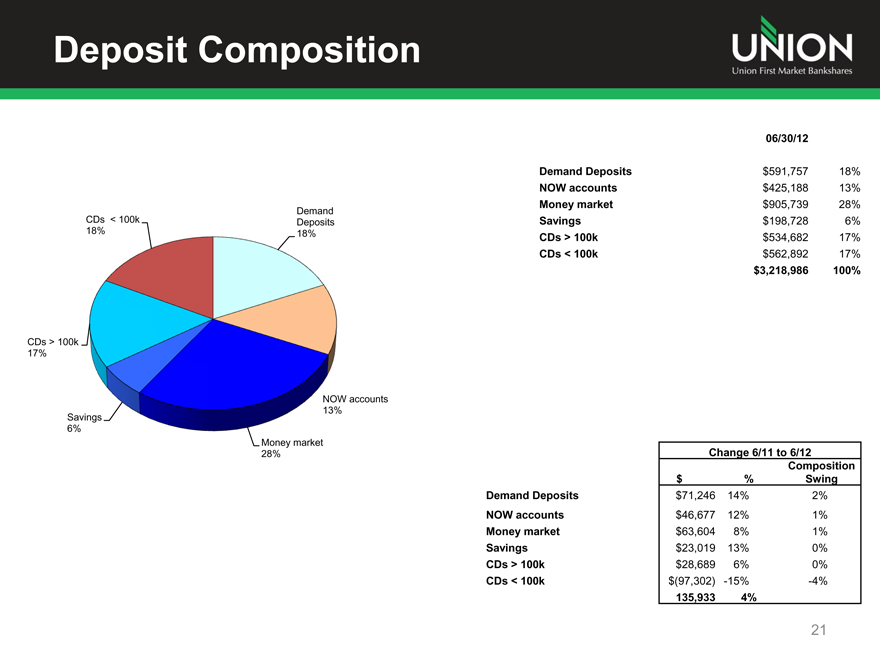
Deposit Composition
UNION
Union First Market Bankshares
Demand Deposits 18%
CDs < 100k 18%
CDs > 100k 17%
Savings 6%
Money market 28%
NOW accounts 13%
06/30/12
Demand Deposits
$591,757 18%
NOW accounts
$425,188 13%
Money market
$905,739 28%
Savings
$198,728 6%
CDs > 100k
$534,682 17%
CDs < 100k $562,892
17% $3,218,986 100%
Change 6/11 to 6/12
Composition Swing
$ %
Demand Deposits
$71,246 14% 2%
NOW accounts
$46,677 12% 1%
Money market
$63,604 8% 1%
Savings
$23,019 13% 0%
CDs > 100k
$28,689 6% 0%
CDs < 100k
$(97,302) -15% -4%
135,933 4%
21
|
|
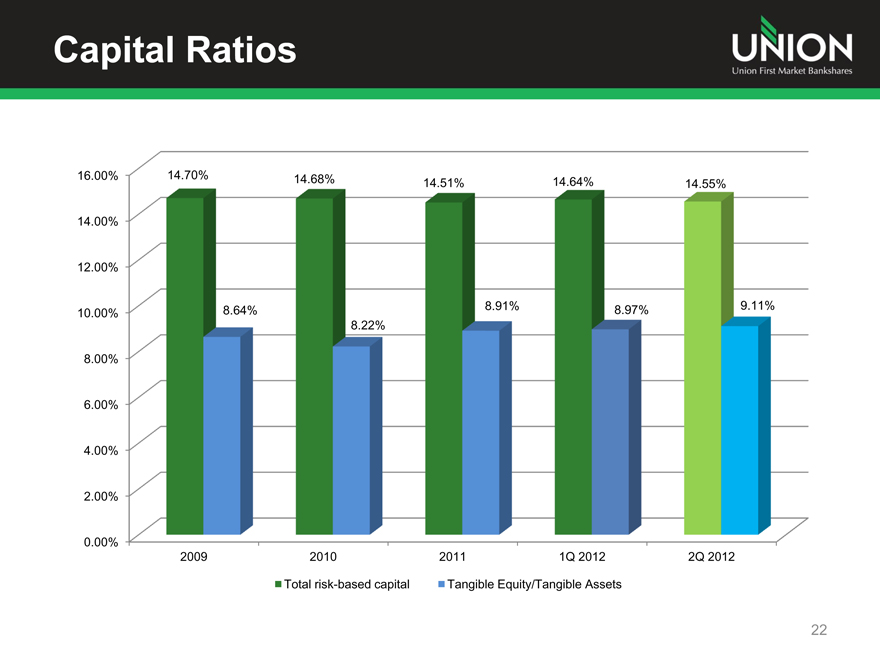
Capital Ratios
UNION
Union First Market Bankshares
16.00%
14.70%
14.68%
14.51%
14.64%
14.55%
14.00%
12.00%
10.00%
8.64%
8.91%
8.97%
9.11%
8.22%
8.00%
6.00%
4.00%
2.00%
0.00%
2009
2010
2011
1Q 2012
2Q 2012
Total risk-based capital
Tangible Equity/Tangible Assets
22
|
|
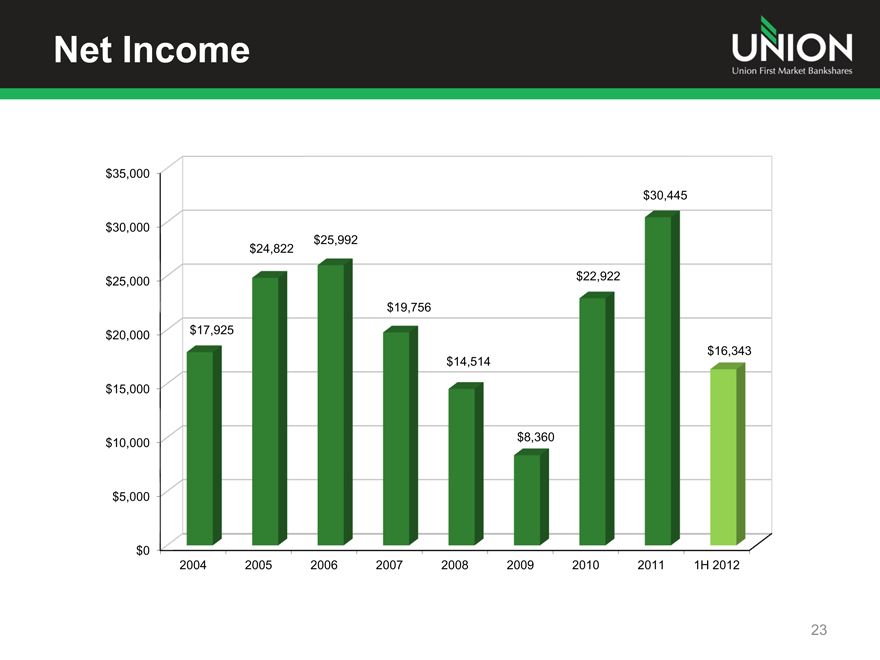
Net Income
UNION
Union First Market Bankshares
$35,000
$30,445
$30,000
$25,992
$24,822
$25,000
$22,922
$19,756
$20,000
$17,925
$16,343
$14,514
$15,000
$10,000
$8,360
$5,000
$0
2004
2005
2006
2007
2008
2009
2010
2011
1H 2012
23
|
|
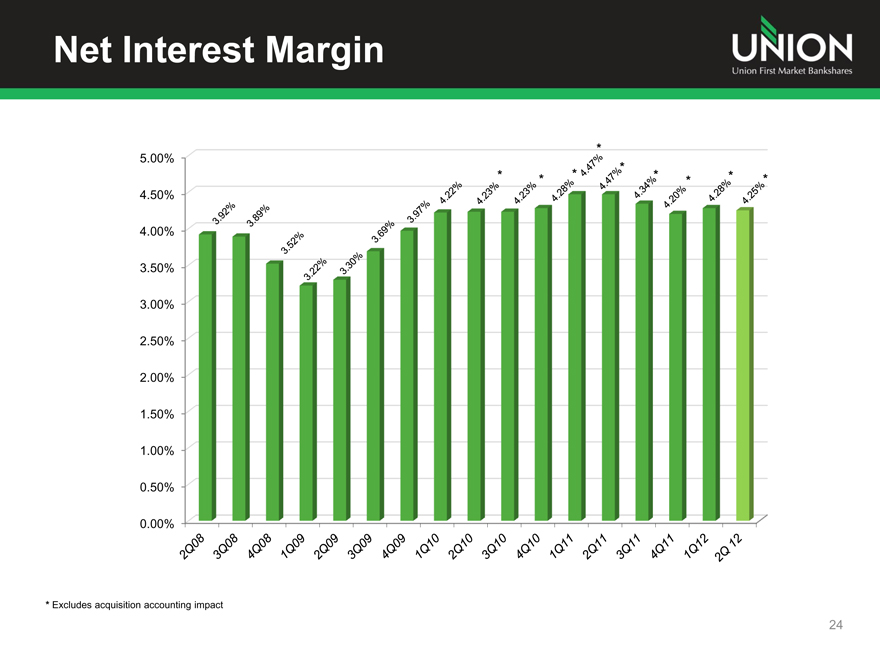
Net Interest Margin
UNION
Union First Market Bankshares
5.00%
4.50%
4.00%
3.50%
3.00%
2.50%
2.00%
1.50%
1.00%
0.50%
0.00%
3.92%
3.89%
3.52%
3.22%
3.30%
3.69%
3.97%
4.22%
4.23%*
4.23%*
4.28%*
4.47%*
4.47%*
4.34%*
4.20%*
4.28%*
4.25%*
2Q08
3Q08
4Q08
1Q09
2Q09
3Q09
4Q09
1Q10
2Q10
3Q10
4Q10
1Q11
2Q11
3Q11
4Q11
1Q12
2Q12
* Excludes acquisition accounting impact
24
|
|
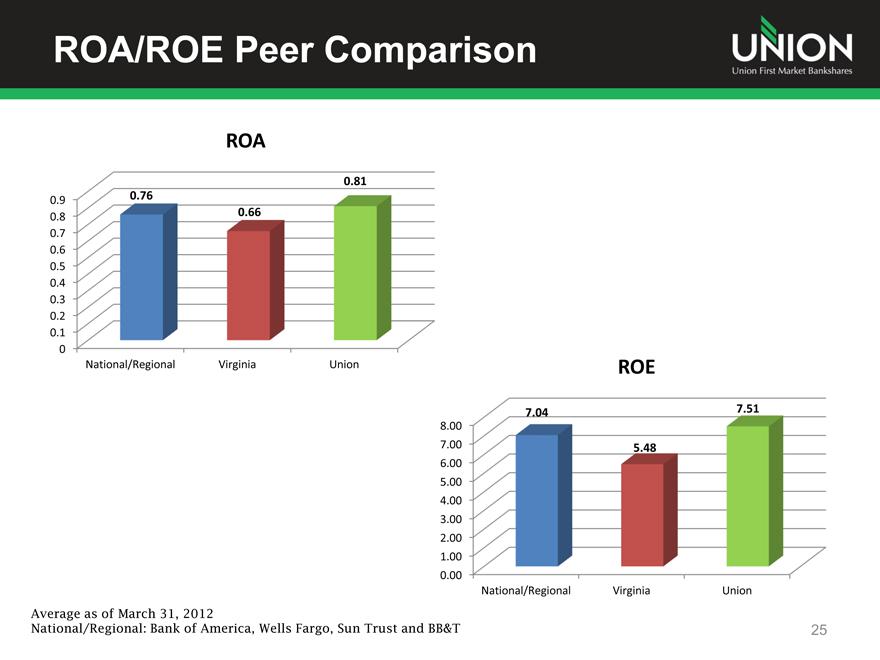
ROA/ROE Peer Comparison
UNION
Union First Market Bankshares
ROA
0.81
0.9
0.76
0.8
0.66
0.7
0.6
0.5
0.4
0.3
0.2
0.1
0
National/Regional
Virginia
Union
ROE
7.04
7.51
8.00
7.00
5.48
6.00
5.00
4.00
3.00
2.00
1.00
0.00
National/Regional
Virginia
Union
Average as of March 31, 2012
National/Regional: Bank of America, Wells Fargo, Sun Trust and BB&T
25
|
|
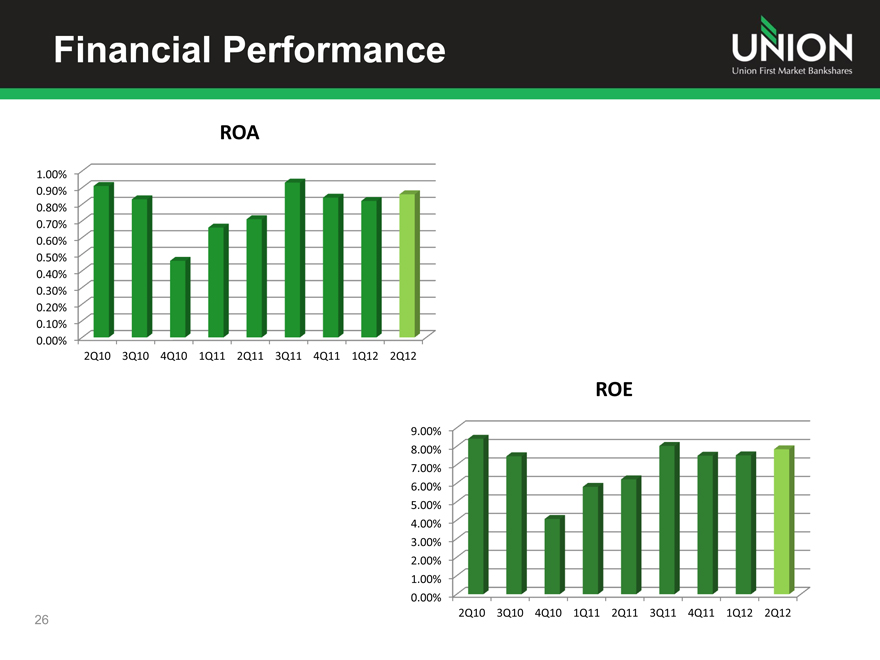
Financial Performance
UNION
Union First Market Bankshares
ROA
1.00%
0.90%
0.80%
0.70%
0.60%
0.50%
0.40%
0.30%
0.20%
0.10%
0.00%
2Q10
3Q10
4Q10
1Q11
2Q11
3Q11
4Q11
1Q12
2Q12
ROE
9.00%
8.00%
7.00%
6.00%
5.00%
4.00%
3.00%
2.00%
1.00%
0.00%
2Q10
3Q10
4Q10
1Q11
2Q11
3Q11
4Q11
1Q12
2Q12
26
|
|
Top-Tier Financial Performance
UNION
Union First Market Bankshares
Focus has primarily been on merger integration, products and asset quality over the past few years
Now time to turn to fee income and non-interest expense levels to improve profitability and increase returns
We are working to create a roadmap to improve efficiency, increase revenue and reduce expenses
27
| 42,
|
Positioned Well to Succeed
UNION
Union First Market Bankshares
Key Findings from our Fall 2011 surveys:
94% of our customers gave us either an “A” (66%) or “B” (28%)
Higher than either Union Bank & Trust or First Market Bank scored prior to the merger
Only 85% of prospects gave their Bank “A” or “B”
Net promoter score of 49% compared to competitors’ score of 21%
Teammates rate us high as an employer and as a bank
83% gave Union “A” (28%) or “B” (55%) as an employer
93% rated Union “A” (50%) or “B” (43%) as a bank
68% of Teammates are likely to recommend us as a bank
Customers rate Teammates higher than Teammates rate themselves
96% of customers gave Teammates an “A” (79%) or “B” (17%)
28
|
|
2012 Outlook
UNION
Union First Market Bankshares
Modest economic recovery in footprint – impact of Federal budget cuts (including defense) not known
Continued improved in asset quality as commercial and residential real estate market stabilize further
Expect loan growth in a challenging loan market and as consumer continues to deleverage
New originators in Union Mortgage still have capacity to add
Still plenty of expansion opportunities in Virginia
Organic
Acquisition
29
|
|
Value Proposition
UNION
Union First Market Bankshares
Branch footprint is a competitive advantage and brings a unique franchise value
Experienced management team
Successful acquirer and integrator
Strong balance sheet
Proven financial performance in all market environments
Higher ROA and ROE than Virginia peers
Increased quarterly dividend twice in 2012
30
|
|
UNION
Union First Market Bankshares
THANK YOU!