 Investor Presentation
First Quarter 2010
First Quarter 2010
Exhibit 99.1 |
| Investor Presentation
Investor Presentation
First Quarter 2010
First Quarter 2010
Exhibit 99.1 |
 Agenda
Overview
Purpose and Values
Financial Performance
First Market Update
2010 Outlook
Q & A
2 |
 Forward Looking Statement
3
Certain statements in this report may constitute
“forward-looking statements” within the meaning of the Private
Securities Litigation Reform Act of 1995. Forward-looking
statements are statements that include projections, predictions,
expectations or beliefs about future events or results or otherwise and are not statements of historical fact.
Such statements are often characterized by the use of qualified words
(and their derivatives) such as “expect,”
“believe,” “estimate,” “plan,”
“project,” “anticipate” or other statements concerning opinions or judgment of the
Company and its management about future events. Although the
Company believes that its expectations with respect to
forward-looking statements are based upon reasonable assumptions within the bounds of its existing knowledge of
its business and operations, there can be no assurance that actual
results, performance or achievements of the Company will not
differ materially from any future results, performance or achievements expressed or implied by
such forward-looking statements. Actual future results and
trends may differ materially from historical results or those
anticipated depending on a variety of factors, including, but not limited to, the effects of and changes in: general
economic conditions, the interest rate environment, legislative and
regulatory requirements, competitive pressures, new products and
delivery systems, inflation, changes in the stock and bond markets, technology, and consumer
spending and savings habits. The Company does not update any
forward-looking statements that may be made from time to
time by or on behalf of the Company. |
 Overview
One of the Largest Virginia-Based Financial Services
Organization
Holding Company formed in 1993
Assets of $3.85 Billion
Comprehensive financial services provider offering:
banking, mortgage, investment, brokerage and insurance
4 |
 Investment Highlights
Attractive branch footprint in growth
markets that will recover early
Proven financial performance
Experienced management team
Proven acquirer and integrator
5 |
 Purpose and Values |
 Purpose Statement
“Helping People Find
Financial Solutions”
7 |
 Values
Customer Focus
Integrity & Trust
Knowledge
Respect
Partnership
Integrity
Service
Caring
Passion
Creativity
Achievement
8 |
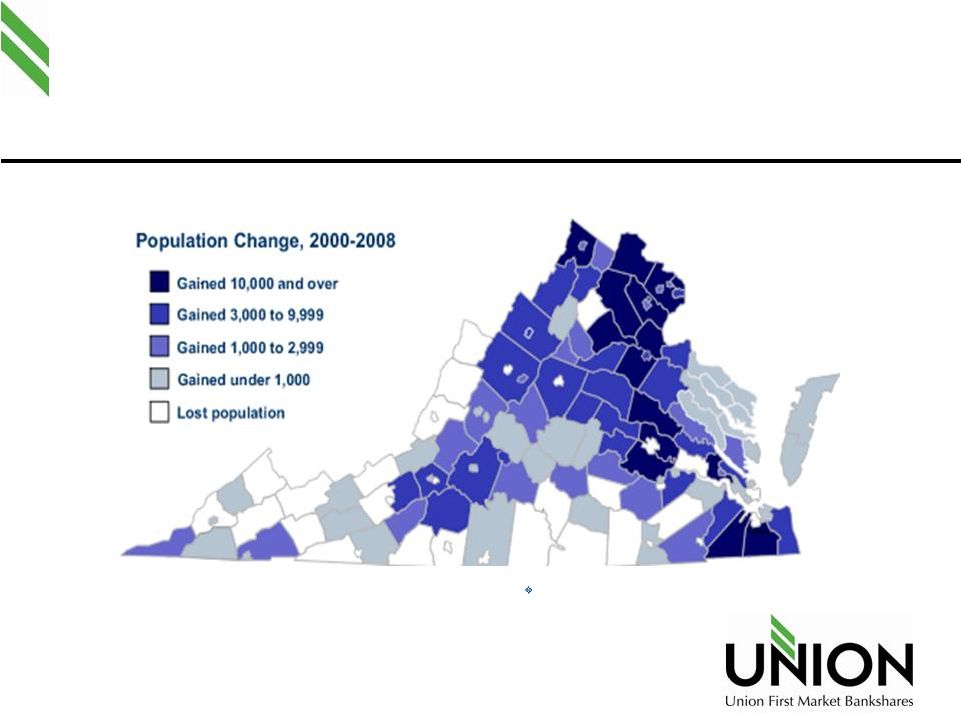 Virginia Population Expansion
Source: Weldon Cooper Center, UVA
9 |
 Diversity Supports Growth in Virginia
Charlottesville
University of Virginia & Medical
College
High tech and professional businesses
Virginia
Beach
-
Norfolk
Military
Shipbuilding
Tourism
Fredericksburg
Defense and security contractors
Health care
Retail
Northern Virginia
Nation’s Capital
Defense and security contractors
Associations (lobbyists)
High tech
Richmond
State Capital
Fortune 500 headquarters
Finance and insurance
Fort Lee doubling in size
VCU & Medical College of Va.
10 |
 Experienced Leadership
Age
Years in
Position
Total Years
in Banking
Executive Management Team (7)
Average
54
12
192
27
Senior Leadership Team (21)
52
10
536
26
(1) Includes executive management team
Varied Backgrounds
Experienced Market Disruptions
Problem solvers
11
Average
(1) |
 Risk Management
Risk Mitigation Practices
Act early, ensure collateral,
move to protect
Re-risk ratings
Re-appraisals of CRE
Special Asset Committee
Stress testing on CRE
concentrations
Lending Philosophy
In market lender
Community bank lending
Granular portfolio
Full guarantees of commercial
credits
Avoid high risk categories
No shared national credits
No sub-prime loans
Minimal participations
12 |
 Financial Performance |
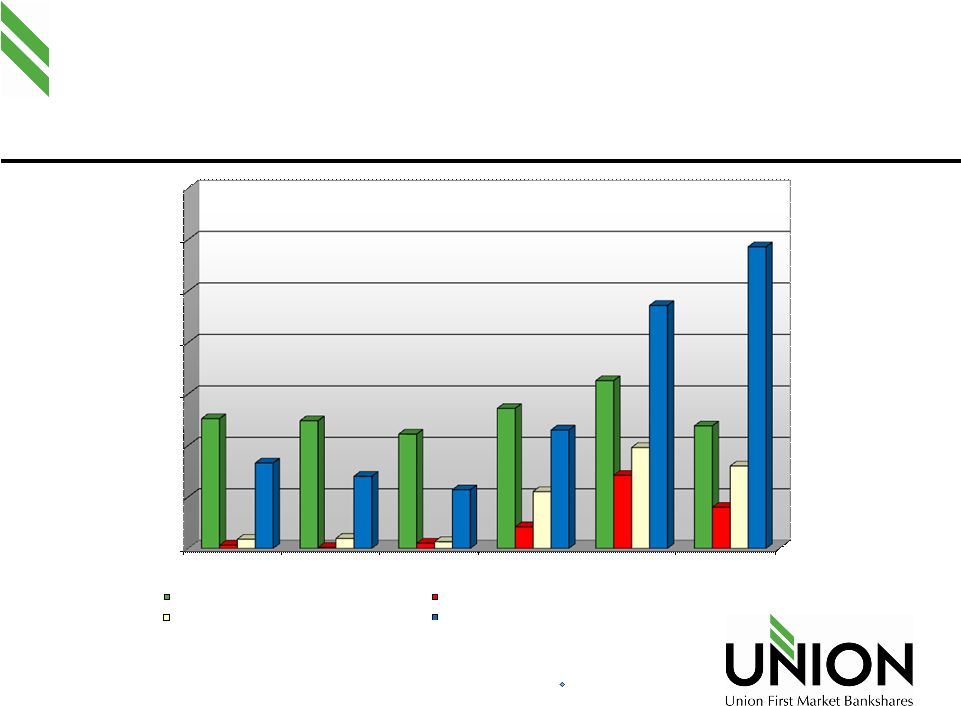
 $0
$500,000
$1,000,000
$1,500,000
$2,000,000
$2,500,000
$3,000,000
$3,500,000
$4,000,000
2004
2005
2006
2007
2008
2009
2010 Q1
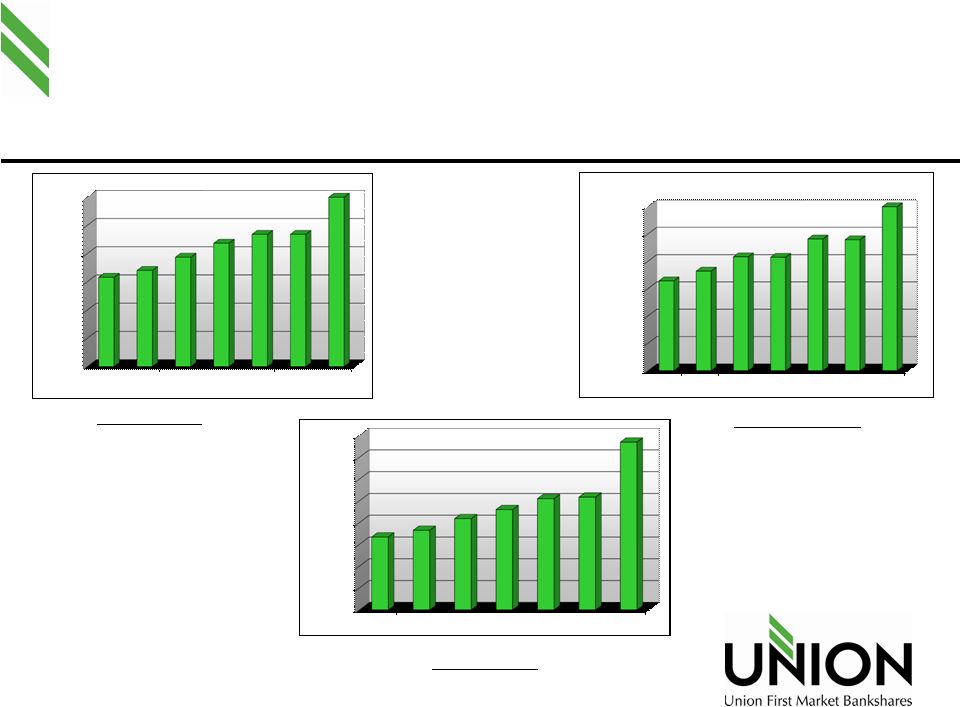
$1,672,210
$1,824,958
$2,092,891
$2,301,397
$2,551,932
$2,587,272
$3,849,699
$0
$400,000
$800,000
$1,200,000
$1,600,000
$2,000,000
$2,400,000
2004
2005
2006
2007
2008
2009
2010 Q1
$1,314,317
$1,456,515
$1,665,908
$1,659,578
$1,926,999
$1,916,364
$3,072,015
$0
$400,000
$800,000
$1,200,000
$1,600,000
$2,000,000
$2,400,000
2004
2005
2006
2007
2008
2009
2010 Q1
$1,264,841
$1,362,254
$1,549,445
$1,747,820
$1,874,088
$1,874,224
$2,850,166
Strong Balance Sheet Growth
Assets
($M)
Deposits
($M)
Loans
($M)
14 |
 Investment Portfolio Highlights
Total Portfolio is $529 MM or
13.8% of assets
Did not invest in
Pooled TRUPs
Data as of Q1 2010
Investment Portfolio
% of Portfolio
U.S. government and agency securities
2.3%
Obligations of states and political subdivisions
26.0%
Corporate and other bonds
3.0%
Mortgage-backed securities
63.7%
Federal Reserve Bank stock -restricted
0.7%
Federal Home Loan Bank stock -restricted
4.2%
Other securities
0.1%
Total securities
100.0%
15 |
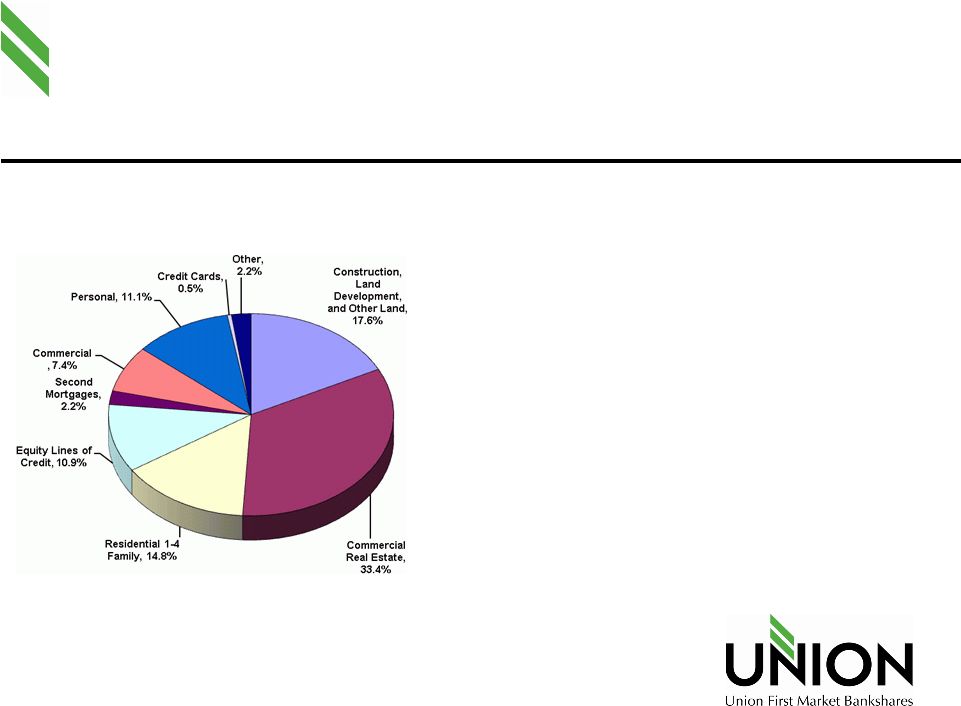 Loan Composition Q1 2010
Loan Portfolio by Type
3/31/2010
$
%
Construction, Land Development, and Other Land
$500,909
17.6%
Commercial Real Estate
$951,387
33.4%
Residential 1-4 Family
$421,138
14.8%
Equity Lines of Credit
$309,765
10.9%
Second Mortgages
$62,762
2.2%
Commercial
$211,663
7.4%
Personal
$315,750
11.1%
Credit Cards
$13,615
0.5%
Other
$63,177
2.2%
Gross Loans
$2,850,166
100.0%
16 |
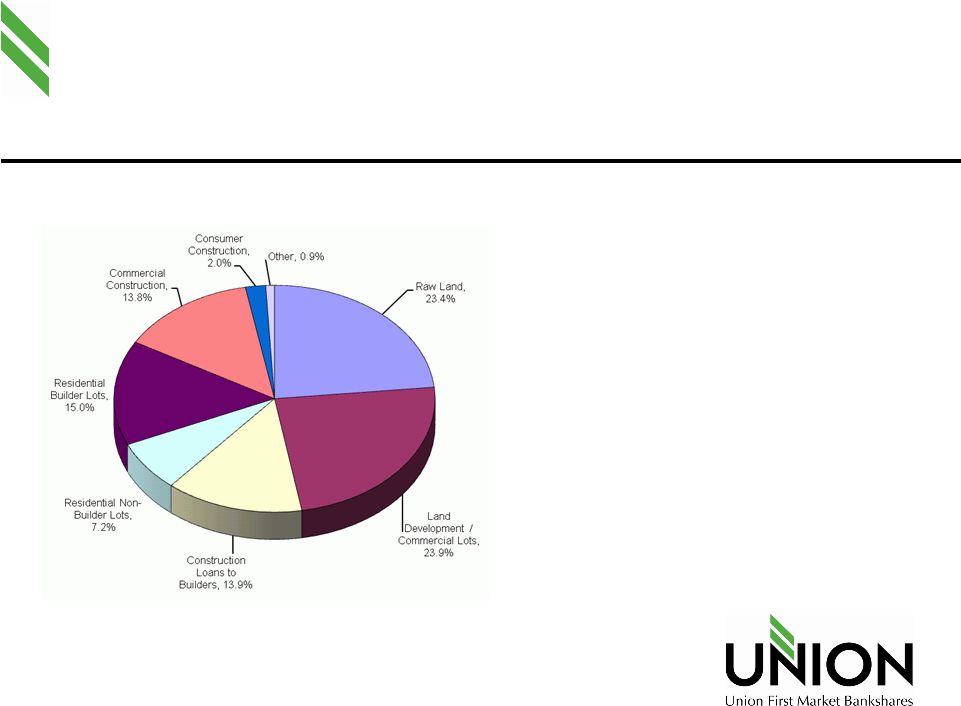 Loan Composition Q1
2010 Construction & Development
3/31/2010
$
%
Raw Land
$117.1
23.4%
Land Development / Commercial Lots
$119.7
23.9%
Construction Loans to Builders
$69.4
13.9%
Residential Non-Builder Lots
$36.2
7.2%
Residential Builder Lots
$74.9
15.0%
Commercial Construction
$69.0
13.8%
Consumer Construction
$10.2
2.0%
Other (including loan settlement)
$4.4
0.9%
$500.9
100.0%
17 |
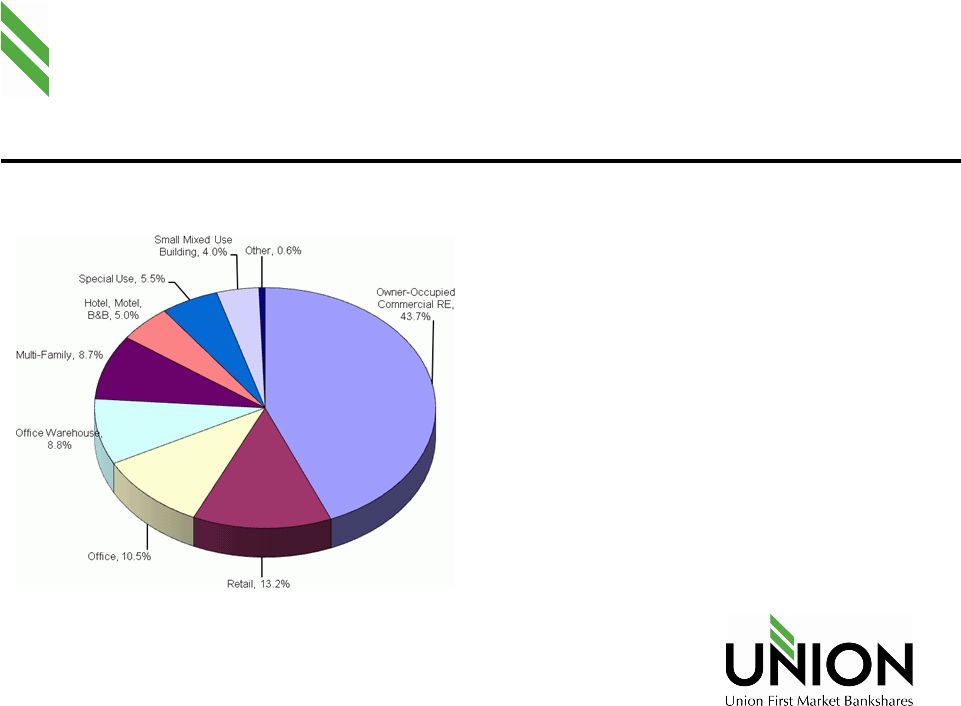 Loan Composition Q1 2010
Commercial Real Estate by Type
3/31/2010
$
%
Owner-Occupied Commercial RE
$415.7
43.7%
Retail
$125.4
13.2%
Office
$99.7
10.5%
Office Warehouse
$84.1
8.8%
Multi-Family
$83.2
8.7%
Hotel, Motel, B&B
$47.5
5.0%
Special Use
$52.1
5.5%
Small Mixed Use Building
$38.1
4.0%
Other
$5.6
0.6%
$951.4
100.0%
18 |
 Asset Quality
0.00%
0.50%
1.00%
1.50%
2.00%
2.50%
3.00%
3.50%
2005
2006
2007
2008
2009
2010 Q1
1.26%
1.24%
1.11%
1.36%
1.63%
1.19%
0.03%
0.01%
0.05%
0.21%
0.71%
0.40%
0.09%
0.10%
0.06%
0.55%
0.98%
0.80%
0.83%
0.70%
0.57%
1.15%
2.36%
2.93%
Allowance to Loans
Charge-offs to Avg Loans, Net
Provision for loan losses as % of average loans
NPAs / Loans + OREO
Annualized
19 |
 NPAs
by Type Q1 2010
Non-Performing Assets by Type
3/31/2010
$
%
Construction and Land Development
$21.9
34.5%
Commercial
$7.0
11.0%
Commercial Non-Owner Occupied
$2.3
3.6%
Commercial Owner Occupied
$5.3
8.4%
Consumer
$1.3
2.1%
OREO
$23.6
37.2%
OREO / Real Estate Investment
$1.5
2.4%
Other
$0.5
0.8%
$63.4
100.0%
20 |
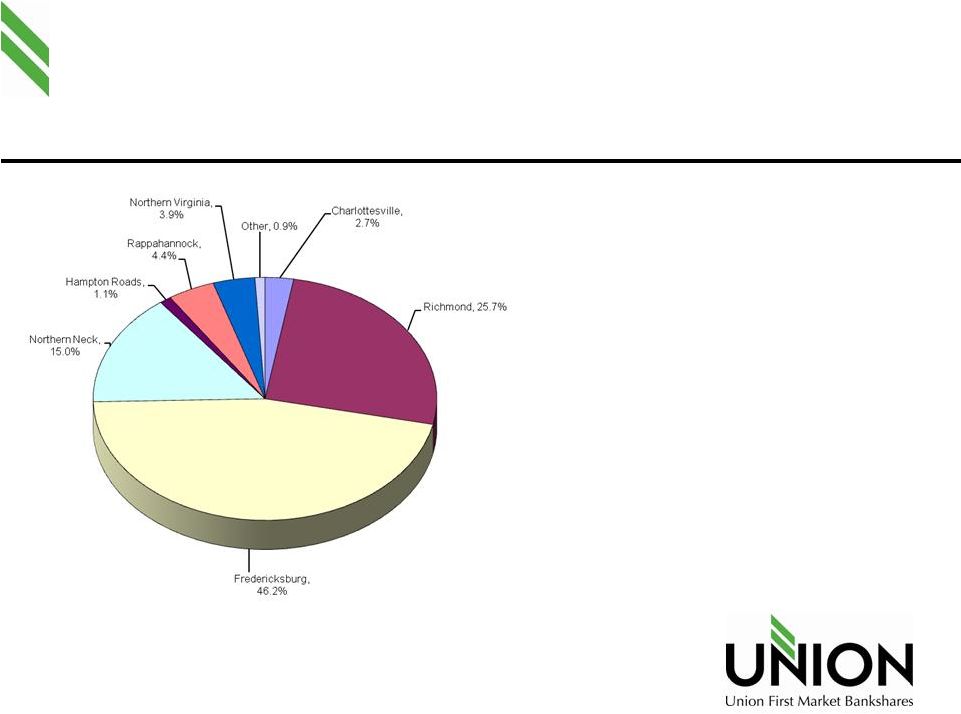 NPAs
by Market Q1 2010
Non-Performing Assets by Market
3/31/2010 *
$
%
Charlottesville
$1.7
2.7%
Richmond
$16.3
25.7%
Fredericksburg
$29.3
46.2%
Northern Neck
$9.5
15.0%
Hampton Roads
$0.7
1.1%
Rappahannock
$2.8
4.4%
Northern Virginia
$2.5
3.9%
Other
$0.6
0.9%
$63.4
100.0%
21 |
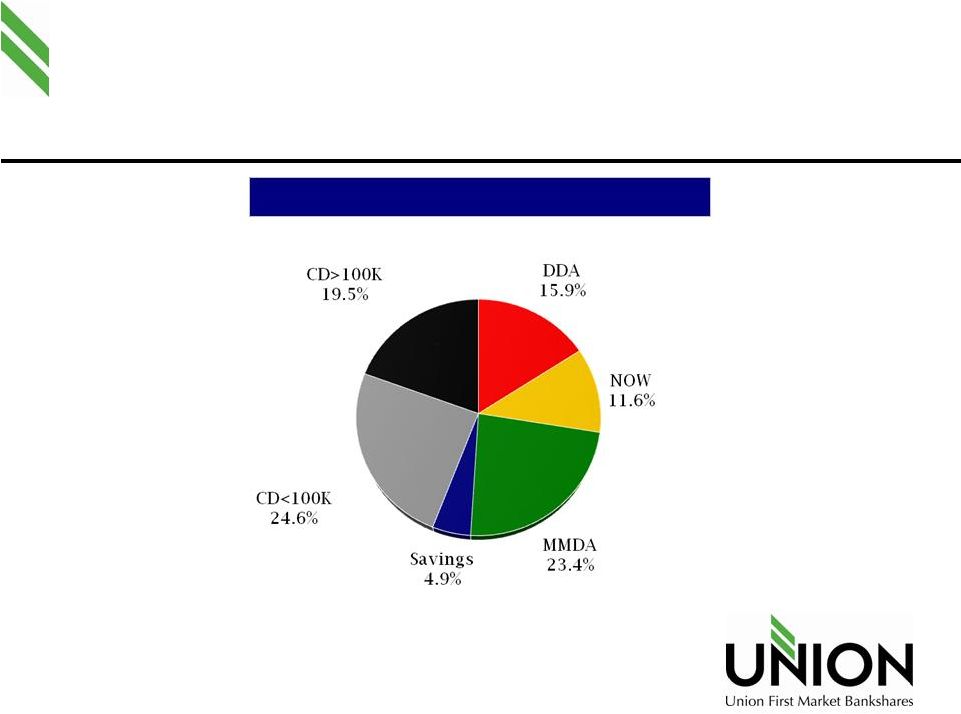 Q1 2010
Deposit Composition
22 |
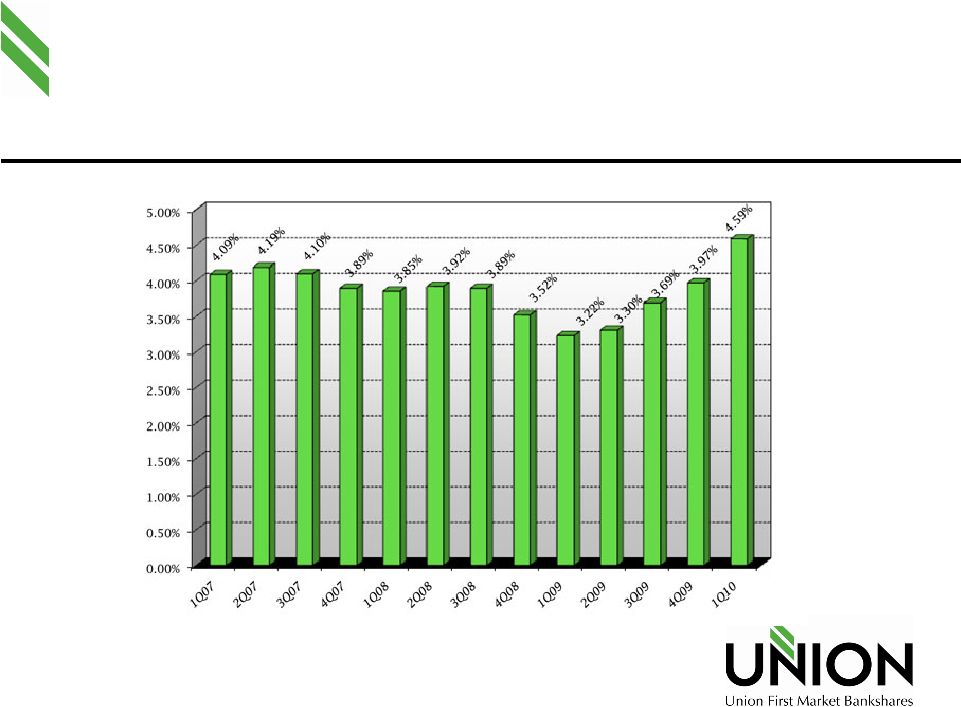 Net Interest Margin
(1) 4.22% excluding fair value accounting accretion/amortization
23
(1) |
 First Market Update |
 First Market Bank Update
Closed February 1, 2010
Two Branches Closed March, 2010
Data Merge Completed March, 2010
25 |
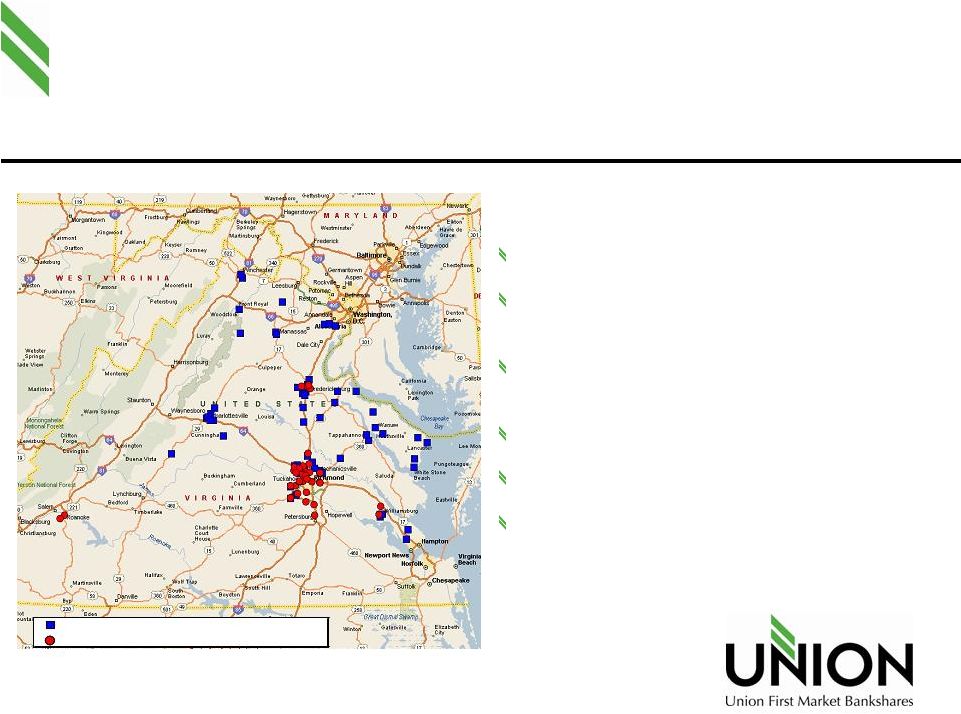 Combined Franchise
Largest community bank in Virginia
$3.85 billion Mid-Atlantic franchise with strong
presence in high growth Virginia markets
Moves
Union
from
11
th
to
6
th
in
deposit
market
share
in Virginia;
from
8
th
to
5
th
in
the
Richmond
MSA
Exceptional management with highly regarded Board
Complementary strengths and identifiable synergies
Accretive to earnings in 2010
26
Union Bankshares
Corporation (58 Branches)
First Market Bank, FSB (39 Branches) |
 Transaction
Detail 27
(1) Capital Purchase Program / Troubled Asset Relief Program funds were
not used in this transaction (2) To include costs associated with
overlapping branches and other duplicative functions,
managed through normal attrition and retirement as much as possible
Consideration:
(1)
100% Common Stock
Preferred Shares:
First Market’s outstanding $10.0 million 9.0% preferred shares
converted into common equity
Shares Issued:
Common Shareholders:
6.7 million shares
Preferred Shareholders:
776 thousand shares
Post Transaction Ownership:
Former Union Shareholders:
71.2%
Former First Market Shareholders:
28.8
Cost Savings:
(2)
Approximately 9.0% of the combined expense base
Estimated Deal Charges
$8.0 million after-tax |
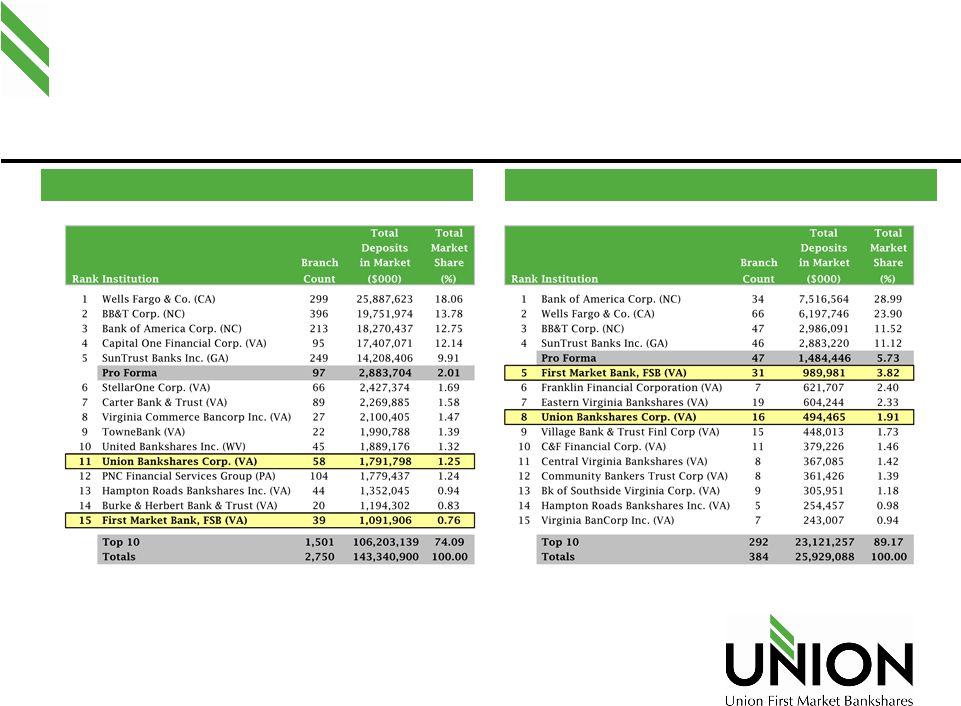 Pro Forma Deposit
Market Share Virginia Market Share
Richmond MSA Market Share
28
Source: SNL Financial
Deposit data as of 6/30/2008; pro forma for pending and recently
completed acquisitions |
 2010 Outlook/Priorities |
 2010 Outlook
Uncertain/slow economic recovery
Residential real estate exposure will
continue to impact asset quality
Interest rates expected to remain low until
late 2010
Loan demand sluggish
Deposits
stable
-
few
higher
rate
alternatives
30 |
 2010 Priorities
Increased Net Income
Continued Focus on Credit Quality
Effective Integration of First Market Bank
Deposit Retention
Achievement of Cost Saves
Market Share Growth
Take advantage of market opportunities
Redeem First Market Bank US Treasury
Preferred Stock
31 |
 Market Opportunity
Growth in lending relationships
Hiring relationship teams
Synergies
32 |
 Acquisition Blueprint
Good Demographics / Growth Market OR …Unique Product /
Service (e.g. Trust, Wealth Management)
Management Retention
Thorough Due Diligence Process
Low Integration Risk
EPS Accretive
Tangible Common Equity to Assets above 6.0%
33 |
 Summary
Attractive branch footprint in growth
markets that will recover early
Proven financial performance
Experienced management team
Proven acquirer and integrator
34 |
 Thank You! |