 Investor Presentation July 2009 Exhibit 99.2 |
 Investor Presentation July 2009 Exhibit 99.2 |
 2 Forward Looking Information Certain statements in this report may constitute “forward-looking statements” within the meaning of the Private Securities Litigation Reform Act of 1995. Forward-looking
statements are statements that include projections, predictions,
expectations or beliefs about future events or results or otherwise and are not statements of historical fact. Such statements are often characterized
by the use of qualified words (and their derivatives) such as “expect,” “believe,” “estimate,” “plan,” “project,” “anticipate” or other statements concerning opinions or judgment of the Company and its management about
future events. Although the Company believes that its
expectations with respect to forward-looking statements are based upon reasonable assumptions within the bounds of its existing knowledge of its
business and operations, there can be no assurance that actual
results, performance or achievements of the Company will not differ materially from any future results, performance or achievements expressed or
implied by such forward- looking statements. Actual future results and trends may differ materially from historical results or those anticipated depending on a variety of factors, including, but not limited
to, the effects of and changes in: general economic conditions,
the interest rate environment, legislative and regulatory requirements, competitive pressures, new products and delivery systems, inflation, changes
in the stock and bond markets, technology, and consumer spending
and savings habits. The Company does not update any forward- looking statements that may be made from time to time by or on behalf of the
Company. |
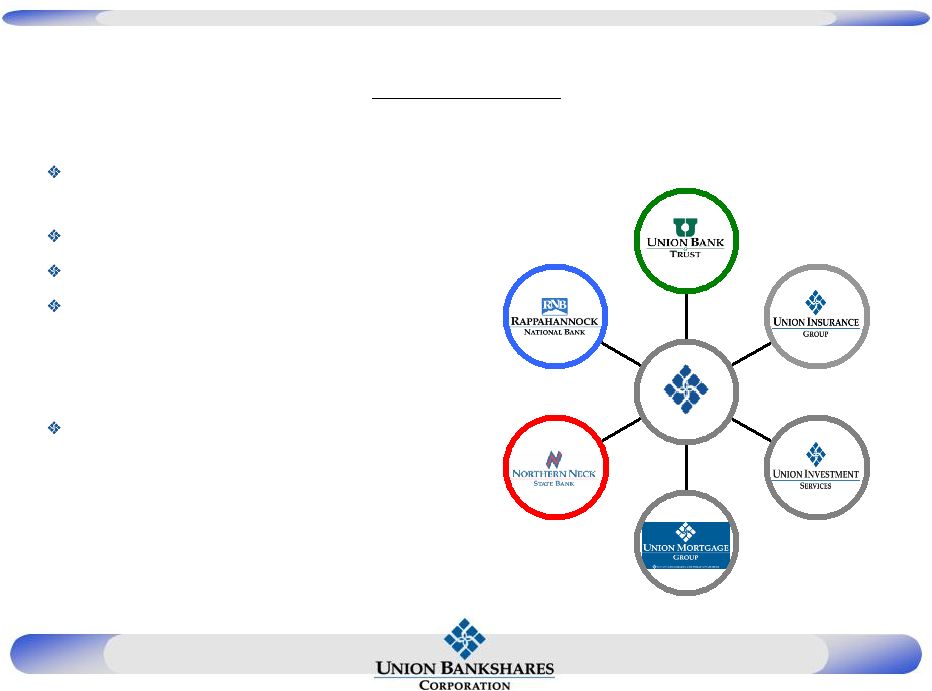 3 Overview One of the Largest Virginia-Based Financial Services Organization Holding Company formed in 1993 Assets of $2.6 Billion Comprehensive financial services provider offering: banking, mortgage, investment, brokerage and insurance Proven merger integrator |
 4 “Helping People Find Financial Solutions” Purpose Statement |
 5 Values Customer Focus Knowledge Integrity & Trust Respect Partnership |
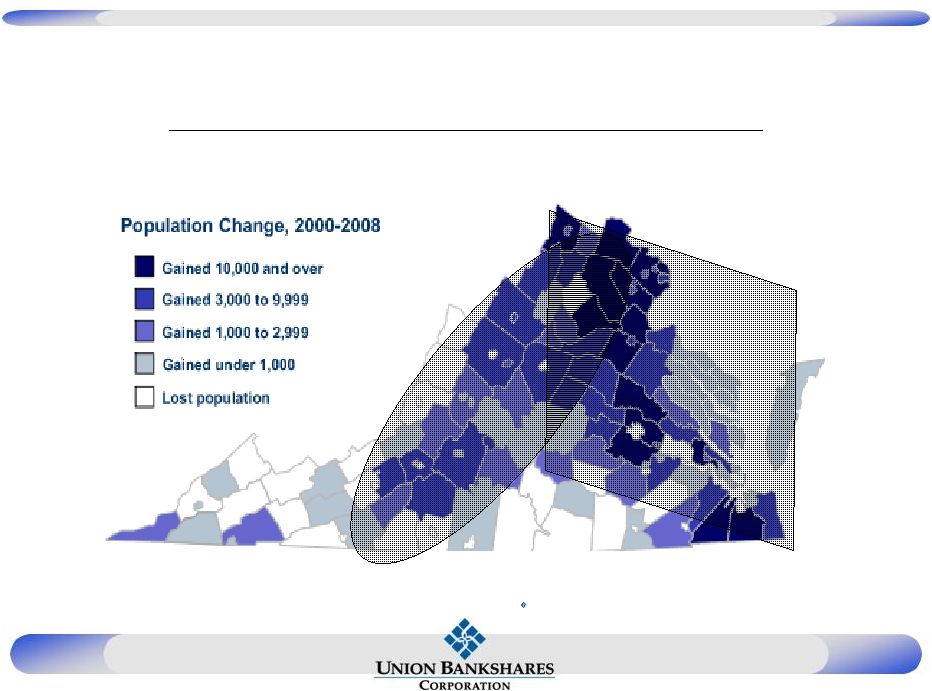   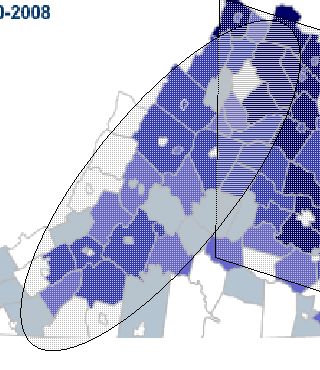 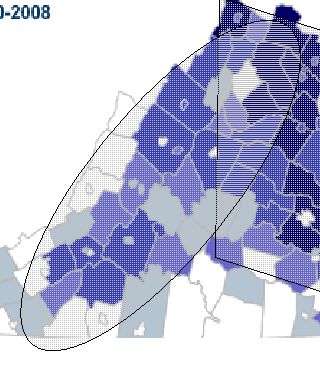 6 Virginia Population Expansion Source: Weldon Cooper Center, UVA |
 7 Experienced Leadership Varied Backgrounds Experienced Market Disruptions Problem solvers Gray Hair |
 8 Experienced Management Team 488 27 10 53 Senior Leadership Team (18) (includes Exec Mgmt Team) Average 144 29 13 54 Executive Management Team (5) Average Total Years in Banking Yrs in Pos Age |
 Financials |
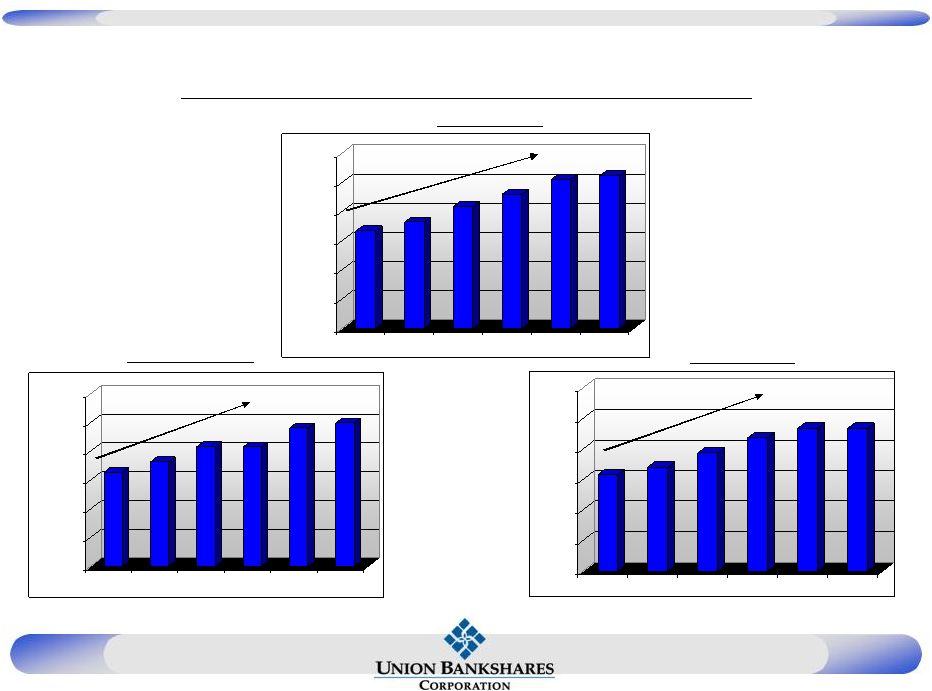 10 $1,264,841 $1,362,254 $1,549,445 $1,747,820 $1,874,088 $1,871,506 $0 $400,000 $800,000 $1,200,000 $1,600,000 $2,000,000 $2,400,000 2004 2005 2006 2007 2008 2009 Q2 Strong Balance Sheet Growth $1,672,210 $1,824,958 $2,092,891 $2,301,397 $2,551,932 $2,615,447 $0 $500,000 $1,000,000 $1,500,000 $2,000,000 $2,500,000 $3,000,000 2004 2005 2006 2007 2008 2009 Q2 $1,314,317 $1,456,515 $1,665,908 $1,659,578 $1,926,999 $1,997,364 $0 $400,000 $800,000 $1,200,000 $1,600,000 $2,000,000 $2,400,000 2004 2005 2006 2007 2008 2009 Q2 CAGRs from year ended 2004-2008 Assets ($M) Deposits ($M) Loans ($M) CAGR = 11.15% CAGR = 10.04% CAGR = 10.33% |
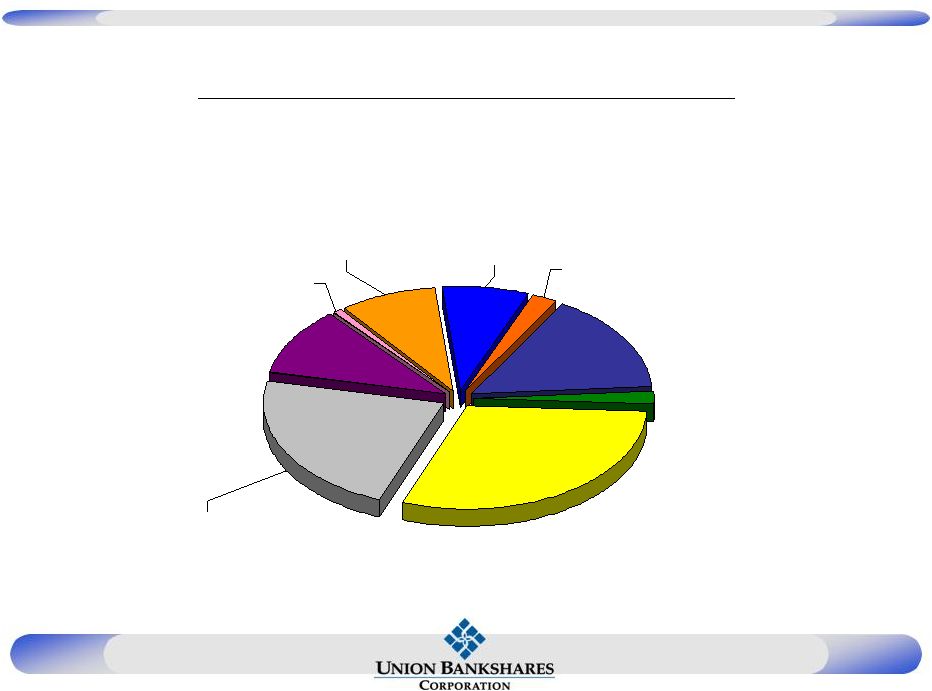 11 Loan Composition Q2 2009 1-4 Family Loans 15.64% Second Mortgages 1.95% Commercial RE Loans 29.82% Other Loans 2.17% Commercial Loans 7.71% Credit Card Loans 0.77% Other Consumer Loans 8.83% Home Equity Loans 10.46% Construction Loans 22.66% |
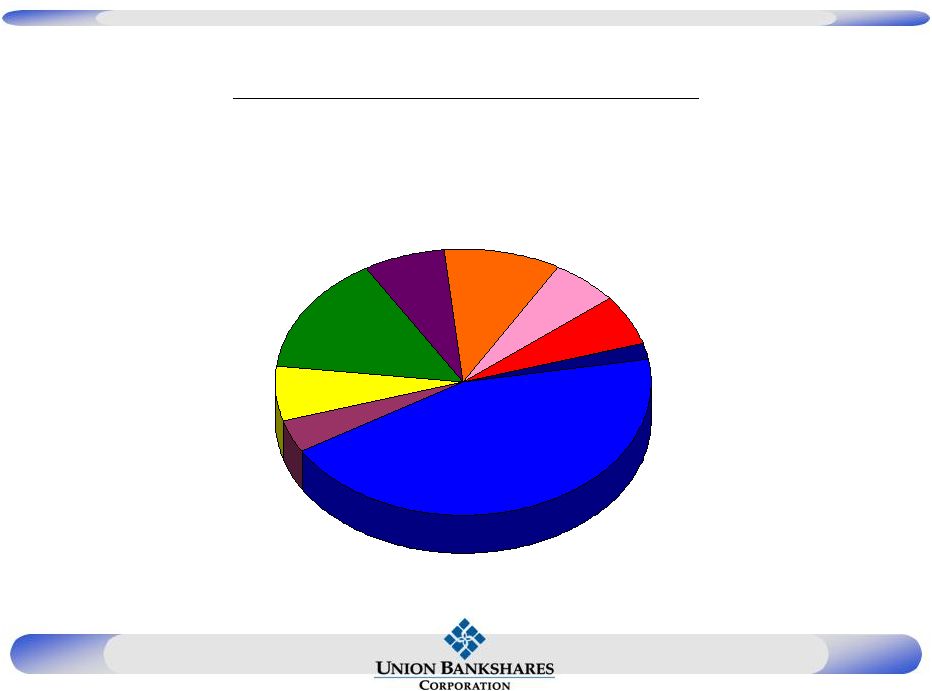 12 Commercial Real Estate Commercial Real Estate Portfolio by Type Small Mixed Use Building, 3.9% Multi Family, 6.8% Retail, 14.3% Office, 7.1% Office Warehouse, 9.9% Hotel, Motel, B&B, 5.8% Special Use, 6.2% Other, 2.0% Owner-Occupied Commercial RE, 44.1% Q2 2009 |
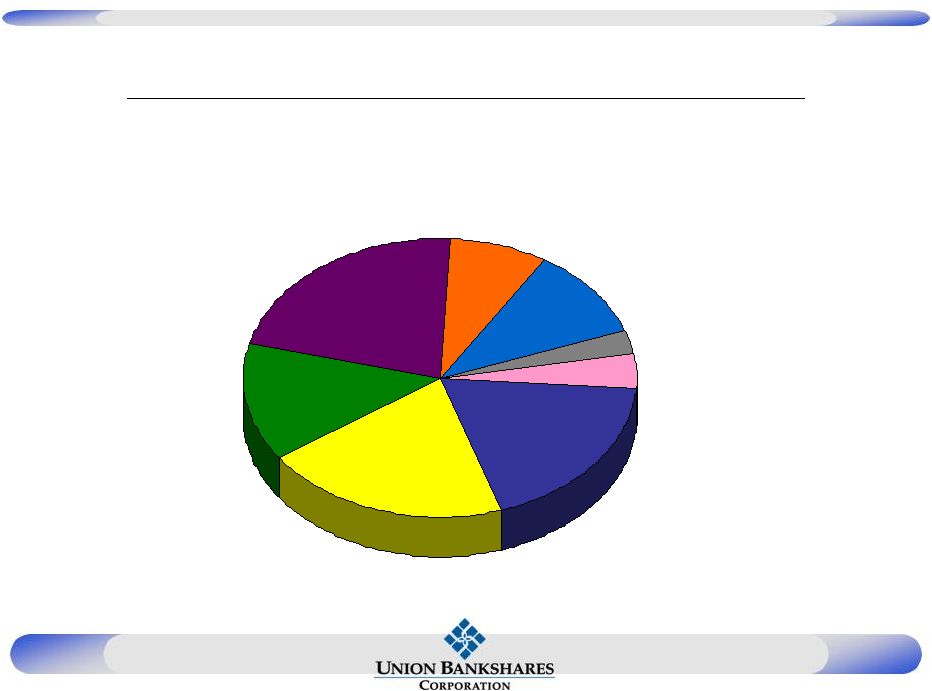 13 Construction & Land Development Q2 2009 Construction, Land Development, and Other Land Loans by Type Raw Land, 20.4% Consumer Construction, 3.9% Other, 2.8% Land Development / Commercial Lots, 18.8% Construction Loans to Builders, 13.6% Residential Builder Lots, 10.4% Residential Non-Builder Lots, 8.1% Commercial Construction, 21.9% |
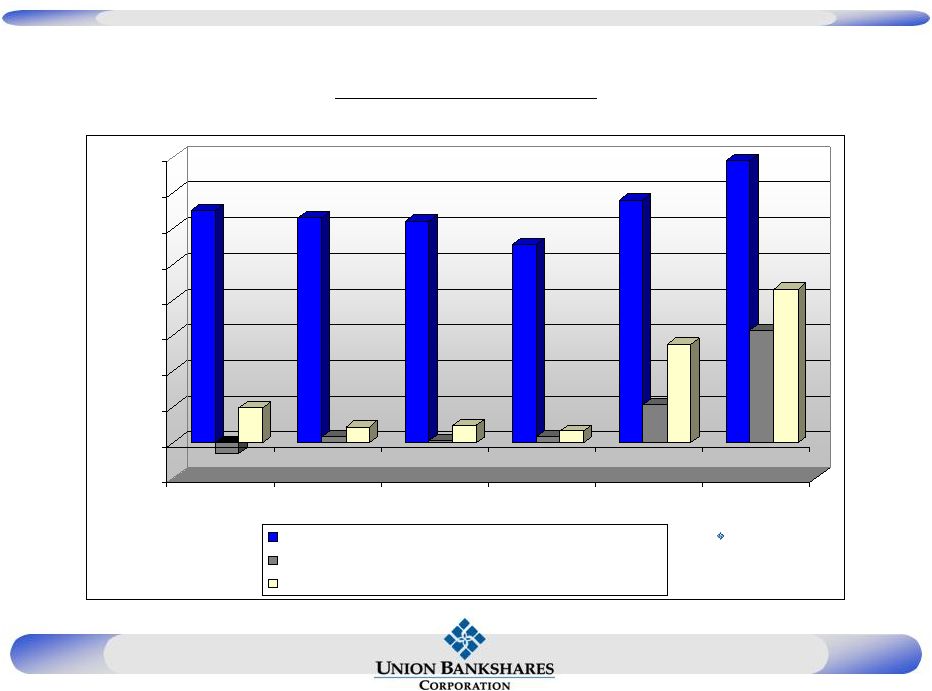 14 1.30% -0.06% 0.19% 1.26% 0.03% 0.09% 1.24% 0.01% 0.10% 1.11% 0.03% 0.06% 1.36% 0.21% 0.55% 1.58% 0.63% 0.86% -0.20% 0.00% 0.20% 0.40% 0.60% 0.80% 1.00% 1.20% 1.40% 1.60% 2004 2005 2006 2007 2008 2009 Q2 Allowance to Loans Charge-offs to Avg Loans, Net Provision for loan losses as % of average loans Asset Quality Annualized |
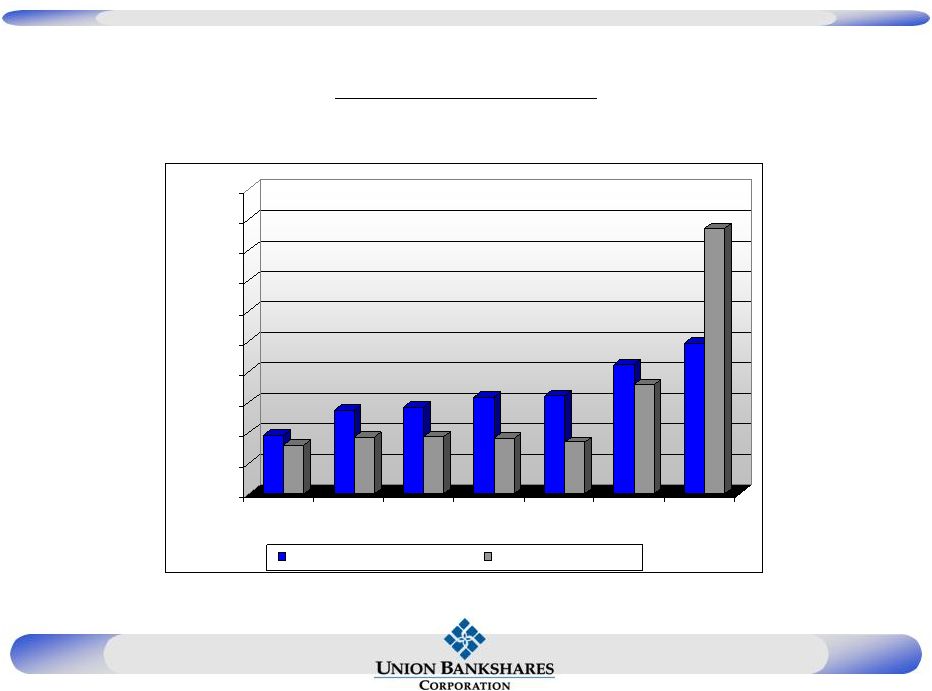 15 Asset Quality $0 $6,000 $12,000 $18,000 $24,000 $30,000 $36,000 $42,000 $48,000 $54,000 $60,000 2003 2004 2005 2006 2007 2008 2009 Q2 Allowance for Loan Losses Nonperforming assets |
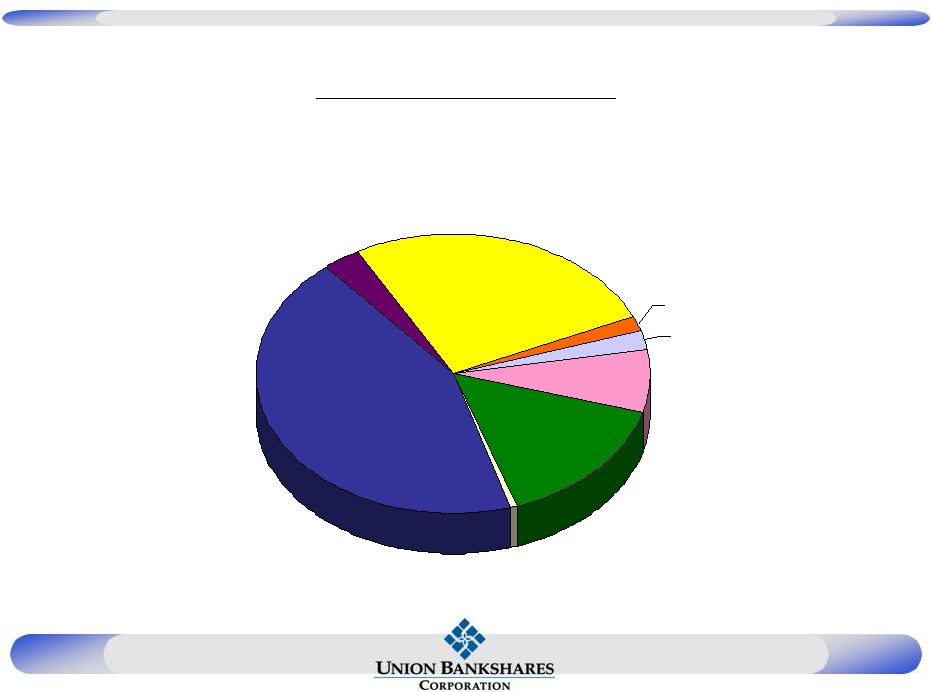 16 NPA’s by Type Q2 2009 NPAs by Type Commercial, 7.3% Commercial Non Owner- Occupied, 15.3% Commercial Owner-Occupied, 0.6% Construction and Land Development, 43.4% Consumer, 3.3% OREO, 26.2% OREO / Real Estate Investment, 1.9% Other, 2.1% |
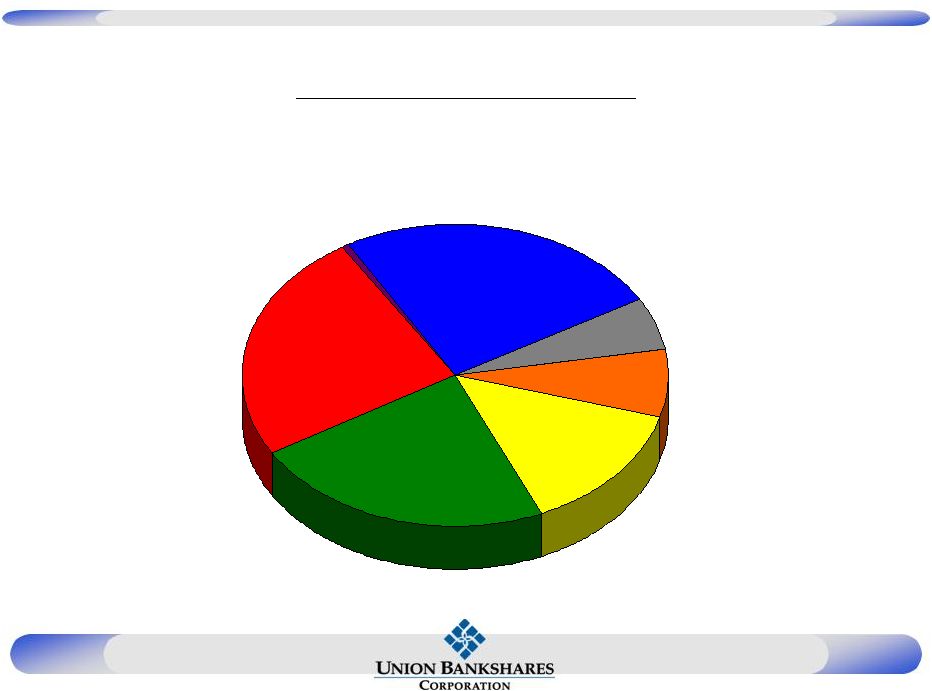 17 NPA’s by Market NPAs by Market Charlottesville, 7.3% Richmond, 14.0% Fredericksburg, 22.9% Northern Neck, 24.7% Hampton Roads, 0.6% Rappahannock, 25.0% Northern Virginia, 5.5% Other, 0.0% Q2 2009 |
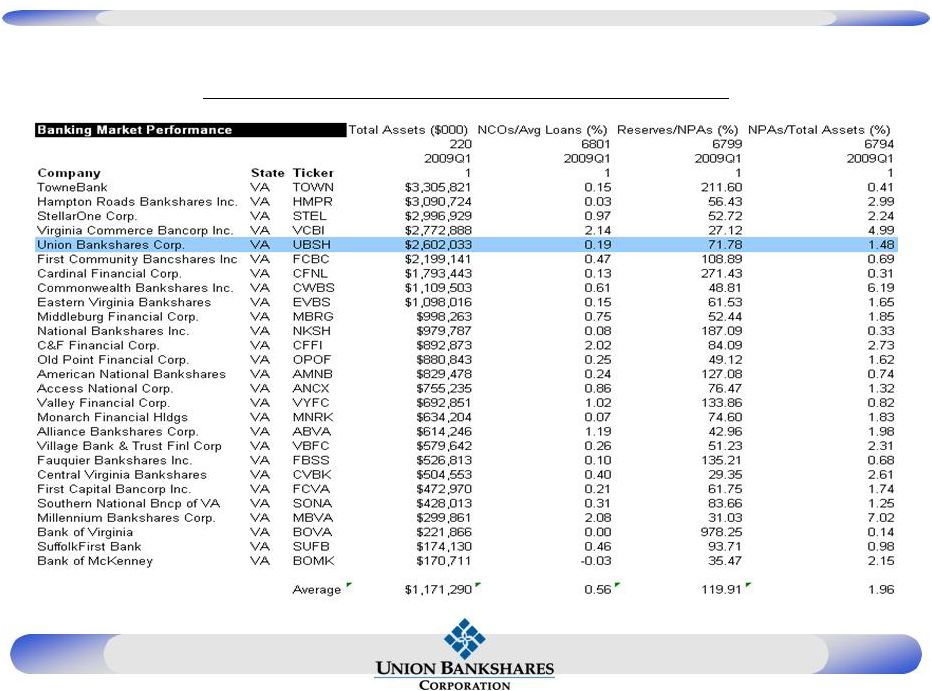 18 Asset Quality vs. VA Peers |
 19 Delinquency Source: SNL 2009 Q1 UBSH Peer Median NCLs/Lns: Tot Real Estate Lns (%) 2.22% 3.77% NCLs/Lns: Const&Dev Lns (%) 5.00% 10.17% NCLs/Lns: Rev 1-4 Fm Lns (%) 0.60% 0.53% NCLs/Lns: Clsd-end 1-4 Fm Lns (%) 1.08% 1.80% NCLs/Lns: Total 1-4 Fm Lns (%) 0.92% 1.46% NCLs/Lns: Multifamily Lns (%) 0.00% 3.42% NCLs/Lns: Farm Lns (%) 0.85% 1.57% NCLs/Lns: Cmcl RE (Nofm/NoRes) (%) 1.70% 1.36% NCLs/Lns: Cmcl RE & Farm Lns (%) 1.66% 1.27% NCLs/Lns: Multifm,Cmcl RE,& Fm (%) 1.56% 1.43% NCLs/Lns: Cred Card Loans (%) 1.38% 0.53% Total Noncurrent Loans/ Loans (%) 2.04% 3.21% Total Noncurrent Loans/ Assets (%) 1.49% 2.37% |
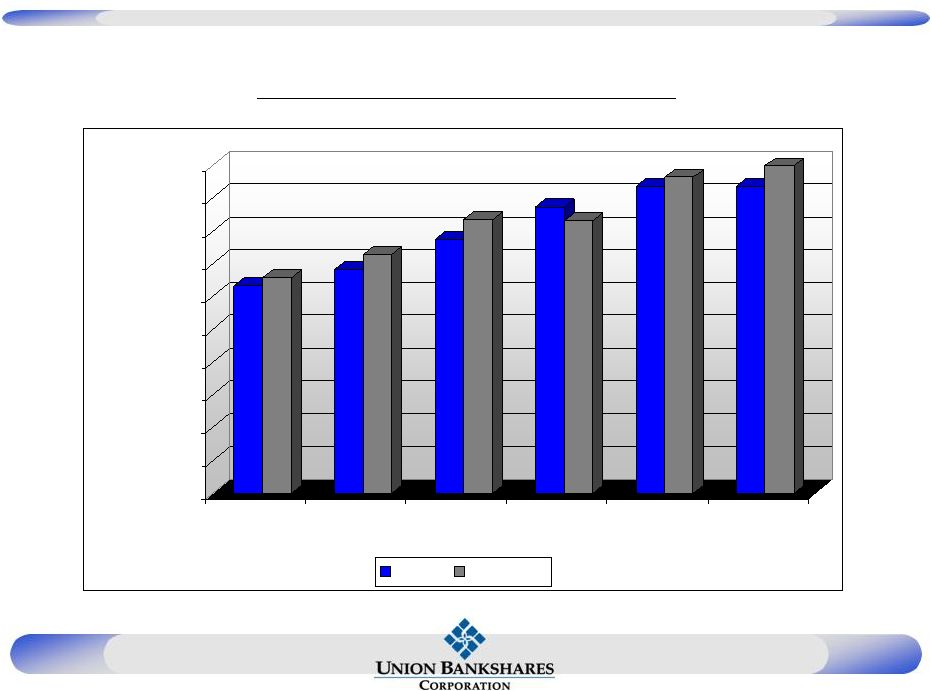 20 Loan/Deposit Growth $0 $200,000 $400,000 $600,000 $800,000 $1,000,000 $1,200,000 $1,400,000 $1,600,000 $1,800,000 $2,000,000 2004 2005 2006 2007 2008 2009 Q2 Loans Deposits |
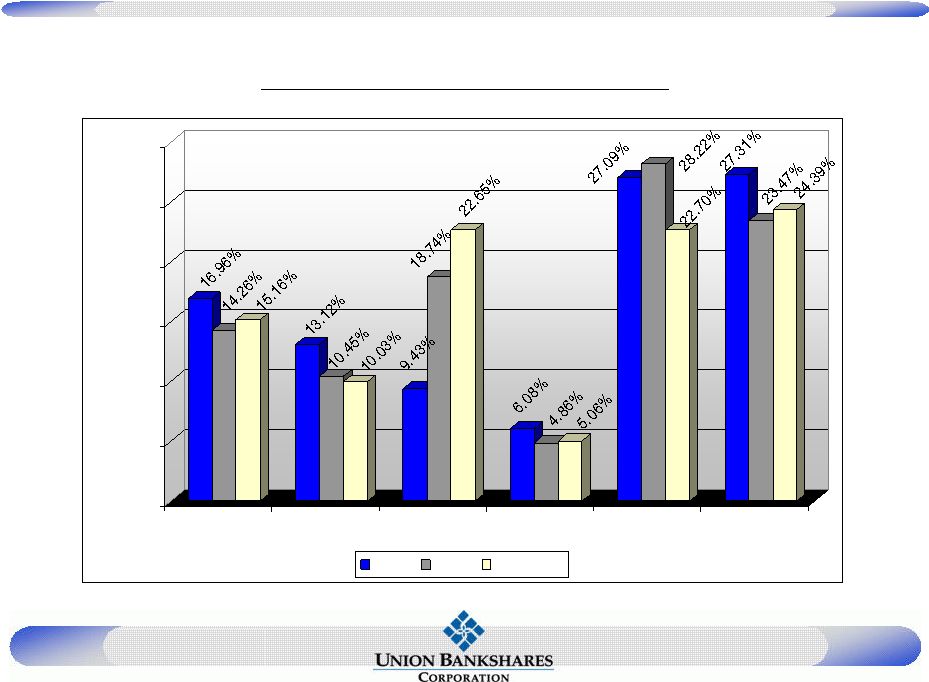 21 Deposit Composition 0.00% 5.00% 10.00% 15.00% 20.00% 25.00% 30.00% DDA NOW MMDA Savings CD<100K CD>100K 2007 2008 2009 Q2 |
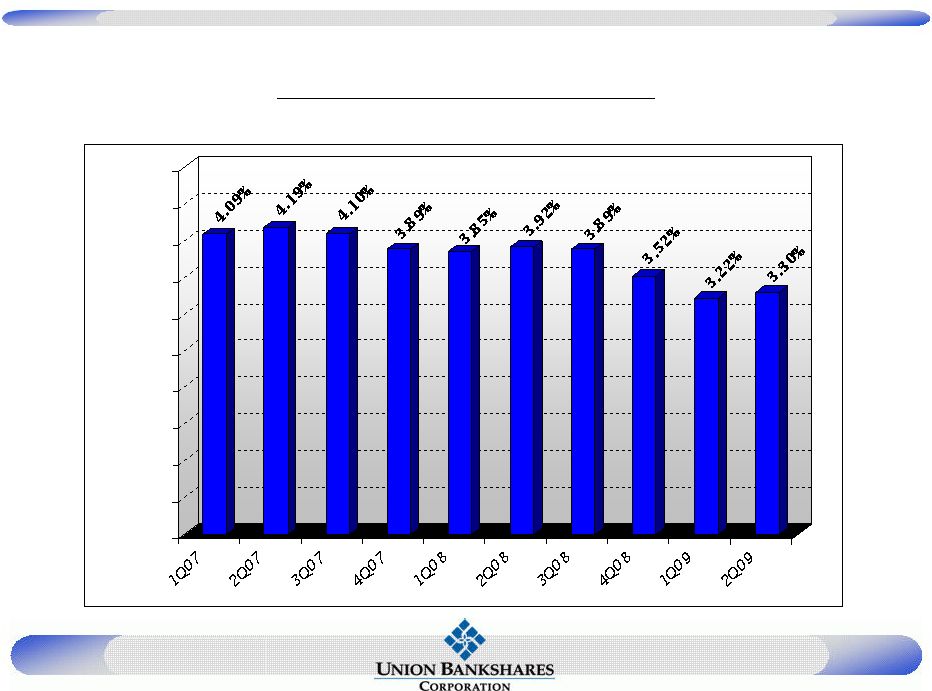 22 Net Interest Margin 0.00% 0.50% 1.00% 1.50% 2.00% 2.50% 3.00% 3.50% 4.00% 4.50% 5.00% |
 23 Net Income - Quarterly $5,148 $5,641 $5,357 $3,610 $3,652 $4,333 $4,255 $2,274 $1,753 $953 $0 $1,000 $2,000 $3,000 $4,000 $5,000 $6,000 2007 Q1 2007 Q2 2007 Q3 2007 Q4 2008 Q1 2008 Q2 2008 Q3 2008 Q4 2009 Q1 2009 Q2 |
 24 Non-Interest Expense less Non-Interest Income/Average Assets 1.86% 1.89% 1.97% 2.24% 2.06% 2.01% 0.00% 0.50% 1.00% 1.50% 2.00% 2.50% 3.00% 2004 2005 2006 2007 2008 2009 Q2 Net Noninterest Expense/AA |
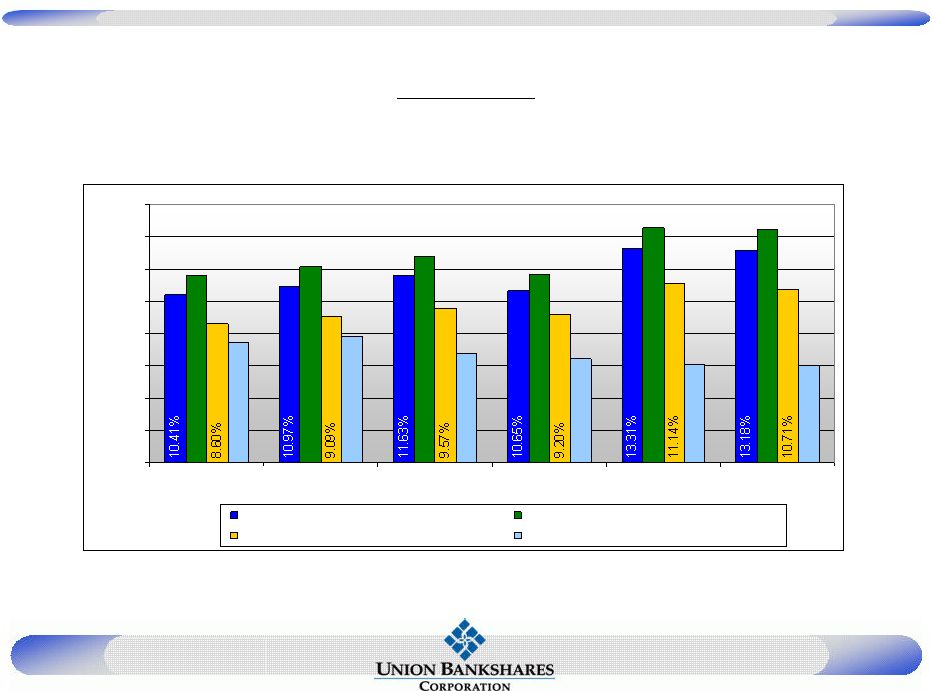 25 Capital 11.63% 12.14% 12.78% 11.67% 14.56% 14.43% 7.48% 7.82% 6.75% 6.45% 6.09% 6.03% 0.00% 2.00% 4.00% 6.00% 8.00% 10.00% 12.00% 14.00% 16.00% 2004 2005 2006 2007 2008 2009 Q1 Tier 1 risk-based capital ratio Total risk-based capital Tier 1 capital to average adjusted total assets Tangible Equity/Tangible Assets |
 26 Stock at a Glance Shares Outstanding 13,595,004 52 Week Trading Range $9.00 - $29.20 Stock Price (7/23/09) $15.95 Market Cap (7/23/09) $216.84M Tangible Book Value Per Share $11.25 P/E (trailing 12 Months) 18.33 |
 Merger Update |
 & Creating Richmond and Central Virginia’s Bank of Choice |
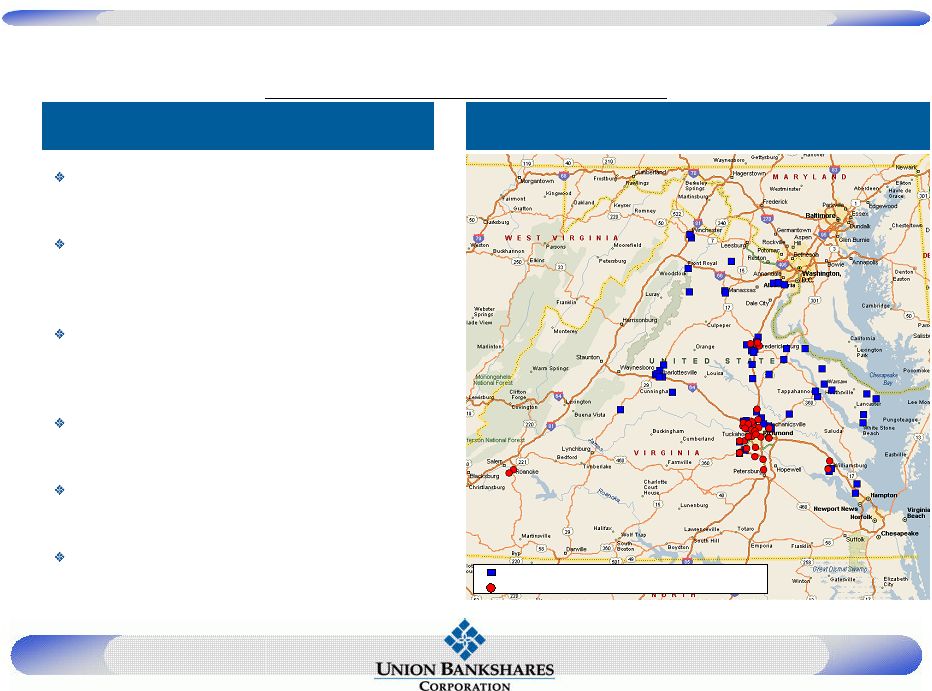 29 Pro Forma Franchise Merger Highlights Pro forma Company becomes the largest community bank in Virginia $4.0 billion in assets Mid-Atlantic franchise with strong presence in high growth Virginia markets Moves UBSH from 11 th to 6 th in deposit market share in Virginia; from 8 th to 5 th in the Richmond MSA Exceptional management with highly regarded Board Complementary strengths and identifiable synergies Accretive to earnings in 2010 Pro Forma Footprint Union Bankshares Corporation (58 Branches) First Market Bank, FSB (39 Branches) |
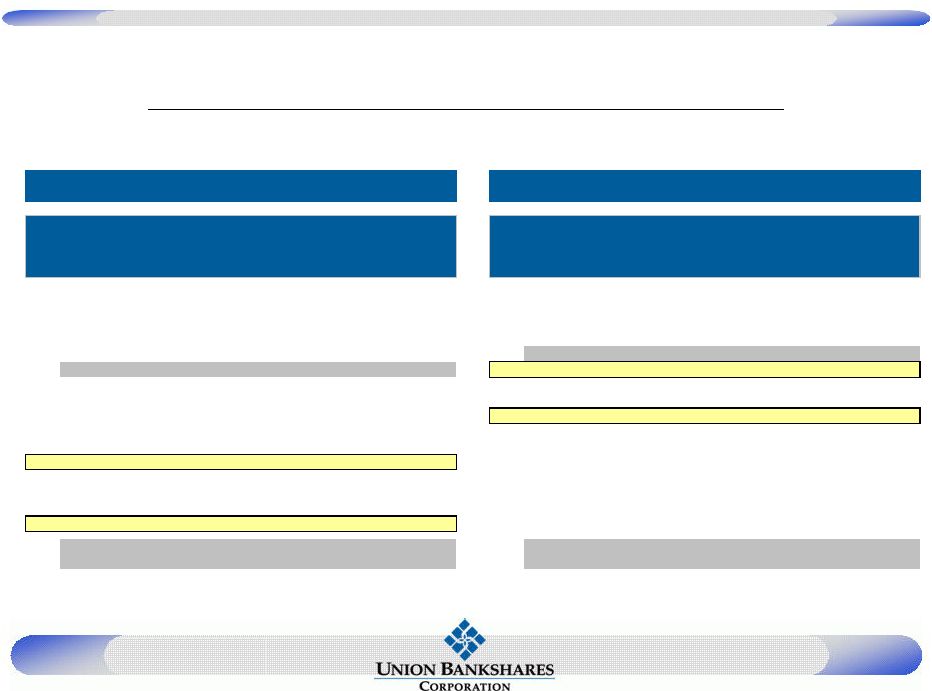 30 Pro Forma Deposit Market Share Virginia Market Share Richmond MSA Market Share Source: SNL Financial Deposit data as of 6/30/2008; pro forma for pending and recently completed acquisitions Total Total Deposits Market Branch in Market Share Rank Institution Count ($000) (%) 1 Wells Fargo & Co. (CA) 299 25,887,623 18.06 2 BB&T Corp. (NC) 396 19,751,974 13.78 3 Bank of America Corp. (NC) 213 18,270,437 12.75 4 Capital One Financial Corp. (VA) 95 17,407,071 12.14 5 SunTrust Banks Inc. (GA) 249 14,208,406 9.91 Pro Forma 97 2,883,704 2.01 6 StellarOne Corp. (VA) 66 2,427,374 1.69 7 Carter Bank & Trust (VA) 89 2,269,885 1.58 8 Virginia Commerce Bancorp Inc. (VA) 27 2,100,405 1.47 9 TowneBank (VA) 22 1,990,788 1.39 10 United Bankshares Inc. (WV) 45 1,889,176 1.32 11 Union Bankshares Corp. (VA) 58 1,791,798 1.25 12 PNC Financial Services Group (PA) 104 1,779,437 1.24 13 Hampton Roads Bankshares Inc. (VA) 44 1,352,045 0.94 14 Burke & Herbert Bank & Trust (VA) 20 1,194,302 0.83 15 First Market Bank, FSB (VA) 39 1,091,906 0.76 Top 10 1,501 106,203,139 74.09 Totals 2,750 143,340,900 100.00 Total Total Deposits Market Branch in Market Share Rank Institution Count ($000) (%) 1 Bank of America Corp. (NC) 34 7,516,564 28.99 2 Wells Fargo & Co. (CA) 66 6,197,746 23.90 3 BB&T Corp. (NC) 47 2,986,091 11.52 4 SunTrust Banks Inc. (GA) 46 2,883,220 11.12 Pro Forma 47 1,484,446 5.73 5 First Market Bank, FSB (VA) 31 989,981 3.82 6 Franklin Financial Corporation (VA) 7 621,707 2.40 7 Eastern Virginia Bankshares (VA) 19 604,244 2.33 8 Union Bankshares Corp. (VA) 16 494,465 1.91 9 Village Bank & Trust Finl Corp (VA) 15 448,013 1.73 10 C&F Financial Corp. (VA) 11 379,226 1.46 11 Central Virginia Bankshares (VA) 8 367,085 1.42 12 Community Bankers Trust Corp (VA) 8 361,426 1.39 13 Bk of Southside Virginia Corp. (VA) 9 305,951 1.18 14 Hampton Roads Bankshares Inc. (VA) 5 254,457 0.98 15 Virginia BanCorp Inc. (VA) 7 243,007 0.94 Top 10 292 23,121,257 89.17 Totals 384 25,929,088 100.00 |
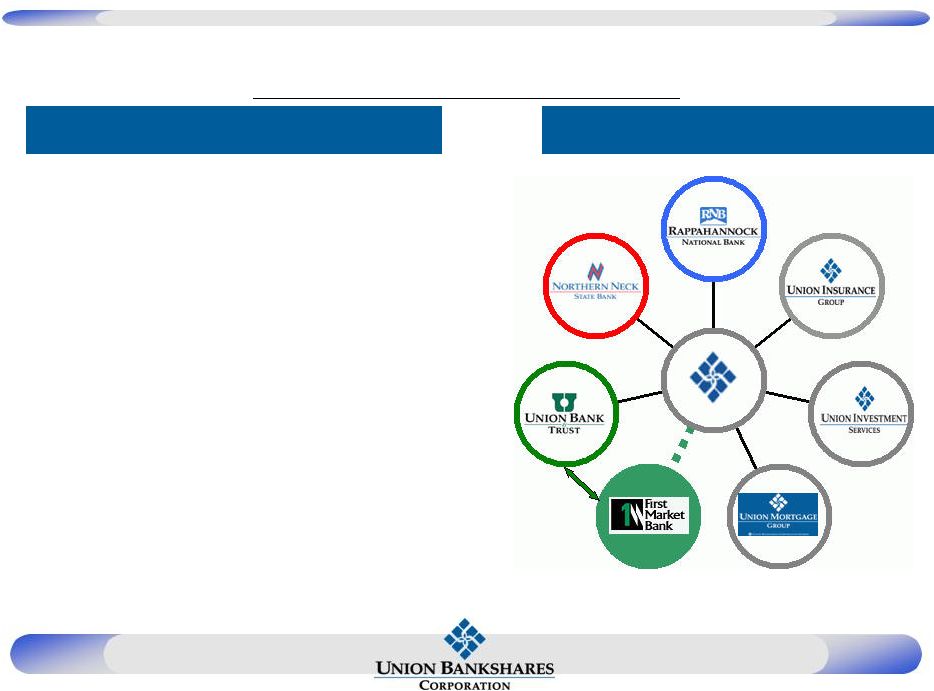 31 Chairman: Ronald L. Hicks (UBSH) Chief Executive Officer:G. William Beale (UBSH) President: David J. Fairchild (FMB) Chief Financial Officer: D. Anthony Peay (UBSH) Chief Banking Officer: John C. Neal (UBSH) * Depends on regulatory, SEC and shareholder approval Transaction Overview Name: Union First Market Bankshares Corporation Headquarters: Richmond, VA Board: Existing UBSH Board plus: James E. Ukrop Steven A. Markel David J. Fairchild Leadership: Targeted Closing Date: * Early 4th Quarter of 2009 Corporate Structure Pro Forma Overview |
 32 th Transaction Detail Consideration: (1) 100% Common Stock Preferred Shares: First Market’s outstanding $10.0 million 9.0% preferred shares will be
converted into common equity Shares to be Issued: Common Shareholders: 6.7 million shares Preferred Shareholders: 703 thousand shares (2) Pre-Conversion Post-Conversion Pro Forma Ownership: of Preferred of Preferred Current Union Shareholders: 67.0% 64.8%
Current First Market Shareholders: 33.0 35.2 Value of First Market Shares: $105.4 million (Assumes $14.23 stock price for UBSH (2) ) Cost Savings: (3) Approximately 9.0% of the combined expense base Phase In: 100% in 2010 Estimated Deal Charges $8.0 million after-tax (1) Capital Purchase Program / Troubled Asset Relief Program funds were not used in this
transaction (2) Estimated conversion shares and deal value as of pre-market announcement on March 30 , 2009; actual shares issued in preferred conversion are based on the 10-day average trading price near close
(as defined in the Merger Agreement), provided that it shall not be more than $16.89 nor less than $12.89 (3) To include costs associated with overlapping branches and other duplicative functions, managed through normal attrition and retirement as much as possible
|
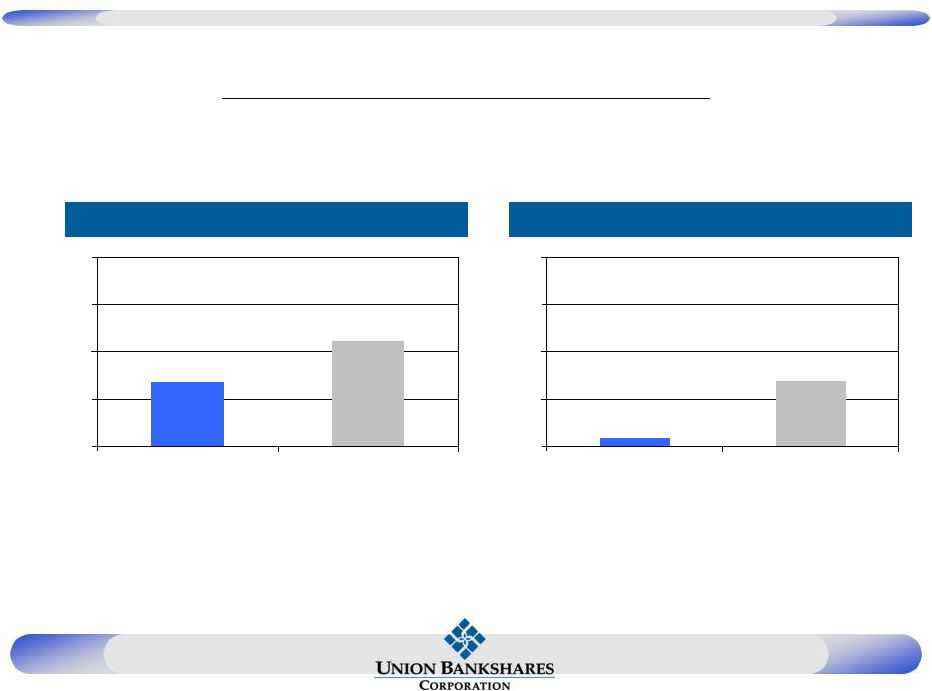 33 Comparable Acquisitions 118 161 50 100 150 200 250 UBSH / First Market Comparable Transactions 1.7 13.8 0.0 10.0 20.0 30.0 40.0 UBSH / First Market Comparable Transactions Price / Tangible Book Value (1) (%) Core Deposit Premium (2) (%) Source: SNL Financial and company filings Comparable transactions do not include merger of equals (1) Based on First Market’s tangible equity of $89.4 million as of 12/31/2008 (2) Core deposits include total deposits less jumbo certificates of deposits Comparable transactions include all bank and thrift transactions in Maryland, Virginia and North Carolina
announced after 7/1/2007 with deal values between $20 million and $500 million
|
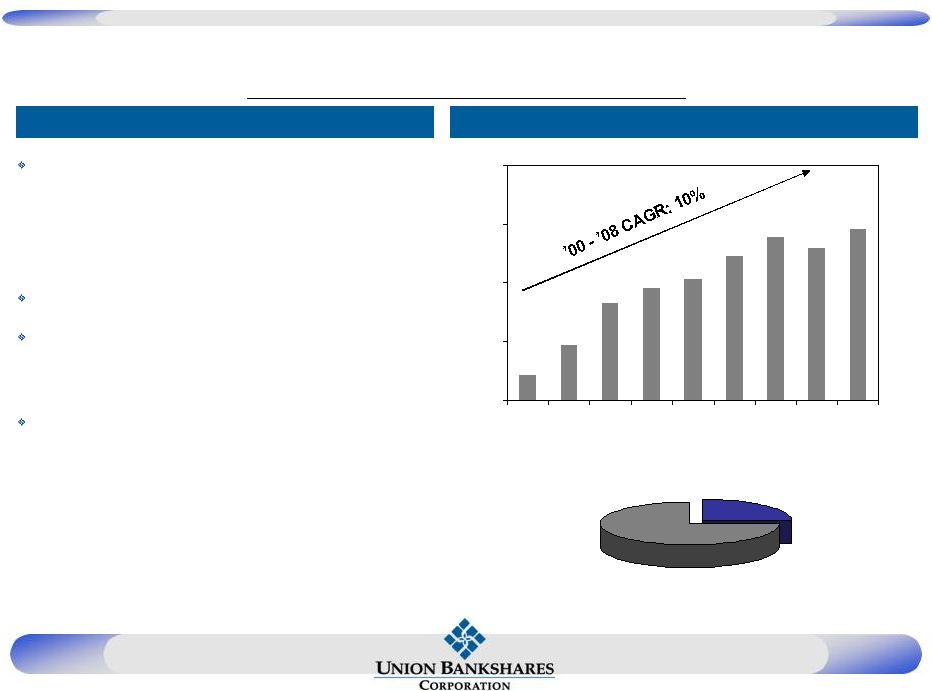 34 Virginia’s 11 largest community bank – Assets: $1.3 billion – Gross Loans: $1.0 billion – Deposits: $1.1 billion – Tangible Common Equity: $79.4 million Successful partnership with Ukrop’s Super Markets, Inc. 39 branches – 13 traditional branches – 26 supermarket branches Comprehensive financial services provider – Banking – Mortgage – Investment – Brokerage – Trust – Insurance First Market Overview Deposits Over Time ($mm) First Market Overview Consumer Deposits 75.0% Business Deposits 25.0% $510 $634 $815 $875 $916 $1,011 $1,095 $1,047 $1,128 $400 $650 $900 $1,150 $1,400 2000 2001 2002 2003 2004 2005 2006 2007 2008 th |
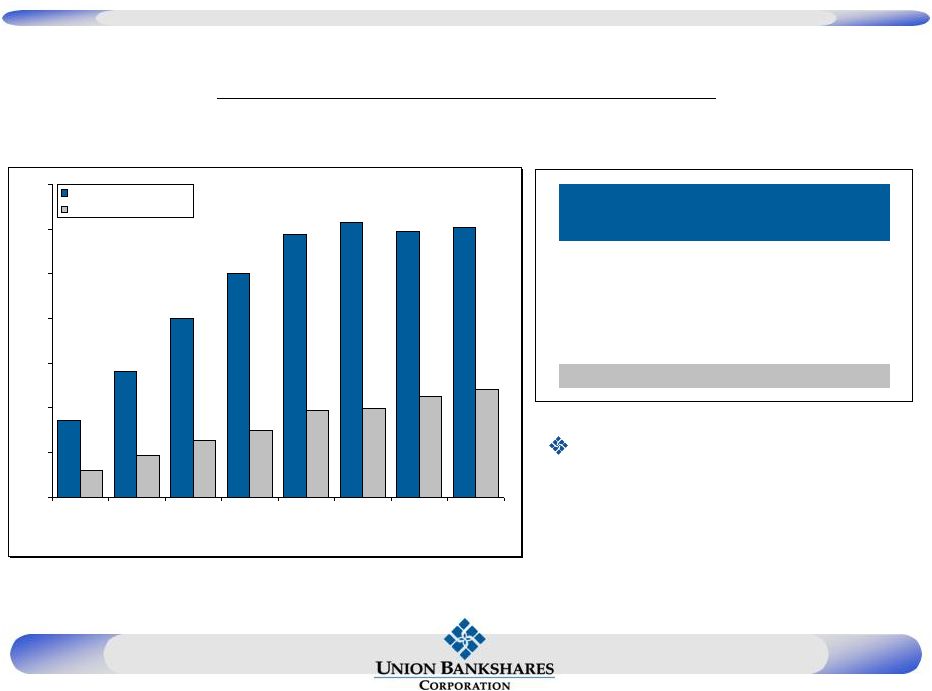 35 Supermarket Relationship • Successful supermarket partnership generates retail customer relationships
Median Aggregate Deposits of In-Store Locations ($MM) In-Store Locations Open 5+ Years* In-Store locations generate over 75% of retail deposit accounts $30.7 $2.9 $4.7 $6.3 $7.4 $9.7 $30.1 $29.7 $14.1 $20.0 $25.0 $29.5 $8.6 $10.0 $12.1 $11.3 $0.0 $5.0 $10.0 $15.0 $20.0 $25.0 $30.0 $35.0 1 2 3 4 5 6 7 8 First Market Comparable Locations Years Open Branch Deposit Median Size Range Deposits Quartile ($MM) ($MM) 1 $21.0 - $114.3 $28.6 2 $12.9 - $21.0 $16.5 3 $7.2 - $12.9 $9.9 4 $1.0 - $7.2 $4.3 First Market $15.3 - $40.3 $25.5 Source: SNL Financial “Comparable locations”
include 71 full-service branches in high-end grocery stores Medians calculated at
June 30 each year First Market deposit range and current deposits as of 12/31/08 *Includes 4,040 in-store locations in the U.S. open over 5 years |
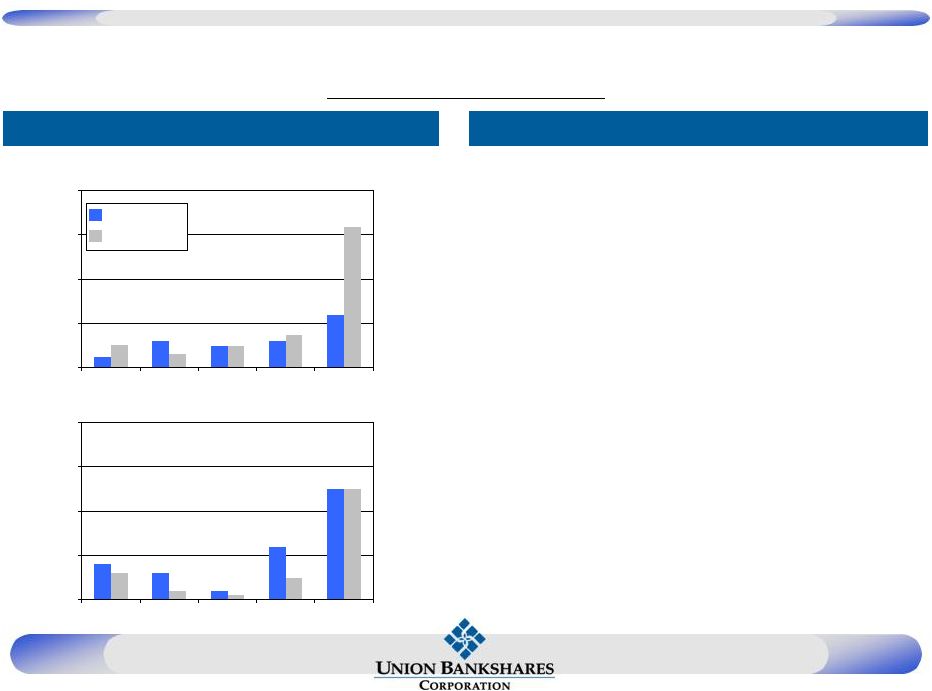 36 • Performed extensive due diligence – Financial and legal due diligence – Credit due diligence conducted by management and third party loan review specialists • Reviewed all non-performing, substandard and watch-list loans in excess of $250 thousand • Reviewed 66% of commercial real estate loans • Determined potential losses under stress scenarios • Interviewed key personnel • Modeled using estimated fair market value adjustment of 2.5% of gross loans • Current loan loss reserve equals 1.30% Due Diligence Due Diligence Process Asset Quality 0.30 0.30 0.59 0.26 0.25 0.12 0.37 0.15 1.59 0.25 0.00 0.50 1.00 1.50 2.00 2004 2005 2006 2007 2008 NPAs / Loans + OREO Peer Group (1) First Market 0.06 0.02 0.12 0.25 0.08 0.06 0.02 0.05 0.25 0.01 0.00 0.10 0.20 0.30 0.40 2004 2005 2006 2007 2008 Net Charge-offs / Avg. Loans (%) (%) Source: SNL Financial (1) Peer group includes select banks and thrifts headquartered in Virginia with
assets between $1.0 billion and $5.0 billion |
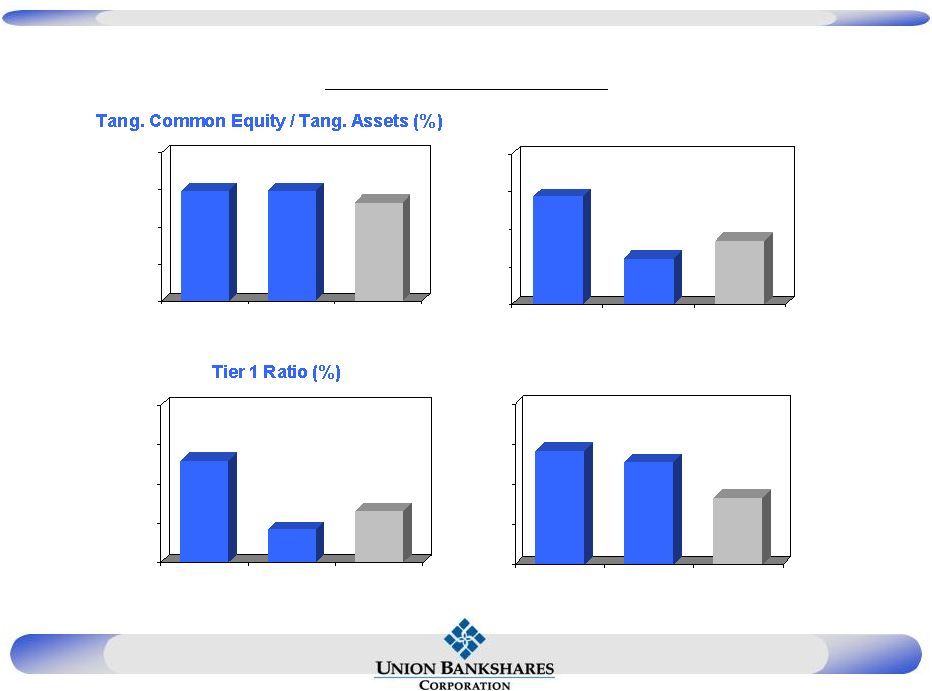 37 Leverage Ratio (%)
Total Capital Ratio (%) 13.83 13.56 12.67 11.00 12.00 13.00 14.00 15.00 UBSH Stand Alone First Market Stand Alone Pro Forma 5.98 5.97 5.65 3.00 4.00 5.00 6.00 7.00 UBSH Stand Alone First Market Stand Alone Pro Forma 10.87 9.23 9.71 8.00 9.00 10.00 11.00 12.00 UBSH Stand Alone First Market Stand Alone Pro Forma 12.59 10.86 11.33 10.00 11.00 12.00 13.00 14.00 UBSH Stand Alone First Market Stand Alone Pro Forma Capital Impact Capital ratios projected at close |
 38 Acquisition Blueprint Good Demographics / Growth Market OR …Unique Product / Service (e.g. Trust, Wealth Management) Management Retention Thorough Due Diligence Process Low Integration Risk EPS Accretive Tangible Common Equity to Assets above 5.5% |
 39 Summary Attractive branch footprint in growth markets that will recover early Experienced management team Proven acquirer and integrator |
 40 Proven Merger Integrator Major operations consolidation in 1998 Acquisition and integration of Northern Neck State Bank King George State Bank Rappahannock National Bank Mortgage Capital Investors Guaranty Bank Numerous branch acquisitions |
 41 Additional Information and Where to Find It In connection with the proposed merger transaction with First Market Bank,
Union has filed with the Securities and Exchange Commission (the
“SEC”) a preliminary proxy statement. The definitive proxy statement will be sent to the stockholders of Union seeking their approval
of certain merger related matters at a later date. In addition,
Union may file other relevant documents concerning the proposed transaction with the SEC. STOCKHOLDERS OF UNION ARE URGED TO READ THE DEFINITIVE PROXY
STATEMENT AND ANY OTHER RELEVANT DOCUMENTS TO BE FILED WITH THE SEC IN
CONNECTION WITH THE PROPOSED TRANSACTION BECAUSE THEY WILL CONTAIN IMPORTANT INFORMATION. Stockholders of Union may obtain free copies of these
documents through the website maintained by the SEC at
http://www.sec.gov. Free copies of the definitive proxy statement (when available) also may be obtained by directing a request by telephone or
mail to Union Bankshares Corporation, Post Office Box 446,
Bowling Green, Virginia 22427-0446, Attention: Investor Relations (telephone: (804) 633-5031) or by accessing Union’s website at http://www.ubsh.com under “Investor Relations – SEC Filings.” The information on Union’s website is not, and shall not be deemed to
be, a part of this release or incorporated into other filings
the company makes with the SEC. Union and its directors,
executive officers and certain members of management may be deemed to be participants in the solicitation of proxies from the stockholders of Union
in connection with the transaction. Information about the
directors and executive officers of Union is set forth in the proxy statement for Union’s 2009 annual meeting of shareholders filed with the SEC on March 19, 2009. Additional information regarding the interests of these participants and other persons who may be
deemed participants in the transaction may be obtained by
reading the definitive proxy statement regarding the merger when it becomes available. |
 42 Caution Regarding Forward- Looking Statements Certain statements made in this release may be considered
forward-looking statements. Such statements speak only as of the date of this release and are based on current expectations and involve a
number of assumptions. These include statements as to the
anticipated benefits of the proposed transaction with First Market Bank, including future financial and operating results that may be realized from the transaction as well as other statements of expectations regarding the transaction and any other statements regarding future results or expectations. Union intends such
forward-looking statements to be covered by the safe harbor
provisions for forward-looking statements contained in the Private Securities Litigation Reform Act of 1995 and is including this statement for purposes of these safe harbor provisions.
Union’s ability to predict results, or the actual effects of future plans or strategies, is inherently uncertain. Factors which could
have a material effect on the operations and future prospects of Union include but are not limited to: (1) the businesses of acquired companies may not be integrated successfully or such integration may be more difficult, time-consuming or costly than expected; (2) expected revenue synergies and cost savings from acquisitions may not be fully realized or
realized within the expected timeframe; (3) revenues following acquisitions may be lower than expected; (4) customer and employee relationships and business operations may be disrupted by acquisitions; (5) the ability to obtain required regulatory and shareholder approvals, and the ability to complete acquisitions on the expected timeframe may be more
difficult, time-consuming or costly than expected; (6)
changes in interest rates, general economic conditions, monetary and fiscal policies of the U. S. government (including policies of the U. S. Treasury and the Federal Reserve Board), the quality
and composition of the loan and securities portfolios, demand
for loan products, deposit flows, competition, demand for financial services in its market areas, laws and regulations, and accounting principles, policies and guidelines; and (7) other risk factors detailed from time to time in filings made by Union with the SEC. Union undertakes no obligation to update or
clarify these forward-looking statements, whether as a
result of new information, future events or otherwise. |
 Questions? |