
Investor Presentation Nasdaq: UBSH January 23, 2018 Free Writing Prospectus Dated January 23, 2018 Filed Pursuant to Rule 433 Registration Statement No. 333 - 220398
Certain statements in this presentation which are not statements of historical fact constitute forward - looking statements within the meaning of, and subject to the protections of, Section 27A of the Securities Act of 1933, as amended, or the “Securities Act,” and Section 21E of the Exchange Act. Forward - looking statements include statements with respect to our beliefs, plans, objectives, goals, targets, expectations, anticipations, assumptions, estimates, intentions and future performance and involve known and unknown risks, many of which are beyond our control and which may cause our actual results, performance or achievements or the commercial banking industry or economy generally, to be materially different from future results, performance or achievements expressed or implied by such forward - looking statements. All statements other than statements of historical fact are forward - looking statements. You can identify these forward - looking statements through our use of words such as “believes,” “anticipates,” “expects,” “may,” “will,” “assumes,” “should,” “predicts,” “could,” “would,” “intends,” “targets,” “estimates,” “projects,” “plans,” “potential” and other similar words and expressions of the future or otherwise regarding the outlook for our future business and financial performance and/or the performance of the commercial banking industry and economy in general. Forward - looking statements may include, without limitation: • projections of revenues, expenses, income, income per share, net interest margins, asset growth, loan production, asset quality, deposit growth and other performance measures; • statements regarding the anticipated benefits from or other effects of the merger between Union and Xenith; • statements regarding expansion of operations, including branch openings, entrance into new markets, development of products and services, and execution of strategic initiatives; and • discussions of the future state of the economy, competition, regulation, taxation, our business strategies, subsidiaries, investment risk and policies. Forward - looking statements are subject to various risks and uncertainties, which change over time, are based on management’s expectations and assumptions at the time the statements are made and are not guarantees of future results. Actual future performance, outcomes and results may differ materially from those expressed in or contemplated by these forward - looking statements due to certain risks, uncertainties and assumptions, many of which are beyond our ability to control or predict. Certain factors that may affect our future results include, but are not limited to: • the possibility that any of the anticipated benefits of the merger of Xenith with and into the Company, with the Company surviving, will not be realized or will not be realized within the expected time period, the businesses of the Company and Xenith may not be integrated successfully or such integration may be more difficult, time - consuming or costly than expected, the expected revenue synergies and cost savings from the merger may not be fully realized or realized within the expected time frame, revenues following the merger may be lower than expected, or customer and employee relationships and business operations may be disrupted by the merger; • future adjustments to the preliminary unaudited financial information for the three - and twelve - month periods ended December 31, 2017 or the pro forma financial information included in this presentation; • changes in interest rates; • general economic and financial market conditions; • the Company’s ability to manage its growth or implement its growth strategy; • the incremental cost and/or decreased revenues associated with exceeding $10 billion in assets; • levels of unemployment in the Bank’s lending area; • real estate values in the Bank’s lending area; • an insufficient allowance for loan losses; • the quality or composition of the Company’s loan or investment portfolios; • concentrations of loans secured by real estate, particularly commercial real estate; • the effectiveness of the Company’s credit processes and management of the Company’s credit risk; • demand for loan products and financial services in the Company’s market area; • the Company’s ability to compete in the market for financial services; • technological risks and developments, and cyber attacks or events; • performance by the Company’s counterparties or vendors; • deposit flows; • the availability of financing and the terms thereof; • the level of prepayments on loans and mortgage - backed securities; • legislative or regulatory changes and requirements; • the impact of the federal Tax Cuts and Jobs Act (the “Tax Act”) signed into law on December 22, 2017, including, but not limited to, the effect of the lower federal corporate income tax rate, including on the valuation of our tax assets and liabilities; • any future refinements to our preliminary analysis of the impact of the Tax Act on us; • changes in the effect of the Tax Act due to issuance of interpretive regulatory guidance or enactment of corrective or supplemental legislation; • monetary and fiscal policies of the U.S. government including policies of the U.S. Department of the Treasury and the Federal Reserve; • accounting principles and guidelines; and • the risks outlined in “Risk Factors” in our preliminary prospectus supplement dated January 23, 2018 and in “Item IA. Risk Factors” in our Annual Report on Form 10 - K for the year ended December 31, 2016 and in our Quarterly Reports on Form 10 - Q for the quarters ended March 31, 2017, June 30, 2017 and September 30, 2017. Should one or more of the foregoing risks materialize, or should underlying assumptions prove incorrect, actual results or outcomes may vary materially from those described in the forward - looking statements. Forward - looking statements included herein should not be relied upon as representing our expectations or beliefs as of any date subsequent to the date of this presentation. Except as required by law, we undertake no obligation to update or revise any forward - looking statements contained in this presentation, whether as a result of new information, future events or otherwise. The factors discussed herein are not intended to be a complete summary of all risks and uncertainties that may affect our businesses. Though we strive to monitor and mitigate risk, we cannot anticipate all potential economic, operational and financial developments that may adversely impact our operations and our financial results. Forward - looking statements should not be viewed as predictions and should not be the primary basis upon which investors evaluate an investment in our securities. Forward Looking Statements 2
Unaudited Pro Forma Financial Information The unaudited pro forma financial information included herein is presented for informational purposes only and does not necessarily reflect the financial results of the combined company had the companies actually been combined during periods presented. The adjustments included in this unaudited pro forma financial information are preliminary and may be significantly revised and may not agree to actual amounts finally recorded by Union. This financial information does not reflect the benefits of the merger’s expected cost savings and expense efficiencies, opportunities to earn additional revenue, potential impacts of current market conditions on revenues or asset dispositions, among other factors, and includes various preliminary estimates and may not necessarily be indicative of the financial position or results of operations that would have occurred if the merger had been completed on the date or at the beginning of the period indicated or which may be attained in the future. Non - GAAP Financial Measures Union reports its results in accordance with United States generally accepted accounting principles (“GAAP”). However, management believes that certain non - GAAP performance measures used in managing the business may provide meaningful information about underlying trends in its business. Non - GAAP financial measures should be viewed in addition to, and not as an alternative for, Union’s reported results prepared in accordance with GAAP. Please see “Reconciliation of Non - GAAP Disclosures” at the end of this presentation for a reconciliation to the nearest GAAP financial measure. Additional Information 3
ABOUT UNION BANKSHARES CORPORATION Headquartered in Richmond, Virginia, Union Bankshares Corporation (Nasdaq: UBSH) is the holding company for Union Bank & Trust. Union Bank & Trust has 150 banking offices, 39 of which are operated as Xenith Bank, a division of Union Bank & Trust of Richmond, Virginia, and approximately 220 ATMs located throughout Virginia, and in portions of Maryland and North Carolina. Union Bank & Trust also operates Shore Premier Finance, a specialty marine lender. Non - bank affiliates of Union Bankshares Corporation include: Union Mortgage Group, Inc., which provides a full line of mortgage products, Old Dominion Capital Management, Inc., which provides investment advisory services, and Union Insurance Group, LLC, which offers various lines of insurance products. NO OFFER OR SOLICITATION This communication does not constitute an offer to sell, a solicitation of an offer to sell, the solicitation or an offer to buy any securities or a solicitation of any vote or approval. There will be no sale of securities in any jurisdiction in which such an offer, solicitation or sale would be unlawful prior to registration or qualification under the securities laws of any such jurisdiction. No offer of securities shall be made except by means of a prospectus meeting the requirement of Section 10 of the Securities Act of 1933, as amended. ADDITIONAL INFORMATION ABOUT THE OFFERING Union has filed a shelf registration statement (File no. 333 - 220398) on Form S - 3 (including a prospectus) with the Securities and Exchange Commission (the “SEC”) which became automatically effective on September 8, 2017. Before you invest in the offering to which this communication relates, you should read the prospectus in that registration statement and the preliminary prospectus supplement related to the offering and the other documents Union has filed and will file with the SEC for more complete information about Union and this offering. When available, copies of the preliminary prospectus supplement and the accompanying prospectus related to the offering may be obtained by contacting: Keefe, Bruyette & Woods, Inc., A Stifel Company, Equity Capital Markets, 787 Seventh Avenue, 4th Floor, New York, NY 10019, by e - mail to USCapitalMarkets@kbw.com, or by calling toll - free: (800) 966 - 1559. Alternatively, you may request a copy the prospectus by contacting: Sandler O’Neill + Partners, L.P. at toll - free 1 - 866 - 805 - 4128 or by emailing syndicate@sandleroneill.com or from Raymond James & Associates, Inc., 880 Carillon Parkway, St. Petersburg, FL 33716, telephone: (800) 248 - 8863, email: prospectus@raymondjames.com. Investors may also obtain copies of these documents free of charge by visiting the SEC’s website at www.sec.gov. Additional Information (Continued) 4
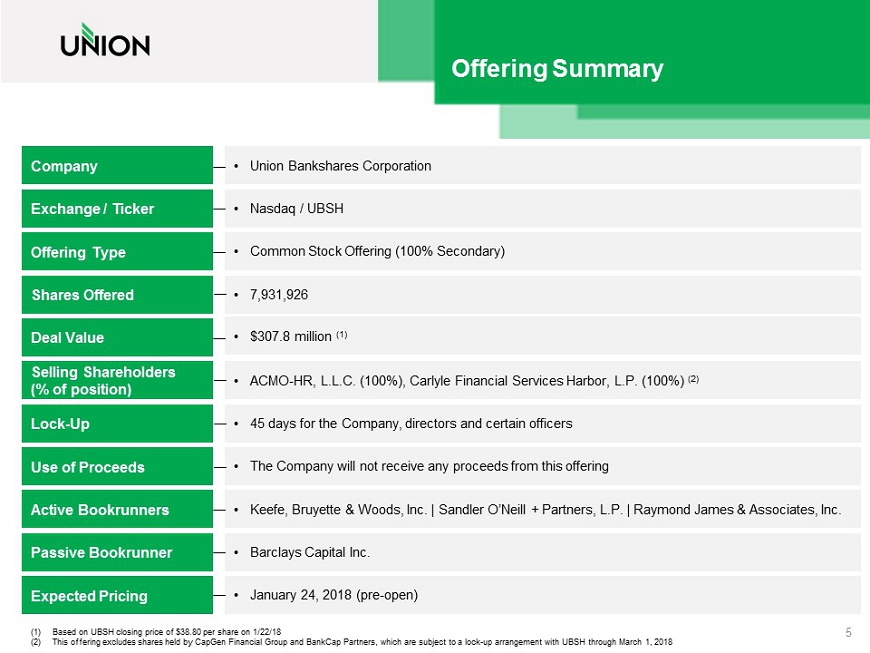
Offering Summary Shares Offered Company • Union Bankshares Corporation • 7,931,926 Selling Shareholders (% of position) • ACMO - HR, L.L.C. (100%), Carlyle Financial Services Harbor, L.P. (100%) (2) Deal Value • $307.8 million (1) Lock - Up • 45 days for the Company, directors and certain officers Exchange / Ticker • Nasdaq / UBSH Offering Type • Common Stock Offering (100% Secondary) Use of Proceeds • The Company will not receive any proceeds from this offering Active Bookrunners • Keefe, Bruyette & Woods, Inc. | Sandler O’Neill + Partners, L.P. | Raymond James & Associates, Inc. Passive Bookrunner • Barclays Capital Inc. Expected Pricing • January 24, 2018 (pre - open) (1) Based on UBSH closing price of $38.80 per share on 1/22/18 (2) This offering excludes shares held by CapGen Financial Group and BankCap Partners, which are subject to a lock - up arrangement with UBSH through March 1, 2018 5
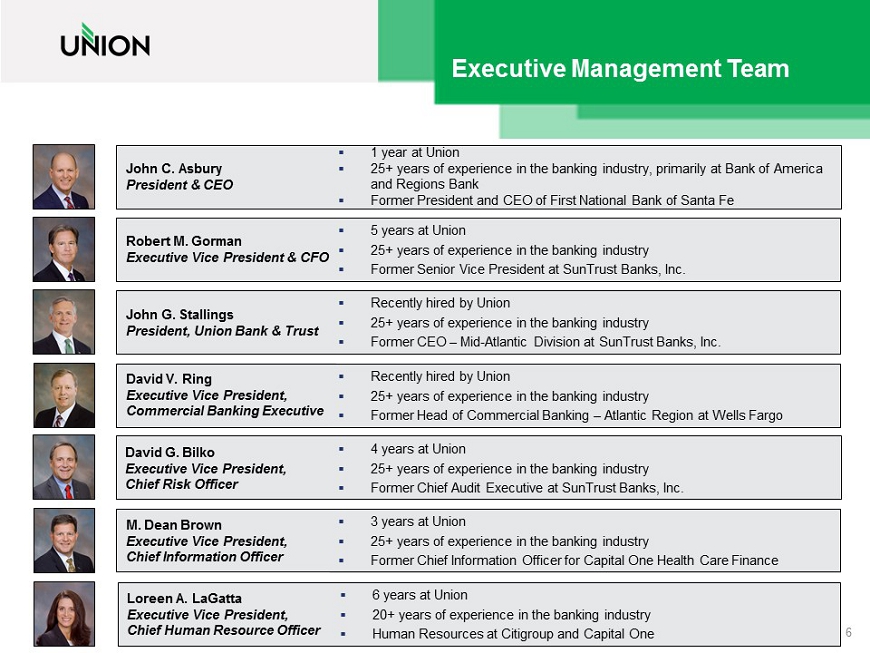
Executive Management Team John C. Asbury President & CEO ▪ 1 year at Union ▪ 25+ years of experience in the banking industry, primarily at Bank of America and Regions Bank ▪ Former President and CEO of First National Bank of Santa Fe Robert M. Gorman Executive Vice President & CFO ▪ 5 years at Union ▪ 25+ years of experience in the banking industry ▪ Former Senior Vice President at SunTrust Banks, Inc. David V. Ring Executive Vice President, Commercial Banking Executive ▪ Recently hired by Union ▪ 25+ years of experience in the banking industry ▪ Former Head of Commercial Banking – Atlantic Region at Wells Fargo John G. Stallings President, Union Bank & Trust ▪ Recently hired by Union ▪ 25+ years of experience in the banking industry ▪ Former CEO – Mid - Atlantic Division at SunTrust Banks, Inc. 6 David G. Bilko Executive Vice President, Chief Risk Officer ▪ 4 years at Union ▪ 25+ years of experience in the banking industry ▪ Former Chief Audit Executive at SunTrust Banks, Inc. M. Dean Brown Executive Vice President, Chief Information Officer ▪ 3 years at Union ▪ 25+ years of experience in the banking industry ▪ Former Chief Information Officer for Capital One Health Care Finance Loreen A. LaGatta Executive Vice President, Chief Human Resource Officer ▪ 6 years at Union ▪ 20+ years of experience in the banking industry ▪ Human Resources at Citigroup and Capital One
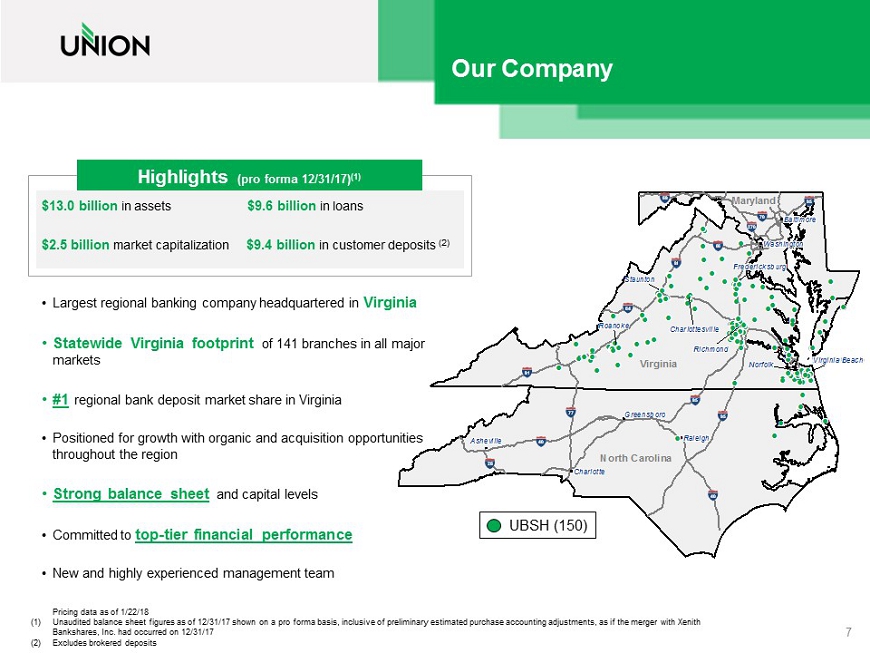
= = = = = = = = = = = = = = = = = = = = = = = = = = = = = = = = = = = = = = = = = = = = = = = = = = = = = = = = = = = = = = = = = = = = = = = = = = = = = = = = = = = = = = = = = = = = = = = = = = = = = = = = = = = = = = = = = = = = = = = = = = = = = = = = = = = = = = = = = = = = = = = = = = = = = = = = = = = = = = = = = = = = = = = = = = = = = = = = = = = = = = = = = = = = = = = = = = = = = = = = = = = = = = = = = = = = = = = = = = = = = = = = = = = = = = = = = = = = = = = = = = = = = = = = = = = = = = = = = = = = = = = = = = = = = = = = = = = = = = = = = = = = = = = = = = = = = = = = = = = = = = = = = = = = = = = = = = = = = = = = = = = = = = = = = = = = = = = = = = = = = = = = = = = = = = = = = = = = = = = = = = = = = = = = = = = = = = = = = = = = = = = = = = = = = = = = = = = = = = = = = = = = = = = = = = = = = = = = = = = = = = = = = = = = = = = = = = = = = = = = = = = = = = = = = = = = = = = = = = = = = = = = = = = = = = = = = = = = = = = = = = = = = = = = = = = = = = = = = = = = = = = = = = = = = = = = = = = = = = = = = = = = = = = = = = = = = = = = = = = = = = = = = = = = = = = = = = = = = = = = = = = = = = = = = = = = = = = = = = = = = = = = = = = = = = = = = = = = = = = = = = = = = = = = = = = = = = = = = = = = = = = = = = = = = = = = = = = = = = = = = = = = = = = = = = = = = = = = = = = = = = = = = = = = = = = = = = = = = = = = = = = = = = = = = = = = = = = = = = = = = = = = = = = = = = = = = = = = = = = = = = = = = = = = = = = = = = = = = = = = = = = = = = = = = = = = = = = = = = = = = = = = = = = = = = = = = = = = = = = = = = = = = = = = = = = = = = = = = = = = = = = = = = = = = = = = = = = = = = = = = = = = = = = = = = = = = = = = = = = = = = = = = = = = = = = = = = = = = = = = = = = = = = = = = = = = = = = = = = = = = = = = = = = = = = = = = = = = = = = = = = = = = = = = = = = = = = = = = = = = = = = = = = = = = = = = = = = = = = = = = = = = = = = = = = = = = = = = = = = = = = = = = = = = = = = = = = = = = = = = = = = = = = = = = = = = = = = = = = = = = = = = = = = = = = = = = = = = = = = = = = = = = = = = = = = = = = = = = = = = = = = = = = = = = = = = = = = = = = = = = = = = = = = = = = = = = = = = = = = = = = = = = = = = = = = = = = = = = = = = = = = = = = = = = = = = = = = = = = = = = = = = = = = = = = = = = = = = = = = = = = = = = = = = = = = = = = = = = = = = = = = = = = = = = = = = = = = = = = = = = = = = = = = = = = = = = = = = = = = = = = = = = = = = = = = = = = = = = = = = = = = = = = = = = = = = = = = = = = = = = = = = = = = = = = = = = = = = = = = = = = = = = = = = = = = = = = = = = = = = = = = = = = = = = = = = = = = = = = = = = = = = = = = = = = = = = = = = = = = = = = = = = = = = = = = = = = = = = = = = = = = = = = = = = = = = = = = = = = = = = = = = = = = = = = = = = = = = = = = = = = = = = = = = = = = = = = = = = = = = = = = = = = = = = = = = = = = = = = = = = = = = = = = = = = = = = = = = = = = = = = = = = = = = = = = = = = = = = = = = = = = = = = = = = = = = = = = = = = = = = = = = = = = = = = = = = = = = = = = = = = = = = = = = = = = = = = = = = = = = = = = = = = = = = = = = = = = = = = = = = = = = = = = = = = = = = = = = = = = = = = = = = = = = = = = = = = = = = = = = = = = = = = = = = = = = = = = = = = = = = = = = = = = = = = = = = = = = = = = = = = = = = = = = = = = = = = = = = = = = = = = = = = = = = = = = = = = = = = = = = = = = = = = = = = = = = = = = = = = = = = = = = = = = = = = = = = = = = = = = = = = = = = = = = = = = = = = = = = = = = = = = = = = = = = = = = = = = = = = = = = = = = = = = = = = = = = = = = = = = = = = = = = = = = = = = = = = = = = = = = = = = = = = = = = = = = = = = = = = = = = = = = = = = = = = = = = = = = = = = = = = = = = = = = = = = = = = = = = = = = = = = = = = = = = = = = = = = = = = = = = = = = = = = = = = = = = = = = = = = = = = = = = = = = = = = = = = = = = = = = = = = = = = = = = = = = = = = = = = = = = = = = = = = = = = = = = = = = = = = = = = = = = = = = = = = = = = = = = = = = = = = = = = = = = = = = = = = = = = = = = = = = = = = = = = = = = = = = = = = = = = = = = = = = = = = = = = = = = = = = = = = = = = = = = = = = = = = = = = = = = = = = = = = = = = = = = = = = = = = = = = = = = = = = = = = = = = = = = = = = = = = = = = = = = = = = = = = = = = = = = = = = = = = = = = = = = = = = = = = = = = = = = = = = = = = = = = = = = = = = = = = = = = = = = = = = = = = = = = = = = = = = = = = = = = = = = = = = = = = = = = = = = = = = = = = = = = = = = = = = = = = = = = = = = = = = = = = = = = = = = = = = = = = = = = = = = = = = = = = = = = = = = = = = = = = = = = = = = = = = = = = = = = = = = = = = = = = = = = = = = = = = = = = = = = = = = = = = = = = = = = = = = = = = = = = = = = = = = = = = = = = = = = = = = = = = = = = = = = = = = = = = = = = = = = = = = = = = = = = = = = = = = = = = = = = = = = = = = = = = = = = = = = = = = = = = = = = = = = = = = = = = = = = = = = = = = = = = = = = = = = = = = = = = = = = = = = = = = = = = = = = = = = = = = = = = = = = = = = = = = = = = = = = = = = = = = = = = = = = = = = = = = = = = = = = = = = = = = = = = = = = = = = = = = = = = = = = = = = = = = = = = = = = = = = = = = = = = = = = = = = = = = = = = = = = = = = = = = = = = = = = = = = = = = = = = = = = = = = = = = = = = = = = = = = = = = = = = = = = = = = = = = = = = = = = = = = = = = = = = = = = = = = = = = = = = = = = = = = = = = = = = = = = = = = = = = = = = = = = = = = = = = = = = = = = = = = = = = = = = = = = = = = = = = = = = = = = = = = = = = = = = = = = = = = = = = = = = = = = = = = = = = = = = = = = = = = = = = = = = = = = = = = = = = = = = = = = = = = = = = = = = = = = = = = = = = = = = = = = = = = = = = = = = = = = = = = = = = = = = = = = = = = = = = = = = = = = = = = = = = = = = = = = = = = = = = = = = = = = = = = = = = = = = = = = = = = = = = = = = = = = = = = = = = = = = = = = = = = = = = = = = = = = = = = = = = = = = = = = = = = = = = = = = = = = = = = = = = = = = = = = = = = = = = = = = = = = = = = = = = = = = = = = = = = = = = = = = = = = = = = = = = = = = = = = = = = = = = = = = = = = = = = = = = = = = = = = = = = = = = = = = = = = = = = = = = = = = = = = = = = = = = = = = = = = = = = = = = = = = = = = = = = = = = = = = = = = = = = = = = = = = = = = = = = = = = = = = = = = = = = = = = = = = = = = = = = = = = = = = = = = = = = = = = = = = = = = = = = = = = = = = = = = = = = = = = = = = = = = = = = = = = = = = = = = = = = = = = = = = = = = = = = = = = = = = = = = = = = = = = = = = = = = = = = = = = = = = = = = = = = = = = = = = = = = = = = = = = = = = = = = = = = = = = = = = = = = = = = = = = = = = = = = = = = = = = = = = = = = = = = = = = = = = = = = = = = = = = = = = = = = = = = = = = = = = = = = = = = = = = = = = = = = = = = = = = = = = = = = = = = = = = = = = = = = = = = = = = = = = = = = = = = = = = = = = = = = = = = = = = = = = = = = = = = = = = = = = = = = = = = = = = = = = = = = = = = = = = = = = = = = = = = = = = = = = = = = = = = = = = = = = = = = = = = = = = = = = = = = = = = = = = = = = = = = = = = = = = = = = = = = = = = = = = = = = = = = = = = = = = = = = = = = = = = = = = = = = = = = = = = = = = = = = = = = = = = = = = = = = = = = = = = = = = = = = = = = = = = = = = = = = = = = = = = = = = = = = = = = = = = = = = = = = = = = = = = = = = = = = = = = = = = = = = = = = = = = = = = = = = = = = = = = = = = = = = = = = = = = = = = = = = = = = = = = = = = = = = = = = = = = = = = = = = = = = = = = = = = = = = = = = = = = = = = = = = = = = = = = = = = = = = = = = = = = = = = = = = = = = = = = = = = = = = = = = = = = = = = = = = = = = = = = = = = = = = = = = = = = = = = = = = = = = = = = = = = = = = = = = = = = = = = = = = = = = = = = = = = = = = = = = = = = = = = = = = = = = = = = = = = = = = = = = = = = = = = = = = = = = = = = = = = = = = = = = = = = = = = = = = = = = = = = = = = = = = = = = = = = = = = = = = = = = = = = = = = = = = = = = = = = = = = = = = = = = = = = = = = = = = = = = = = = = = = = = = = = = = = = = = = = = = = = = = = = = = = = = = = = = = = = = = = = = = = = = = = = = = = = = = = = = = = = = = = = = = = = = = = = = = = = = = = = = = = = = = = = = = = = = = = = = = = = = = = = = = = = = = = = = = = = = = = = = = = = = = = = = = = = = = = = = = = = = = = = = = = = = = = = = = = = = = = = = = = = = = = = = = = = = = = = = = = = = = = = = = = = = = = = = = = = = = = = = = = = = = = = = = = = = = = = = = = = = = = = = = = = = = = = = = = = = = = = = = = = = = = = = = = = = = = = = = = = = = = = = = = = = = = = = = = = = = = = = = = = = = = = = = = = = = = = = = = = = = = = = = = = = = = = = = = = = = = = = = = = = = = = = = = = = = = = = = = = = = = = = = = = = = = = = = = = = = = = = = = = = = = = = = = = = = = = = = = = = = = = = = = = = = = = = = = = = = = = = = = = = = = = = = = = = = = = = = = = = = = = = = = = = = = = = = = = = = = = = = = = = = = = = = = = = = = = = = = = = = = = = = = = = = = = = = = = = = = = = = = = = = = = = = = = = = = = = = = = = = = = = = = = = = = = = = = = = = = = = = = = = = = = = = = = = = = = = = = = = = = = = = = = = = = = = = = = = = = = = = = = = = = = = = = = = = = = = = = = = = = = = = = = = = = = = = = = = = = = = = = = = = = = = = = = = = = = = = = = = = = = = = = = = = = = = = = = = = = = = = = = = = = = = = = = = = = = = = = = = = = = = = = = = = = = = = = = = = = = = = = = = = = = = = = = = = = = = = = = = = = = = = = = = = = = = = = = = = = = = = = = = = = = = = = = = = = = = = = = = = = = = = = = = = = = = = = = = = = = = = = = = = = = = = = = = = = = = = = = = = = = = = = = = = = = = = = = = = = = = = = = = = = = = = = = = = = = = = = = = = = = = = = = = = = = = = = = = = = = = = = = = = = = = = = = = = = = = = = = = = = = = = = = = = = = = = = = = = = = = = = = = = = = = = = = = = = = = = = = = = = = = = = = = = = = = = = = = = = = = = = = = = = = = = = = = = = = = = = = = = = = = = = = = = = = = = = = = = = = = = = = = = = = = = = = = = = = = = = = = = = = = = = = = = = = = = = = = = = = = = = = = = = = = = = = = = = = = = = = = = = = = = = = = = = = = = = = = = = = = = = = = = = = = = = = = = = = = = = = = = = = = = = = = = = = = = = = = = = = = = = = = = = = = = = = = = = = = = = = = = = = = = = = = = = = = = = = = = = = = = = = = = = = = = = = = = = = = = = = = = = = = = = = = = = = = = = = = = = = = = = = = = = = = = = = = = = = = = = = = = = = = = = = = = = = = = = = = = = = = = = = = = = = = = = = = = = = = = = = = = = = = = = = = = = = = = = = = = = = = = = = = = = = = = = = = = = = = = = = = = = = = = = = = = = = = = = = = = = = = = = = = = = = = = = = = = = = = = = = = = = = = = = = = = = = = = = = = = = = = = = = = = = = = = = = = = = = = = = = = = = = = = = = = = = = = = = = = = = = = = = = = = = = = = = = = = = = = = = = = = = = = = = = = = = = = = = = = = = = = = = = = = = = = = = = = = = = = = = = = = = = = = = = = = = = = = = = = = = = = = = = = = = = = = = = = = = = = = = = = = = = = = = = = = = = = = = = = = = = = = = = = = = = = = = = = = = = = = = = = = = = = = = = = = = = = = = = = = = = = = = = = = = = = = = = = = = = = = = = = = = = = = = = = = = = = = = = = = = = = = = = = = = = = = = = = = = = = = = = = = = = = = = = = = = = = = = = = = = = = = = = = = = = = = = = = = = = = = = = = = = = = = = = = = = = = = = = = = = = = = = = = = = = = = = = = = = = = = = = = = = = = = = = = = = = = = = = = = = = = = = = = = = = = = = = = = = = = = = = = = = = = = = = = = = = = = = = = = = = = = = = = = = = = = = = = = = = = = = = = = = = = = = = = = = = = = = = = = = = = = = = = = = = = = = = = = = = = = = = = = = = = = = = = = = = = = = = = = = = = = = = = = = = = = = = = = = = = = = = = = = = = = = = = = = = = = = = = = = = = = = = = = = = = = = = = = = = = = = = = = = = = = = = = = = = = = = = = = = = = = = = = = = = = = = = = = = = = = = = = = = = = = = = = = = = = = = = = = = = = = = = = = = = = = = = = = = = = = = = = = = = = = = = = = = = = = = = = = = = = = = = = = = = = = = = = = = = = = = = = = = = = = = = = = = = = = = = = = = = = = = = = = = = = = = = = = = = = = = = = = = = = = = = = = = = = = = = = = = = = = = = = = = = = = = = = = = = = = = = = = = = = = = = = = = = = = = = = = = = = = = = = = = = = = = = = = = = = = = = = = = = = = = = = = = = = = = = = = = = = = = = = = = = = = = = = = = = = = = = = = = = = = = = = = = = = = = = = = = = = = = = = = = = = = = = = = = = = = = = = = = = = = = = = = = = = = = = = = = = = = = = = = = = = = = = = = = = = = = = = = = = = = = = = = = = = = = = = = = = = = = = = = = = = = = = = = = = = = = = = = = = = = = = = = = = = = = = = = = = = = = = = = = = = = = = = = = = = = = = = = = = = = = = = = = = = = = = = = = = = = = = = = = = = = = = = = = = = = = = = = = = = = = = = = = = = = = = = = = = = = = = = = = = = = = = = = = = = = = = = = = = = = = = = = = = = = = = = = = = = = = = = = = = = = = = = = = = = = = = = = = = = = = = = = = = = = = = = = = = = = = = = = = = = = = = = = = = = = = = = = = = = = = = = = = = = = = = = = = = = = = = = = = = = = = = = = = = = = = = = = = = = = = = = = = = = = = = = = = = = = = = = = = = = = = = = = = = = = = = = = = = = = = = = = = = = = = = = = = = = = = = = = = = = = = = = = = = = = = = = = = = = = = = = = = = = = = = = = = = = = = = = = = = = = = = = = = = = = = = = = = = = = = = = = = = = = = = = = = = = = = = = = = = = = = = = = = = = = = = = = = = = = = = = = = = = = = = = = = = = = = = = = = = = = = = = = = = = = = = = = = = = = = = = = = = = = = = = = = = = = = = = = = = = = = = = = = = = = = = = = = = = = = = = = = = = = = = = = = = = = = = = = = = = = = = = = = = = = = = = = = = = = = = = = = = = = = = = = = = = = = = = = = = = = = = = = = = = = = = = = = = = = = = = = = = = = = = = = = = = = = = = = = = = = = = = = = = = = = = = = = = = = = = = = = = = = = = = = = = = = = = = = = = = = = = = = = = = = = = = = = = = = = = = = = = = = = = = = = = = = = = = = = = = = = = = = = = = = = = = = = = = = = = = = = = = = = = = = = = = = = = = = = = = = = = = = = = = = = = = = = = = = = = = = = = = = = = = = = = = = = = = = = = = = = = = = = = = = = = = = = = = = = = = = = = = = = = = = = = = = = = = = = = = = = = = = = = = = = = = = = = = = = = = = = = = = = = = = = = = = = = = = = = = = = = = = = = = = = = = = = = = = = = = = = = = = = = = = = = = = = = = = = = = = = = = = = = = = = = = = = = = = = = = = = = = = = = = = = = = = = = = = = = = = = = = = = = = = = = = = = = = = = = = = = = = = = = = = = = = = = = = = = = = = = = = = = = = = = = = = = = = = = = = = = = = = = = = = = = = = = = = = = = = = = = = = = = = = = = = = = = = = = = = = = = = = = = = = = = = = = = = = = = = = = = = = = = = = = = = = = = = = = = = = = = = = = = = = = = = = = = = = = = = = = = = = = = = = = = = = = = = = = = = = = = = = = = = = = = = = = = = = = = = = = = = = = = = = = = = = = = = = = = = = = = = = = = = = = = = = = = = = = = = = = = = = = = = = = = = = = = = = = = = = = = = = = = = = = = = = Virginia Maryland North Carolina Charlottesville Charlottesville Charlottesville Charlottesville Charlottesville Charlottesville Charlottesville Charlottesville Charlottesville Charlottesville Charlottesville Charlottesville Charlottesville Charlottesville Charlottesville Charlottesville Charlottesville Charlottesville Charlottesville Charlottesville Charlottesville Charlottesville Charlottesville Charlottesville Charlottesville Charlottesville Charlottesville Charlottesville Charlottesville Charlottesville Charlottesville Charlottesville Charlottesville Charlottesville Charlottesville Charlottesville Charlottesville Charlottesville Charlottesville Charlottesville Charlottesville Charlottesville Charlottesville Charlottesville Charlottesville Charlottesville Charlottesville Charlottesville Charlottesville Richmond Richmond Richmond Richmond Richmond Richmond Richmond Richmond Richmond Richmond Richmond Richmond Richmond Richmond Richmond Richmond Richmond Richmond Richmond Richmond Richmond Richmond Richmond Richmond Richmond Richmond Richmond Richmond Richmond Richmond Richmond Richmond Richmond Richmond Richmond Richmond Richmond Richmond Richmond Richmond Richmond Richmond Richmond Richmond Richmond Richmond Richmond Richmond Richmond Norfolk Norfolk Norfolk Norfolk Norfolk Norfolk Norfolk Norfolk Norfolk Norfolk Norfolk Norfolk Norfolk Norfolk Norfolk Norfolk Norfolk Norfolk Norfolk Norfolk Norfolk Norfolk Norfolk Norfolk Norfolk Norfolk Norfolk Norfolk Norfolk Norfolk Norfolk Norfolk Norfolk Norfolk Norfolk Norfolk Norfolk Norfolk Norfolk Norfolk Norfolk Norfolk Norfolk Norfolk Norfolk Norfolk Norfolk Norfolk Norfolk Greensboro Greensboro Greensboro Greensboro Greensboro Greensboro Greensboro Greensboro Greensboro Greensboro Greensboro Greensboro Greensboro Greensboro Greensboro Greensboro Greensboro Greensboro Greensboro Greensboro Greensboro Greensboro Greensboro Greensboro Greensboro Greensboro Greensboro Greensboro Greensboro Greensboro Greensboro Greensboro Greensboro Greensboro Greensboro Greensboro Greensboro Greensboro Greensboro Greensboro Greensboro Greensboro Greensboro Greensboro Greensboro Greensboro Greensboro Greensboro Greensboro Roanoke Roanoke Roanoke Roanoke Roanoke Roanoke Roanoke Roanoke Roanoke Roanoke Roanoke Roanoke Roanoke Roanoke Roanoke Roanoke Roanoke Roanoke Roanoke Roanoke Roanoke Roanoke Roanoke Roanoke Roanoke Roanoke Roanoke Roanoke Roanoke Roanoke Roanoke Roanoke Roanoke Roanoke Roanoke Roanoke Roanoke Roanoke Roanoke Roanoke Roanoke Roanoke Roanoke Roanoke Roanoke Roanoke Roanoke Roanoke Roanoke Staunton Staunton Staunton Staunton Staunton Staunton Staunton Staunton Staunton Staunton Staunton Staunton Staunton Staunton Staunton Staunton Staunton Staunton Staunton Staunton Staunton Staunton Staunton Staunton Staunton Staunton Staunton Staunton Staunton Staunton Staunton Staunton Staunton Staunton Staunton Staunton Staunton Staunton Staunton Staunton Staunton Staunton Staunton Staunton Staunton Staunton Staunton Staunton Staunton Fredericksburg Fredericksburg Fredericksburg Fredericksburg Fredericksburg Fredericksburg Fredericksburg Fredericksburg Fredericksburg Fredericksburg Fredericksburg Fredericksburg Fredericksburg Fredericksburg Fredericksburg Fredericksburg Fredericksburg Fredericksburg Fredericksburg Fredericksburg Fredericksburg Fredericksburg Fredericksburg Fredericksburg Fredericksburg Fredericksburg Fredericksburg Fredericksburg Fredericksburg Fredericksburg Fredericksburg Fredericksburg Fredericksburg Fredericksburg Fredericksburg Fredericksburg Fredericksburg Fredericksburg Fredericksburg Fredericksburg Fredericksburg Fredericksburg Fredericksburg Fredericksburg Fredericksburg Fredericksburg Fredericksburg Fredericksburg Fredericksburg Virginia Beach Virginia Beach Virginia Beach Virginia Beach Virginia Beach Virginia Beach Virginia Beach Virginia Beach Virginia Beach Virginia Beach Virginia Beach Virginia Beach Virginia Beach Virginia Beach Virginia Beach Virginia Beach Virginia Beach Virginia Beach Virginia Beach Virginia Beach Virginia Beach Virginia Beach Virginia Beach Virginia Beach Virginia Beach Virginia Beach Virginia Beach Virginia Beach Virginia Beach Virginia Beach Virginia Beach Virginia Beach Virginia Beach Virginia Beach Virginia Beach Virginia Beach Virginia Beach Virginia Beach Virginia Beach Virginia Beach Virginia Beach Virginia Beach Virginia Beach Virginia Beach Virginia Beach Virginia Beach Virginia Beach Virginia Beach Virginia Beach Asheville Asheville Asheville Asheville Asheville Asheville Asheville Asheville Asheville Asheville Asheville Asheville Asheville Asheville Asheville Asheville Asheville Asheville Asheville Asheville Asheville Asheville Asheville Asheville Asheville Asheville Asheville Asheville Asheville Asheville Asheville Asheville Asheville Asheville Asheville Asheville Asheville Asheville Asheville Asheville Asheville Asheville Asheville Asheville Asheville Asheville Asheville Asheville Asheville Baltimore Baltimore Baltimore Baltimore Baltimore Baltimore Baltimore Baltimore Baltimore Baltimore Baltimore Baltimore Baltimore Baltimore Baltimore Baltimore Baltimore Baltimore Baltimore Baltimore Baltimore Baltimore Baltimore Baltimore Baltimore Baltimore Baltimore Baltimore Baltimore Baltimore Baltimore Baltimore Baltimore Baltimore Baltimore Baltimore Baltimore Baltimore Baltimore Baltimore Baltimore Baltimore Baltimore Baltimore Baltimore Baltimore Baltimore Baltimore Baltimore Washington Washington Washington Washington Washington Washington Washington Washington Washington Washington Washington Washington Washington Washington Washington Washington Washington Washington Washington Washington Washington Washington Washington Washington Washington Washington Washington Washington Washington Washington Washington Washington Washington Washington Washington Washington Washington Washington Washington Washington Washington Washington Washington Washington Washington Washington Washington Washington Washington Charlotte Charlotte Charlotte Charlotte Charlotte Charlotte Charlotte Charlotte Charlotte Charlotte Charlotte Charlotte Charlotte Charlotte Charlotte Charlotte Charlotte Charlotte Charlotte Charlotte Charlotte Charlotte Charlotte Charlotte Charlotte Charlotte Charlotte Charlotte Charlotte Charlotte Charlotte Charlotte Charlotte Charlotte Charlotte Charlotte Charlotte Charlotte Charlotte Charlotte Charlotte Charlotte Charlotte Charlotte Charlotte Charlotte Charlotte Charlotte Charlotte Raleigh Raleigh Raleigh Raleigh Raleigh Raleigh Raleigh Raleigh Raleigh Raleigh Raleigh Raleigh Raleigh Raleigh Raleigh Raleigh Raleigh Raleigh Raleigh Raleigh Raleigh Raleigh Raleigh Raleigh Raleigh Raleigh Raleigh Raleigh Raleigh Raleigh Raleigh Raleigh Raleigh Raleigh Raleigh Raleigh Raleigh Raleigh Raleigh Raleigh Raleigh Raleigh Raleigh Raleigh Raleigh Raleigh Raleigh Raleigh Raleigh 81 77 85 270 9 5 68 9 5 70 40 26 40 66 81 64 Our Company Highlights (pro forma 12/31/17) (1) UBSH (150) Pricing data as of 1/22/18 (1) Unaudited balance sheet figures as of 12/31/17 shown on a pro forma basis, inclusive of preliminary estimated purchase accoun tin g adjustments, as if the merger with Xenith Bankshares, Inc . had occurred on 12/31/17 (2) Excludes brokered deposits $13.0 billion in assets $9.6 billion in loans $2.5 billion market capitalization $9.4 billion in customer deposits (2) • Largest regional banking company headquartered in Virginia • Statewide Virginia footprint of 141 branches in all major markets • #1 regional bank deposit market share in Virginia • Positioned for growth with organic and acquisition opportunities throughout the region • Strong balance sheet and capital levels • Committed to top - tier financial performance • New and highly experienced management team 7
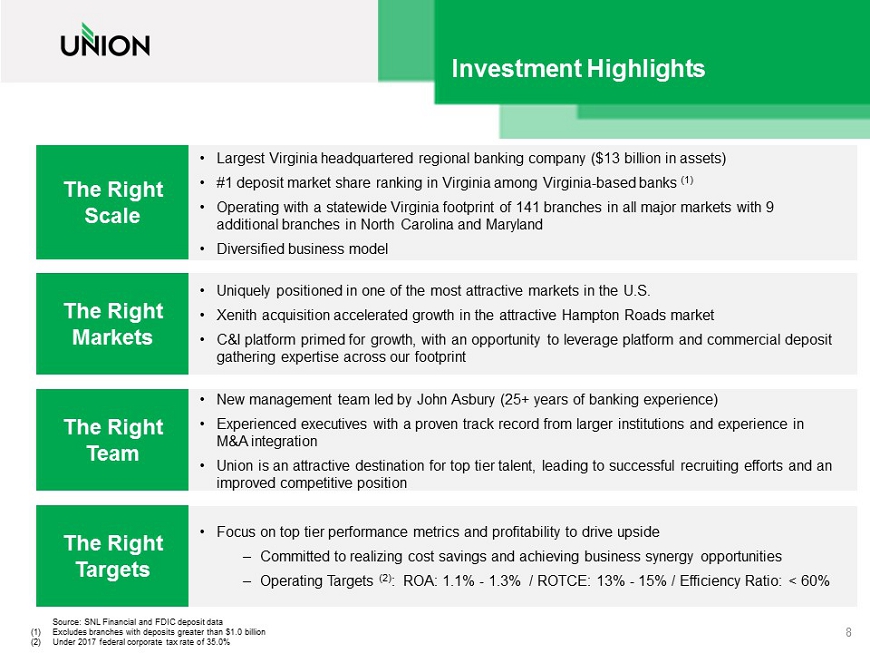
Investment Highlights Source: SNL Financial and FDIC deposit data (1) Excludes branches with deposits greater than $1.0 billion (2) Under 2017 federal corporate tax rate of 35.0% The Right Scale The Right Markets The Right Team The Right Targets • Largest Virginia headquartered regional banking company ($13 billion in assets) • #1 deposit market share ranking in Virginia among Virginia - based banks (1) • Operating with a statewide Virginia footprint of 141 branches in all major markets with 9 additional branches in North Carolina and Maryland • Diversified business model • Uniquely positioned in one of the most attractive markets in the U.S. • Xenith acquisition accelerated growth in the attractive Hampton Roads market • C&I platform primed for growth, with an opportunity to leverage platform and commercial deposit gathering expertise across our footprint • New management team led by John Asbury (25+ years of banking experience) • Experienced executives with a proven track record from larger institutions and experience in M&A integration • Union is an attractive destination for top tier talent, leading to successful recruiting efforts and an improved competitive position • Focus on top tier performance metrics and profitability to drive upside – Committed to realizing cost savings and achieving business synergy opportunities – Operating Targets (2) : ROA: 1.1% - 1.3% / ROTCE: 13% - 15% / Efficiency Ratio: < 60% 8
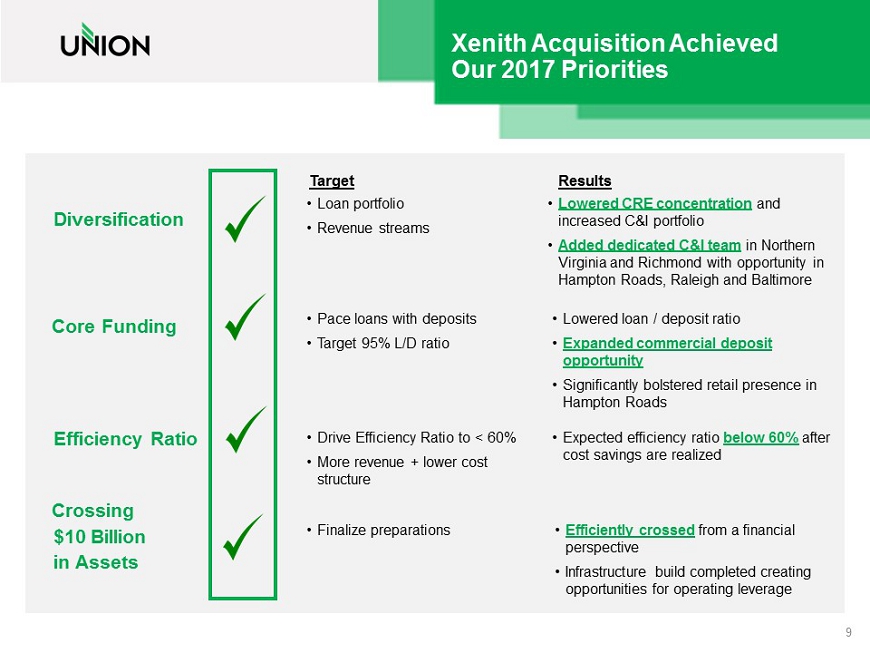
Diversification Core Funding Efficiency Ratio Crossing $10 Billion in Assets Xenith Acquisition Achieved Our 2017 Priorities Target Results • Loan portfolio • Revenue streams • Lowered CRE concentration and increased C&I portfolio • Added dedicated C&I team in Northern Virginia and Richmond with opportunity in Hampton Roads, Raleigh and Baltimore • Pace loans with deposits • Target 95% L/D ratio • Drive Efficiency Ratio to < 60% • More revenue + lower cost structure • Finalize preparations • Lowered loan / deposit ratio • Expanded commercial deposit opportunity • Significantly bolstered retail presence in Hampton Roads • Expected efficiency ratio below 60% after cost savings are realized • Efficiently crossed from a financial perspective • Infrastructure build completed creating opportunities for operating leverage 9
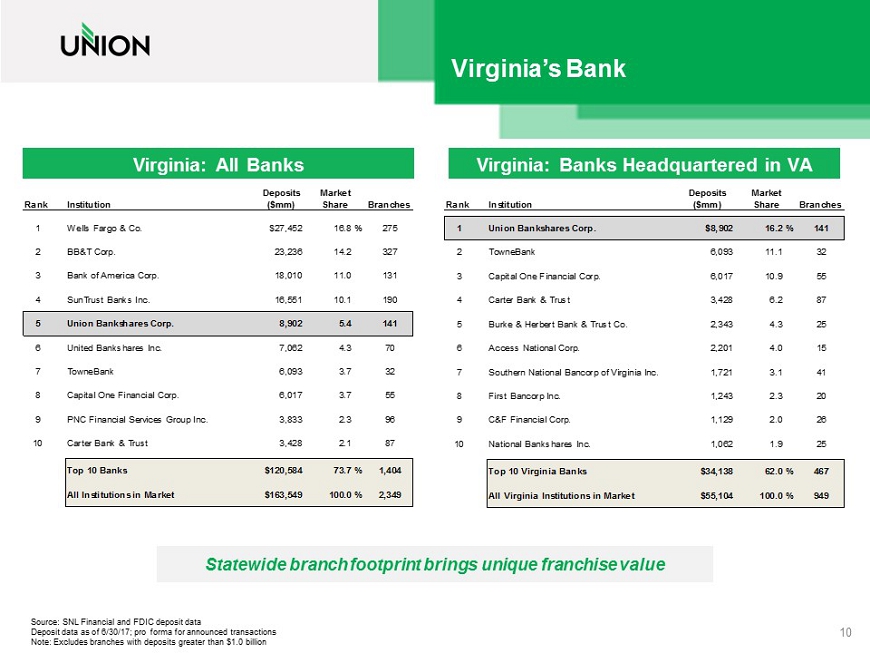
Virginia’s Bank Virginia: Banks Headquartered in VA Virginia: All Banks Source: SNL Financial and FDIC deposit data Deposit data as of 6/30/17; pro forma for announced transactions Note: Excludes branches with deposits greater than $1.0 billion Deposits Market Rank Institution ($mm) Share Branches 1 Wells Fargo & Co. $27,452 16.8% 275 2 BB&T Corp. 23,236 14.2 327 3 Bank of America Corp. 18,010 11.0 131 4 SunTrust Banks Inc. 16,551 10.1 190 5 Union Bankshares Corp. 8,902 5.4 141 6 United Bankshares Inc. 7,062 4.3 70 7 TowneBank 6,093 3.7 32 8 Capital One Financial Corp. 6,017 3.7 55 9 PNC Financial Services Group Inc. 3,833 2.3 96 10 Carter Bank & Trust 3,428 2.1 87 Top 10 Banks $120,584 73.7% 1,404 All Institutions in Market $163,549 100.0% 2,349 Deposits Market Rank Institution ($mm) Share Branches 1 Union Bankshares Corp. $8,902 16.2% 141 2 TowneBank 6,093 11.1 32 3 Capital One Financial Corp. 6,017 10.9 55 4 Carter Bank & Trust 3,428 6.2 87 5 Burke & Herbert Bank & Trust Co. 2,343 4.3 25 6 Access National Corp. 2,201 4.0 15 7 Southern National Bancorp of Virginia Inc. 1,721 3.1 41 8 First Bancorp Inc. 1,243 2.3 20 9 C&F Financial Corp. 1,129 2.0 26 10 National Bankshares Inc. 1,062 1.9 25 Top 10 Virginia Banks $34,138 62.0% 467 All Virginia Institutions in Market $55,104 100.0% 949 Statewide branch footprint brings unique franchise value 10
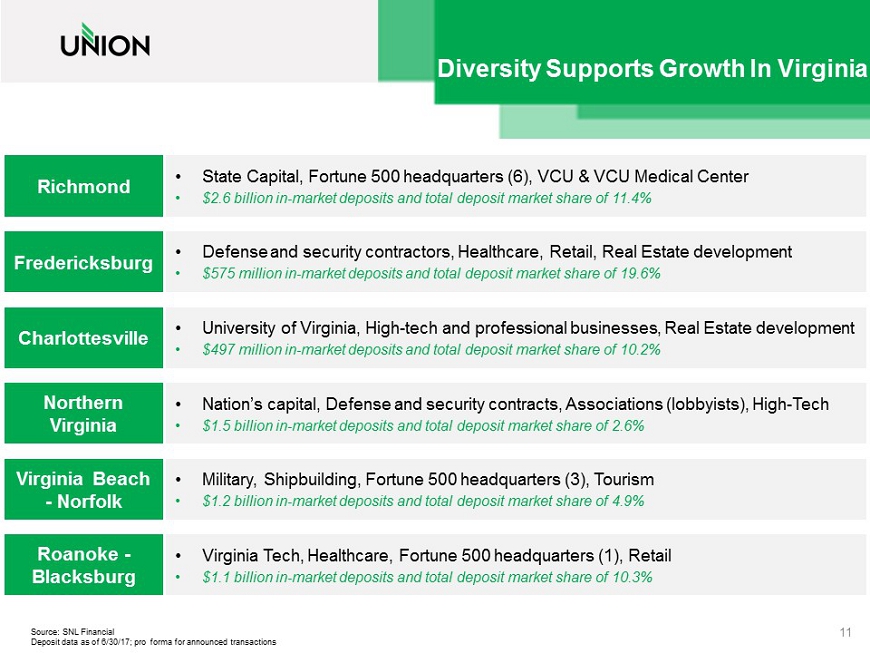
Diversity Supports Growth In Virginia Northern Virginia Richmond • State Capital, Fortune 500 headquarters (6), VCU & VCU Medical Center • $2.6 billion in - market deposits and total deposit market share of 11.4% • Nation’s capital, Defense and security contracts , Associations (lobbyists), High - Tech • $1.5 billion in - market deposits and total deposit market share of 2.6% Roanoke - Blacksburg • Virginia Tech, Healthcare, Fortune 500 headquarters (1), Retail • $1.1 billion in - market deposits and total deposit market share of 10.3% Virginia Beach - Norfolk • Military, Shipbuilding, Fortune 500 headquarters (3), Tourism • $1.2 billion in - market deposits and total deposit market share of 4.9% Fredericksburg • Defense and security contractors, Healthcare, Retail, Real Estate development • $575 million in - market deposits and total deposit market share of 19.6% Charlottesville • University of Virginia, High - tech and professional businesses, Real Estate development • $497 million in - market deposits and total deposit market share of 10.2% Source: SNL Financial Deposit data as of 6/30/17; pro forma for announced transactions 11
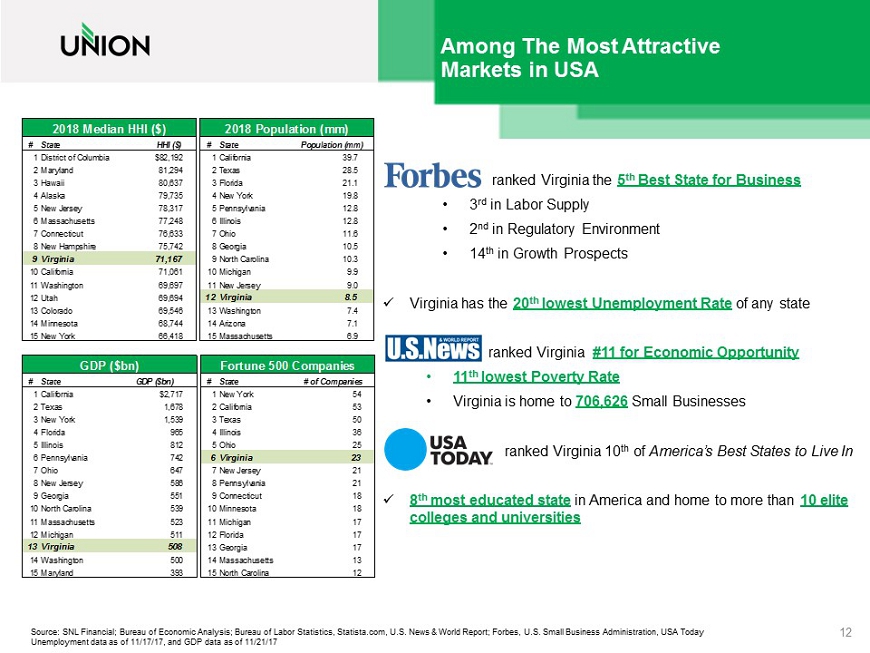
Among The Most Attractive Markets in USA Source: SNL Financial; Bureau of Economic Analysis; Bureau of Labor Statistics, Statista.com, U.S. News & World Report; Forbes, U.S. Small Business Administration, USA Today U nemployment data as of 11/17/17, and GDP data as of 11/21/17 2018 Median HHI ($) 2018 Population (mm) GDP ($bn) # State HHI ($) # State Population (mm) 1District of Columbia $82,192 1California 39.7 2Maryland 81,294 2Texas 28.5 3Hawaii 80,637 3Florida 21.1 4Alaska 79,735 4New York 19.8 5New Jersey 78,317 5Pennsylvania 12.8 6Massachusetts 77,248 6Illinois 12.8 7Connecticut 76,633 7Ohio 11.6 8New Hampshire 75,742 8Georgia 10.5 9Virginia 71,167 9North Carolina 10.3 10California 71,061 10Michigan 9.9 11Washington 69,697 11New Jersey 9.0 12Utah 69,694 12Virginia 8.5 13Colorado 69,546 13Washington 7.4 14Minnesota 68,744 14Arizona 7.1 15New York 66,418 15Massachusetts 6.9 GDP ($bn) Fortune 500 Companies # State GDP ($bn) # State # of Companies 1California $2,717 1New York 54 2Texas 1,678 2California 53 3New York 1,539 3Texas 50 4Florida 965 4Illinois 36 5Illinois 812 5Ohio 25 6Pennsylvania 742 6Virginia 23 7Ohio 647 7New Jersey 21 8New Jersey 586 8Pennsylvania 21 9Georgia 551 9Connecticut 18 10North Carolina 539 10Minnesota 18 11Massachusetts 523 11Michigan 17 12Michigan 511 12Florida 17 13Virginia 508 13Georgia 17 14Washington 500 14Massachusetts 13 15Maryland 393 15North Carolina 12 ranked Virginia the 5 th Best State for Business • 3 rd in Labor Supply • 2 nd in Regulatory Environment • 14 th in Growth Prospects x Virginia has the 20 th lowest Unemployment Rate of any state ranked Virginia #11 for Economic Opportunity • 11 th lowest Poverty Rate • Virginia is home to 706,626 Small Businesses ranked Virginia 10 th of America’s Best States to Live In x 8 th most educated state in America and home to more than 10 elite colleges and universities 12
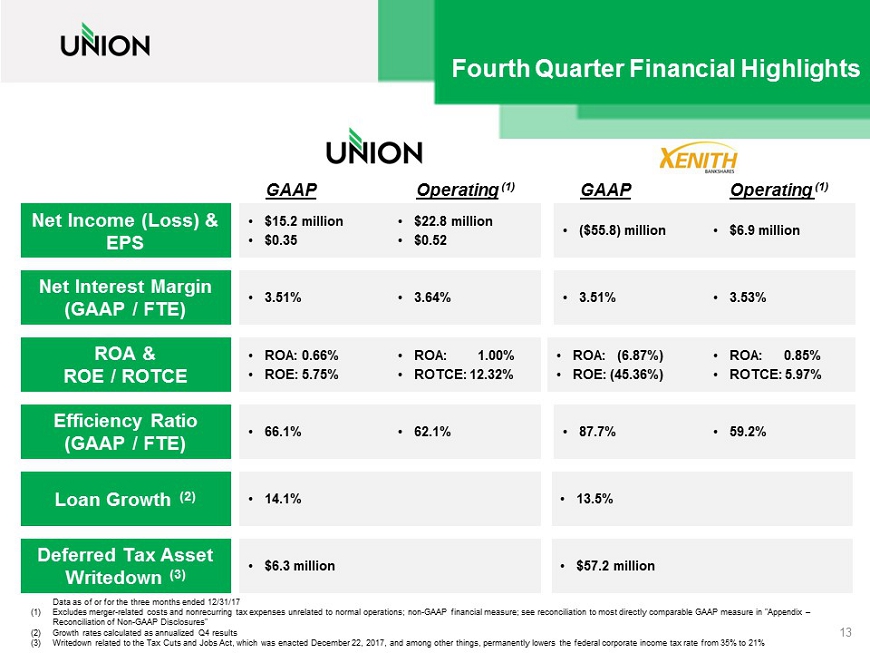
Fourth Quarter Financial Highlights Net Interest Margin (GAAP / FTE) Net Income (Loss) & EPS Efficiency Ratio (GAAP / FTE) Loan Growth (2) Deferred Tax Asset Writedown (3) ROA & ROE / ROTCE • 13.5% • $57.2 million 13 Data as of or for the three months ended 12/31/17 (1) Excludes merger - related costs and nonrecurring tax expenses unrelated to normal operations; non - GAAP financial measure; see reco nciliation to most directly comparable GAAP measure in "Appendix – Reconciliation of Non - GAAP Disclosures" (2) Growth rates calculated as annualized Q4 results (3) Writedown related to the Tax Cuts and Jobs Act, which was enacted December 22, 2017, and among other things, permanently lowers the fed er al corporate income tax rate from 35% to 21% • $15.2 million • $0.35 • $22.8 million • $0.52 • 3.51% • 3.64% • ROA: 0.66% • ROE: 5.75% • ROA: 1.00% • ROTCE: 12.32% • 66.1% • 62.1% • 14.1% • 3.51% • 3.53% • ROA: (6.87%) • ROE: (45.36%) • ROA: 0.85% • ROTCE: 5.97% • 87.7% • 59.2% • $6.3 million • ($55.8) million • $6.9 million GAAP Operating (1) GAAP Operating (1)
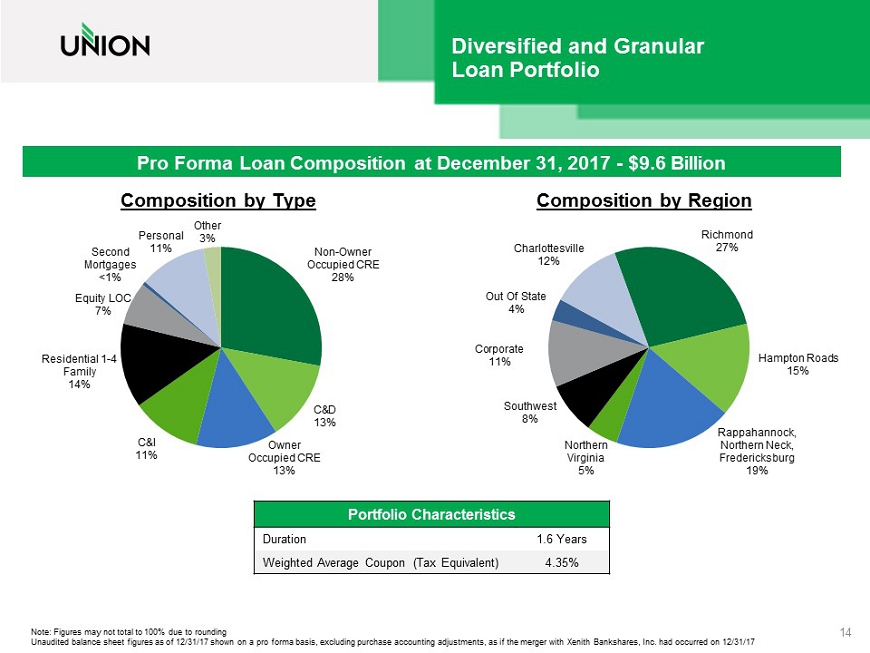
Diversified and Granular Loan Portfolio Composition by Region Composition by Type Pro Forma Loan Composition at December 31, 2017 - $9.6 Billion Non - Owner Occupied CRE 28% C&D 13% Owner Occupied CRE 13% C&I 11% Residential 1 - 4 Family 14% Equity LOC 7% Second Mortgages <1% Personal 11% Other 3% Richmond 27% Hampton Roads 15% Rappahannock, Northern Neck, Fredericksburg 19% Northern Virginia 5% Southwest 8% Corporate 11% Out Of State 4% Charlottesville 12% Portfolio Characteristics Duration 1.6 Years Weighted Average Coupon (Tax Equivalent) 4.35% Note: Figures may not total to 100% due to rounding Unaudited balance sheet figures as of 12/31/17 shown on a pro forma basis, excluding purchase accounting adjustments, as if t he merger with Xenith Bankshares, Inc. had occurred on 12/31/17 14
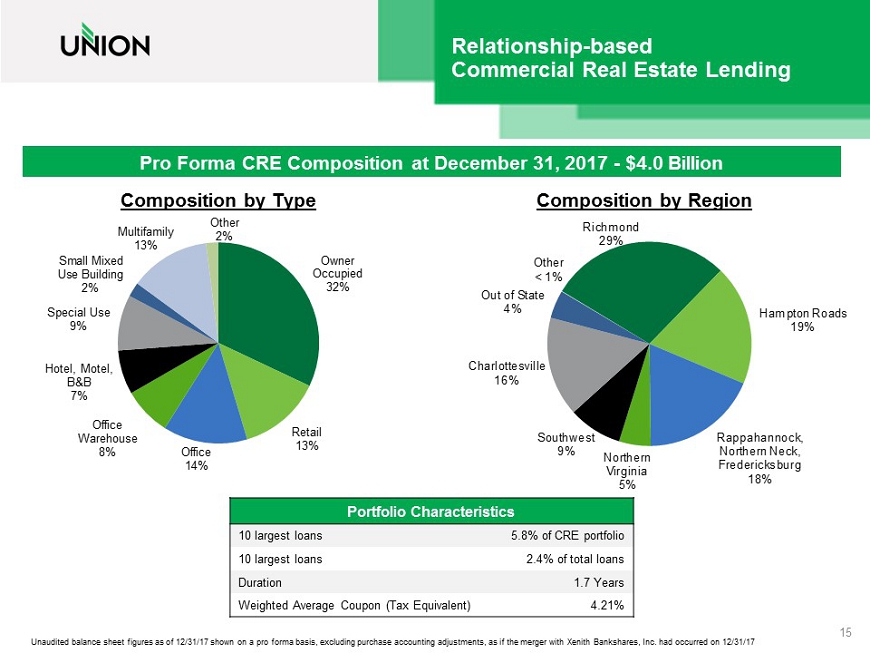
Relationship - based Commercial Real Estate Lending Pro Forma CRE Composition at December 31, 2017 - $4.0 Billion Unaudited balance sheet figures as of 12/31/17 shown on a pro forma basis, excluding purchase accounting adjustments, as if t he merger with Xenith Bankshares, Inc. had occurred on 12/31/17 Portfolio Characteristics 10 largest loans 5.8% of CRE portfolio 10 largest loans 2.4% of total loans Duration 1.7 Years Weighted Average Coupon (Tax Equivalent) 4.21% Owner Occupied 32% Retail 13% Office 14% Office Warehouse 8% Hotel, Motel, B&B 7% Special Use 9% Small Mixed Use Building 2% Multifamily 13% Other 2% Richmond 29% Hampton Roads 19% Rappahannock, Northern Neck, Fredericksburg 18% Northern Virginia 5% Southwest 9% Charlottesville 16% Out of State 4% Other < 1% 15 Composition by Region Composition by Type

Strong Credit Quality Dollars in thousands Data as of 12/31/17 16 UBSH XBKS Asset Quality Summary Nonaccrual Loans $21,743 $19,637 Other Real Estate 6,636 4,214 Renegotiated Loans 17,402 20,501 90+ Days Delinquent 3,532 -- Total Nonperforming Assets & 90+PD $49,313 $44,352 NPLs / Loans 0.30% 0.79% NPAs + 90PD / Assets 0.53% 1.36% ALLL / Total Loans 0.54% 0.67% Summary Asset Quality Information
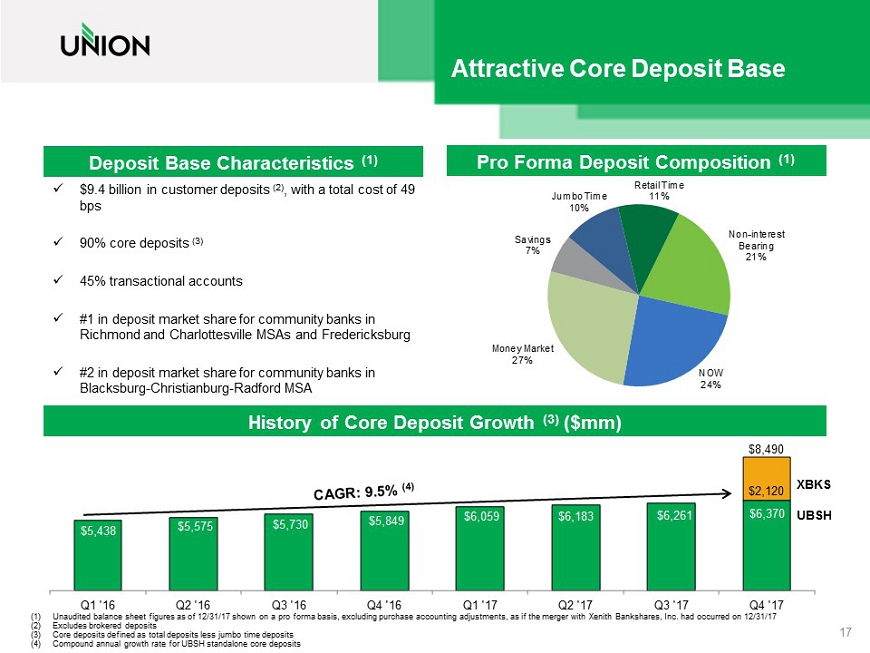
Attractive Core Deposit Base x $9.4 billion in customer deposits (2) , with a total cost of 49 bps x 90% core deposits (3) x 45% transactional accounts x #1 in deposit market share for community banks in Richmond and Charlottesville MSAs and Fredericksburg x #2 in deposit market share for community banks in Blacksburg - Christianburg - Radford MSA Non - interest Bearing 21% NOW 24% Money Market 27% Savings 7% Jumbo Time 10% Retail Time 11% Pro Forma Deposit Composition (1) History of Core Deposit Growth (3) ($mm) $5,438 $5,575 $5,730 $5,849 $6,059 $6,183 $6,261 $6,370 $2,120 Q1 '16 Q2 '16 Q3 '16 Q4 '16 Q1 '17 Q2 '17 Q3 '17 Q4 '17 Deposit Base Characteristics (1) 17 $8,490 (1) Unaudited balance sheet figures as of 12/31/17 shown on a pro forma basis, excluding purchase accounting adjustments, as if t he merger with Xenith Bankshares, Inc. had occurred on 12/31/17 (2) Excludes brokered deposits (3) Core deposits defined as total deposits less jumbo time deposits (4) Compound annual growth rate for UBSH standalone core deposits XBKS UBSH
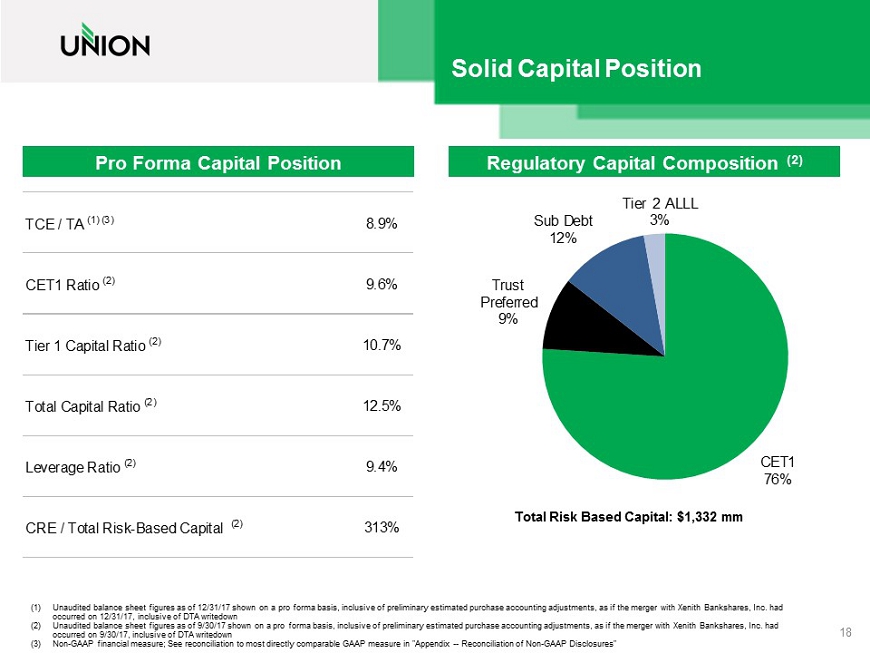
(1) Unaudited balance sheet figures as of 12/31/17 shown on a pro forma basis, inclusive of preliminary estimated purchase accoun tin g adjustments, as if the merger with Xenith Bankshares, Inc. had occurred on 12/31/17, inclusive of DTA writedown (2) Unaudited balance sheet figures as of 9/30/17 shown on a pro forma basis, inclusive of preliminary estimated purchase account ing adjustments, as if the merger with Xenith Bankshares, Inc. had occurred on 9/30/17, inclusive of DTA writedown (3) Non - GAAP financial measure; See reconciliation to most directly comparable GAAP measure in "Appendix -- Reconciliation of Non - GA AP Disclosures" Solid Capital Position Pro Forma Capital Position Regulatory Capital Composition (2) Total Risk Based Capital: $1,332 mm 18 CET1 76% Trust Preferred 9% Sub Debt 12% Tier 2 ALLL 3% TCE / TA (1) (3) 8.9% CET1 Ratio (2) 9.6% Tier 1 Capital Ratio (2) 10.7% Total Capital Ratio (2) 12.5% Leverage Ratio (2) 9.4% CRE / Total Risk-Based Capital (2) 313%

Strong Track Record of Performance (GAAP) NIM (%) ROA (%) Data as of or for the twelve months ended each respective year ROE (%) Efficiency Ratio (%) 19 0.85% 0.72% 0.90% 0.96% 0.83% 2013 2014 2015 2016 2017 4.08% 3.96% 3.75% 3.66% 3.49% 2013 2014 2015 2016 2017 7.89% 5.30% 6.76% 7.79% 7.07% 2013 2014 2015 2016 2017 72.0% 75.3% 68.5% 66.3% 66.7% 2013 2014 2015 2016 2017
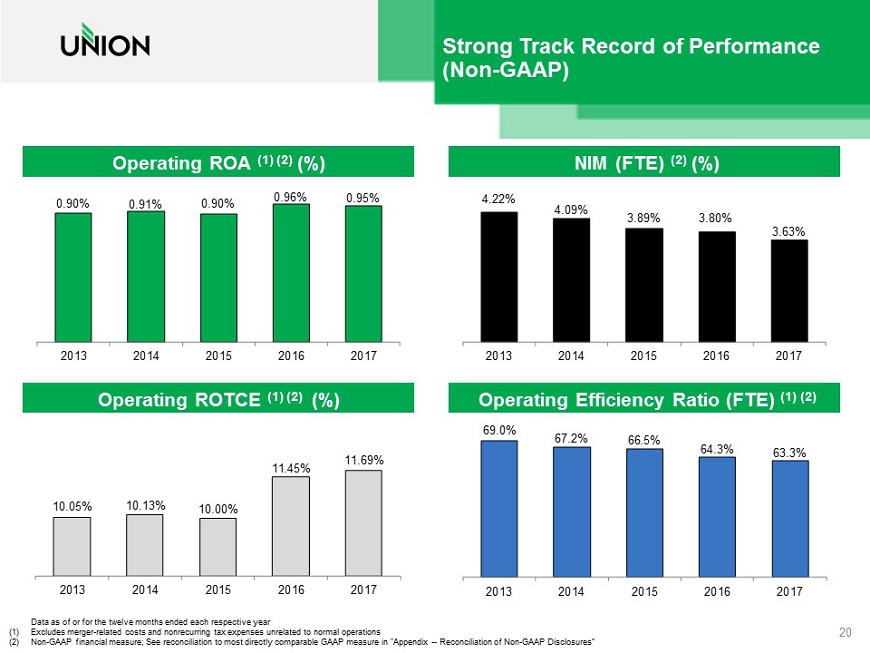
Strong Track Record of Performance (Non - GAAP) NIM (FTE) (2) (%) Operating ROA (1) (2) (%) Data as of or for the twelve months ended each respective year (1) Excludes merger - related costs and nonrecurring tax expenses unrelated to normal operations (2) Non - GAAP financial measure; See reconciliation to most directly comparable GAAP measure in "Appendix -- Reconciliation of Non - GA AP Disclosures” Operating ROTCE (1) (2) (%) Operating Efficiency Ratio (FTE) (1) (2) (%) 0.90% 0.91% 0.90% 0.96% 0.95% 2013 2014 2015 2016 2017 4.22% 4.09% 3.89% 3.80% 3.63% 2013 2014 2015 2016 2017 69.0% 67.2% 66.5% 64.3% 63.3% 2013 2014 2015 2016 2017 10.05% 10.13% 10.00% 11.45% 11.69% 2013 2014 2015 2016 2017 20
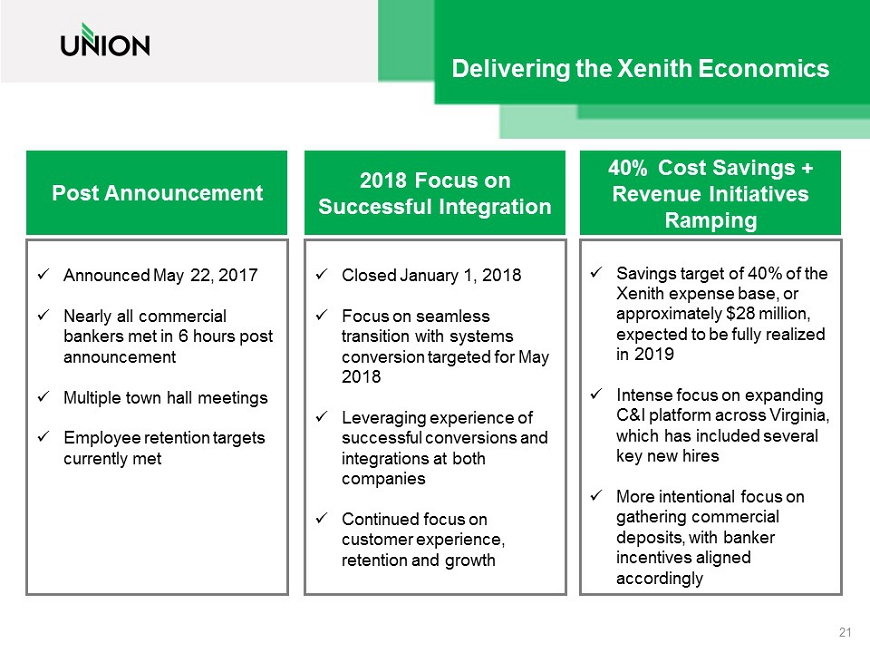
Delivering the Xenith Economics x Closed January 1, 2018 x Focus on seamless transition with systems conversion targeted for May 2018 x Leveraging experience of successful conversions and integrations at both companies x Continued focus on customer experience, retention and growth 2018 Focus on Successful Integration 40% Cost Savings + Revenue Initiatives Ramping x Savings target of 40% of the Xenith expense base, or approximately $28 million, expected to be fully realized in 2019 x Intense focus on expanding C&I platform across Virginia, which has included several key new hires x More intentional focus on gathering commercial deposits, with banker incentives aligned accordingly x Announced May 22, 2017 x Nearly all commercial bankers met in 6 hours post announcement x Multiple town hall meetings x Employee retention targets currently met Post Announcement 21

• Increase Commercial lending growth (Commercial & Industrial + Owner Occupied Real Estate) in order to better balance the total loan portfolio over time • Grow fee - based products and services • Achieve and sustain top tier financial performance • Invest in talent, develop a culture of coaching and development, and align total rewards with corporate goals and objectives • Leverage commercial expertise and new market opportunities • Achieve cost saves and successful conversion • Create differentiated client experiences that make banking easier • Continue to build our brand in existing and new geographies • Fund loan growth with deposit growth; attain a 95% loan to deposit ratio over time • Grow core deposits with particular focus on increasing commercial and small business operating accounts • Leverage technology to lower cost, improve quality and support growth • Build scalable, replicable processes Manage to Higher Levels of Performance Diversify Loan Portfolio and Revenue Streams Integrate Xenith Create a More Enduring and Distinctive Brand Grow Core Funding Improve Efficiency 22 Union’s 2018 Strategic Priorities
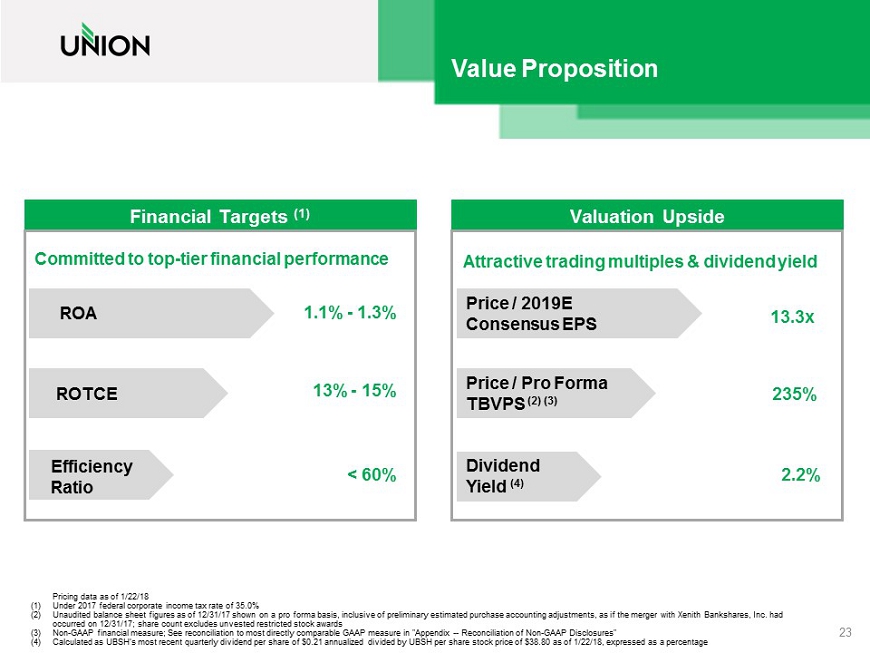
Pricing data as of 1/22/18 (1) Under 2017 federal corporate income tax rate of 35.0% (2) Unaudited balance sheet figures as of 12/31/17 shown on a pro forma basis, inclusive of preliminary estimated purchase accoun tin g adjustments, as if the merger with Xenith Bankshares, Inc. had occurred on 12/31/17; share count excludes unvested restricted stock awards (3) Non - GAAP financial measure; See reconciliation to most directly comparable GAAP measure in "Appendix -- Reconciliation of Non - GA AP Disclosures" (4) Calculated as UBSH’s most recent quarterly dividend per share of $0.21 annualized divided by UBSH per share stock price of $38.80 as of 1/ 22/ 18, expressed as a percentage Value Proposition Financial Targets (1) ROA ROTCE Efficiency Ratio 1.1% - 1.3% 13% - 15% < 60% Valuation Upside Committed to top - tier financial performance Attractive trading multiples & dividend yield Dividend Yield (4) Price / 2019E Consensus EPS Price / Pro Forma TBVPS (2) (3) 13.3x 235% 2.2% 23
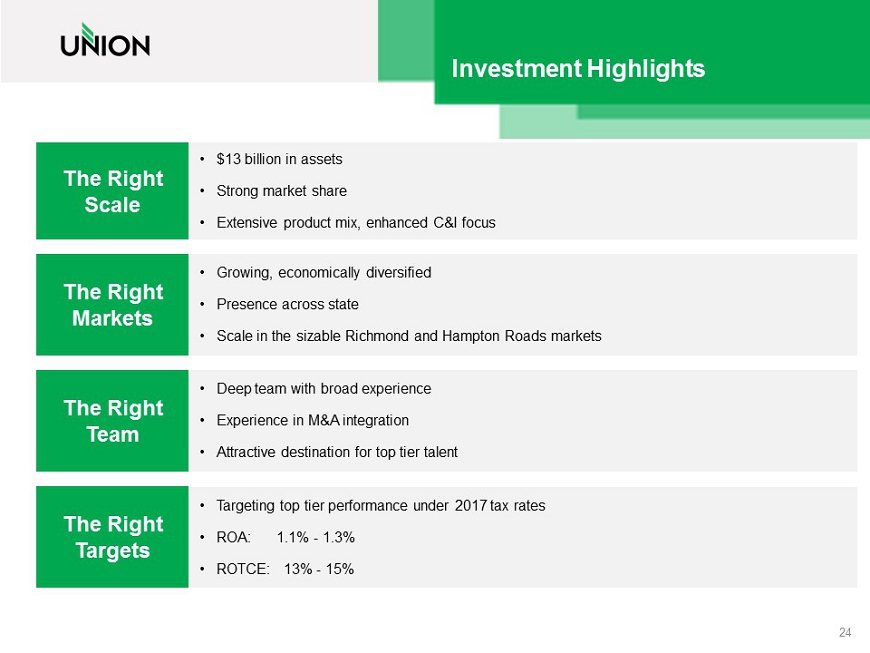
Investment Highlights The Right Scale The Right Markets The Right Team The Right Targets • Deep team with broad experience • Experience in M&A integration • Attractive destination for top tier talent • Targeting top tier performance under 2017 tax rates • ROA: 1.1% - 1.3% • ROTCE: 13% - 15% • $13 billion in assets • Strong market share • Extensive product mix, enhanced C&I focus • Growing, economically diversified • Presence across state • Scale in the sizable Richmond and Hampton Roads markets 24

Appendix
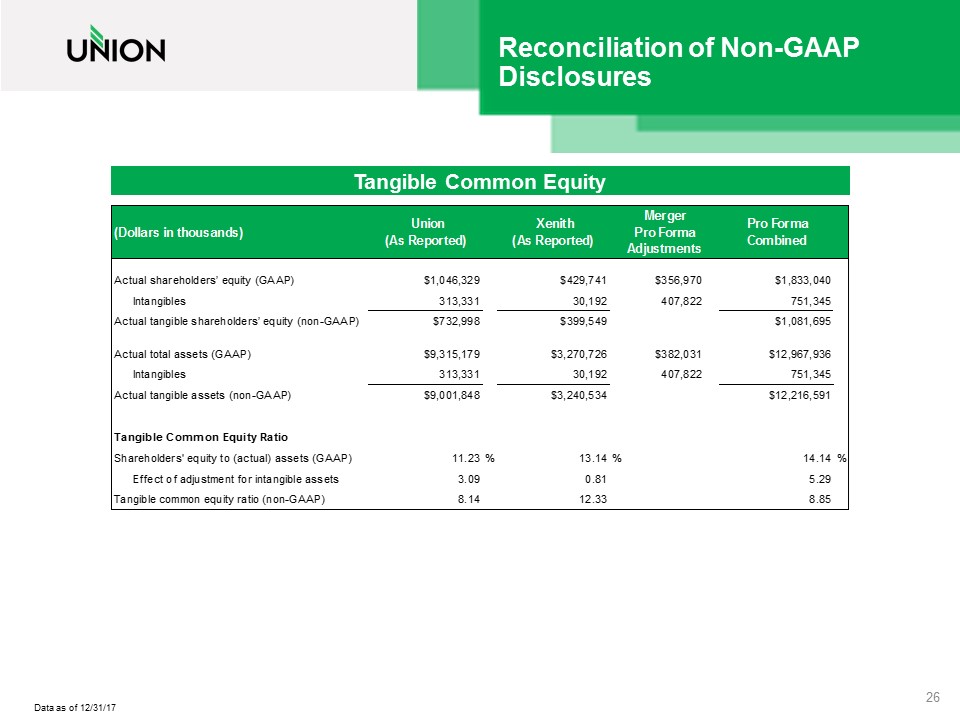
Data as of 12/31/17 Reconciliation of Non - GAAP Disclosures 26 Tangible Common Equity (Dollars in thousands) Union (As Reported) Xenith (As Reported) Merger Pro Forma Adjustments Pro Forma Combined Actual shareholders’ equity (GAAP) $1,046,329 $429,741 $356,970 $1,833,040 Intangibles 313,331 30,192 407,822 751,345 Actual tangible shareholders’ equity (non-GAAP) $732,998 $399,549 $1,081,695 Actual total assets (GAAP) $9,315,179 $3,270,726 $382,031 $12,967,936 Intangibles 313,331 30,192 407,822 751,345 Actual tangible assets (non-GAAP) $9,001,848 $3,240,534 $12,216,591 Tangible Common Equity Ratio Shareholders' equity to (actual) assets (GAAP) 11.23% 13.14% 14.14% Effect of adjustment for intangible assets 3.09 0.81 5.29 Tangible common equity ratio (non-GAAP) 8.14 12.33 8.85
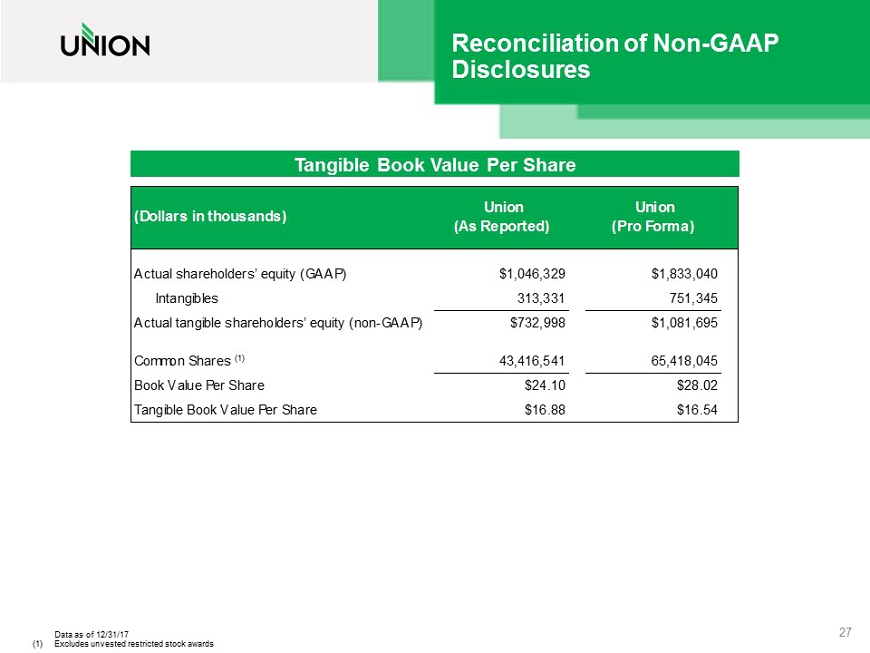
Reconciliation of Non - GAAP Disclosures 27 Tangible Book Value Per Share (Dollars in thousands) Union (As Reported) Union (Pro Forma) Actual shareholders’ equity (GAAP) $1,046,329 $1,833,040 Intangibles 313,331 751,345 Actual tangible shareholders’ equity (non-GAAP) $732,998 $1,081,695 Common Shares (1) 43,416,541 65,418,045 Book Value Per Share $24.10 $28.02 Tangible Book Value Per Share $16.88 $16.54 Data as of 12/31/17 (1) Excludes unvested restricted stock awards
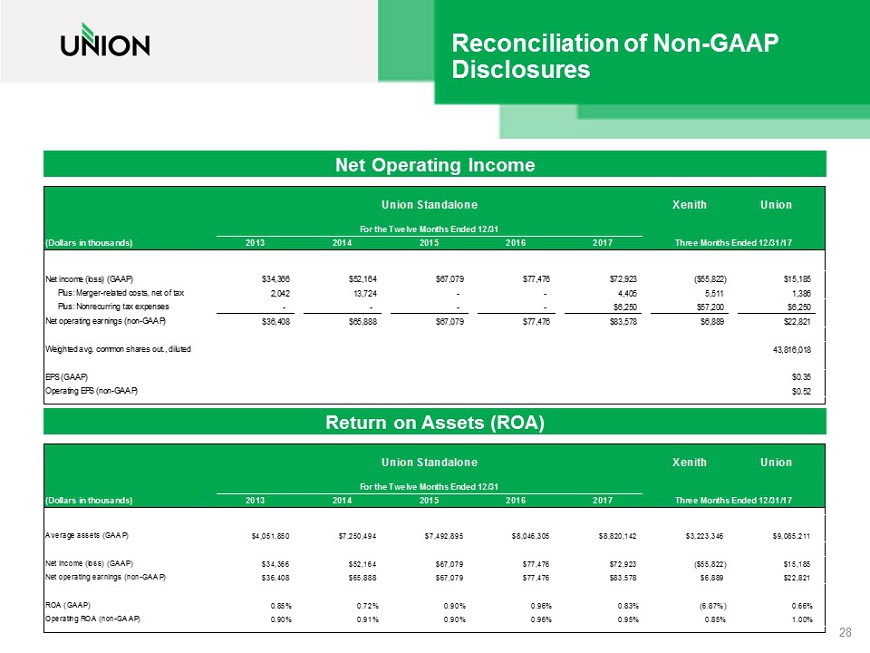
Reconciliation of Non - GAAP Disclosures 28 Net Operating Income Return on Assets (ROA) Union Standalone Xenith Union For the Twelve Months Ended 12/31 (Dollars in thousands) 2013 2014 2015 2016 2017 Three Months Ended 12/31/17 Average assets (GAAP) $4,051,850 $7,250,494 $7,492,895 $8,046,305 $8,820,142 $3,223,346 $9,085,211 Net income (loss) (GAAP) $34,366 $52,164 $67,079 $77,476 $72,923 ($55,822) $15,185 Net operating earnings (non-GAAP) $36,408 $65,888 $67,079 $77,476 $83,578 $6,889 $22,821 ROA (GAAP) 0.85% 0.72% 0.90% 0.96% 0.83% (6.87%) 0.66% Operating ROA (non-GAAP) 0.90% 0.91% 0.90% 0.96% 0.95% 0.85% 1.00% Union Standalone Xenith Union For the Twelve Months Ended 12/31 (Dollars in thousands) 2013 2014 2015 2016 2017 Three Months Ended 12/31/17 Net income (loss) (GAAP) $34,366 $52,164 $67,079 $77,476 $72,923 ($55,822) $15,185 Plus: Merger-related costs, net of tax 2,042 13,724 - - 4,405 5,511 1,386 Plus: Nonrecurring tax expenses - - - - $6,250 $57,200 $6,250 Net operating earnings (non-GAAP) $36,408 $65,888 $67,079 $77,476 $83,578 $6,889 $22,821 Weighted avg. common shares out., diluted 43,816,018 EPS (GAAP) $0.35 Operating EPS (non-GAAP) $0.52
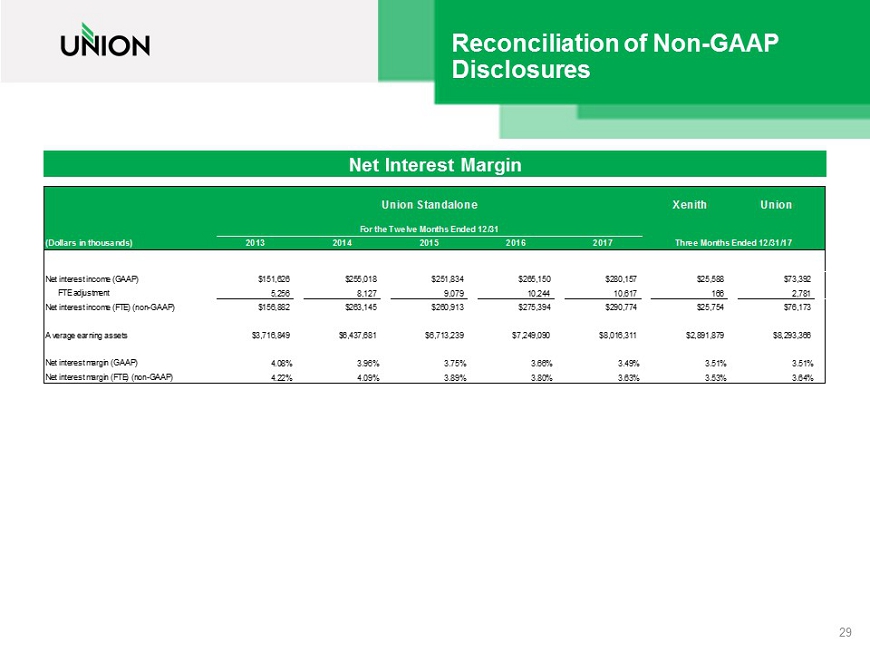
Reconciliation of Non - GAAP Disclosures 29 Net Interest Margin Union Standalone Xenith Union For the Twelve Months Ended 12/31 (Dollars in thousands) 2013 2014 2015 2016 2017 Three Months Ended 12/31/17 Net interest income (GAAP) $151,626 $255,018 $251,834 $265,150 $280,157 $25,588 $73,392 FTE adjustment 5,256 8,127 9,079 10,244 10,617 166 2,781 Net interest income (FTE) (non-GAAP) $156,882 $263,145 $260,913 $275,394 $290,774 $25,754 $76,173 Average earning assets $3,716,849 $6,437,681 $6,713,239 $7,249,090 $8,016,311 $2,891,879 $8,293,366 Net interest margin (GAAP) 4.08% 3.96% 3.75% 3.66% 3.49% 3.51% 3.51% Net interest margin (FTE) (non-GAAP) 4.22% 4.09% 3.89% 3.80% 3.63% 3.53% 3.64%

Reconciliation of Non - GAAP Disclosures 30 Return on Tangible Common Equity (ROTCE) Union Standalone Xenith Union For the Twelve Months Ended 12/31 (Dollars in thousands) 2013 2014 2015 2016 2017 Three Months Ended 12/31/17 Average equity (GAAP) $435,635 $983,727 $991,977 $994,785 $1,030,847 $488,269 $1,048,632 Less: Average intangibles 73,205 333,495 320,906 318,131 315,722 30,267 313,785 Average tangible common equity (non-GAAP) $362,430 $650,232 $671,071 $676,654 $715,125 $458,002 $734,847 Net income (loss) (GAAP) $34,366 $52,164 $67,079 $77,476 $72,923 ($55,822) $15,185 Net operating earnings (non-GAAP) $36,408 $65,888 $67,079 $77,476 $83,578 $6,889 $22,821 ROE (GAAP) 7.89% 5.30% 6.76% 7.79% 7.07% (45.36%) 5.75% ROTCE (non-GAAP) 9.48% 8.02% 10.00% 11.45% 10.20% (48.36%) 8.20% Operating ROTCE (non-GAAP) 10.05% 10.13% 10.00% 11.45% 11.69% 5.97% 12.32%

Reconciliation of Non - GAAP Disclosures 31 Efficiency Ratio Union Standalone Xenith Union For the Twelve Months Ended 12/31 (Dollars in thousands) 2013 2014 2015 2016 2017 Three Months Ended 12/31/17 Noninterest expense (GAAP) $137,047 $238,216 $216,882 $222,703 $234,765 $25,557 $59,944 Less: Merger-related costs 2,132 20,345 - - 5,393 8,214 1,917 Operating noninterest expense (non-GAAP) $134,915 $217,871 $216,882 $222,703 $229,372 $17,343 $58,027 Noninterest income (GAAP) $38,728 $61,287 $65,007 $70,907 $71,674 $3,563 $17,243 Net interest income (FTE) (non-GAAP) $156,882 $263,145 $260,913 $275,394 $290,774 $25,754 $76,173 Efficiency ratio (GAAP) 72.0% 75.3% 68.5% 66.3% 66.7% 87.7% 66.1% Efficiency ratio (FTE) (non-GAAP) 70.1% 73.4% 66.5% 64.3% 64.8% 87.2% 64.2% Operating efficiency ratio (FTE) (non-GAAP) 69.0% 67.2% 66.5% 64.3% 63.3% 59.2% 62.1%