Issuer Free Writing Prospectus
Dated November 29, 2016
Filed Pursuant to Rule 433
Registration No. 333-198710
Union Bankshares Corporation (NASDAQ: UBSH) Subordinated Notes Offering November 2016
This image cannot currently be displayed. Forward - Looking Statements This presentation has been prepared by Union Bankshares Corporation (“Union” or the “Company”) solely for informational purposes based on information regarding its operations, as well as information from public sources. This presentation has been prepared to assist interested parties in making their own evaluation of Union and does not purport to contain all of the information that may be relevant or material to an interested party’s investment decision. In all cases, interested parti es should conduct their own investigation and analysis of Union, the information set forth in this presentation, included in or incorporated by reference into the prospectus supplemen t, and other information provided by or on behalf of Union. This presentation does not constitute an offer to sell, or a solicitation of an offer to buy, any securities of Union by any per son in any jurisdiction in which it is unlawful for such person to make such an offering or solicitation. Neither the Securities and Exchange Commission nor any other regulatory body has approved or disapproved of the securities of Union o r p assed upon the accuracy or adequacy of this presentation. Any representation to the contrary is a criminal offense. Securities of Union are not deposits or insured by the FDIC or any other agency. Except where information is provided as of a specified date, this presentation speaks as of the date hereof. The delivery of this pr ese ntation shall not, under any circumstances, create any implication that there has been no change in the affairs of the Company after the date hereof. Certain of the information contained herein may be derived from information provided by industry sources. Union believes that such in for mation is accurate and that the sources from which it has been obtained are reliable. Union cannot guarantee the accuracy of such information, however, and has not indepe nde ntly verified such information. Certain statements in this report may constitute “forward - looking statements” within the meaning of the Private Securities Litig ation Reform Act of 1995. Forward - looking statements are statements that include projections, predictions, expectations, or beliefs about future events or results or otherwise an d a re not statements of historical fact. Such statements are often characterized by the use of qualified words (and their derivatives) such as “expect,” “believe,” “estimate,” “plan,” “p roj ect,” “anticipate,” “intend,” “will,” or words of similar meaning or other statements concerning opinions or judgment of the Company and its management about future events. Although the Compa ny believes that its expectations with respect to forward - looking statements are based upon reasonable assumptions within the bounds of its existing knowledge of its business and operations, there can be no assurance that actual results, performance, or achievements of the Company will not differ materially from any future results, performance, or achi eve ments expressed or implied by such forward - looking statements. Actual future results and trends may differ materially from historical results or those anticipated depending on a v ariety of factors, including, but not limited to, the effects of and changes in: general economic and bank industry conditions, the interest rate environment, legislative and regulatory requ ire ments, competitive pressures, new products and delivery systems, inflation, changes in the stock and bond markets, changes in accounting standards or interpretations of exi sti ng standards, mergers and acquisitions, technology, and consumer spending and savings habits. For details on factors that could affect these expectations, see the risk factors a nd other cautionary statement in the Company’s annual report on Form 10 - K and other periodic reports filed with the Securities and Exchange Commission, which are available on the Com pany’s website, http://investors.bankatunion.com and on the Securities and Exchange Commission’s website, www.sec.gov. The information on the Company’s website is not a part of this presentation. The Company does not intend or assume any obligation to update or revise any forward - looking statements that may be made from time to time by or on behalf o f the Company. Union has filed a registration statement (including a prospectus) and a prospectus supplement which is preliminary and subject to c omp letion, with the Securities and Exchange Commission for the offering to which this communication relates. Before you invest, you should read the prospectus in that re gis tration statement, the preliminary prospectus supplement and the other documents that Union has filed with the Securities and Exchange Commission for more complete informa tio n about Union and the offering. You may get these documents for free by visiting the SEC web site at www.sec.gov. Alternatively, the Company, any underwriter or any deal er participating in the offering will arrange to send you the prospectus if you request it by contacting: Sandler O’Neill + Partners, L.P. at toll - free 1 - 866 - 805 - 4128 or by emailing synd icate@sandleroneill.com. 2
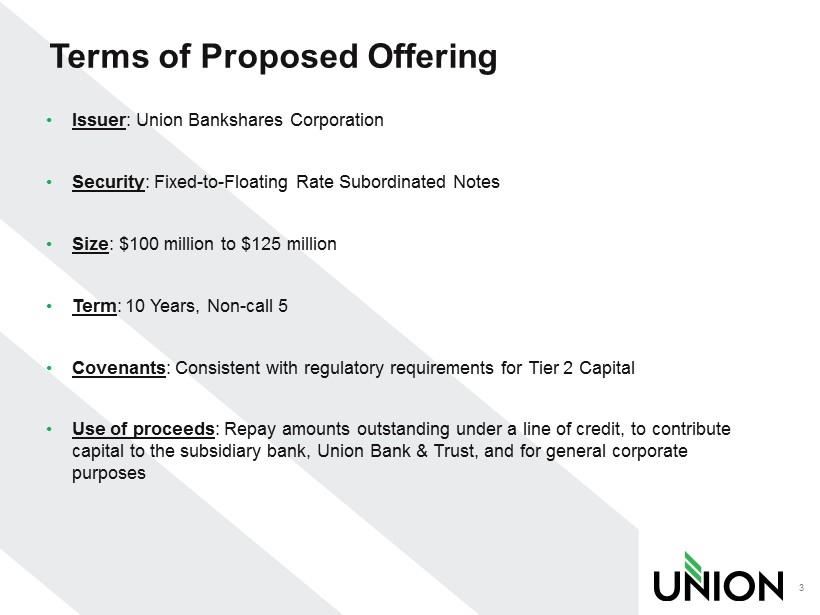
Terms of Proposed Offering • Issuer : Union Bankshares Corporation • Security : Fixed - to - Floating Rate Subordinated Notes • Size : $100 million to $125 million • Term : 10 Years, Non - call 5 • Covenants : Consistent with regulatory requirements for Tier 2 Capital • Use of proceeds : Repay amounts outstanding under a line of credit, to contribute capital to the subsidiary bank, Union Bank & Trust, and for general corporate purposes 3
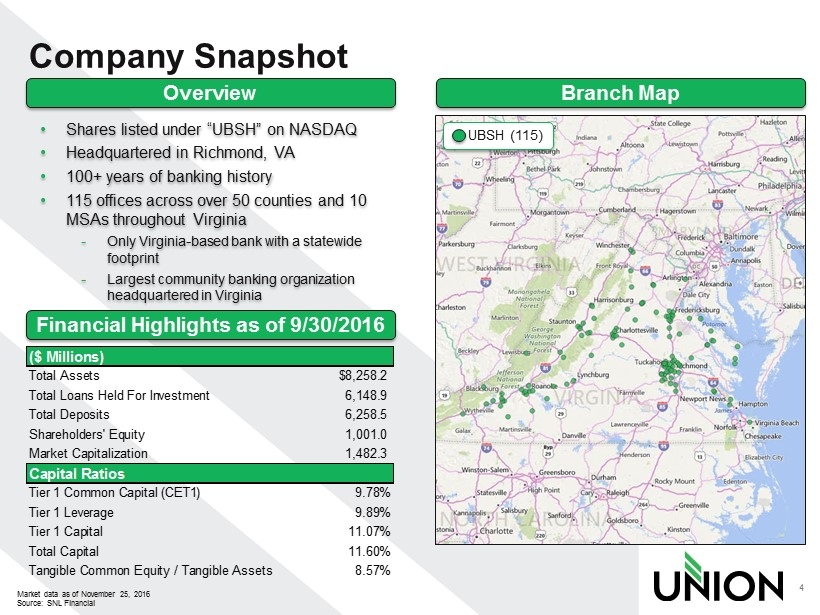
Company Snapshot 4 Overview Branch Map • Shares listed under “UBSH” on NASDAQ • Headquartered in Richmond, VA • 100+ years of banking history • 115 offices across over 50 counties and 10 MSAs throughout Virginia - Only Virginia - based bank with a statewide footprint - Largest community banking organization headquartered in Virginia Financial Highlights as of 9/30/2016 Market data as of November 25, 2016 Source: SNL Financial UBSH (115) ($ Millions) Total Assets $8,258.2 Total Loans Held For Investment 6,148.9 Total Deposits 6,258.5 Shareholders' Equity 1,001.0 Market Capitalization 1,482.3 Capital Ratios Tier 1 Common Capital (CET1) 9.78% Tier 1 Leverage 9.89% Tier 1 Capital 11.07% Total Capital 11.60% Tangible Common Equity / Tangible Assets 8.57%
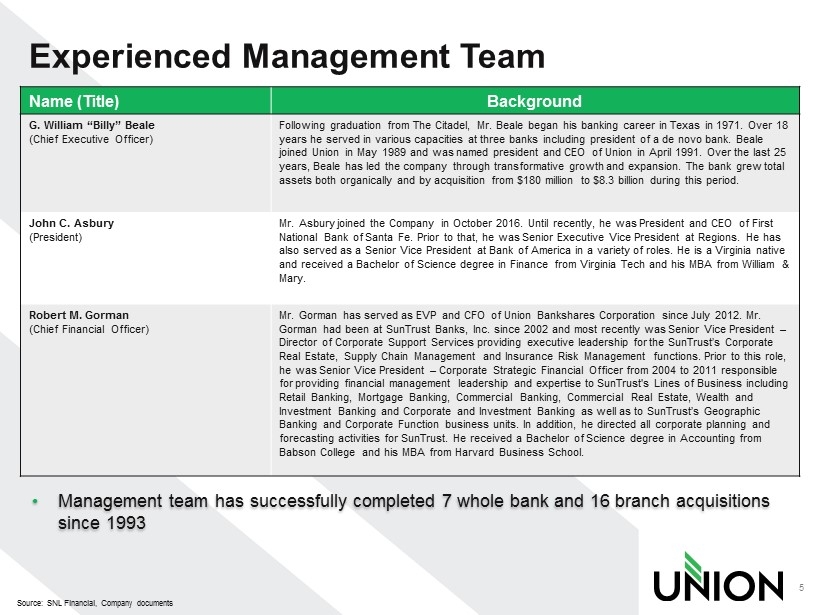
Experienced Management Team 5 Name (Title) Background G. William “Billy” Beale (Chief Executive Officer) Following graduation from The Citadel, Mr. Beale began his banking career in Texas in 1971. Over 18 years he served in various capacities at three banks including president of a de novo bank. Beale joined Union in May 1989 and was named president and CEO of Union in April 1991. Over the last 25 years, Beale has led the company through transformative growth and expansion. The bank grew total assets both organically and by acquisition from $180 million to $8.3 billion during this period. John C. Asbury (President) Mr. Asbury joined the Company in October 2016. Until recently, he was President and CEO of First National Bank of Santa Fe. Prior to that, he was Senior Executive Vice President at Regions. He has also served as a Senior Vice President at Bank of America in a variety of roles. He is a Virginia native and received a Bachelor of Science degree in Finance from Virginia Tech and his MBA from William & Mary. Robert M. Gorman (Chief Financial Officer) Mr. Gorman has served as EVP and CFO of Union Bankshares Corporation since July 2012. Mr. Gorman had been at SunTrust Banks, Inc. since 2002 and most recently was Senior Vice President – Director of Corporate Support Services providing executive leadership for the SunTrust’s Corporate Real Estate, Supply Chain Management and Insurance Risk Management functions. Prior to this role, he was Senior Vice President – Corporate Strategic Financial Officer from 2004 to 2011 responsible for providing financial management leadership and expertise to SunTrust's Lines of Business including Retail Banking, Mortgage Banking, Commercial Banking, Commercial Real Estate, Wealth and Investment Banking and Corporate and Investment Banking as well as to SunTrust’s Geographic Banking and Corporate Function business units. In addition, he directed all corporate planning and forecasting activities for SunTrust. He received a Bachelor of Science degree in Accounting from Babson College and his MBA from Harvard Business School. Source: SNL Financial, Company documents • Management team has successfully completed 7 whole bank and 16 branch acquisitions since 1993
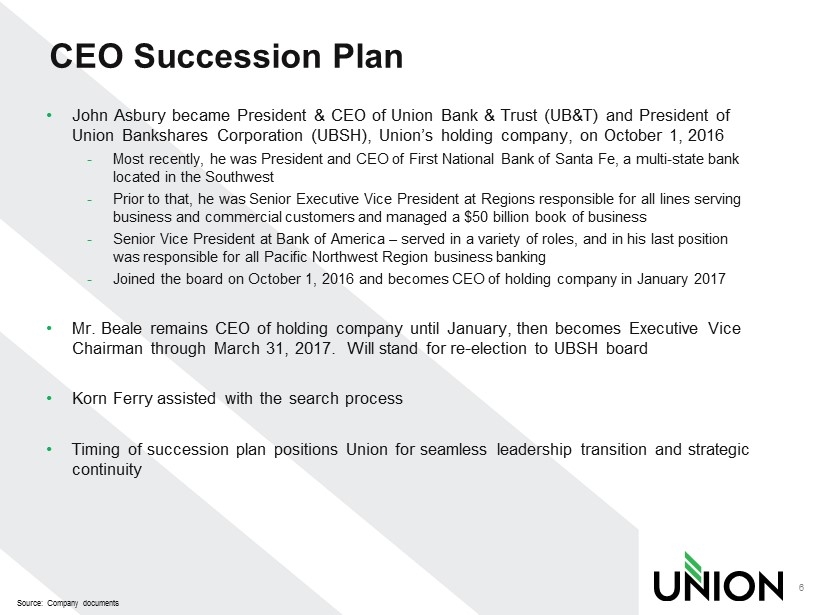
CEO Succession Plan • John Asbury became President & CEO of Union Bank & Trust (UB&T) and President of Union Bankshares Corporation (UBSH), Union’s holding company, on October 1, 2016 - Most recently, he was President and CEO of First National Bank of Santa Fe, a multi - state bank located in the Southwest - Prior to that, he was Senior Executive Vice President at Regions responsible for all lines serving business and commercial customers and managed a $50 billion book of business - Senior Vice President at Bank of America – served in a variety of roles, and in his last position was responsible for all Pacific Northwest Region business banking - J oined the board on October 1, 2016 and becomes CEO of holding company in January 2017 • Mr. Beale remains CEO of holding company until January, then becomes Executive Vice Chairman through March 31, 2017. Will stand for re - election to UBSH board • Korn Ferry assisted with the search process • Timing of succession plan positions Union for seamless leadership transition and strategic continuity 6 Source: Company documents
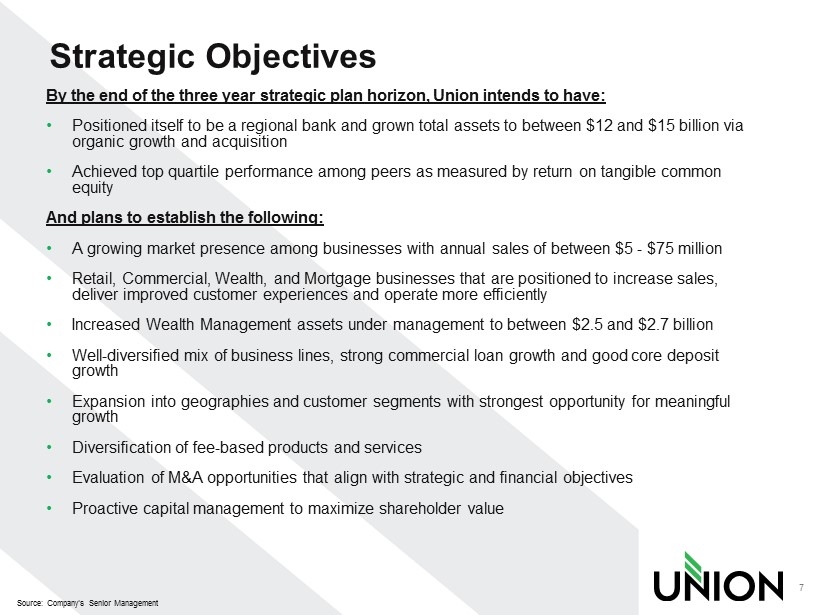
Strategic Objectives By the end of the three year strategic plan horizon, Union intends to have: • Positioned itself to be a regional bank and grown total assets to between $12 and $15 billion via organic growth and acquisition • Achieved top quartile performance among peers as measured by return on tangible common equity And plans to establish the following: • A growing market presence among businesses with annual sales of between $5 - $75 million • Retail, Commercial, Wealth, and Mortgage businesses that are positioned to increase sales, deliver improved customer experiences and operate more efficiently • Increased Wealth Management assets under management to between $2.5 and $2.7 billion • Well - diversified mix of business lines, strong commercial loan growth and good core deposit growth • Expansion into geographies and customer segments with strongest opportunity for meaningful growth • Diversification of fee - based products and services • Evaluation of M&A opportunities that align with strategic and financial objectives • Proactive capital management to maximize shareholder value 7 Source: Company’s Senior Management
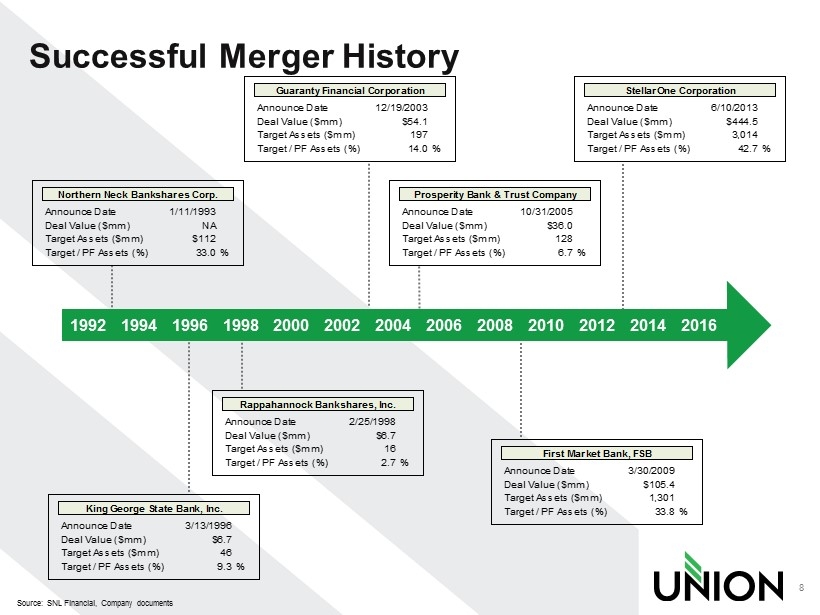
Successful Merger History 8 Source: SNL Financial, Company documents 1992 1994 1998 2000 2002 2004 2006 2008 2010 2012 2014 2016 Northern Neck Bankshares Corp. Announce Date 1/11/1993 Deal Value ($mm) NA Target Assets ($mm) $112 Target / PF Assets (%) 33.0% King George State Bank, Inc. Announce Date 3/13/1996 Deal Value ($mm) $6.7 Target Assets ($mm) 46 Target / PF Assets (%) 9.3% 1996 Rappahannock Bankshares, Inc. Announce Date 2/25/1998 Deal Value ($mm) $6.7 Target Assets ($mm) 16 Target / PF Assets (%) 2.7% Guaranty Financial Corporation Announce Date 12/19/2003 Deal Value ($mm) $54.1 Target Assets ($mm) 197 Target / PF Assets (%) 14.0% Prosperity Bank & Trust Company Announce Date 10/31/2005 Deal Value ($mm) $36.0 Target Assets ($mm) 128 Target / PF Assets (%) 6.7% First Market Bank, FSB Announce Date 3/30/2009 Deal Value ($mm) $105.4 Target Assets ($mm) 1,301 Target / PF Assets (%) 33.8% StellarOne Corporation Announce Date 6/10/2013 Deal Value ($mm) $444.5 Target Assets ($mm) 3,014 Target / PF Assets (%) 42.7%
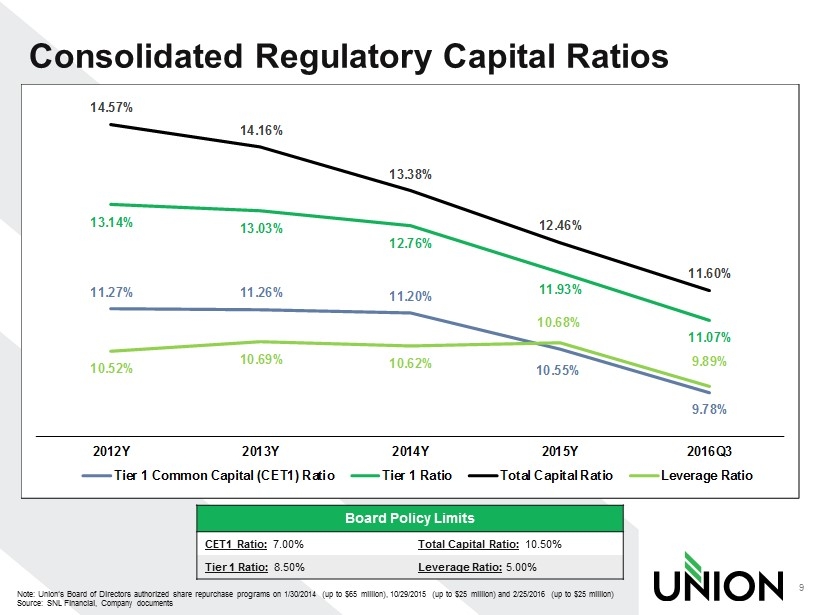
Consolidated Regulatory Capital Ratios 9 Note: Union’s Board of Directors authorized share repurchase programs on 1/30/2014 (up to $65 million), 10/29/2015 (up to $25 mi llion) and 2/25/2016 (up to $25 million) Source: SNL Financial, Company documents 11.27% 11.26% 11.20% 10.55% 9.78% 13.14% 13.03% 12.76% 11.93% 11.07% 14.57% 14.16% 13.38% 12.46% 11.60% 10.52% 10.69% 10.62% 10.68% 9.89% 2012Y 2013Y 2014Y 2015Y 2016Q3 Tier 1 Common Capital (CET1) Ratio Tier 1 Ratio Total Capital Ratio Leverage Ratio Board Policy Limits CET1 Ratio: 7.00% Total Capital Ratio: 10.50% Tier 1 Ratio: 8.50% Leverage Ratio: 5.00%
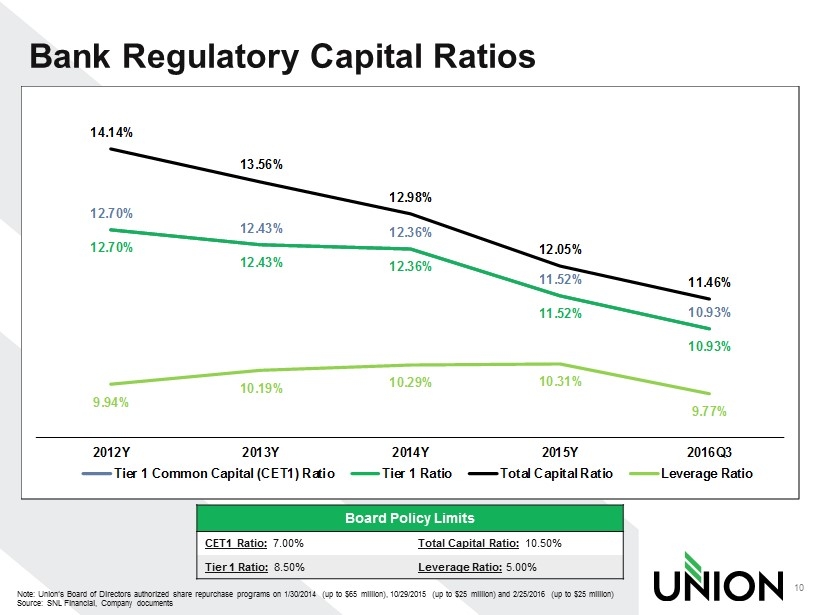
Bank Regulatory Capital Ratios 10 Note: Union’s Board of Directors authorized share repurchase programs on 1/30/2014 (up to $65 million), 10/29/2015 (up to $25 mi llion) and 2/25/2016 (up to $25 million) Source: SNL Financial, Company documents 12.70% 12.43% 12.36% 11.52% 10.93% 12.70% 12.43% 12.36% 11.52% 10.93% 14.14% 13.56% 12.98% 12.05% 11.46% 9.94% 10.19% 10.29% 10.31% 9.77% 2012Y 2013Y 2014Y 2015Y 2016Q3 Tier 1 Common Capital (CET1) Ratio Tier 1 Ratio Total Capital Ratio Leverage Ratio Board Policy Limits CET1 Ratio: 7.00% Total Capital Ratio: 10.50% Tier 1 Ratio: 8.50% Leverage Ratio: 5.00%
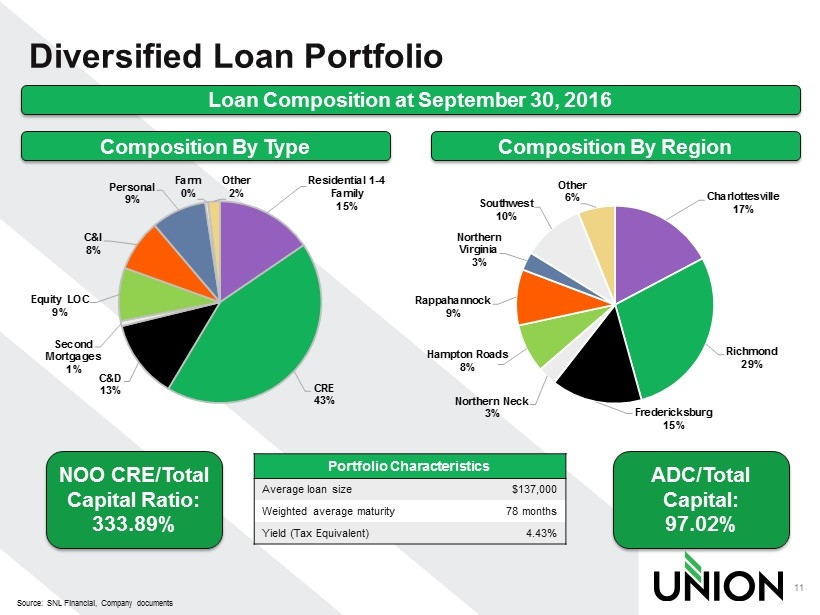
Diversified Loan Portfolio 11 Source: SNL Financial, Company documents Loan Composition at September 30, 2016 Residential 1 - 4 Family 15% CRE 43% C&D 13% Second Mortgages 1% Equity LOC 9% C&I 8% Personal 9% Farm 0% Other 2% Portfolio Characteristics Average loan size $137,000 Weighted average maturity 78 months Yield (Tax Equivalent) 4.43% Charlottesville 17% Richmond 29% Fredericksburg 15% Northern Neck 3% Hampton Roads 8% Rappahannock 9% Northern Virginia 3% Southwest 10% Other 6% Composition By Type Composition By Region NOO CRE/Total Capital Ratio: 333.89% ADC/Total Capital: 97.02%
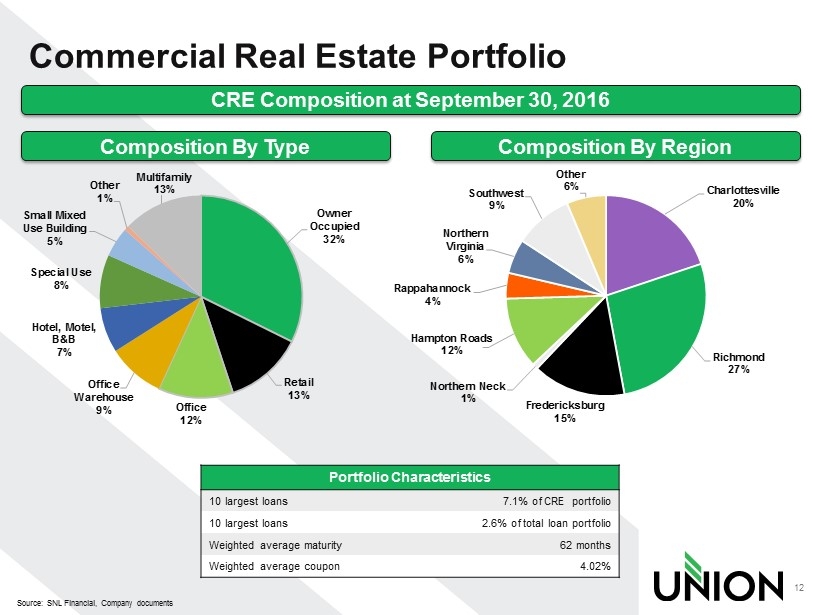
Commercial Real Estate Portfolio 12 Source: SNL Financial, Company documents CRE Composition at September 30, 2016 Owner Occupied 32% Retail 13% Office 12% Office Warehouse 9% Hotel, Motel, B&B 7% Special Use 8% Small Mixed Use Building 5% Other 1% Multifamily 13% Portfolio Characteristics 10 largest loans 7.1% of CRE portfolio 10 largest loans 2.6% of total loan portfolio Weighted average maturity 62 months Weighted average coupon 4.02% Charlottesville 20% Richmond 27% Fredericksburg 15% Northern Neck 1% Hampton Roads 12% Rappahannock 4% Northern Virginia 6% Southwest 9% Other 6% Composition By Type Composition By Region
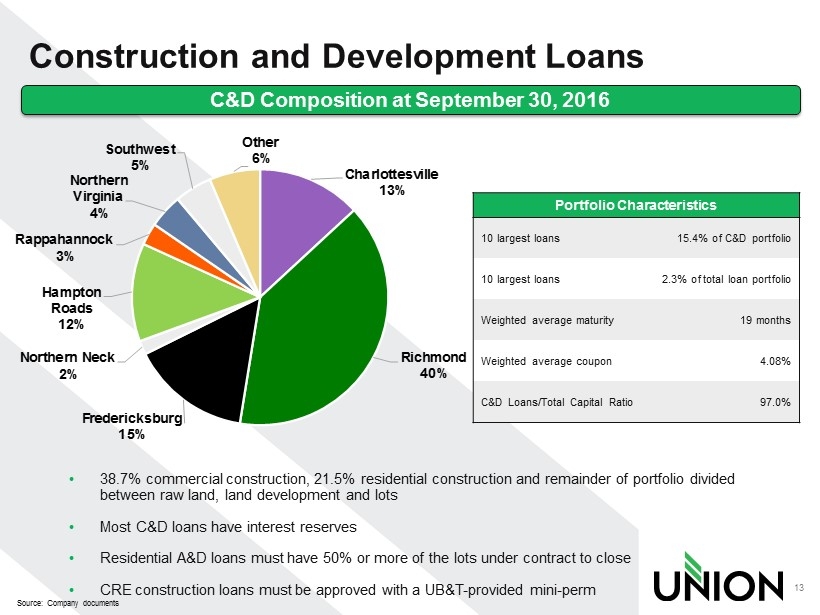
Construction and Development Loans 13 Source: Company documents C&D Composition at September 30, 2016 Portfolio Characteristics 10 largest loans 15.4% of C&D portfolio 10 largest loans 2.3% of total loan portfolio Weighted average maturity 19 months Weighted average coupon 4.08% C&D Loans/Total Capital Ratio 97.0% Charlottesville 13% Richmond 40% Fredericksburg 15% Northern Neck 2% Hampton Roads 12% Rappahannock 3% Northern Virginia 4% Southwest 5% Other 6% • 38.7% commercial construction, 21.5% residential construction and remainder of portfolio divided between raw land, land development and lots • Most C&D loans have interest reserves • Residential A&D loans must have 50 % or more of the lots under contract to close • CRE construction loans must be approved with a UB&T - provided mini - perm
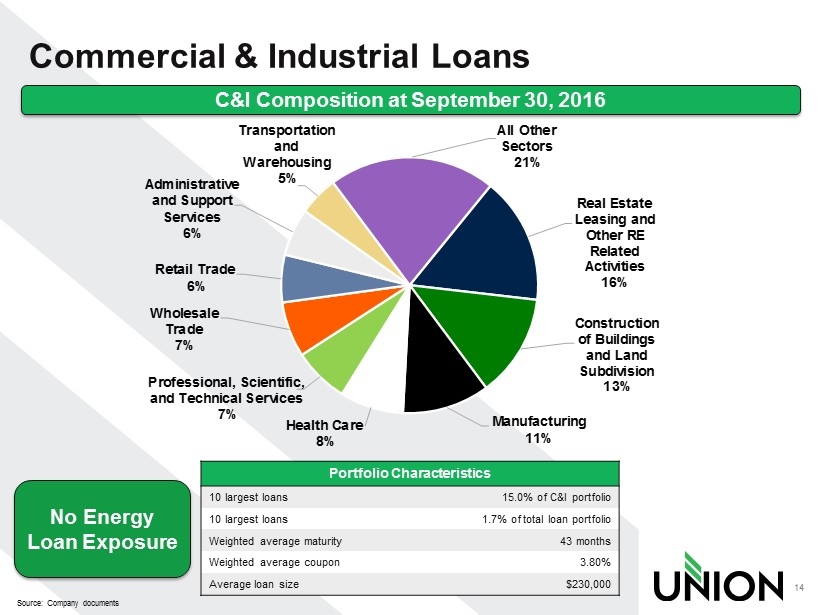
Commercial & Industrial Loans 14 Source: Company documents C&I Composition at September 30, 2016 Portfolio Characteristics 10 largest loans 15.0% of C&I portfolio 10 largest loans 1.7% of total loan portfolio Weighted average maturity 43 months Weighted average coupon 3.80% Average loan size $230,000 Real Estate Leasing and Other RE Related Activities 16% Construction of Buildings and Land Subdivision 13% Manufacturing 11% Health Care 8% Professional, Scientific, and Technical Services 7% Wholesale Trade 7% Retail Trade 6% Administrative and Support Services 6% Transportation and Warehousing 5% All Other Sectors 21% No Energy Loan Exposure
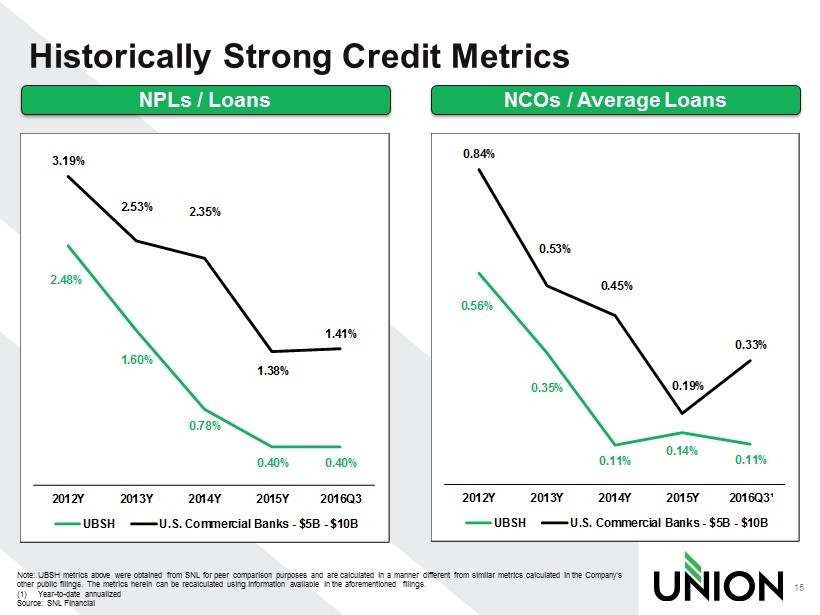
Historically Strong Credit Metrics 15 Note: UBSH metrics above were obtained from SNL for peer comparison purposes and are calculated in a manner different from similar metrics calculated in the Company ’s other public filings. The metrics herein can be recalculated using information available in the aforementioned filings. (1) Year - to - date annualized Source : SNL Financial NPLs / Loans NCOs / Average Loans 2.48% 1.60% 0.78% 0.40% 0.40% 3.19% 2.53% 2.35% 1.38% 1.41% 2012Y 2013Y 2014Y 2015Y 2016Q3 UBSH U.S. Commercial Banks - $5B - $10B 0.56% 0.35% 0.11% 0.14% 0.11% 0.84% 0.53% 0.45% 0.19% 0.33% 2012Y 2013Y 2014Y 2015Y 2016Q3¹ UBSH U.S. Commercial Banks - $5B - $10B
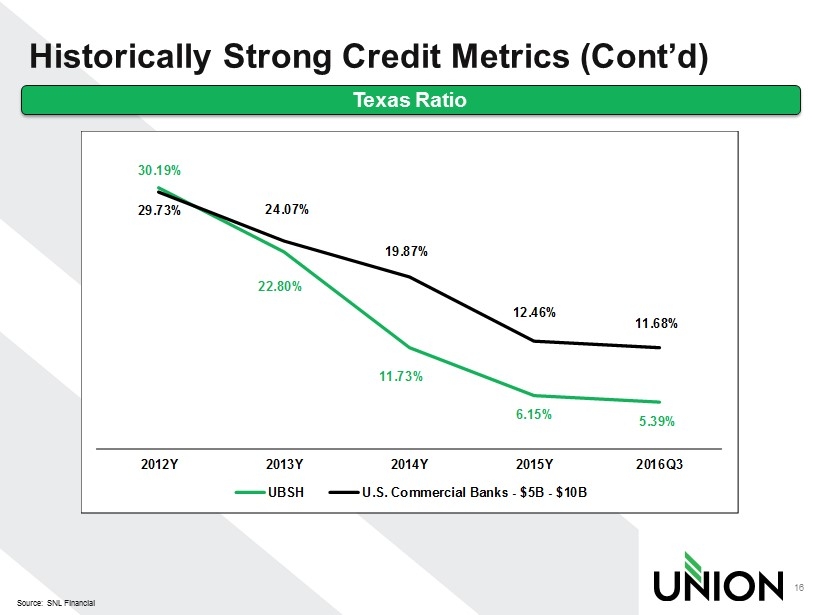
Historically Strong Credit Metrics (Cont’d) 16 Source: SNL Financial Texas Ratio 30.19% 22.80% 11.73% 6.15% 5.39% 29.73% 24.07% 19.87% 12.46% 11.68% 2012Y 2013Y 2014Y 2015Y 2016Q3 UBSH U.S. Commercial Banks - $5B - $10B
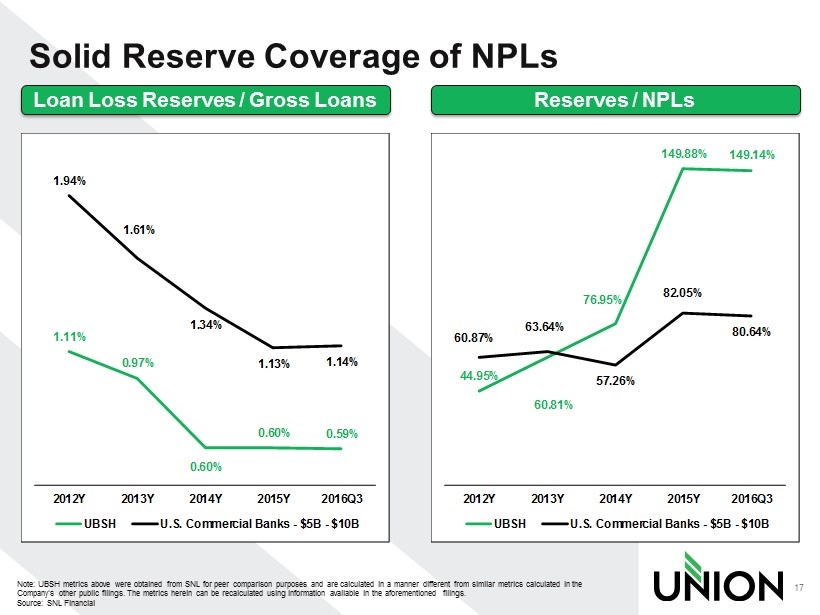
Solid Reserve Coverage of NPLs 17 Note: UBSH metrics above were obtained from SNL for peer comparison purposes and are calculated in a manner different from si mil ar metrics calculated in the Company’s other public filings. The metrics herein can be recalculated using information available in the aforementioned filings. Source : SNL Financial Loan Loss Reserves / Gross Loans Reserves / NPLs 1.11% 0.97% 0.60% 0.60% 0.59% 1.94% 1.61% 1.34% 1.13% 1.14% 2012Y 2013Y 2014Y 2015Y 2016Q3 UBSH U.S. Commercial Banks - $5B - $10B 44.95% 60.81% 76.95% 149.88% 149.14% 60.87% 63.64% 57.26% 82.05% 80.64% 2012Y 2013Y 2014Y 2015Y 2016Q3 UBSH U.S. Commercial Banks - $5B - $10B
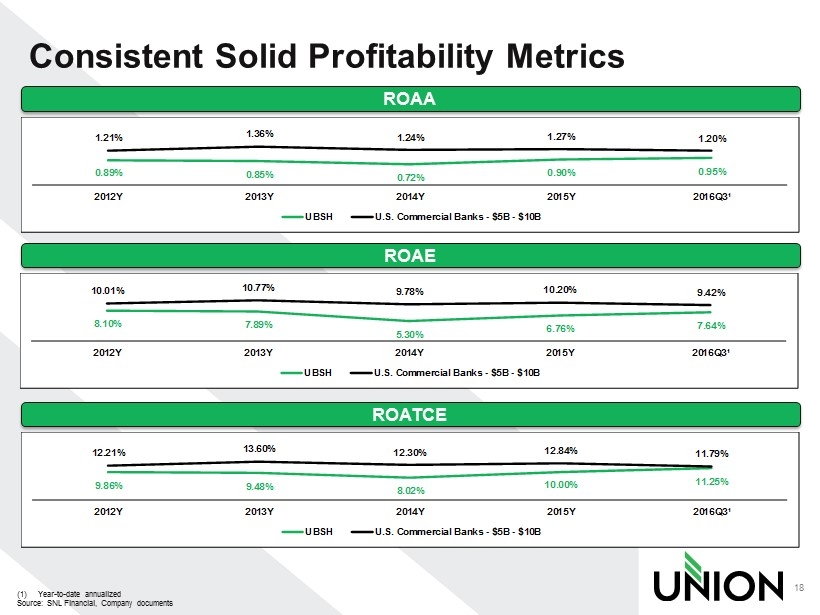
Consistent Solid Profitability Metrics 18 (1) Year - to - date annualized Source: SNL Financial, Company documents ROAA ROAE 0.89% 0.85% 0.72% 0.90% 0.95% 1.21% 1.36% 1.24% 1.27% 1.20% 2012Y 2013Y 2014Y 2015Y 2016Q3¹ UBSH U.S. Commercial Banks - $5B - $10B 8.10% 7.89% 5.30% 6.76% 7.64% 10.01% 10.77% 9.78% 10.20% 9.42% 2012Y 2013Y 2014Y 2015Y 2016Q3¹ UBSH U.S. Commercial Banks - $5B - $10B ROATCE 9.86% 9.48% 8.02% 10.00% 11.25% 12.21% 13.60% 12.30% 12.84% 11.79% 2012Y 2013Y 2014Y 2015Y 2016Q3¹ UBSH U.S. Commercial Banks - $5B - $10B
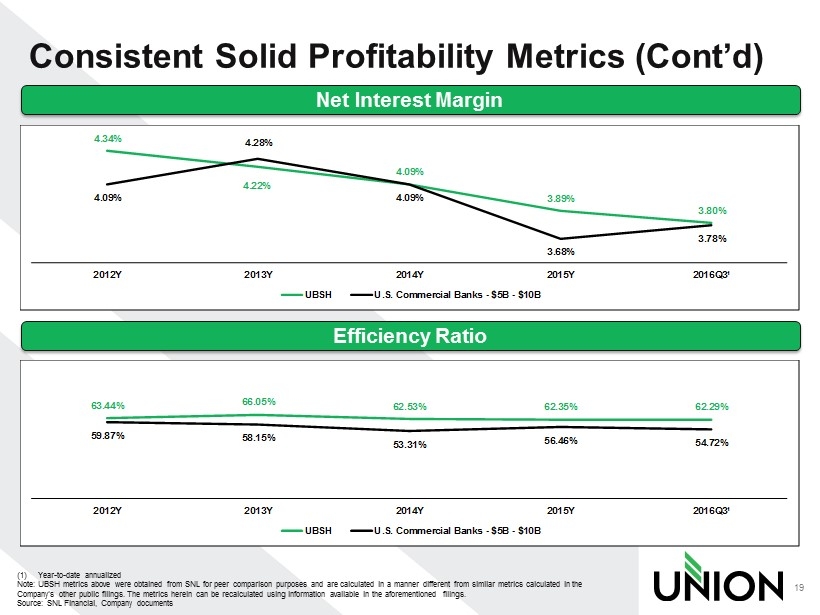
Consistent Solid Profitability Metrics (Cont’d) 19 (1) Year - to - date annualized Note: UBSH metrics above were obtained from SNL for peer comparison purposes and are calculated in a manner different from si mil ar metrics calculated in the Company’s other public filings. The metrics herein can be recalculated using information available in the aforementioned fili ngs . Source: SNL Financial, Company documents Net Interest Margin Efficiency Ratio 4.34% 4.22% 4.09% 3.89% 3.80% 4.09% 4.28% 4.09% 3.68% 3.78% 2012Y 2013Y 2014Y 2015Y 2016Q3¹ UBSH U.S. Commercial Banks - $5B - $10B 63.44% 66.05% 62.53% 62.35% 62.29% 59.87% 58.15% 53.31% 56.46% 54.72% 2012Y 2013Y 2014Y 2015Y 2016Q3¹ UBSH U.S. Commercial Banks - $5B - $10B
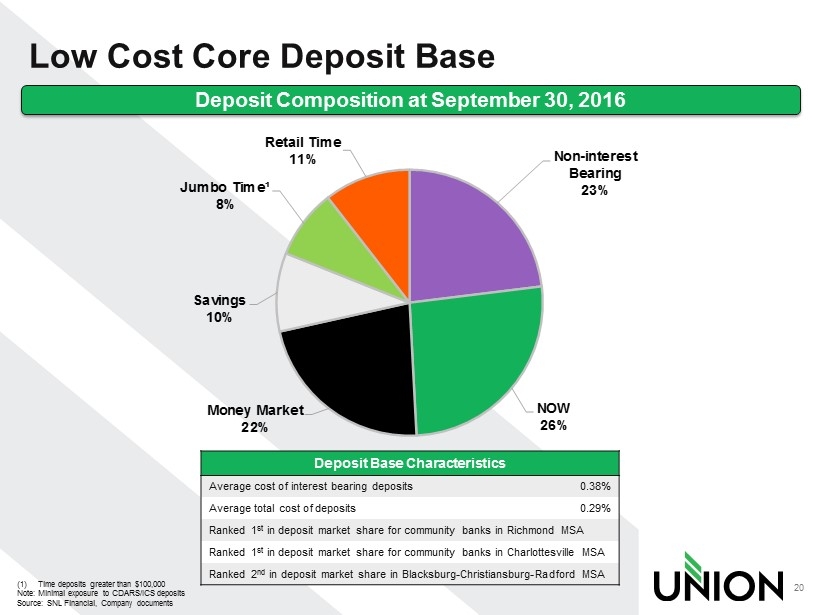
Low Cost Core Deposit Base 20 (1) Time deposits greater than $100,000 Note: Minimal exposure to CDARS/ICS deposits Source: SNL Financial, Company documents Deposit Composition at September 30, 2016 Deposit Base Characteristics Average cost of interest bearing deposits 0.38% Average total cost of deposits 0.29% Ranked 1 st in deposit market share for community banks in Richmond MSA Ranked 1 st in deposit market share for community banks in Charlottesville MSA Ranked 2 nd in deposit market share in Blacksburg - Christiansburg - Radford MSA Non - interest Bearing 23% NOW 26% Money Market 22% Savings 10% Jumbo Time¹ 8% Retail Time 11%
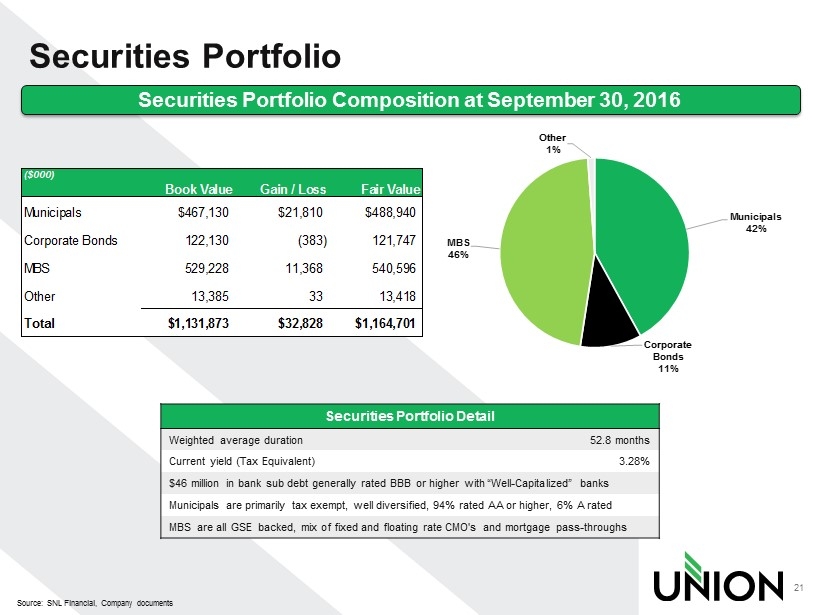
($000) Book Value Gain / Loss Fair Value Municipals $467,130 $21,810 $488,940 Corporate Bonds 122,130 (383) 121,747 MBS 529,228 11,368 540,596 Other 13,385 33 13,418 Total $1,131,873 $32,828 $1,164,701 Securities Portfolio 21 Source: SNL Financial, Company documents Securities Portfolio Composition at September 30, 2016 Securities Portfolio Detail Weighted average duration 52.8 months Current yield (Tax Equivalent) 3.28% $46 million in bank sub debt generally rated BBB or higher with “Well - Capitalized” banks Municipals are p rimarily tax exempt, well diversified, 94% rated AA or higher, 6% A rated MBS are all GSE backed, mix of fixed and floating rate CMO's and mortgage pass - throughs Municipals 42% Corporate Bonds 11% MBS 46% Other 1%
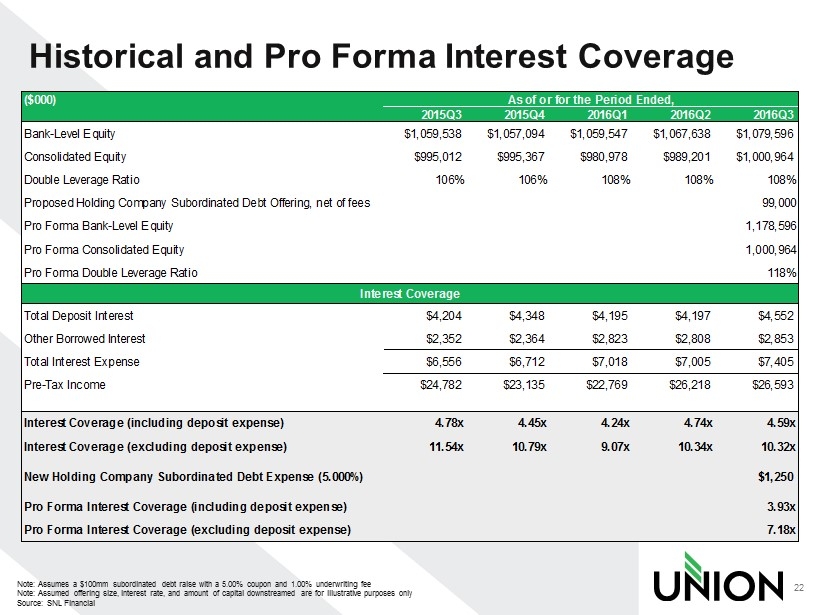
Historical and Pro Forma Interest Coverage 22 Note: Assumes a $100mm subordinated debt raise with a 5.00% coupon and 1.00% underwriting fee Note: Assumed offering size, interest rate, and amount of capital downstreamed are for illustrative purposes only Source: SNL Financial ($000) As of or for the Period Ended, 2015Q3 2015Q4 2016Q1 2016Q2 2016Q3 Bank-Level Equity $1,059,538 $1,057,094 $1,059,547 $1,067,638 $1,079,596 Consolidated Equity $995,012 $995,367 $980,978 $989,201 $1,000,964 Double Leverage Ratio 106% 106% 108% 108% 108% Proposed Holding Company Subordinated Debt Offering, net of fees 99,000 Pro Forma Bank-Level Equity 1,178,596 Pro Forma Consolidated Equity 1,000,964 Pro Forma Double Leverage Ratio 118% Interest Coverage Total Deposit Interest $4,204 $4,348 $4,195 $4,197 $4,552 Other Borrowed Interest $2,352 $2,364 $2,823 $2,808 $2,853 Total Interest Expense $6,556 $6,712 $7,018 $7,005 $7,405 Pre-Tax Income $24,782 $23,135 $22,769 $26,218 $26,593 Interest Coverage (including deposit expense) 4.78x 4.45x 4.24x 4.74x 4.59x Interest Coverage (excluding deposit expense) 11.54x 10.79x 9.07x 10.34x 10.32x New Holding Company Subordinated Debt Expense (5.000%) $1,250 Pro Forma Interest Coverage (including deposit expense) 3.93x Pro Forma Interest Coverage (excluding deposit expense) 7.18x
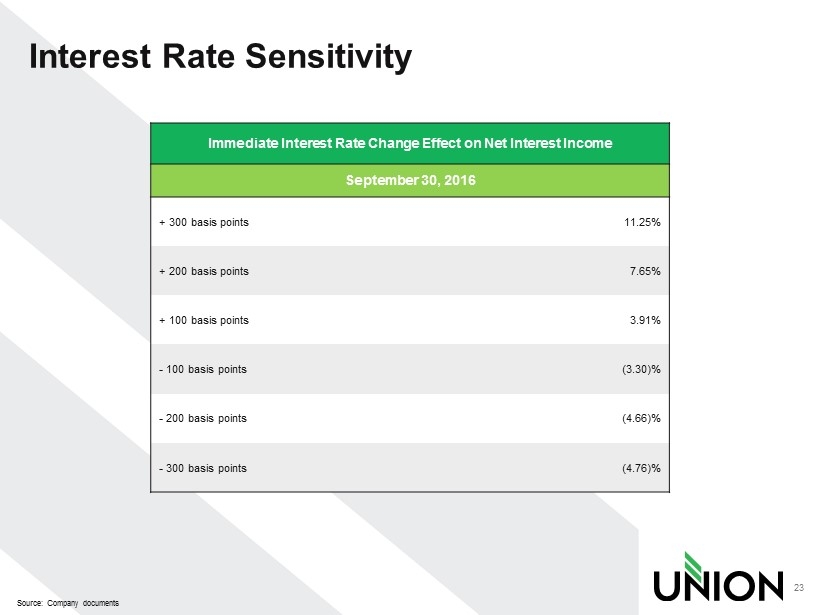
Interest Rate Sensitivity 23 Source : Company documents Immediate Interest Rate Change Effect on Net Interest Income September 30, 2016 + 300 basis points 11.25% + 200 basis points 7.65% + 100 basis points 3.91% - 100 basis points (3.30)% - 200 basis points (4.66)% - 300 basis points (4.76)%
Summary • Largest community bank headquartered in Virginia, with unique statewide branch network • Competitive advantage with unique franchise value and loyal customer base • Strong balance sheet and capital base • Well positioned for continued organic growth • Experienced management team • Committed to top tier financial performance • Proven financial performance through multiple economic climates including credit crisis through conservative standards and practices, and effective risk management 24 Source: Company documents, Senior Management
Appendix
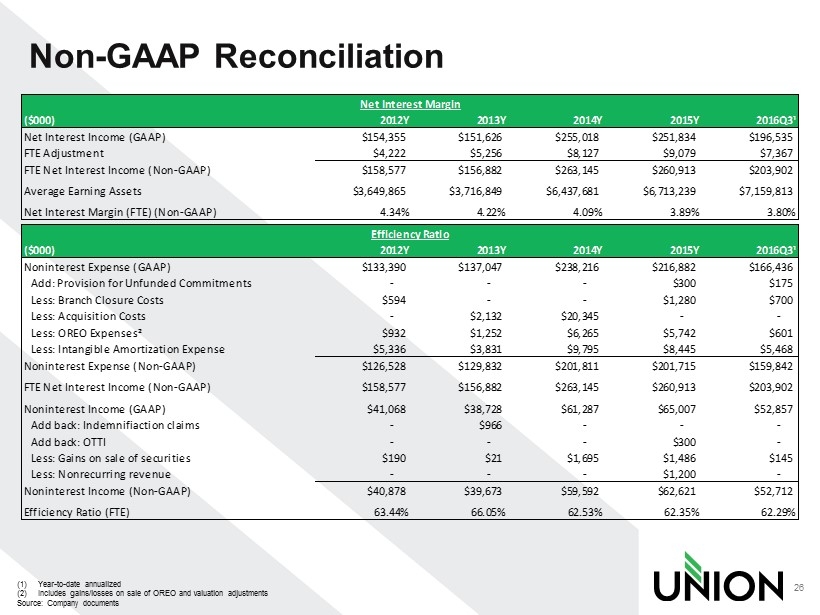
Non - GAAP Reconciliation 26 (1) Year - to - date annualized (2) Includes gains/losses on sale of OREO and valuation adjustments Source: Company documents ($000) 2012Y 2013Y 2014Y 2015Y 2016Q3¹ Net Interest Income (GAAP) $154,355 $151,626 $255,018 $251,834 $196,535 FTE Adjustment $4,222 $5,256 $8,127 $9,079 $7,367 FTE Net Interest Income (Non-GAAP) $158,577 $156,882 $263,145 $260,913 $203,902 Average Earning Assets $3,649,865 $3,716,849 $6,437,681 $6,713,239 $7,159,813 Net Interest Margin (FTE) (Non-GAAP) 4.34% 4.22% 4.09% 3.89% 3.80% ($000) 2012Y 2013Y 2014Y 2015Y 2016Q3¹ Noninterest Expense (GAAP) $133,390 $137,047 $238,216 $216,882 $166,436 Add: Provision for Unfunded Commitments - - - $300 $175 Less: Branch Closure Costs $594 - - $1,280 $700 Less: Acquisition Costs - $2,132 $20,345 - - Less: OREO Expenses² $932 $1,252 $6,265 $5,742 $601 Less: Intangible Amortization Expense $5,336 $3,831 $9,795 $8,445 $5,468 Noninterest Expense (Non-GAAP) $126,528 $129,832 $201,811 $201,715 $159,842 FTE Net Interest Income (Non-GAAP) $158,577 $156,882 $263,145 $260,913 $203,902 Noninterest Income (GAAP) $41,068 $38,728 $61,287 $65,007 $52,857 Add back: Indemnifiaction claims - $966 - - - Add back: OTTI - - - $300 - Less: Gains on sale of securities $190 $21 $1,695 $1,486 $145 Less: Nonrecurring revenue - - - $1,200 - Noninterest Income (Non-GAAP) $40,878 $39,673 $59,592 $62,621 $52,712 Efficiency Ratio (FTE) 63.44% 66.05% 62.53% 62.35% 62.29% Net Interest Margin Efficiency Ratio
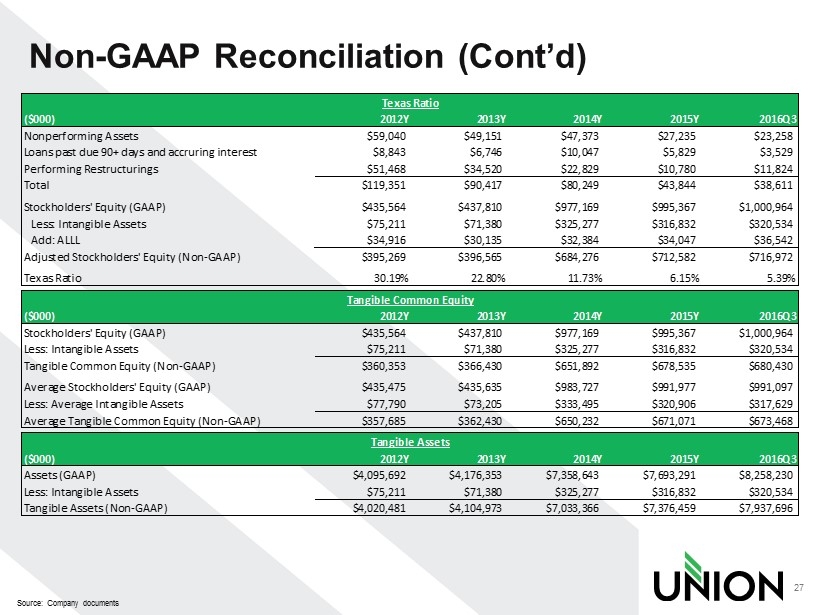
Non - GAAP Reconciliation (Cont’d) 27 Source: Company documents ($000) 2012Y 2013Y 2014Y 2015Y 2016Q3 Nonperforming Assets $59,040 $49,151 $47,373 $27,235 $23,258 Loans past due 90+ days and accruring interest $8,843 $6,746 $10,047 $5,829 $3,529 Performing Restructurings $51,468 $34,520 $22,829 $10,780 $11,824 Total $119,351 $90,417 $80,249 $43,844 $38,611 Stockholders' Equity (GAAP) $435,564 $437,810 $977,169 $995,367 $1,000,964 Less: Intangible Assets $75,211 $71,380 $325,277 $316,832 $320,534 Add: ALLL $34,916 $30,135 $32,384 $34,047 $36,542 Adjusted Stockholders' Equity (Non-GAAP) $395,269 $396,565 $684,276 $712,582 $716,972 Texas Ratio 30.19% 22.80% 11.73% 6.15% 5.39% ($000) 2012Y 2013Y 2014Y 2015Y 2016Q3 Stockholders' Equity (GAAP) $435,564 $437,810 $977,169 $995,367 $1,000,964 Less: Intangible Assets $75,211 $71,380 $325,277 $316,832 $320,534 Tangible Common Equity (Non-GAAP) $360,353 $366,430 $651,892 $678,535 $680,430 Average Stockholders' Equity (GAAP) $435,475 $435,635 $983,727 $991,977 $991,097 Less: Average Intangible Assets $77,790 $73,205 $333,495 $320,906 $317,629 Average Tangible Common Equity (Non-GAAP) $357,685 $362,430 $650,232 $671,071 $673,468 ($000) 2012Y 2013Y 2014Y 2015Y 2016Q3 Assets (GAAP) $4,095,692 $4,176,353 $7,358,643 $7,693,291 $8,258,230 Less: Intangible Assets $75,211 $71,380 $325,277 $316,832 $320,534 Tangible Assets (Non-GAAP) $4,020,481 $4,104,973 $7,033,366 $7,376,459 $7,937,696 Tangible Assets Texas Ratio Tangible Common Equity