
Exhibit 99.1
May 2016 Annual Shareholders Meeting
2 Forward Looking Statement Certain statements in this report may constitute “forward - looking statements” within the meaning of the Private Securities Litigation Reform Act of 1995. Forward - looking statements are statements that include projections, predictions, expectations or beliefs about future events or results or otherwise and are not statements of historical fact. Such statements are often characterized by the use of qualified words (and their derivatives) such as “expect,” “believe,” “estimate,” “plan,” “project,” “anticipate” or other statements concerning opinions or judgment of the Company and its management about future events. Although the Company believes that its expectations with respect to forward - looking statements are based upon reasonable assumptions within the bounds of its existing knowledge of its business and operations, there can be no assurance that actual results, performance or achievements of the Company will not differ materially from any future results, performance or achievements expressed or implied by such forward - looking statements. Actual future results and trends may differ materially from historical results or those anticipated depending on a variety of factors, including, but not limited to, the effects of and changes in: general economic conditions, the interest rate environment, legislative and regulatory requirements, competitive pressures, new products and delivery systems, inflation, changes in the stock and bond markets, technology, and consumer spending and savings habits. The Company does not update any forward - looking statements that may be made from time to time by or on behalf of the Company.
3 Pillars Values Purpose Our Strategic Journey
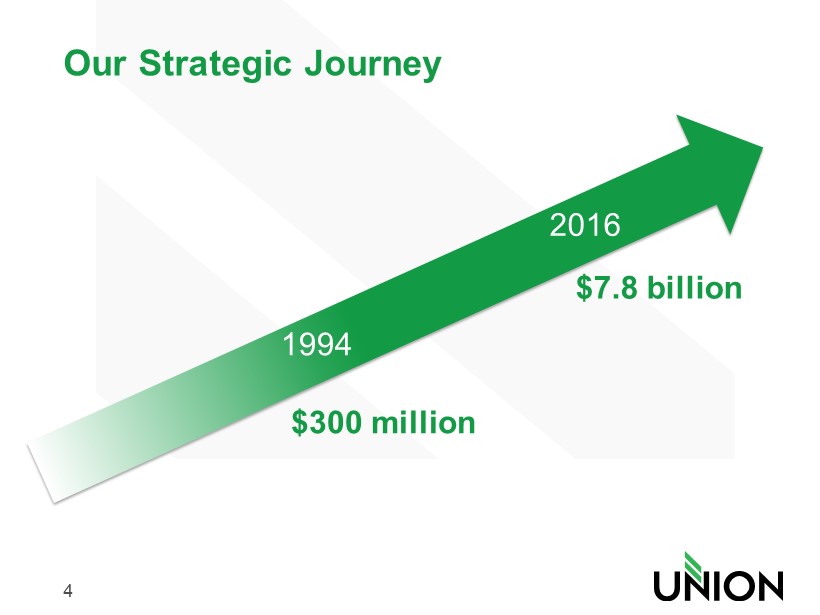
4 Our Strategic Journey $300 million $7.8 billion 1994 2016
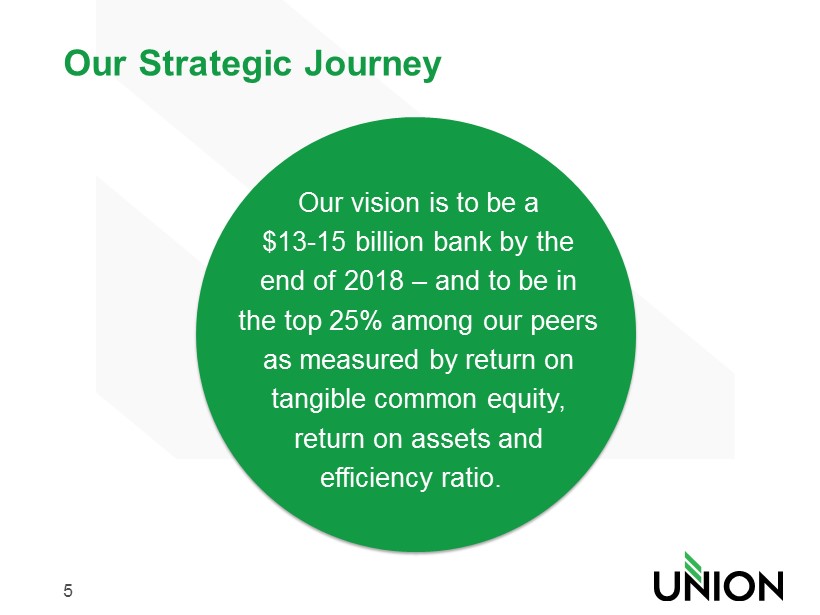
5 Our vision is to be a $13 - 15 billion bank by the end of 2018 – and to be in the top 25% among our peers as measured by return on tangible common equity, return on assets and efficiency ratio. Our Strategic Journey

6 OUR STRATEGY TO BE TWICE AS STRONG IN 2018
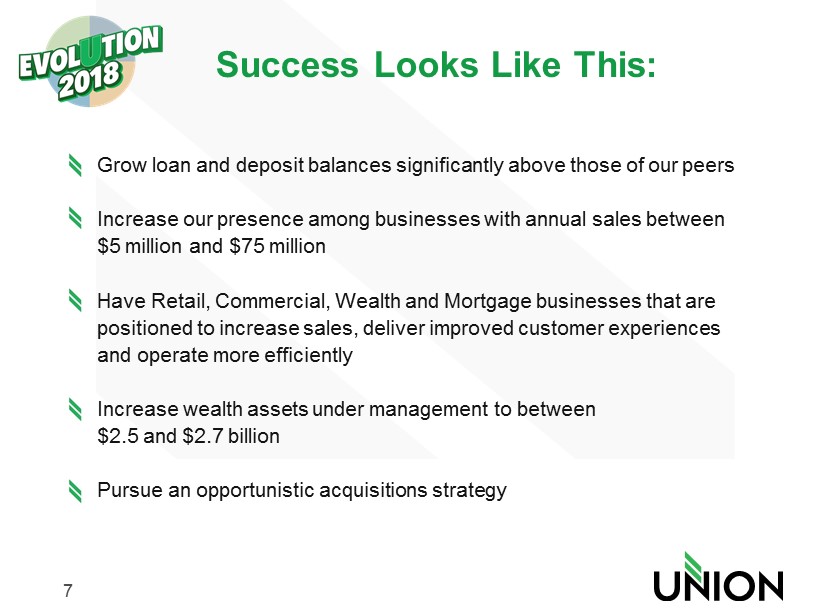
7 Grow loan and deposit balances significantly above those of our peers Increase our presence among businesses with annual sales between $5 million and $75 million Have Retail, Commercial, Wealth and Mortgage businesses that are positioned to increase sales, deliver improved customer experiences and operate more efficiently Increase wealth assets under management to between $ 2.5 and $2.7 billion Pursue an opportunistic acquisitions strategy Success Looks Like This:
8 Strategic Objectives Union Pillars Our Strategic Objectives Align with Our Pillars
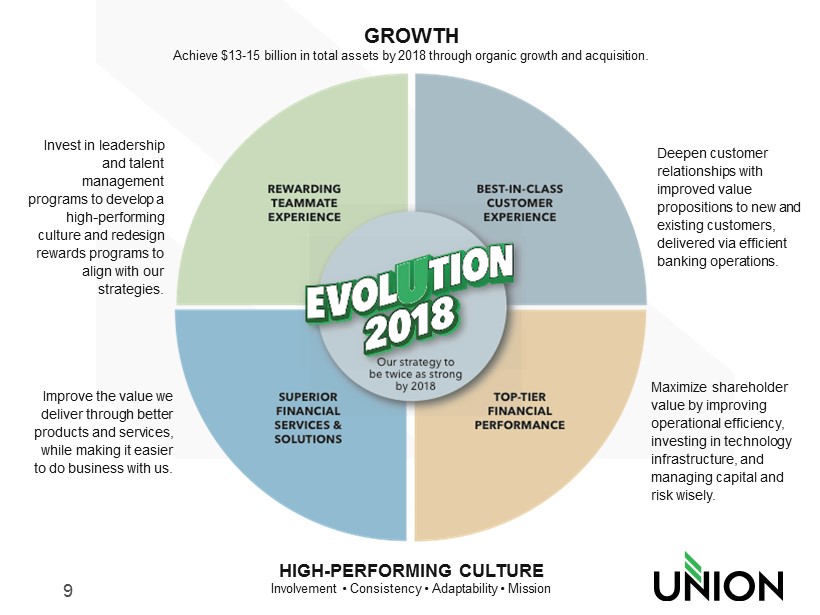
9 Invest in leadership and talent management programs to develop a high - performing culture and redesign rewards programs to align with our strategies. Improve the value we deliver through better products and services, while making it easier to do business with us. Deepen customer relationships with improved value propositions to new and existing customers, delivered via efficient banking operations. Maximize shareholder value by improving operational efficiency, investing in technology infrastructure, and managing capital and risk wisely. GROWTH Achieve $13 - 15 billion in total assets by 2018 through organic growth and acquisition. HIGH - PERFORMING CULTURE Involvement • Consistency • Adaptability • Mission
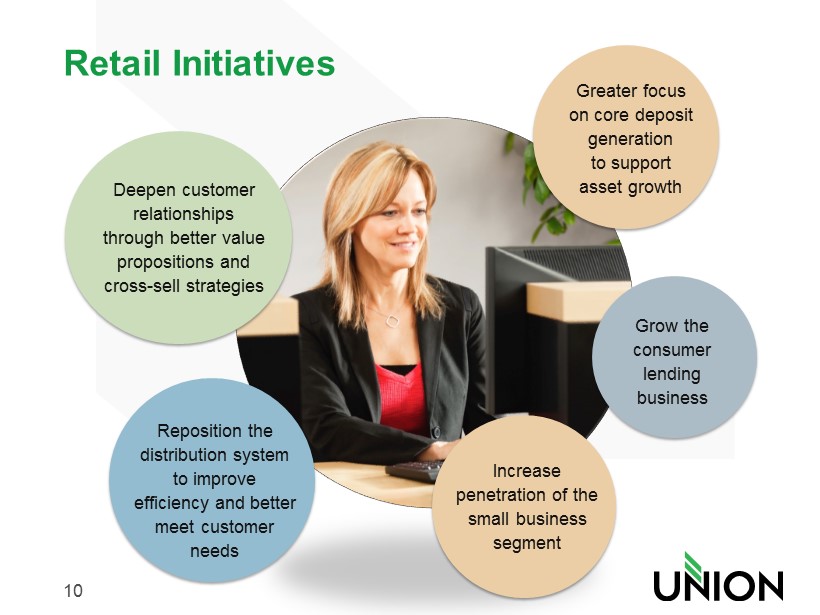
10 Retail Initiatives Deepen customer relationships through better value propositions and cross - sell strategies Greater focus on core deposit generation to support asset growth Grow the consumer lending business Increase penetration of the small business segment Reposition the distribution system to improve efficiency and better meet customer needs
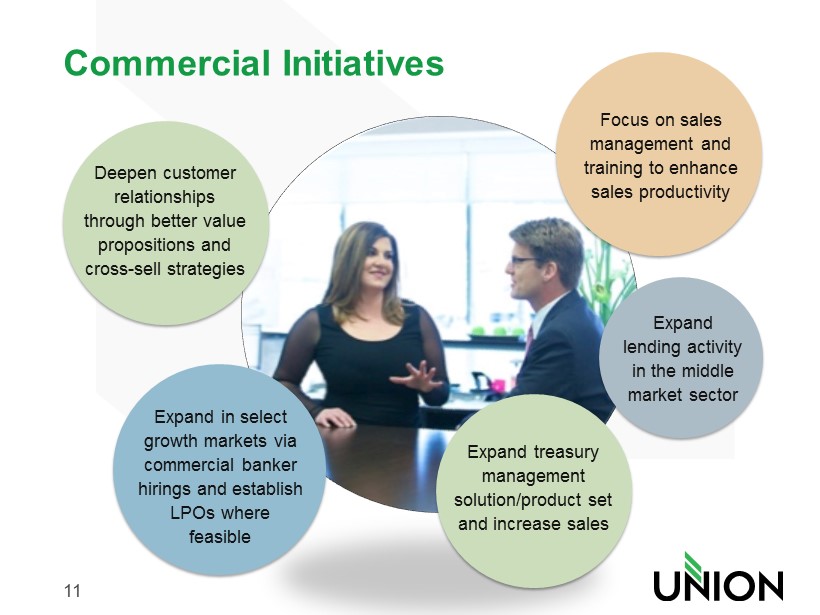
11 Commercial Initiatives Expand lending activity in the middle market sector Expand treasury management solution/product set and increase sales Focus on sales management and training to enhance sales productivity Expand in select growth markets via commercial banker hirings and establish LPOs where feasible Deepen customer relationships through better value propositions and cross - sell strategies

12 Wealth Management Initiatives Expand wealth client relationships organically through improved integration of services and more disciplined service delivery Accelerate efforts to acquire other wealth businesses Leverage formal sales training Develop marketing plan for high net worth to increase brand awareness Build out mass affluent program with Retail
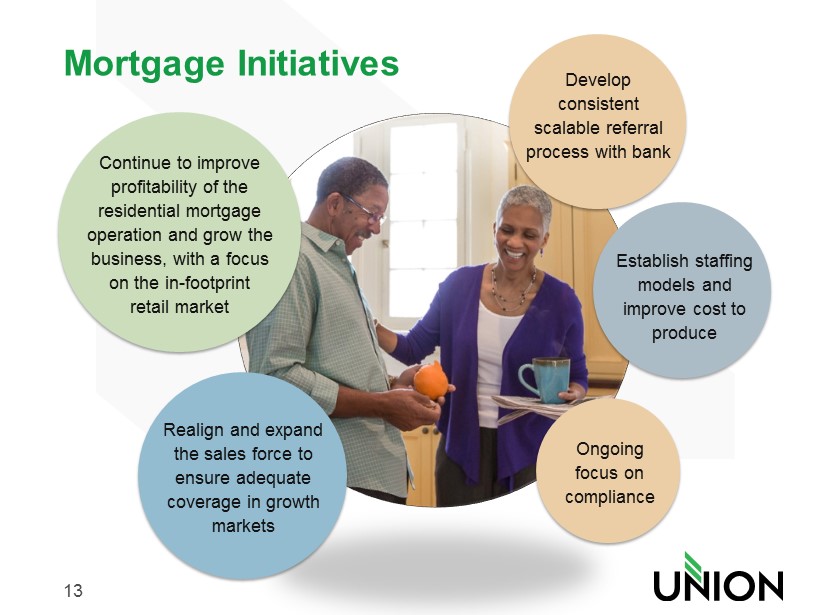
13 Mortgage Initiatives Realign and expand the sales force to ensure adequate coverage in growth markets Continue to improve profitability of the residential mortgage operation and grow the business, with a focus on the in - footprint retail market Ongoing f ocus on compliance Establish staffing models and improve cost to produce Develop consistent scalable referral process with bank
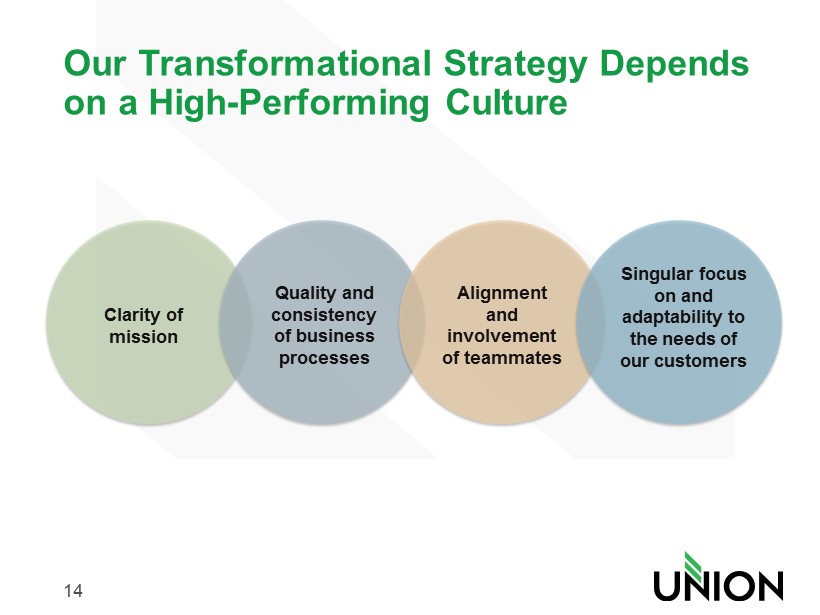
14 Our Transformational Strategy Depends on a High - Performing Culture C larity of mission Q uality and consistency of business processes A lignment and involvement of teammates S ingular focus on and adaptability to the needs of our customers

Financial Recap
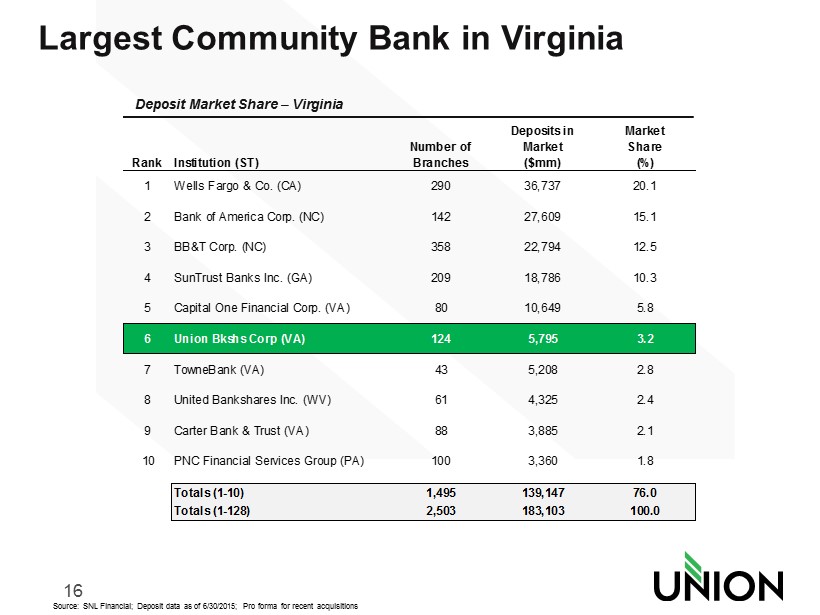
16 Source: SNL Financial; Deposit data as of 6/30/2015; Pro forma for recent acquisitions Largest Community Bank in Virginia Rank Institution (ST) Number of Branches Deposits in Market ($mm) Market Share (%) 1 Wells Fargo & Co. (CA) 290 36,737 20.1 2 Bank of America Corp. (NC) 142 27,609 15.1 3 BB&T Corp. (NC) 358 22,794 12.5 4 SunTrust Banks Inc. (GA) 209 18,786 10.3 5 Capital One Financial Corp. (VA) 80 10,649 5.8 6 Union Bkshs Corp (VA) 124 5,795 3.2 7 TowneBank (VA) 43 5,208 2.8 8 United Bankshares Inc. (WV) 61 4,325 2.4 9 Carter Bank & Trust (VA) 88 3,885 2.1 10 PNC Financial Services Group (PA) 100 3,360 1.8 Totals (1-10) 1,495 139,147 76.0 Totals (1-128) 2,503 183,103 100.0 Deposit Market Share – Virginia
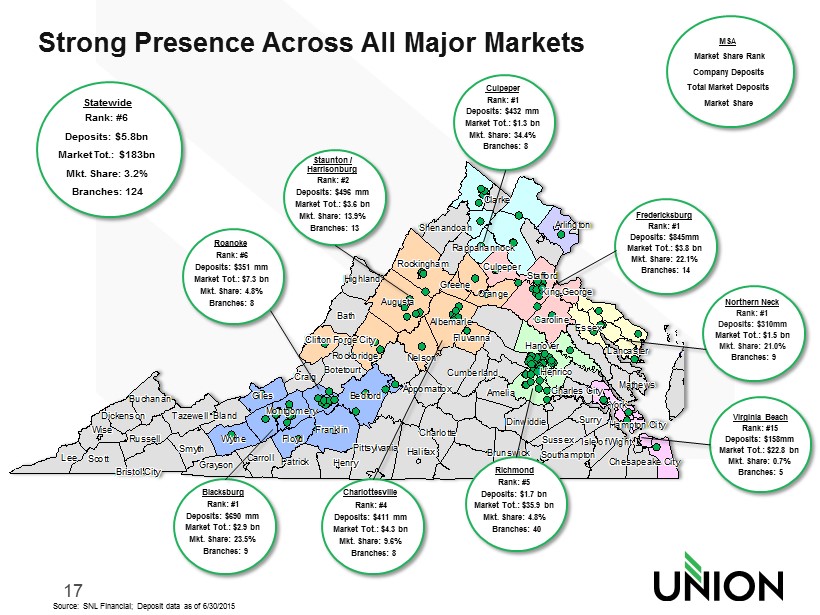
17 Rappahannock Rappahannock Rappahannock Rappahannock Rappahannock Rappahannock Rappahannock Rappahannock Rappahannock Rockbridge Rockbridge Rockbridge Rockbridge Rockbridge Rockbridge Rockbridge Rockbridge Rockbridge Nelson Nelson Nelson Nelson Nelson Nelson Nelson Nelson Nelson Accomack Accomack Accomack Accomack Accomack Accomack Accomack Accomack Accomack Albemarle Albemarle Albemarle Albemarle Albemarle Albemarle Albemarle Albemarle Albemarle Amelia Amelia Amelia Amelia Amelia Amelia Amelia Amelia Amelia Appomattox Appomattox Appomattox Appomattox Appomattox Appomattox Appomattox Appomattox Appomattox Arlington Arlington Arlington Arlington Arlington Arlington Arlington Arlington Arlington Augusta Augusta Augusta Augusta Augusta Augusta Augusta Augusta Augusta Bath Bath Bath Bath Bath Bath Bath Bath Bath Bedford Bedford Bedford Bedford Bedford Bedford Bedford Bedford Bedford Bland Bland Bland Bland Bland Bland Bland Bland Bland Botetourt Botetourt Botetourt Botetourt Botetourt Botetourt Botetourt Botetourt Botetourt Brunswick Brunswick Brunswick Brunswick Brunswick Brunswick Brunswick Brunswick Brunswick Buchanan Buchanan Buchanan Buchanan Buchanan Buchanan Buchanan Buchanan Buchanan Caroline Caroline Caroline Caroline Caroline Caroline Caroline Caroline Caroline Carroll Carroll Carroll Carroll Carroll Carroll Carroll Carroll Carroll Charles City Charles City Charles City Charles City Charles City Charles City Charles City Charles City Charles City Charlotte Charlotte Charlotte Charlotte Charlotte Charlotte Charlotte Charlotte Charlotte Clarke Clarke Clarke Clarke Clarke Clarke Clarke Clarke Clarke Craig Craig Craig Craig Craig Craig Craig Craig Craig Culpeper Culpeper Culpeper Culpeper Culpeper Culpeper Culpeper Culpeper Culpeper Cumberland Cumberland Cumberland Cumberland Cumberland Cumberland Cumberland Cumberland Cumberland Dickenson Dickenson Dickenson Dickenson Dickenson Dickenson Dickenson Dickenson Dickenson Dinwiddie Dinwiddie Dinwiddie Dinwiddie Dinwiddie Dinwiddie Dinwiddie Dinwiddie Dinwiddie Essex Essex Essex Essex Essex Essex Essex Essex Essex Floyd Floyd Floyd Floyd Floyd Floyd Floyd Floyd Floyd Fluvanna Fluvanna Fluvanna Fluvanna Fluvanna Fluvanna Fluvanna Fluvanna Fluvanna Franklin Franklin Franklin Franklin Franklin Franklin Franklin Franklin Franklin Giles Giles Giles Giles Giles Giles Giles Giles Giles Grayson Grayson Grayson Grayson Grayson Grayson Grayson Grayson Grayson Greene Greene Greene Greene Greene Greene Greene Greene Greene Halifax Halifax Halifax Halifax Halifax Halifax Halifax Halifax Halifax Hanover Hanover Hanover Hanover Hanover Hanover Hanover Hanover Hanover Henrico Henrico Henrico Henrico Henrico Henrico Henrico Henrico Henrico Henry Henry Henry Henry Henry Henry Henry Henry Henry Highland Highland Highland Highland Highland Highland Highland Highland Highland Isle of Wight Isle of Wight Isle of Wight Isle of Wight Isle of Wight Isle of Wight Isle of Wight Isle of Wight Isle of Wight King George King George King George King George King George King George King George King George King George Lancaster Lancaster Lancaster Lancaster Lancaster Lancaster Lancaster Lancaster Lancaster Lee Lee Lee Lee Lee Lee Lee Lee Lee Mathews Mathews Mathews Mathews Mathews Mathews Mathews Mathews Mathews Montgomery Montgomery Montgomery Montgomery Montgomery Montgomery Montgomery Montgomery Montgomery Orange Orange Orange Orange Orange Orange Orange Orange Orange Patrick Patrick Patrick Patrick Patrick Patrick Patrick Patrick Patrick Pittsylvania Pittsylvania Pittsylvania Pittsylvania Pittsylvania Pittsylvania Pittsylvania Pittsylvania Pittsylvania Rockingham Rockingham Rockingham Rockingham Rockingham Rockingham Rockingham Rockingham Rockingham Russell Russell Russell Russell Russell Russell Russell Russell Russell Scott Scott Scott Scott Scott Scott Scott Scott Scott Shenandoah Shenandoah Shenandoah Shenandoah Shenandoah Shenandoah Shenandoah Shenandoah Shenandoah Smyth Smyth Smyth Smyth Smyth Smyth Smyth Smyth Smyth Southampton Southampton Southampton Southampton Southampton Southampton Southampton Southampton Southampton Stafford Stafford Stafford Stafford Stafford Stafford Stafford Stafford Stafford Surry Surry Surry Surry Surry Surry Surry Surry Surry Sussex Sussex Sussex Sussex Sussex Sussex Sussex Sussex Sussex Tazewell Tazewell Tazewell Tazewell Tazewell Tazewell Tazewell Tazewell Tazewell Wise Wise Wise Wise Wise Wise Wise Wise Wise Wythe Wythe Wythe Wythe Wythe Wythe Wythe Wythe Wythe York York York York York York York York York Bristol City Bristol City Bristol City Bristol City Bristol City Bristol City Bristol City Bristol City Bristol City Chesapeake City Chesapeake City Chesapeake City Chesapeake City Chesapeake City Chesapeake City Chesapeake City Chesapeake City Chesapeake City Clifton Forge City Clifton Forge City Clifton Forge City Clifton Forge City Clifton Forge City Clifton Forge City Clifton Forge City Clifton Forge City Clifton Forge City Hampton City Hampton City Hampton City Hampton City Hampton City Hampton City Hampton City Hampton City Hampton City MSA Market Share Rank Company Deposits Total Market Deposits Market Share Roanoke Deposits: $351 mm Market Tot.: $7.3 bn Mkt. Share: 4.8% Rank: #6 Branches: 8 Staunton / Harrisonburg Rank: #2 Deposits: $496 mm Market Tot.: $3.6 bn Mkt. Share: 13.9% Branches: 13 Blacksburg Rank: #1 Deposits: $690 mm Market Tot.: $2.9 bn Mkt. Share: 23.5% Branches: 9 Charlottesville Rank: #4 Deposits: $411 mm Market Tot.: $4.3 bn Mkt. Share: 9.6% Branches: 8 Richmond Rank: #5 Deposits: $1.7 bn Market Tot.: $35.9 bn Mkt. Share: 4.8% Branches: 40 Culpeper Rank: #1 Deposits: $432 mm Market Tot.: $1.3 bn Mkt. Share: 34.4% Branches: 8 Fredericksburg Rank: #1 Deposits: $845mm Market Tot.: $3.8 bn Mkt. Share: 22.1% Branches: 14 Statewide Rank: #6 Deposits: $5.8bn Market Tot.: $183bn Mkt. Share: 3.2% Branches: 124 Strong Presence Across All Major Markets Northern Neck Rank: #1 Deposits: $310mm Market Tot.: $1.5 bn Mkt. Share: 21.0% Branches: 9 Virginia Beach Rank: #15 Deposits: $158mm Market Tot.: $22.8 bn Mkt. Share: 0.7% Branches: 5 Source: SNL Financial; Deposit data as of 6/30/2015
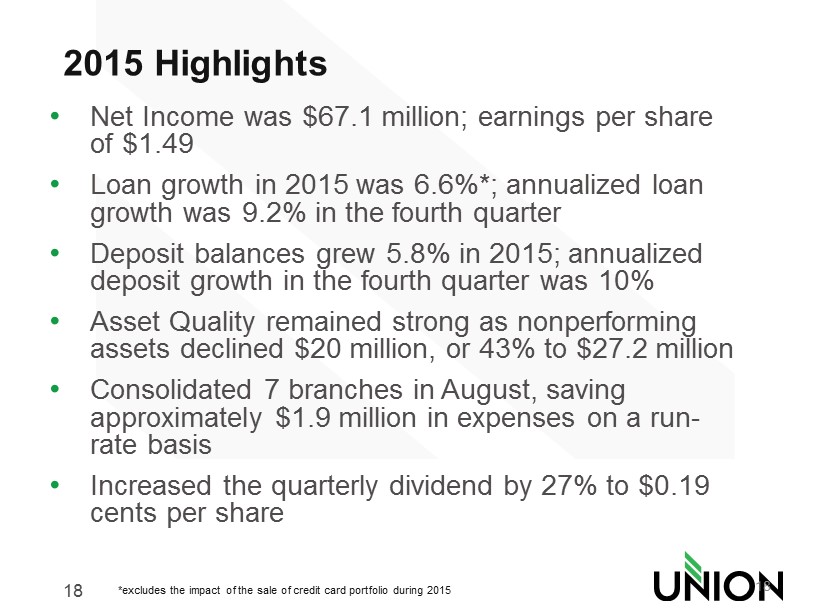
18 2015 Highlights • Net Income was $67.1 million; earnings per share of $1.49 • Loan growth in 2015 was 6.6%*; annualized loan growth was 9.2% in the fourth quarter • Deposit balances grew 5.8% in 2015; annualized deposit growth in the fourth quarter was 10% • Asset Quality remained strong as nonperforming assets declined $20 million, or 43% to $27.2 million • Consolidated 7 branches in August, saving approximately $1.9 million in expenses on a run - rate basis • Increased the quarterly dividend by 27% to $ 0.19 cents per share 18 *excludes the impact of the sale of credit card portfolio during 2015
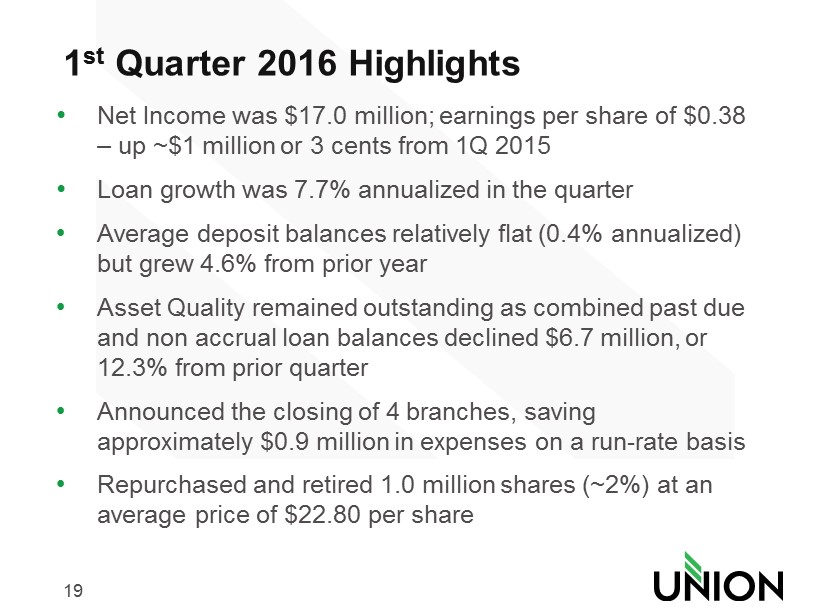
19 1 st Quarter 2016 Highlights • Net Income was $17.0 million; earnings per share of $0.38 – up ~$1 million or 3 cents from 1Q 2015 • Loan growth was 7.7% annualized in the quarter • Average deposit balances relatively flat (0.4% annualized) but grew 4.6% from prior year • Asset Quality remained outstanding as combined past due and non accrual loan balances declined $6.7 million, or 12.3% from prior quarter • Announced the closing of 4 branches, saving approximately $0.9 million in expenses on a run - rate basis • Repurchased and retired 1.0 million shares (~2%) at an average price of $22.80 per share
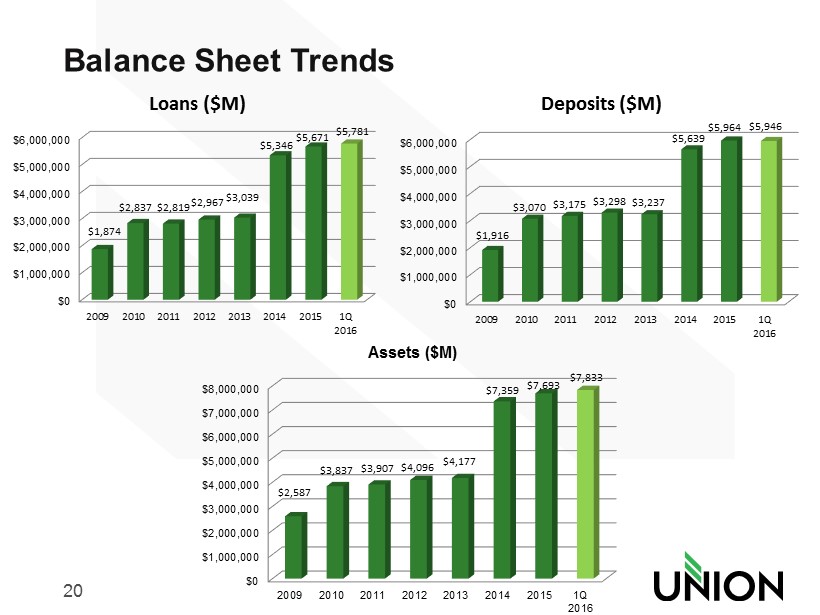
20 Balance Sheet Trends $0 $1,000,000 $2,000,000 $3,000,000 $4,000,000 $5,000,000 $6,000,000 2009 2010 2011 2012 2013 2014 2015 1Q 2016 $1,874 $2,837 $2,819 $2,967 $3,039 $5,346 $5,671 $5,781 Loans ($M) $0 $1,000,000 $2,000,000 $3,000,000 $4,000,000 $5,000,000 $6,000,000 2009 2010 2011 2012 2013 2014 2015 1Q 2016 $1,916 $3,070 $3,175 $3,298 $3,237 $5,639 $5,964 $5,946 Deposits ($M) $0 $1,000,000 $2,000,000 $3,000,000 $4,000,000 $5,000,000 $6,000,000 $7,000,000 $8,000,000 2009 2010 2011 2012 2013 2014 2015 1Q 2016 $2,587 $3,837 $3,907 $4,096 $4,177 $7,359 $7,693 $7,833 Assets ($M)
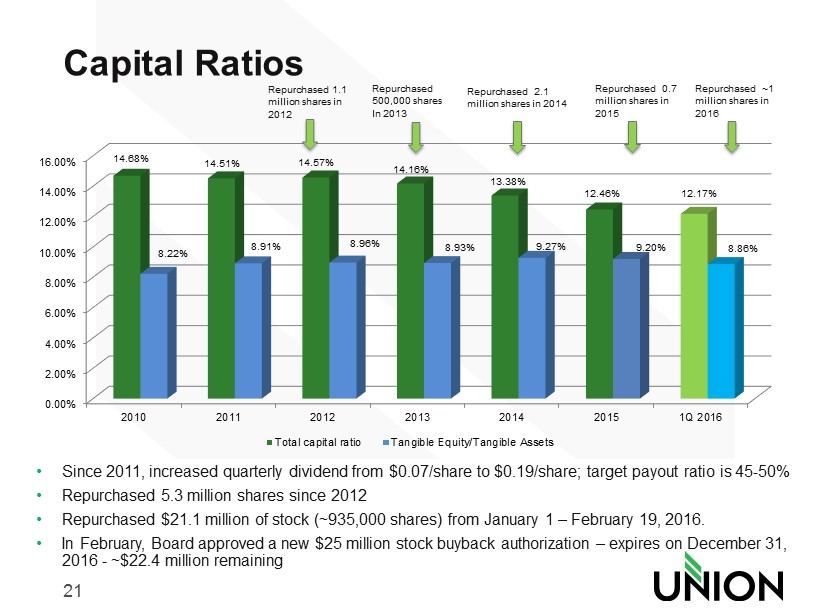
21 0.00% 2.00% 4.00% 6.00% 8.00% 10.00% 12.00% 14.00% 16.00% 2010 2011 2012 2013 2014 2015 1Q 2016 14.68% 14.51% 14.57% 14.16% 13.38% 12.46% 12.17% 8.22% 8.91% 8.96% 8.93% 9.27% 9.20% 8.86% Total capital ratio Tangible Equity/Tangible Assets Repurchased 1.1 million shares in 2012 Capital Ratios • Since 2011, increased quarterly dividend from $0.07/share to $ 0.19/share; target payout ratio is 45 - 50% • Repurchased 5.3 million shares since 2012 • Repurchased $21.1 million of stock (~935,000 shares) from January 1 – February 19, 2016. • In February, Board approved a new $25 million stock buyback authorization – expires on December 31, 2016 - ~$22.4 million remaining Repurchased 500,000 shares In 2013 Repurchased 2.1 million shares in 2014 Repurchased 0.7 million shares in 2015 Repurchased ~1 million shares in 2016
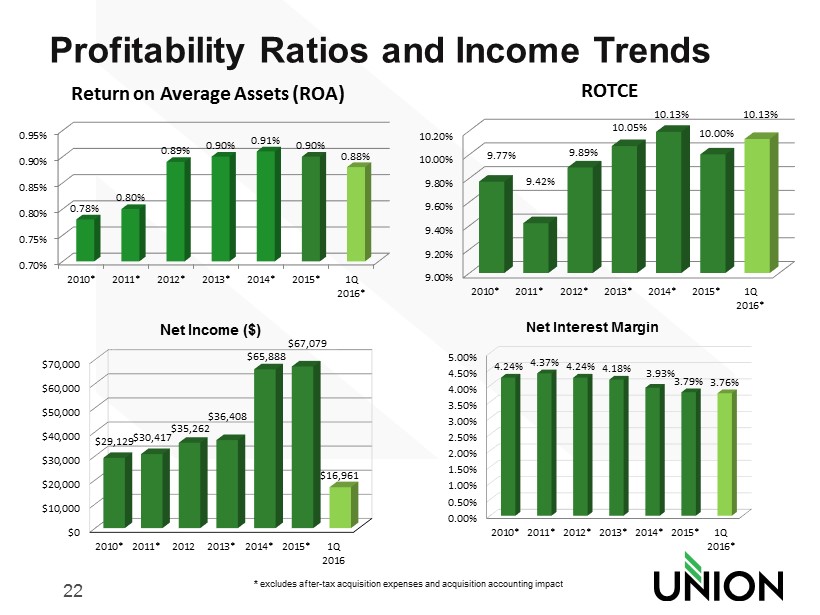
22 Profitability Ratios and Income Trends * excludes after - tax acquisition expenses and acquisition accounting impact 0.70% 0.75% 0.80% 0.85% 0.90% 0.95% 2010* 2011* 2012* 2013* 2014* 2015* 1Q 2016* 0.78% 0.80% 0.89% 0.90% 0.91% 0.90% 0.88% Return on Average Assets (ROA) 9.00% 9.20% 9.40% 9.60% 9.80% 10.00% 10.20% 2010* 2011* 2012* 2013* 2014* 2015* 1Q 2016* 9.77% 9.42% 9.89% 10.05% 10.13% 10.00% 10.13% ROTCE $0 $10,000 $20,000 $30,000 $40,000 $50,000 $60,000 $70,000 2010* 2011* 2012 2013* 2014* 2015* 1Q 2016 $29,129 $ 30,417 $ 35,262 $ 36,408 $65,888 $67,079 $16,961 Net Income ($) 0.00% 0.50% 1.00% 1.50% 2.00% 2.50% 3.00% 3.50% 4.00% 4.50% 5.00% 2010* 2011* 2012* 2013* 2014* 2015* 1Q 2016* 4.24% 4.37% 4.24% 4.18% 3.93% 3.79% 3.76% Net Interest Margin
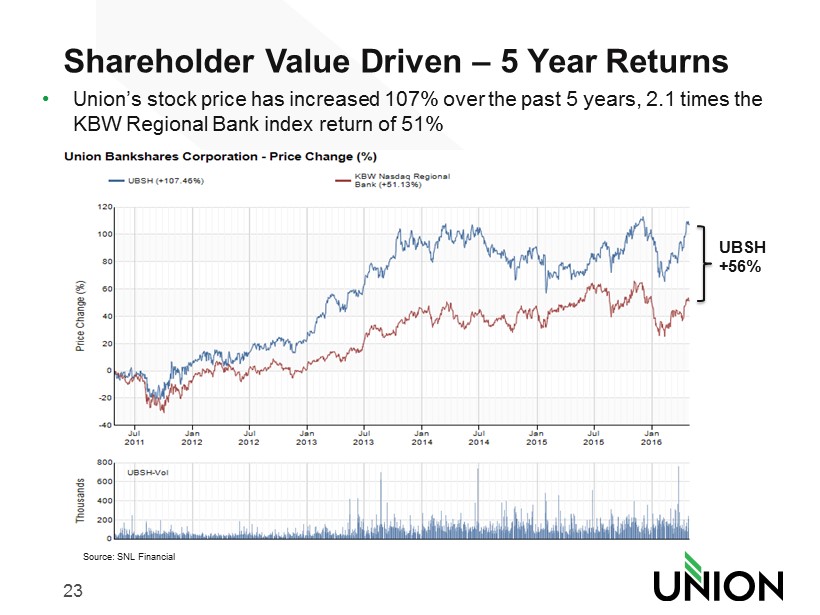
23 Shareholder Value Driven – 5 Year Returns • Union’s stock price has increased 107% over the past 5 years, 2.1 times the KBW Regional Bank index return of 51% Source: SNL Financial UBSH +56%
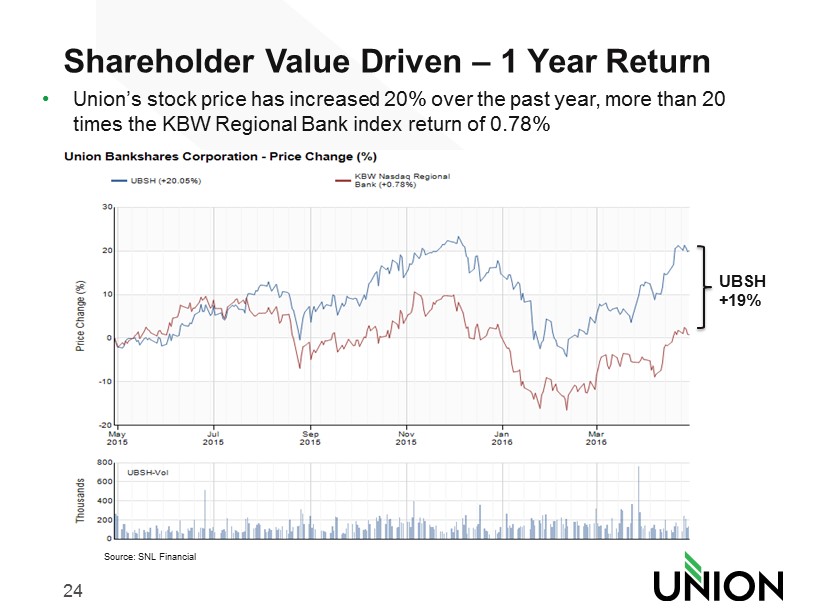
24 Shareholder Value Driven – 1 Year Return • Union’s stock price has increased 20% over the past year, more than 2 0 times the KBW Regional Bank index return of 0.78% Source: SNL Financial UBSH +19%
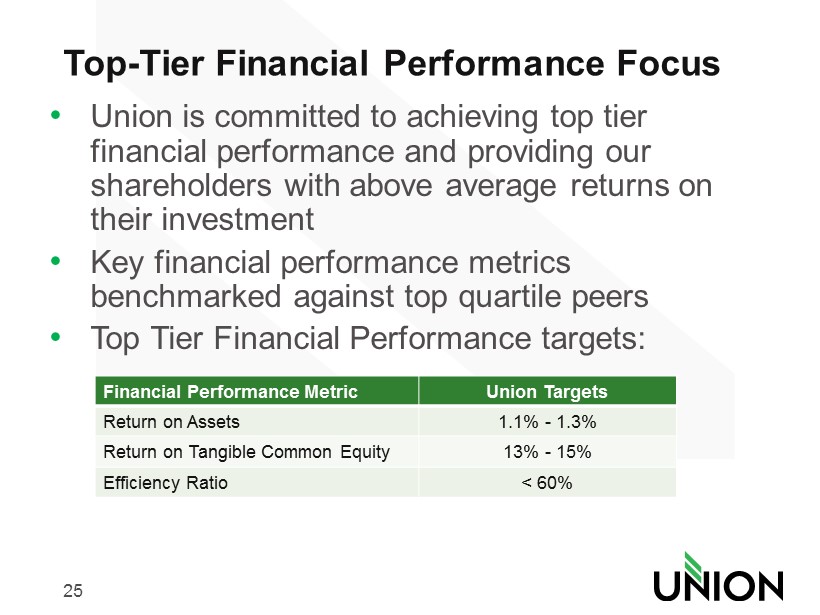
25 Top - Tier Financial Performance Focus • Union is committed to achieving top tier financial performance and providing our shareholders with above average returns on their investment • Key financial performance metrics benchmarked against top quartile peers • Top Tier Financial Performance targets: Financial Performance Metric Union Targets Return on Assets 1.1% - 1.3% Return on Tangible Common Equity 13% - 15% Efficiency Ratio < 60%
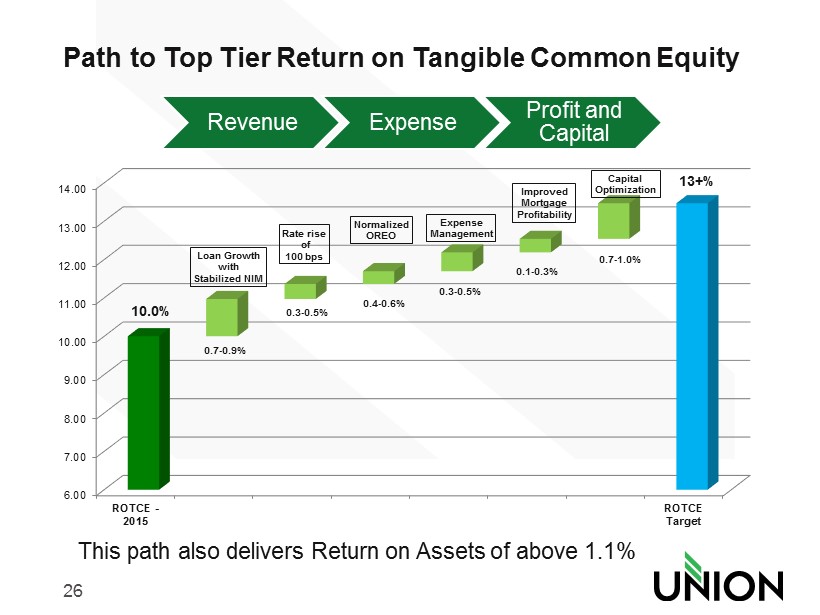
26 Path to Top Tier Return on Tangible Common Equity 6.00 7.00 8.00 9.00 10.00 11.00 12.00 13.00 14.00 ROTCE - 2015 ROTCE Target 0.7 - 0.9% 0.3 - 0.5% 0.4 - 0.6% 0.3 - 0.5% 0.1 - 0.3% 0.7 - 1.0% 13+% 10.0% Loan Growth with Stabilized NIM Rate rise of 100 bps Normalized OREO Expense Management Improved Mortgage Profitability Capital Optimization Revenue Expense Profit and Capital This path also delivers Return on Assets of above 1.1%
27 2016 Outlook • Stable to growing economy in footprint • Mid single digit loan growth • Modest net interest margin compression • Continued asset quality improvement – reduction of OREO expenses • Improving ROA, ROTCE and Efficiency Ratio • Closing 4 branches (net) in 2Q

28 Thank You!