
Exhibit 99.1
Investor Presentation February/March 2016
Forward - Looking Statement Certain statements in this report may constitute “forward - looking statements” within the meaning of the Private Securities Litigation Reform Act of 1995. Forward - looking statements are statements that include projections, predictions, expectations, or beliefs about future events or results or otherwise and are not statements of historical fact. Such statements are often characterized by the use of qualified words (and their derivatives) such as “expect,” “believe,” “estimate,” “plan,” “project,” “anticipate,” “intend,” “will,” or words of similar meaning or other statements concerning opinions or judgment of the Company and its management about future events. Although the Company believes that its expectations with respect to forward - looking statements are based upon reasonable assumptions within the bounds of its existing knowledge of its business and operations, there can be no assurance that actual results, performance, or achievements of the Company will not differ materially from any future results, performance, or achievements expressed or implied by such forward - looking statements. Actual future results and trends may differ materially from historical results or those anticipated depending on a variety of factors, including, but not limited to, the effects of and changes in: general economic and bank industry conditions, the interest rate environment, legislative and regulatory requirements, competitive pressures, new products and delivery systems, inflation, changes in the stock and bond markets, accounting standards or interpretations of existing standards, mergers and acquisitions, technology, and consumer spending and savings habits. More information is available on the Company’s website, http://investors.bankatunion.com and on the Securities and Exchange Commission’s website, www.sec.gov. The information on the Company’s website is not a part of this presentation. The Company does not intend or assume any obligation to update or revise any forward - looking statements that may be made from time to time by or on behalf of the Company. 2
Company Overview • The largest community banking organization headquartered in Virginia • Holding company formed in 1993 – Banking history goes back more than 100 years • 7 whole bank and 16 branch acquisitions since 1993 • Assets of $7.7 Billion • Comprehensive financial services provider offering • Commercial and r etail banking through Union Bank & Trust • Investment, wealth management and trust services • Mortgages primarily through Union Mortgage Group, LLC 3
Union’s Strengths • Unique branch network across Virginia, competitive banking products and services and a loyal customer base • Well positioned for organic growth given commercial activity, household income levels and population growth in its footprint • Strong balance sheet and solid capital base • Conservative in - market lender • Experienced management team • Successful acquirer and integrator • Proven financial performance in both good and bad economic climates 4
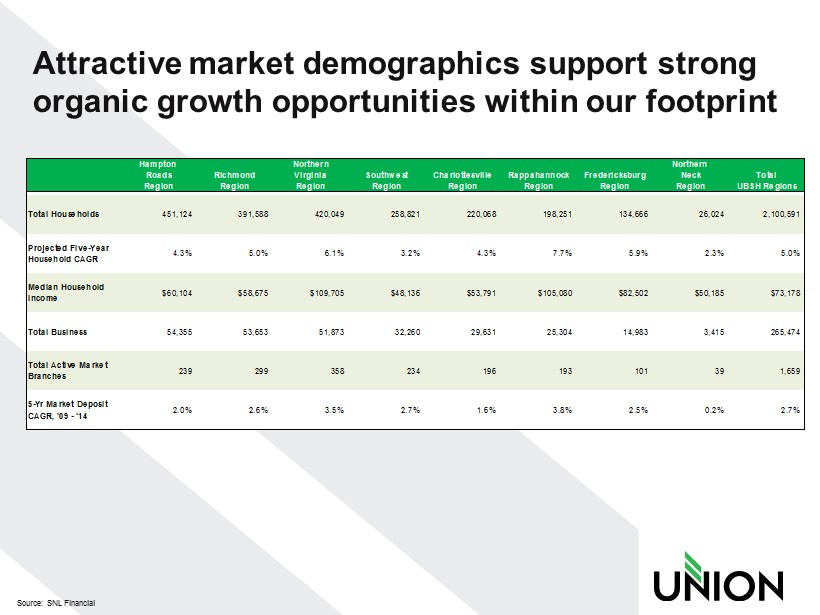
Source: SNL Financial Hampton Northern Northern Roads Richmond Virginia Southwest Charlottesville Rappahannock Fredericksburg Neck Total Region Region Region Region Region Region Region Region UBSH Regions Total Households 451,124 391,588 420,049 258,821 220,068 198,251 134,666 26,024 2,100,591 Projected Five-Year Household CAGR 4.3% 5.0% 6.1% 3.2% 4.3% 7.7% 5.9% 2.3% 5.0% Median Household Income $60,104 $58,675 $109,705 $48,136 $53,791 $105,080 $82,502 $50,185 $73,178 Total Business 54,355 53,653 51,873 32,260 29,631 25,304 14,983 3,415 265,474 Total Active Market Branches 239 299 358 234 196 193 101 39 1,659 5-Yr Market Deposit CAGR, '09 - '14 2.0% 2.6% 3.5% 2.7% 1.6% 3.8% 2.5% 0.2% 2.7% Attractive market demographics support strong organic growth opportunities within our footprint
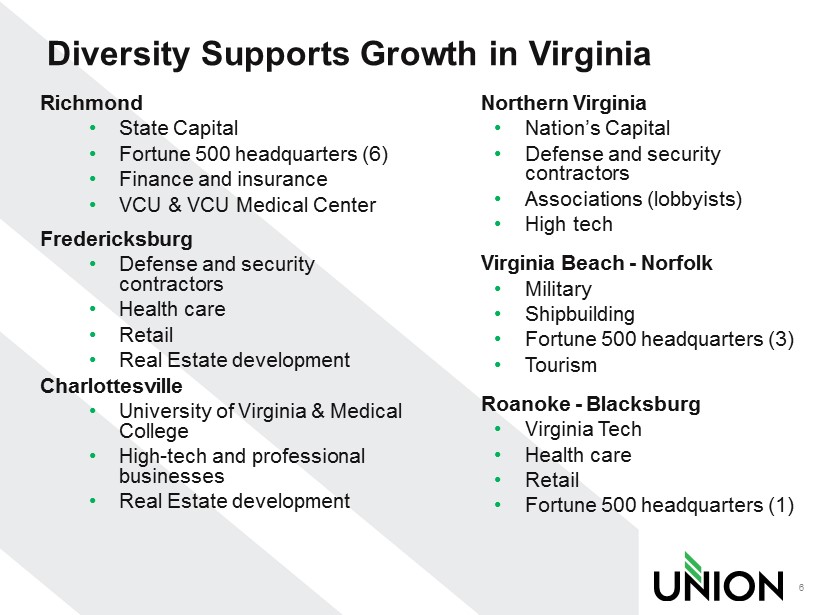
Diversity Supports Growth in Virginia Richmond • State Capital • Fortune 500 headquarters (6) • Finance and insurance • VCU & VCU Medical Center Fredericksburg • Defense and security contractors • Health care • Retail • Real Estate development Charlottesville • University of Virginia & Medical College • High - tech and professional businesses • Real Estate development Northern Virginia • Nation’s Capital • Defense and security contractors • Associations (lobbyists) • High tech Virginia Beach - Norfolk • Military • Shipbuilding • Fortune 500 headquarters (3) • Tourism Roanoke - Blacksburg • Virginia Tech • Health care • Retail • Fortune 500 headquarters (1) 6
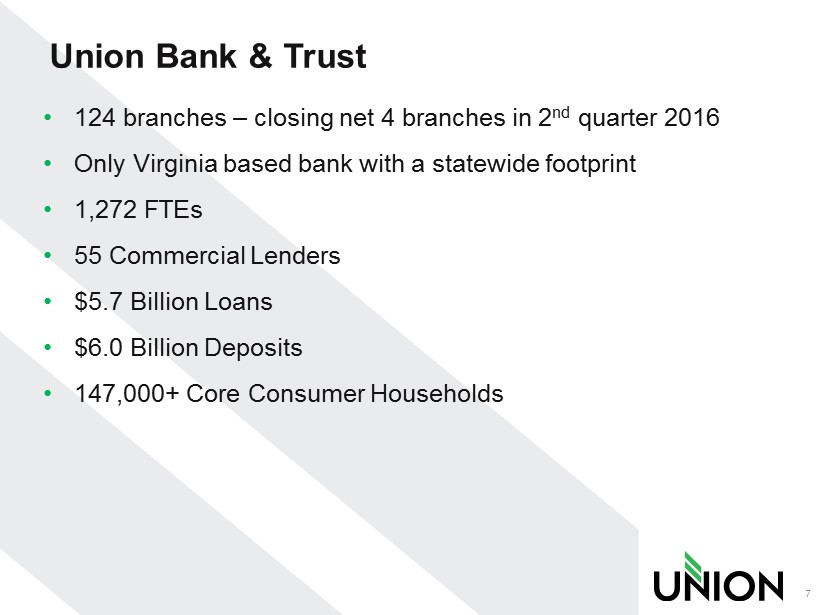
Union Bank & Trust • 124 branches – closing net 4 branches in 2 nd quarter 2016 • Only Virginia based bank with a statewide footprint • 1,272 FTEs • 5 5 Commercial Lenders • $ 5.7 Billion Loans • $6.0 Billion Deposits • 147,000+ Core Consumer Households 7
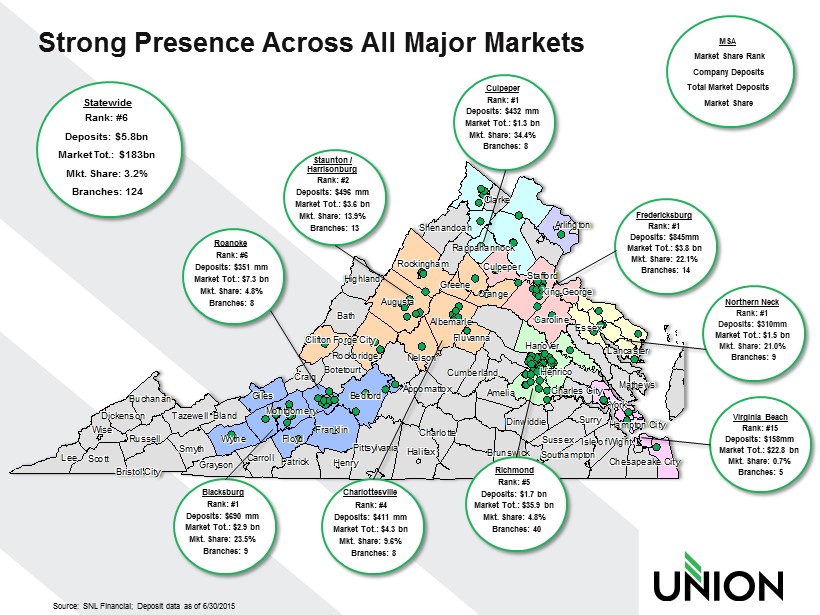
Rappahannock Rappahannock Rappahannock Rappahannock Rappahannock Rappahannock Rappahannock Rappahannock Rappahannock Rockbridge Rockbridge Rockbridge Rockbridge Rockbridge Rockbridge Rockbridge Rockbridge Rockbridge Nelson Nelson Nelson Nelson Nelson Nelson Nelson Nelson Nelson Accomack Accomack Accomack Accomack Accomack Accomack Accomack Accomack Accomack Albemarle Albemarle Albemarle Albemarle Albemarle Albemarle Albemarle Albemarle Albemarle Amelia Amelia Amelia Amelia Amelia Amelia Amelia Amelia Amelia Appomattox Appomattox Appomattox Appomattox Appomattox Appomattox Appomattox Appomattox Appomattox Arlington Arlington Arlington Arlington Arlington Arlington Arlington Arlington Arlington Augusta Augusta Augusta Augusta Augusta Augusta Augusta Augusta Augusta Bath Bath Bath Bath Bath Bath Bath Bath Bath Bedford Bedford Bedford Bedford Bedford Bedford Bedford Bedford Bedford Bland Bland Bland Bland Bland Bland Bland Bland Bland Botetourt Botetourt Botetourt Botetourt Botetourt Botetourt Botetourt Botetourt Botetourt Brunswick Brunswick Brunswick Brunswick Brunswick Brunswick Brunswick Brunswick Brunswick Buchanan Buchanan Buchanan Buchanan Buchanan Buchanan Buchanan Buchanan Buchanan Caroline Caroline Caroline Caroline Caroline Caroline Caroline Caroline Caroline Carroll Carroll Carroll Carroll Carroll Carroll Carroll Carroll Carroll Charles City Charles City Charles City Charles City Charles City Charles City Charles City Charles City Charles City Charlotte Charlotte Charlotte Charlotte Charlotte Charlotte Charlotte Charlotte Charlotte Clarke Clarke Clarke Clarke Clarke Clarke Clarke Clarke Clarke Craig Craig Craig Craig Craig Craig Craig Craig Craig Culpeper Culpeper Culpeper Culpeper Culpeper Culpeper Culpeper Culpeper Culpeper Cumberland Cumberland Cumberland Cumberland Cumberland Cumberland Cumberland Cumberland Cumberland Dickenson Dickenson Dickenson Dickenson Dickenson Dickenson Dickenson Dickenson Dickenson Dinwiddie Dinwiddie Dinwiddie Dinwiddie Dinwiddie Dinwiddie Dinwiddie Dinwiddie Dinwiddie Essex Essex Essex Essex Essex Essex Essex Essex Essex Floyd Floyd Floyd Floyd Floyd Floyd Floyd Floyd Floyd Fluvanna Fluvanna Fluvanna Fluvanna Fluvanna Fluvanna Fluvanna Fluvanna Fluvanna Franklin Franklin Franklin Franklin Franklin Franklin Franklin Franklin Franklin Giles Giles Giles Giles Giles Giles Giles Giles Giles Grayson Grayson Grayson Grayson Grayson Grayson Grayson Grayson Grayson Greene Greene Greene Greene Greene Greene Greene Greene Greene Halifax Halifax Halifax Halifax Halifax Halifax Halifax Halifax Halifax Hanover Hanover Hanover Hanover Hanover Hanover Hanover Hanover Hanover Henrico Henrico Henrico Henrico Henrico Henrico Henrico Henrico Henrico Henry Henry Henry Henry Henry Henry Henry Henry Henry Highland Highland Highland Highland Highland Highland Highland Highland Highland Isle of Wight Isle of Wight Isle of Wight Isle of Wight Isle of Wight Isle of Wight Isle of Wight Isle of Wight Isle of Wight King George King George King George King George King George King George King George King George King George Lancaster Lancaster Lancaster Lancaster Lancaster Lancaster Lancaster Lancaster Lancaster Lee Lee Lee Lee Lee Lee Lee Lee Lee Mathews Mathews Mathews Mathews Mathews Mathews Mathews Mathews Mathews Montgomery Montgomery Montgomery Montgomery Montgomery Montgomery Montgomery Montgomery Montgomery Orange Orange Orange Orange Orange Orange Orange Orange Orange Patrick Patrick Patrick Patrick Patrick Patrick Patrick Patrick Patrick Pittsylvania Pittsylvania Pittsylvania Pittsylvania Pittsylvania Pittsylvania Pittsylvania Pittsylvania Pittsylvania Rockingham Rockingham Rockingham Rockingham Rockingham Rockingham Rockingham Rockingham Rockingham Russell Russell Russell Russell Russell Russell Russell Russell Russell Scott Scott Scott Scott Scott Scott Scott Scott Scott Shenandoah Shenandoah Shenandoah Shenandoah Shenandoah Shenandoah Shenandoah Shenandoah Shenandoah Smyth Smyth Smyth Smyth Smyth Smyth Smyth Smyth Smyth Southampton Southampton Southampton Southampton Southampton Southampton Southampton Southampton Southampton Stafford Stafford Stafford Stafford Stafford Stafford Stafford Stafford Stafford Surry Surry Surry Surry Surry Surry Surry Surry Surry Sussex Sussex Sussex Sussex Sussex Sussex Sussex Sussex Sussex Tazewell Tazewell Tazewell Tazewell Tazewell Tazewell Tazewell Tazewell Tazewell Wise Wise Wise Wise Wise Wise Wise Wise Wise Wythe Wythe Wythe Wythe Wythe Wythe Wythe Wythe Wythe York York York York York York York York York Bristol City Bristol City Bristol City Bristol City Bristol City Bristol City Bristol City Bristol City Bristol City Chesapeake City Chesapeake City Chesapeake City Chesapeake City Chesapeake City Chesapeake City Chesapeake City Chesapeake City Chesapeake City Clifton Forge City Clifton Forge City Clifton Forge City Clifton Forge City Clifton Forge City Clifton Forge City Clifton Forge City Clifton Forge City Clifton Forge City Hampton City Hampton City Hampton City Hampton City Hampton City Hampton City Hampton City Hampton City Hampton City MSA Market Share Rank Company Deposits Total Market Deposits Market Share Roanoke Deposits: $351 mm Market Tot.: $7.3 bn Mkt. Share: 4.8% Rank: #6 Branches: 8 Staunton / Harrisonburg Rank: #2 Deposits: $496 mm Market Tot.: $3.6 bn Mkt. Share: 13.9% Branches: 13 Blacksburg Rank: #1 Deposits: $690 mm Market Tot.: $2.9 bn Mkt. Share: 23.5% Branches: 9 Charlottesville Rank: #4 Deposits: $411 mm Market Tot.: $4.3 bn Mkt. Share: 9.6% Branches: 8 Richmond Rank: #5 Deposits: $1.7 bn Market Tot.: $35.9 bn Mkt. Share: 4.8% Branches: 40 Culpeper Rank: #1 Deposits: $432 mm Market Tot.: $1.3 bn Mkt. Share: 34.4% Branches: 8 Fredericksburg Rank: #1 Deposits: $845mm Market Tot.: $3.8 bn Mkt. Share: 22.1% Branches: 14 Statewide Rank: #6 Deposits: $5.8bn Market Tot.: $183bn Mkt. Share: 3.2% Branches: 124 Strong Presence Across All Major Markets Northern Neck Rank: #1 Deposits: $310mm Market Tot.: $1.5 bn Mkt. Share: 21.0% Branches: 9 Virginia Beach Rank: #15 Deposits: $158mm Market Tot.: $22.8 bn Mkt. Share: 0.7% Branches: 5 Source: SNL Financial; Deposit data as of 6/30/2015
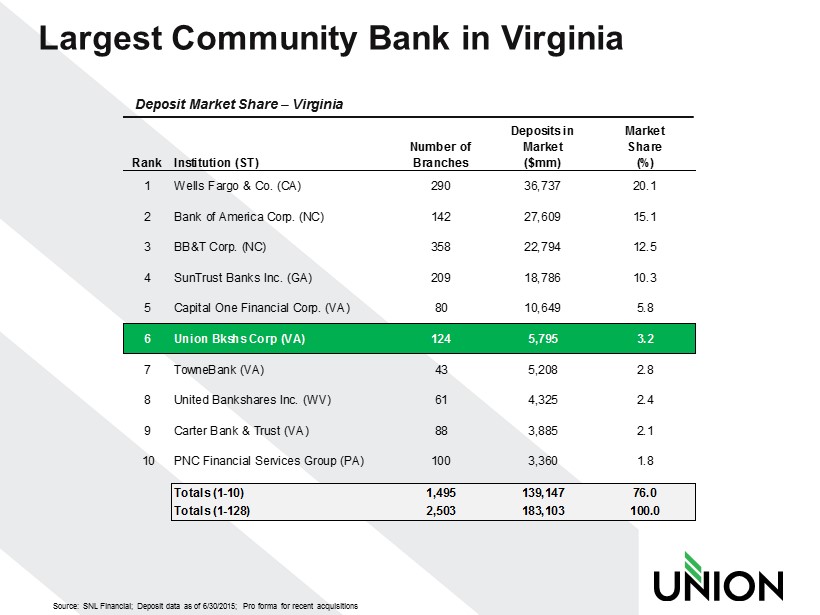
Source: SNL Financial; Deposit data as of 6/30/2015; Pro forma for recent acquisitions Largest Community Bank in Virginia Rank Institution (ST) Number of Branches Deposits in Market ($mm) Market Share (%) 1 Wells Fargo & Co. (CA) 290 36,737 20.1 2 Bank of America Corp. (NC) 142 27,609 15.1 3 BB&T Corp. (NC) 358 22,794 12.5 4 SunTrust Banks Inc. (GA) 209 18,786 10.3 5 Capital One Financial Corp. (VA) 80 10,649 5.8 6 Union Bkshs Corp (VA) 124 5,795 3.2 7 TowneBank (VA) 43 5,208 2.8 8 United Bankshares Inc. (WV) 61 4,325 2.4 9 Carter Bank & Trust (VA) 88 3,885 2.1 10 PNC Financial Services Group (PA) 100 3,360 1.8 Totals (1-10) 1,495 139,147 76.0 Totals (1-128) 2,503 183,103 100.0 Deposit Market Share – Virginia
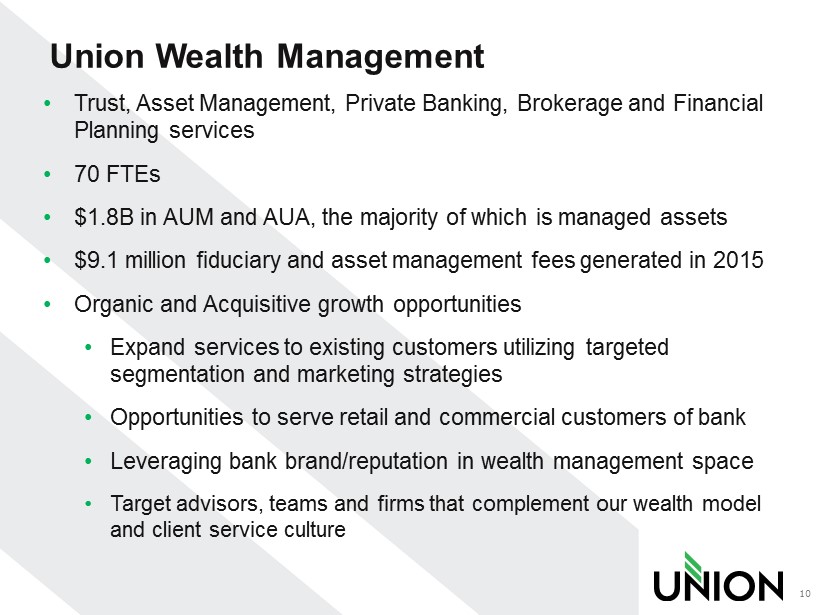
Union Wealth Management • Trust, Asset Management, Private Banking, Brokerage and Financial Planning services • 70 FTEs • $1.8B in AUM and AUA, the majority of which is managed assets • $9.1 million fiduciary and asset management fees generated in 2015 • Organic and Acquisitive growth opportunities • Expand services to existing customers utilizing targeted segmentation and marketing strategies • Opportunities to serve retail and commercial customers of bank • Leveraging bank brand/reputation in wealth management space • Target advisors, teams and firms that complement our wealth model and client service culture 10
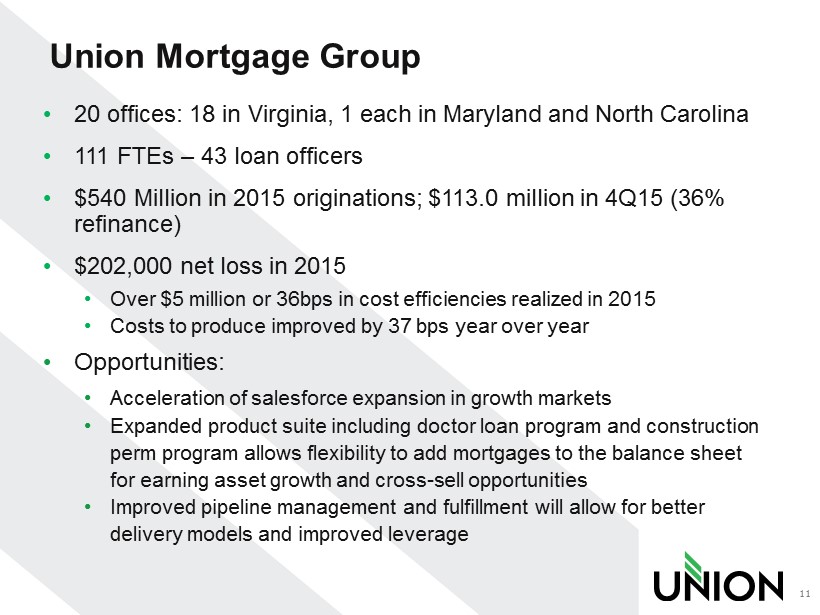
Union Mortgage Group • 20 offices: 18 in Virginia, 1 each in Maryland and North Carolina • 111 FTEs – 43 loan officers • $540 Million in 2015 originations; $113.0 million in 4Q15 (36% refinance) • $202,000 net loss in 2015 • Over $5 million or 36bps in cost efficiencies realized in 2015 • Costs to produce improved by 37 bps year over year • Opportunities: • Acceleration of salesforce expansion in growth markets • Expanded product suite including doctor loan program and construction perm program allows flexibility to add mortgages to the balance sheet for earning asset growth and cross - sell opportunities • Improved pipeline management and fulfillment will allow for better delivery models and improved leverage 11
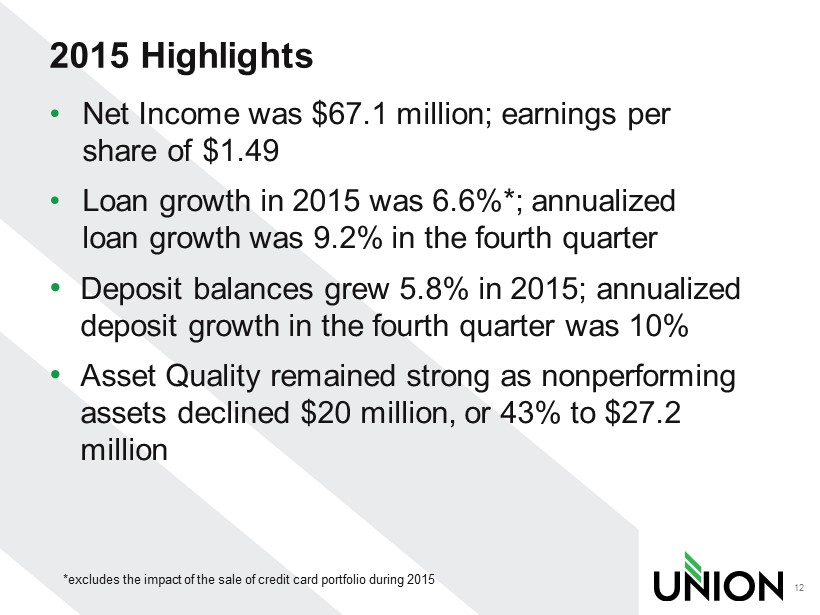
2015 Highlights • Net Income was $67.1 million; earnings per share of $1.49 • Loan growth in 2015 was 6.6%*; annualized loan growth was 9.2% in the fourth quarter • Deposit balances grew 5.8% in 2015; annualized deposit growth in the fourth quarter was 10% • Asset Quality remained strong as nonperforming assets declined $20 million, or 43% to $27.2 million 12 *excludes the impact of the sale of credit card portfolio during 2015
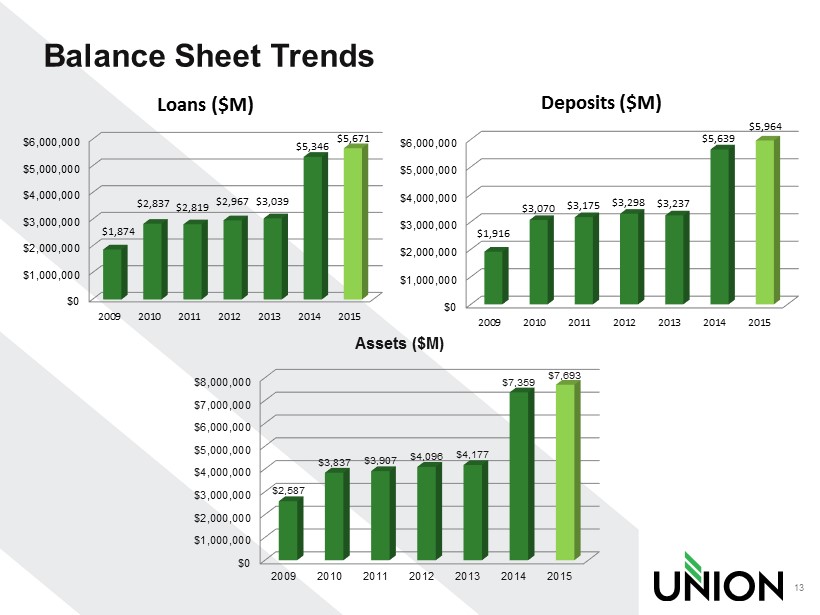
Balance Sheet Trends 13 $0 $1,000,000 $2,000,000 $3,000,000 $4,000,000 $5,000,000 $6,000,000 2009 2010 2011 2012 2013 2014 2015 $ 1,916 $ 3,070 $ 3,175 $ 3,298 $ 3,237 $ 5,639 $ 5,964 Deposits ($M) $0 $1,000,000 $2,000,000 $3,000,000 $4,000,000 $5,000,000 $6,000,000 2009 2010 2011 2012 2013 2014 2015 $ 1,874 $ 2,837 $ 2,819 $ 2,967 $ 3,039 $ 5,346 $ 5,671 Loans ($M) $0 $1,000,000 $2,000,000 $3,000,000 $4,000,000 $5,000,000 $6,000,000 $7,000,000 $8,000,000 2009 2010 2011 2012 2013 2014 2015 $2,587 $3,837 $3,907 $4,096 $4,177 $7,359 $7,693 Assets ($M)
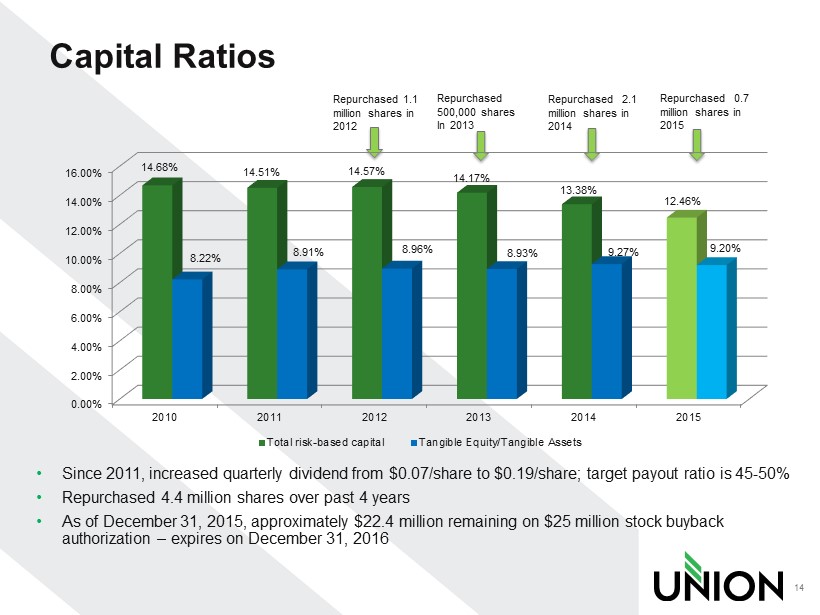
Repurchased 1.1 million shares in 2012 Capital Ratios 14 • Since 2011, increased quarterly dividend from $0.07/share to $ 0.19/share; target payout ratio is 45 - 50% • Repurchased 4.4 million shares over past 4 years • As of December 31, 2015, approximately $22.4 million remaining on $25 million stock buyback authorization – expires on December 31, 2016 Repurchased 500,000 shares In 2013 Repurchased 2.1 million shares in 2014 Repurchased 0.7 million shares in 2015 0.00% 2.00% 4.00% 6.00% 8.00% 10.00% 12.00% 14.00% 16.00% 2010 2011 2012 2013 2014 2015 14.68% 14.51% 14.57% 14.17% 13.38% 12.46% 8.22% 8.91% 8.96% 8.93% 9.27% 9.20% Total risk-based capital Tangible Equity/Tangible Assets
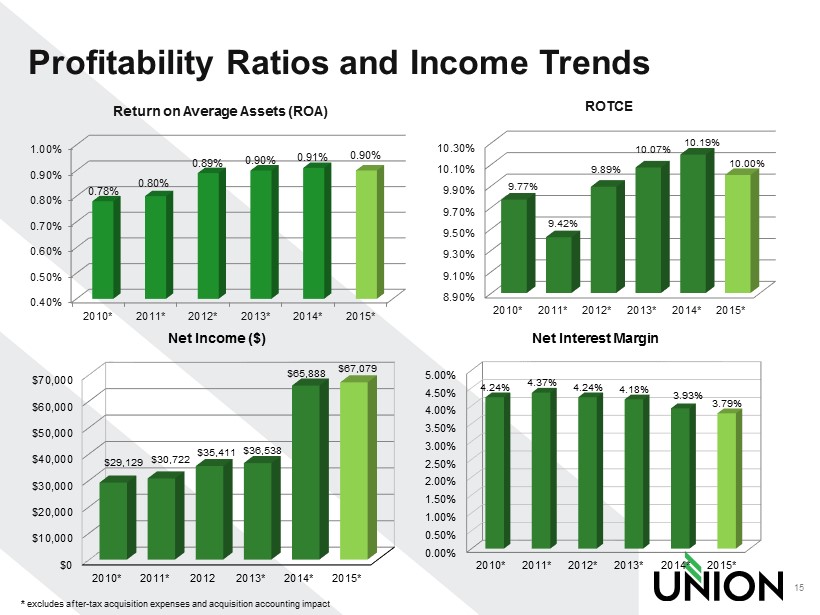
Profitability Ratios and Income Trends * excludes after - tax acquisition expenses and acquisition accounting impact 15 0.40% 0.50% 0.60% 0.70% 0.80% 0.90% 1.00% 2010* 2011* 2012* 2013* 2014* 2015* 0.78% 0.80% 0.89% 0.90% 0.91% 0.90% Return on Average Assets (ROA) 8.90% 9.10% 9.30% 9.50% 9.70% 9.90% 10.10% 10.30% 2010* 2011* 2012* 2013* 2014* 2015* 9.77% 9.42% 9.89% 10.07% 10.19% 10.00% ROTCE 0.00% 0.50% 1.00% 1.50% 2.00% 2.50% 3.00% 3.50% 4.00% 4.50% 5.00% 2010* 2011* 2012* 2013* 2014* 2015* 4.24% 4.37% 4.24% 4.18% 3.93% 3.79% Net Interest Margin $0 $10,000 $20,000 $30,000 $40,000 $50,000 $60,000 $70,000 2010* 2011* 2012 2013* 2014* 2015* $29,129 $30,722 $35,411 $36,538 $65,888 $67,079 Net Income ($)
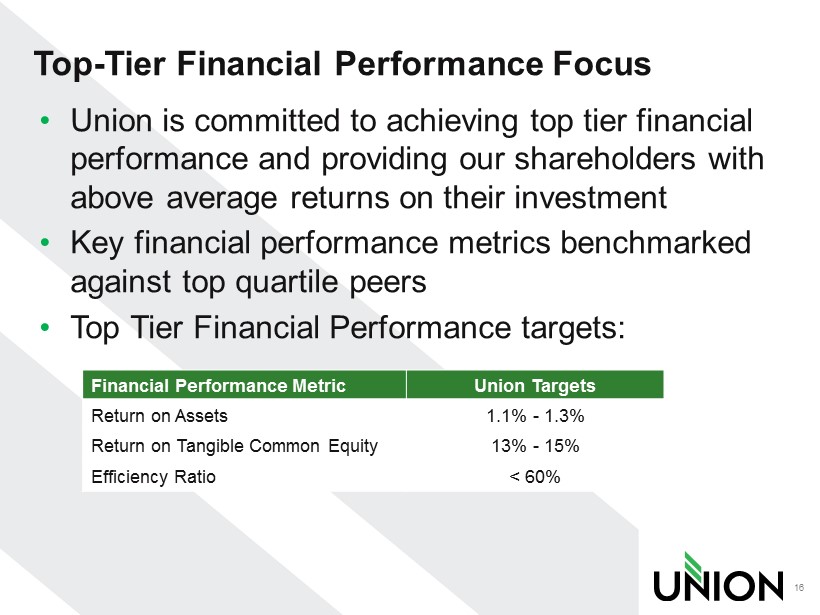
Top - Tier Financial Performance Focus • Union is committed to achieving top tier financial performance and providing our shareholders with above average returns on their investment • Key financial performance metrics benchmarked against top quartile peers • Top Tier Financial Performance targets: 16 Financial Performance Metric Union Targets Return on Assets 1.1% - 1.3% Return on Tangible Common Equity 13% - 15% Efficiency Ratio < 60%
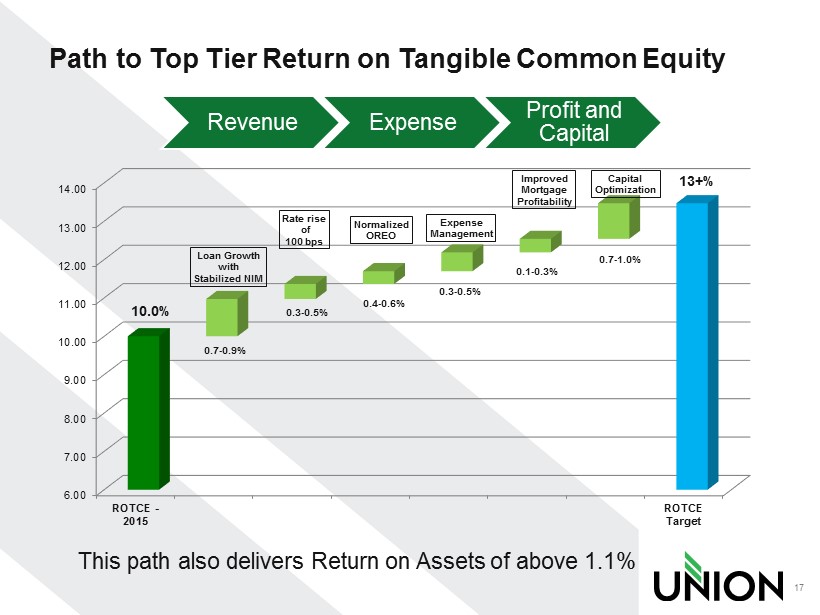
Path to Top Tier Return on Tangible Common Equity 6.00 7.00 8.00 9.00 10.00 11.00 12.00 13.00 14.00 ROTCE - 2015 ROTCE Target 0.7 - 0.9% 0.3 - 0.5% 0.4 - 0.6% 0.3 - 0.5% 0.1 - 0.3% 0.7 - 1.0% 13+% 10.0% Loan Growth with Stabilized NIM Rate rise of 100 bps Normalized OREO Expense Management Improved Mortgage Profitability Capital Optimization Revenue Expense Profit and Capital This path also delivers Return on Assets of above 1.1% 17
2016 Outlook • Stable to growing economy in footprint • Mid single digit loan growth • Modest net interest margin compression • Continued asset quality improvement – reduction of OREO expenses • Improving ROA, ROTCE and Efficiency Ratio • Closing 4 branches (net) in 2Q 18
Value Proposition • Statewide Branch footprint is a competitive advantage and brings a unique franchise value • Strong balance sheet and capital base • Organic growth and acquisition opportunities • Experienced management team • Committed to top tier financial performance • Shareholder Value Driven • Solid dividend yield and payout ratio with earnings upside 19

THANK YOU!