
Exhibit 99.2

Completing the “Golden Crescent” NYSE: AUB October 21, 2024 Merger Investor Presentation
Disclaimer and Caution About Forward - Looking Statements THE INFORMATION CONTAINED IN THIS PRESENTATION IS CONFIDENTIAL INFORMATION. ACCORDINGLY, THE INFORMATION INCLUDED HEREIN MAY NOT BE REFERRED TO, QUOTED OR OTHERWISE DISCLOSED BY YOU. IN REVIEWING THIS INFORMATION, YOU ARE ACKNOWLEDGING THE CONFIDENTIAL NATURE OF THIS INFORMATION AND ARE AGREEING TO ABIDE BY THE TERMS OF THIS DI SCLAIMER. THIS CONFIDENTIAL INFORMATION IS BEING MADE AVAILABLE TO EACH RECIPIENT SOLELY FOR ITS INFORMATION AND IS SUBJECT TO AMENDMENT. This presentation is made pursuant to Rule 163B of the Securities Act of 1933, as amended, and is intended solely for investo rs that are qualified institutional buyers or institutional accredited investors solely for the purposes of familiarizing such i nve stors with Atlantic Union Bankshares (the "Company", "AUB", "we" or "us"), Sandy Spring Bancorp, Inc. (“Sandy Spring” or “SASR”) and the proposed ac quisition of Sandy Spring by Atlantic Union. We are not currently making any offer to sell, or soliciting any offer to buy, s ecu rities, and cannot accept any orders for securities at this time. Any offering will be made pursuant to the Company's effective shelf reg ist ration statement filed with the Securities and Exchange Commission (the "SEC") and will be made only by means of a prospectus su pplement and accompanying base prospectus. You should read any such prospectus supplement before making any investment decision. This com munication shall not constitute an offer to sell or the solicitation of an offer to buy these securities, nor shall there be any sale of these securities in any state or jurisdiction in which such offer, solicitation or sale would be unlawful prior to registrati on or qualification under the securities laws of any such state or jurisdiction. Certain statements in this presentation constitute “forward - looking statements” within the meaning of the Private Securities Lit igation Reform Act of 1995. Examples of forward - looking statements include, but are not limited to, statements regarding the out look and expectations of Atlantic Union and Sandy Spring with respect to the proposed transaction, the strategic benefits and financia l b enefits of the proposed transaction, including the expected impact of the proposed transaction on the combined company’s futu re financial performance (including anticipated accretion to earnings per share, the tangible book value earn - back period and other operating and return metrics), the timing of the closing of the proposed transaction, the ability to successfully integrate the combine d businesses, and statements on the slides entitled "Transaction Highlights," "Transaction Structure & Terms," "Key Transaction Assumptions," "Estimated Pro Forma Financial Metr ics " and "Robust Ongoing Capital Generation.“ Such statements are often characterized by the use of qualified words (and their derivatives) such as “may,” “will,” “anticipate,” “could,” “should,” “would,” “believe,” “contempl ate ,” “expect,” “estimate,” “continue,” “plan,” “project” and “intend,” as well as words of similar meaning or other statements con cerning opinions or judgment of Atlantic Union or Sandy Spring or their management about future events. Forward - looking statements are based on assu mptions as of the time they are made and are subject to risks, uncertainties and other factors that are difficult to predict wit h regard to timing, extent, likelihood and degree of occurrence, which could cause actual results to differ materially from anticipated r esu lts, expressed or implied by such forward - looking statements. Such risks, uncertainties and assumptions, include, among others, the following: • the occurrence of any event, change or other circumstances that could give rise to the right of one or both of the parties to te rminate the merger agreement; • the failure to obtain necessary regulatory approvals (and the risk that such approvals may result in the imposition of condit ion s that could adversely affect the combined company or the expected benefits of the proposed transaction) and the approval by Atl antic Union shareholders and Sandy Spring shareholders, on a timely basis or at all; • the possibility that the anticipated benefits of the proposed transaction, including anticipated cost savings and strategic g ain s, are not realized when expected or at all; • the possibility that the integration of the two companies may be more difficult, time - consuming or costly than expected; • the impact of purchase accounting with respect to the proposed transaction, or any change in the assumptions used regarding t he assets acquired and liabilities assumed to determine their fair value and credit marks; • the outcome of any legal proceedings that may be instituted against Atlantic Union or Sandy Spring; • the possibility that the proposed transaction may be more expensive or take longer to complete than anticipated, including as a result of unexpected factors or events; • diversion of management’s attention from ongoing business operations and opportunities; • potential adverse reactions or changes to business or employee relationships, including those resulting from the announcement or completion of the proposed transaction; • changes in Atlantic Union’s or Sandy Spring’s share price before closing; • risks relating to the potential dilutive effect of shares of Atlantic Union’s common stock to be issued in the proposed trans act ion; • other factors that may affect future results of Atlantic Union or Sandy Spring including changes in asset quality and credit ris k; the inability to sustain revenue and earnings growth; changes in interest rates; deposit flows; inflation; customer borrow ing , repayment, investment and deposit practices; the impact, extent and timing of technological changes; capital management activities; and oth er actions of the Federal Reserve Board and legislative and regulatory actions and reforms. Although each of Atlantic Union and Sandy Spring believes that its expectations with respect to forward - looking statements are b ased upon reasonable assumptions within the bounds of its existing knowledge of its business and operations, there can be no ass urance that actual results of Atlantic Union or Sandy Spring will not differ materially from any projected future results expressed or implied by such forward - looking statements. Additional factors that could cause results to differ materially from those describe d above can be found in Atlantic Union’s most recent annual report on Form 10 - K and quarterly reports on Form 10 - Q, and other documents subsequently filed by Atlantic Union with the SEC, and in Sandy Spring’s most recent annual report on Form 10 - K and quarterly reports on Form 10 - Q, and other documents subsequently filed by Sandy Spring with the SEC. The actual results anticipated may not be realized or, e ven if substantially realized, they may not have the expected consequences to or effects on Atlantic Union, Sandy Spring or their r espective businesses or operations. Investors are cautioned not to rely too heavily on any such forward - looking statements. Forward - lookin g statements speak only as of the date they are made and Atlantic Union and Sandy Spring undertake no obligation to update or cl arify these forward - looking statements, whether as a result of new information, future events or otherwise. 2
Additional Information Important Additional Information and Where to Find It In connection with the proposed transaction, Atlantic Union intends to file with the SEC a Registration Statement on Form S - 4 (“Registration Statement”) that will include a join t proxy statement of Atlantic Union and Sandy Spring , which also constitutes a prospectus of Atlantic Union, (“Proxy Statement/Prospectus”), that will be sent to shareholders of Atlantic Union and shareholders of Sandy Spring seeking their approval of the proposed transaction and other related matters. Each of Atlantic Union and Sandy Spring also may file with the SEC other relevant documents concerning the proposed transaction. I nvestors and security holders of A tlantic U nion and investors and security holders of Sandy Spring are urged to read the registration statement and proxy statement/prospectus included with the registration statement when they become available, as well as any other relevant documents filed with the SEC in connection with the proposed transaction or incorporated by reference into the proxy statement/prospectus, as well as any amendments or supplements to those documents, because they will contain important information about A tlantic U nion, Sandy Spring , the proposed transaction and related matters. This communication does not constitute an offer to sell or the solicitation of an offer to buy any securities or the solicitation of any vote or approval with respect to the proposed transaction between Atlantic Union and Sandy Spring . No offer of securities shall be made except by means of a prospectus meeting the requirements of the Securities Act of 1933, as amended, and no offer to sell or solicitation of an offer to buy shall be made in any jurisdiction in which such offer, solicitation or sale would be unlawful prior to registration or qualification under the securities laws of such jurisdiction. A copy of the Registration Statement, Proxy Statement/Prospectus, as well as other filings containing information about Atlantic Union and Sandy Spring , may be obtained, free of charge, at the SEC’s website (http://www.sec.gov) when they are filed. You will also be able to obtain these documents, when they are filed, free of charge, from Atlantic Union by accessing Atlantic Union’s website at https://investors.atlanticunionbank.com or from Sandy Spring by accessing Sandy Spring ’s website at https://sandyspringbancorp.q4ir.com/ . Copies of the Registration Statement, Proxy Statement/Prospectus and the filings with the SEC that will be incorporated by reference therein can also be obtained, without charge, by directing a request to Atlantic Union Investor Relations, Atlantic Union Bankshares Corporation, 4300 Cox Road, Richmond, Virginia 23060, or by calling 804.448.0937, or to Sandy Spring by directing a request to Sandy Spring Investor Relations, Sandy Spring Bancorp , Inc., 17801 Georgia Avenue, Olney, Maryland 20832 , or by calling 301.774.8455 . The information on Atlantic Union’s and Sandy Spring ’s websites is not, and shall not be deemed to be, a part of this communication or incorporated into other filings either company makes with the SEC. Participants in the Solicitation Atlantic Union, Sandy Spring and certain of their respective directors, executive officers and employees may be deemed to be participants in the solicitation of proxies from the shareholders of Atlantic Union and the shareholders of Sandy Spring in respect of the proposed transaction. Information regarding Atlantic Union’s directors and executive officers is available in its definitive proxy statement, which was filed with the SEC on March 26, 2024, and the other documents filed with the SEC. Information regarding Sandy Spring’s directors and executive officers is available in its definitive proxy statement, which was filed with the SEC on April 10, 2024, and the other documents filed with the SEC. Information regarding the persons who may, under the rules of the SEC, be deemed participants in the proxy solicitation and a description of their direct and indirect interests, by security holdings or otherwise, will be contained in the Registration Statement, Proxy Statement/Prospectus and other relevant materials to be filed with the SEC, when they become available. Free copies of these documents may be obtained as described in the preceding paragraph. 3
Sandy Spring Data Unless otherwise indicated, data about Sandy Spring provided in this presentation, including financial information, has been obtained from Sandy Spring management and its public filings with the SEC. Pro Forma Forward - Looking Data Neither Atlantic Union’s nor Sandy Spring ’s independent registered public accounting firms have studied, reviewed or performed any procedures with respect to the pro forma forward - looking financial data for the purpose of inclusion in this presentation, and, accordingly, neither have expressed an opinion or provided any form of assurance with respect thereto for the purpose of this presentation. These pro forma forward - looking financial data are for illustrative purposes only and should not be relied on as necessarily being indicative of future results. The assumptions and estimates underlying the pr o forma forward - looking financial data are inherently uncertain and are subject to a wide variety of significant business, economic and competitive risks and uncertainties that could cause actual results to differ materially from those contained in the prospective financial information, including those in the “ Caution about Forward - Looking Statements” disclaimer on slide 2 of this presentation . Pro forma forward - looking financial data is inherently uncertain due to a number of factors outside of Atlantic Union’s and Sandy Spring ’s control. Accordingly, there can be no assurance that the prospective results are indicative of future performance of the combined company after the proposed acquisition or that actual results will not differ materially from those presented in the pro forma forward - looking financial data. Inclusion of pro forma financial data in this presentation should not be regarded as a representation by any person that the results contained in the prospective financial information will be achieved. Non - GAAP Financial Measures This presentation includes certain financial measures derived from consolidated financial data but not presented in accordance with U.S. generally accepted accounting principles (“GAAP”). The Company believes that these non - GAAP measures, when taken together with its financial results presented in accordance with GAAP, provide meaningful supplemental information regarding its operating performance and facilitate internal comparisons of its historical operating performance on a more consistent basis. These non - GAAP financial measures , however , are subject to inherent limitations, may not be comparable to similarly titled measures used by other companies and should not be considered in isolation or as an alternative to GAAP measures. Please refer to the Appendix for more information about the non - GAAP financial measures, and reconciliations of the non - GAAP financial measures to their most directly comparable GAAP financial measures. Market and Industry Data Unless otherwise indicated, market data and certain industry forecast data used in this presentation were obtained from internal reports, where appropriate, as well as third party sources and other publicly available information. Data regarding the industries in which the Company competes, its market position and market share within these industries are inherently imprecise and are subject to significant business, economic and competitive uncertainties beyond the Company's control. In addition, assumptions and estimates of the Company and its industries' future performance are necessarily subject to a high degree of uncertainty and risk due to a variety of factors. These and other factors could cause future performance to differ materially from assumptions and estimates. Additional Information 4
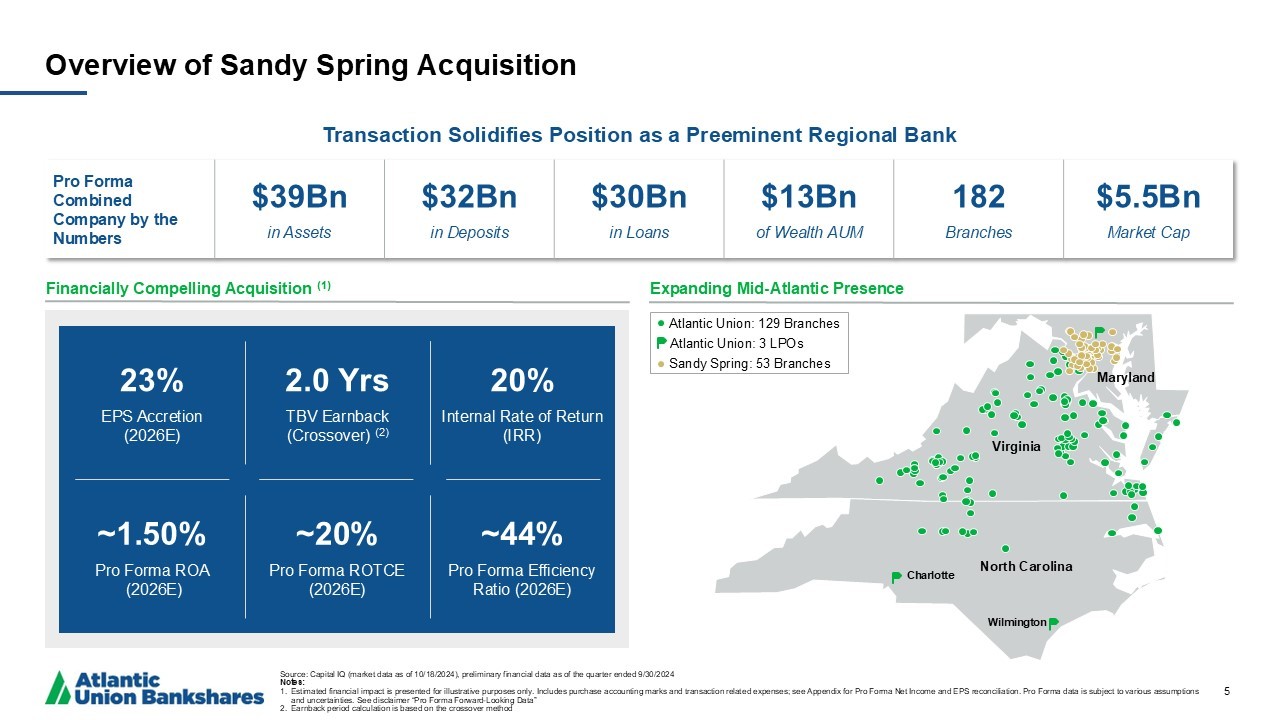
Source: Capital IQ (market data as of 10/18/2024), preliminary financial data as of the quarter ended 9/30/2024 Notes: 1. Estimated financial impact is presented for illustrative purposes only. Includes purchase accounting marks and transaction re lat ed expenses; see Appendix for Pro Forma Net Income and EPS reconciliation. Pro Forma data is subject to various assumptions and uncertainties. See disclaimer “Pro Forma Forward - Looking Data” 2. Earnback period calculation is based on the crossover method Overview of Sandy Spring Acquisition 5 $5.5Bn Market Cap 182 Branches $13Bn of Wealth AUM $30Bn in Loans $32Bn in Deposits $39Bn in Assets Pro Forma Combined Company by the Numbers Transaction Solidifies Position as a Preeminent Regional Bank Financially Compelling Acquisition (1) Expanding Mid - Atlantic Presence Virginia North Carolina Maryland 20% Internal Rate of Return (IRR) ~1.50% Pro Forma ROA ( 2026E) ~20% Pro Forma ROTCE (2026E) ~44% Pro Forma Efficiency Ratio (2026E) 23% EPS Accretion (2026E) 2.0 Yrs TBV Earnback (Crossover) (2) Atlantic Union: 129 Branches Atlantic Union: 3 LPOs Sandy Spring: 53 Branches Charlotte Wilmington
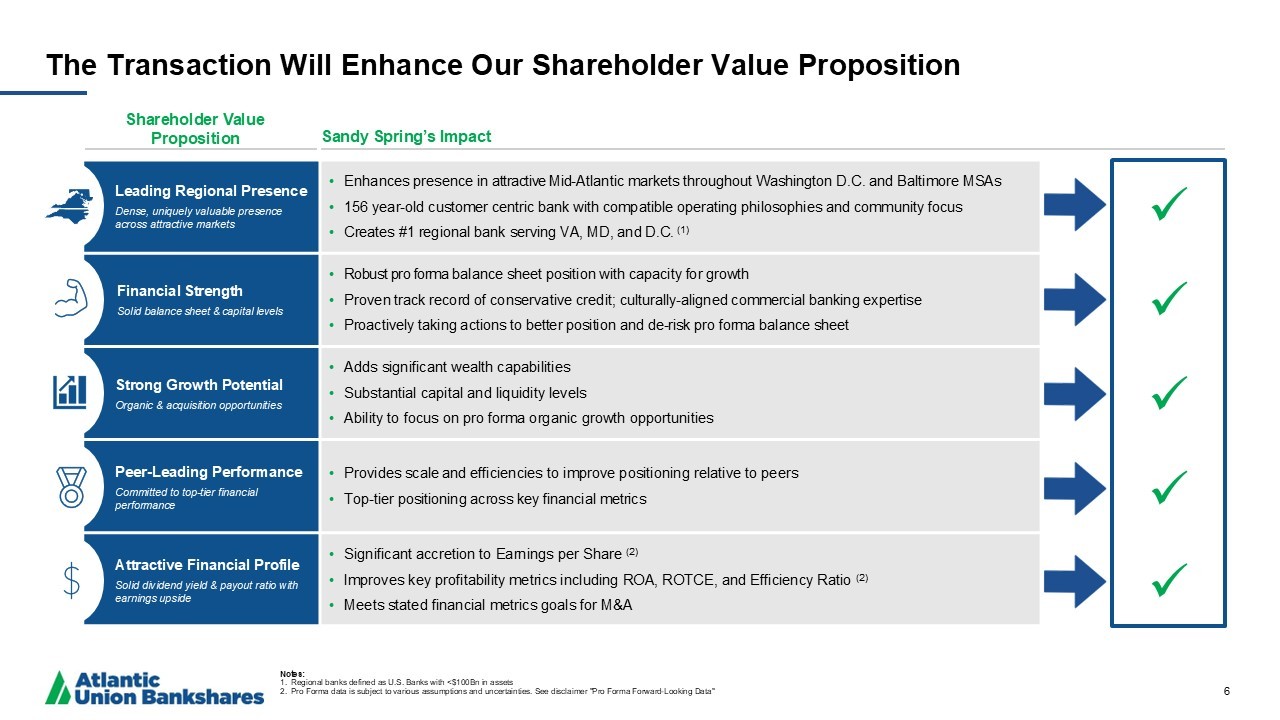
Notes: 1. Regional banks defined as U.S. Banks with <$100Bn in assets 2. Pro Forma data is subject to various assumptions and uncertainties. See disclaimer "Pro Forma Forward - Looking Data" The Transaction Will Enhance Our Shareholder Value Proposition 6 • E nhances presence in attractive Mid - Atlantic markets throughout Washington D.C. and Baltimore MSAs • 156 year - old customer centric bank with compatible operating philosophies and community focus • Creates #1 regional bank serving VA, MD, and D.C. (1) • Robust pro forma balance sheet position with capacity for growth • P roven track record of conservative credit ; culturally - aligned commercial banking expertise • Proactively taking actions to better position and de - risk pro forma balance sheet • Adds significant wealth capabilities • Substantial capital and liquidity levels • Ability to focus on pro forma organic growth opportunities • Provides scale and efficiencies to improve positioning relative to peers • Top - tier positioning across key financial metrics • Significant accretion to Earnings per Share (2) • Improves key profitability metrics including ROA, ROTCE, and Efficiency Ratio (2) • Meets stated financial metrics goals for M&A x x x x x Leading Regional Presence Dense, uniquely valuable presence across attractive markets Financial Strength Solid balance sheet & capital levels Strong Growth Potential Organic & acquisition opportunities Peer - Leading Performance Committed to top - tier financial performance Attractive Financial Profile Solid dividend yield & payout ratio with earnings upside Sandy Spring’s Impact Shareholder Value Proposition
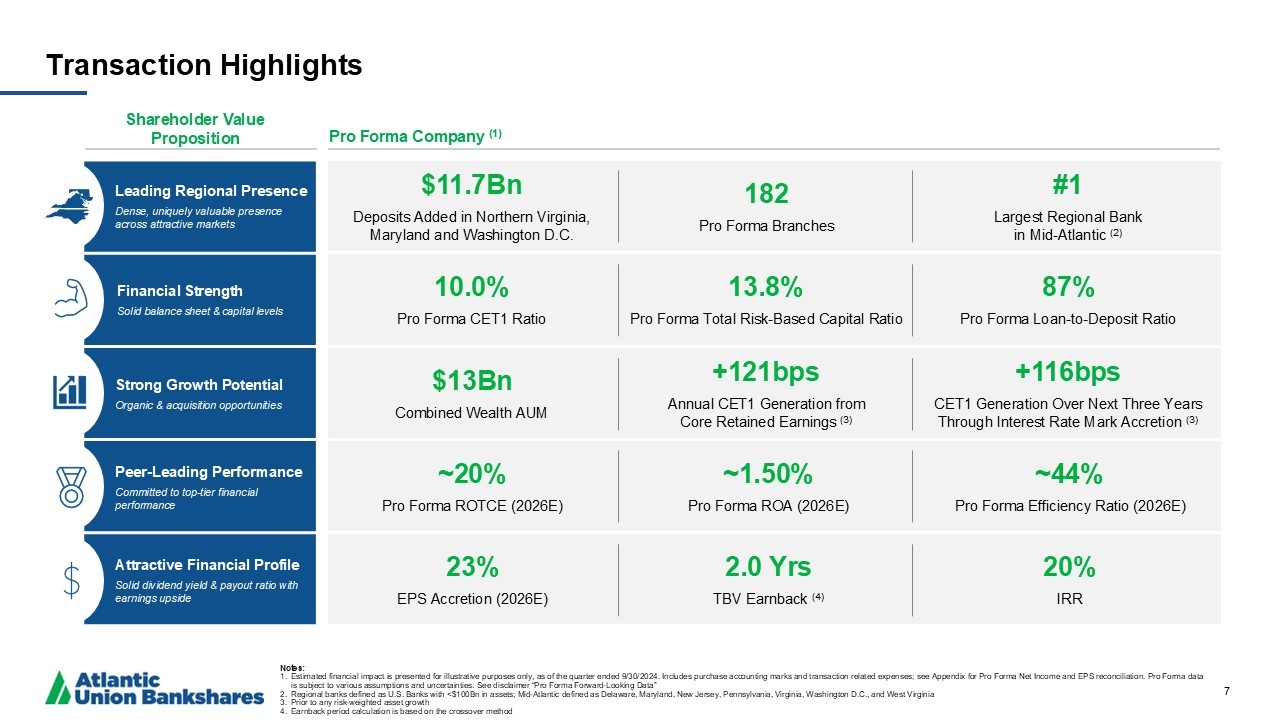
Notes: 1. Estimated financial impact is presented for illustrative purposes only, as of the quarter ended 9/30/2024. Includes purchase acc ounting marks and transaction related expenses; see Appendix for Pro Forma Net Income and EPS reconciliation. Pro Forma data is subject to various assumptions and uncertainties. See disclaimer “Pro Forma Forward - Looking Data” 2. Regional banks defined as U.S. Banks with <$100Bn in assets; Mid - Atlantic defined as Delaware, Maryland, New Jersey, Pennsylvani a, Virginia, Washington D.C., and West Virginia 3. Prior to any risk - weighted asset growth 4. Earnback period calculation is based on the crossover method Transaction Highlights 7 Leading Regional Presence Dense, uniquely valuable presence across attractive markets Financial Strength Solid balance sheet & capital levels Strong Growth Potential Organic & acquisition opportunities Peer - Leading Performance Committed to top - tier financial performance Attractive Financial Profile Solid dividend yield & payout ratio with earnings upside Pro Forma Company (1) Shareholder Value Proposition 10.0% Pro Forma CET1 Ratio 87% Pro Forma Loan - to - Deposit Ratio 13.8% Pro Forma Total Risk - Based Capital Ratio ~20% Pro Forma ROTCE (2026E) ~44% Pro Forma Efficiency Ratio (2026E) ~1.50% Pro Forma ROA (2026E) 23% EPS Accretion (2026E) 20% IRR 2.0 Yrs TBV Earnback (4) $13Bn Combined Wealth AUM +116bps CET1 Generation Over Next Three Years Through Interest Rate Mark Accretion (3) +121bps Annual CET1 Generation from Core Retained Earnings (3) $11.7Bn Deposits Added in Northern Virginia, Maryland and Washington D.C. #1 Largest Regional Bank in Mid - Atlantic (2) 182 Pro Forma Branches
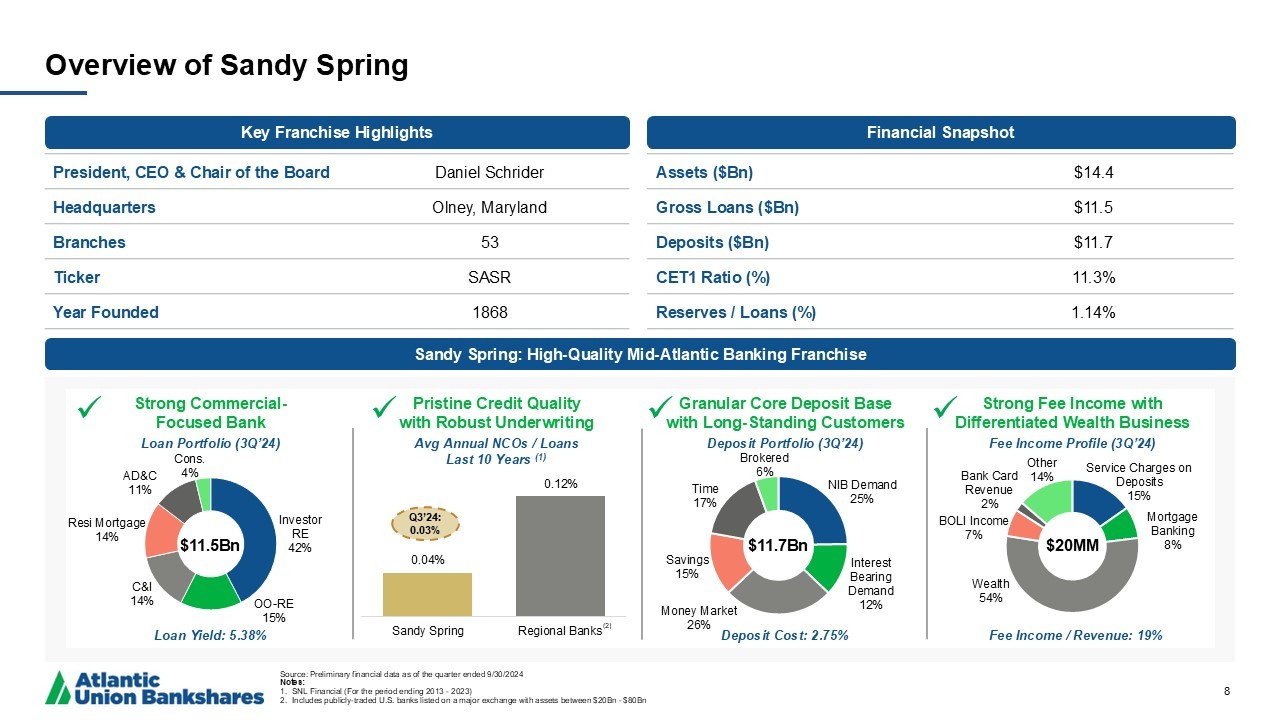
Overview of Sandy Spring 8 Financial Snapshot Strong Fee Income with Differentiated Wealth Business Key Franchise Highlights Source: Preliminary financial data as of the quarter ended 9/30/2024 Notes: 1. SNL Financial (For the period ending 2013 - 2023) 2. Includes publicly - traded U.S. banks listed on a major exchange with assets between $20Bn - $80Bn Pristine Credit Quality with Robust Underwriting Daniel Schrider President, CEO & Chair of the Board Olney, Maryland Headquarters 53 Branches SASR Ticker 1868 Year Founded $14.4 Assets ($Bn) $11.5 Gross Loans ($Bn) $11.7 Deposits ($Bn) 11.3% CET1 Ratio (%) 1.14% Reserves / Loans (%) Granular Core Deposit Base with Long - Standing Customers Strong Commercial - Focused Bank Avg Annual NCOs / Loans Last 10 Years (1) Investor RE 42% OO - RE 15% C&I 14% Resi Mortgage 14% AD&C 11% Cons. 4% $11.5Bn Loan Portfolio (3Q’24) Deposit Portfolio (3Q’24) Fee Income Profile (3Q’24) Sandy Spring: High - Quality Mid - Atlantic Banking Franchise x x x x (2) Loan Yield: 5.38% Q3’24: 0.03% Service Charges on Deposits 15% Mortgage Banking 8% Wealth 54% BOLI Income 7% Bank Card Revenue 2% Other 14% $20MM Fee Income / Revenue: 19% $11.7Bn Deposit Cost: 2.75% NIB Demand 25% Interest Bearing Demand 12% Money Market 26% Savings 15% Time 17% Brokered 6% 0.04% 0.12% Sandy Spring Regional Banks
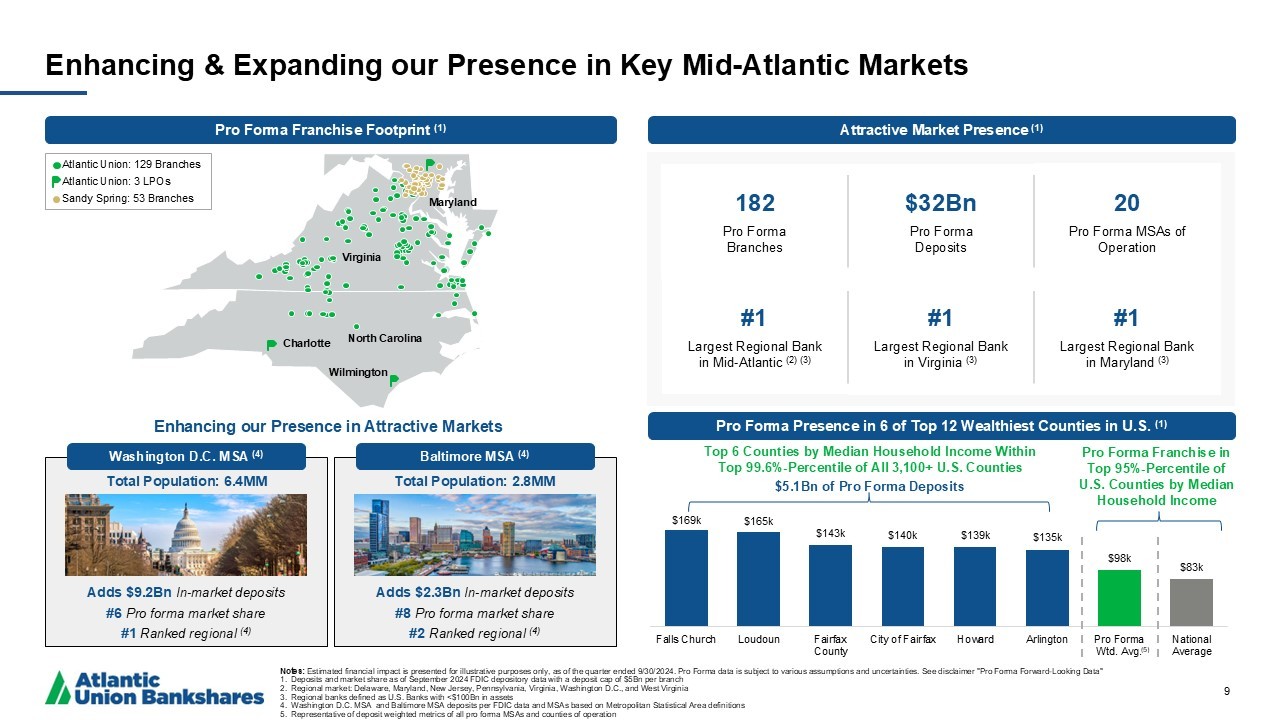
$169k $165k $143k $140k $139k $135k $98k $83k Falls Church Loudoun Fairfax County City of Fairfax Howard Arlington Pro Forma Wtd. Avg. National Average Enhancing & Expanding our Presence in Key Mid - Atlantic Markets Notes: Estimated financial impact is presented for illustrative purposes only, as of the quarter ended 9/30/2024. Pro Forma data is sub ject to various assumptions and uncertainties. See disclaimer "Pro Forma Forward - Looking Data" 1. Deposits and market share as of September 2024 FDIC depository data with a deposit cap of $5Bn per branch 2. Regional market: Delaware, Maryland, New Jersey, Pennsylvania, Virginia, Washington D.C., and West Virginia 3. Regional banks defined as U.S. Banks with <$100Bn in assets 4. Washington D.C. MSA and Baltimore MSA deposits per FDIC data and MSAs based on Metropolitan Statistical Area definitions 5. Representative of deposit weighted metrics of all pro forma MSAs and counties of operation 9 #1 Largest Regional Bank in Mid - Atlantic (2) (3) 20 Pro Forma MSAs of Operation #1 Largest Regional Bank in Virginia (3) #1 Largest Regional Bank in Maryland (3) 182 Pro Forma Branches $32Bn Pro Forma Deposits Attractive Market Presence (1) Enhancing our Presence in Attractive Markets Washington D.C. MSA (4) Adds $9.2Bn In - market deposits #6 Pro forma market share #1 Ranked regional (4) Baltimore MSA (4) Adds $2.3Bn In - market deposits #8 Pro forma market share #2 Ranked regional (4) Atlantic Union: 129 Branches Atlantic Union: 3 LPOs Sandy Spring: 53 Branches Pro Forma Franchise Footprint (1) Virginia North Carolina Maryland Charlotte Wilmington Pro Forma Presence in 6 of Top 12 Wealthiest Counties in U.S. (1) Top 6 Counties by Median Household Income Within Top 99.6% - Percentile of All 3,100+ U.S. Counties $5.1Bn of Pro Forma Deposits Pro Forma Franchise in Top 95% - Percentile of U.S. Counties by Median Household Income (5) Total Population: 6.4MM Total Population: 2.8MM
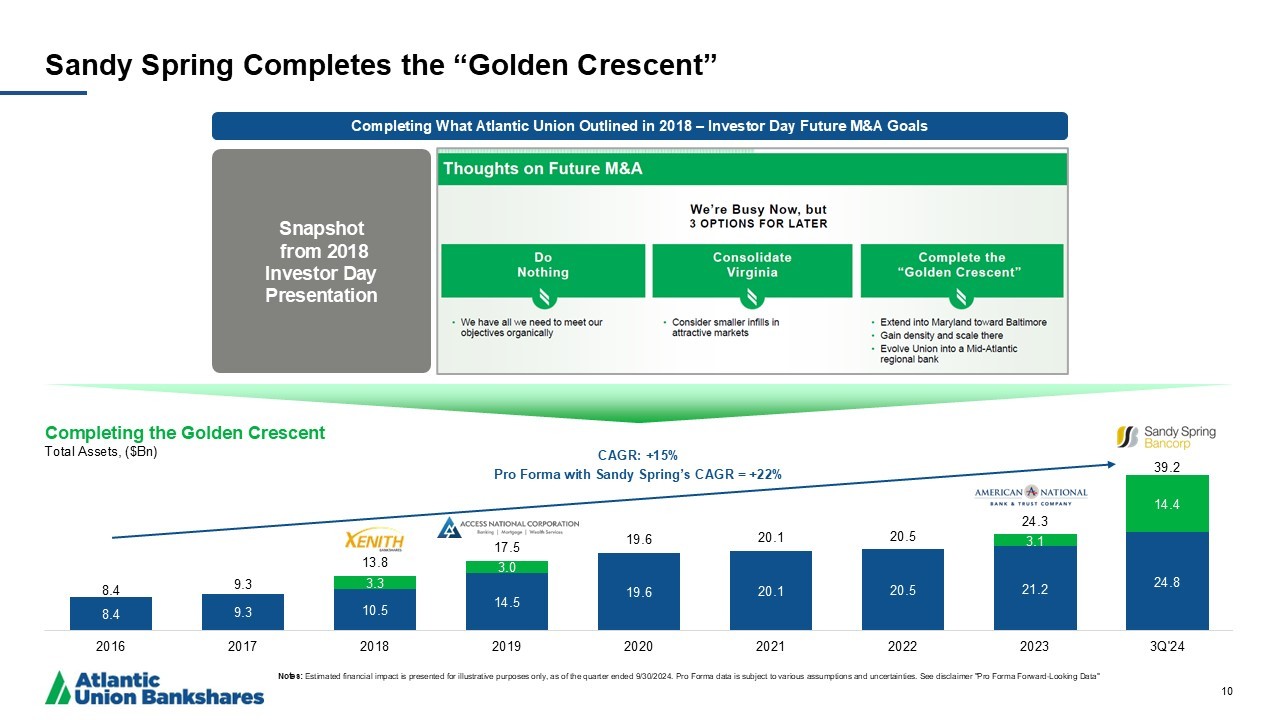
8.4 9.3 10.5 14.5 19.6 20.1 20.5 21.2 24.8 3.3 3.0 3.1 14.4 8.4 9.3 13.8 17.5 19.6 20.1 20.5 24.3 39.2 2016 2017 2018 2019 2020 2021 2022 2023 3Q'24 Sandy Spring Completes the “Golden Crescent” 10 Completing What Atlantic Union Outlined in 2018 – Investor Day Future M&A Goals Snapshot from 2018 Investor Day Presentation Completing the Golden Crescent Total Assets, ($Bn) CAGR: +15% Pro Forma with Sandy Spring’s CAGR = +22% Notes: Estimated financial impact is presented for illustrative purposes only , as of the quarter ended 9/30/2024. Pro Forma data is subject to various assumptions and uncertainties. See disclaimer "Pro Forma Forward - Looking Data"
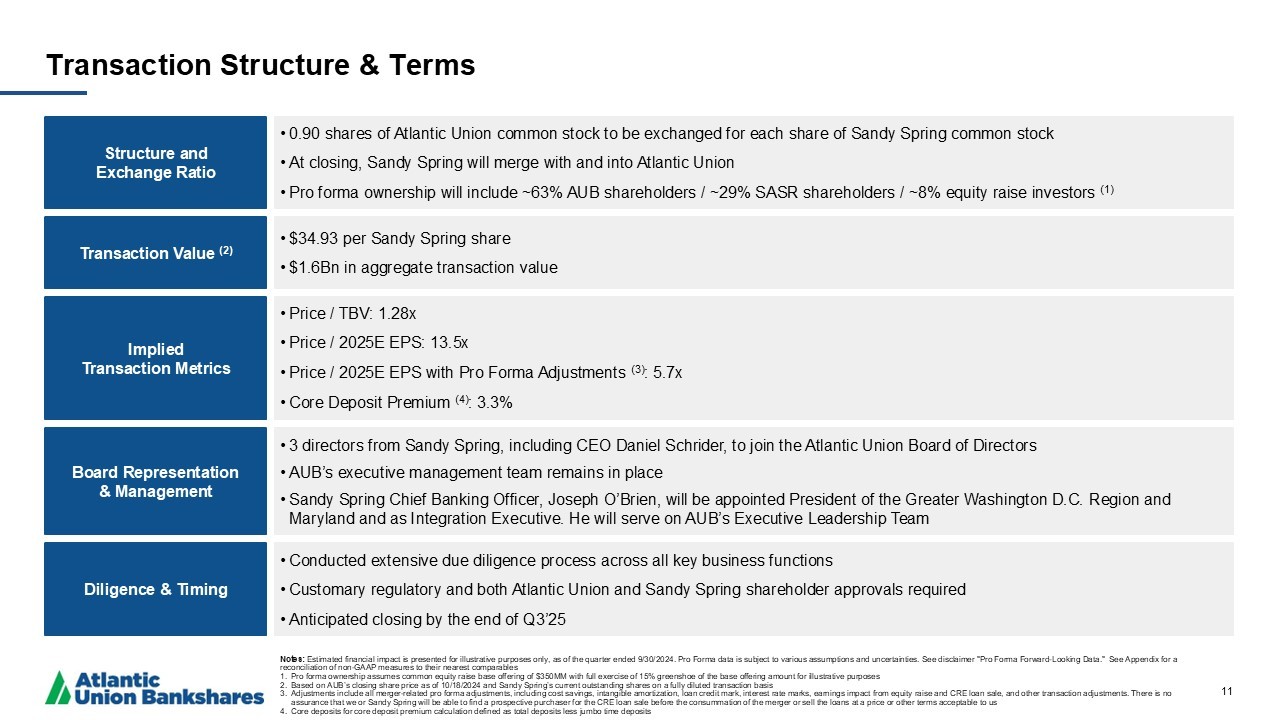
• 0.90 shares of Atlantic Union common stock to be exchanged for each share of Sandy Spring common stock • At closing, Sandy Spring will merge with and into Atlantic Union • Pro forma ownership will include ~63% AUB shareholders / ~29% SASR shareholders / ~8% equity raise investors (1) Transaction Structure & Terms 11 Structure and Exchange Ratio Transaction Value (2) • $ 34.93 per Sandy Spring share • $1.6Bn in aggregate transaction value Implied Transaction Metrics • Price / TBV: 1.28x • Price / 2025E EPS: 13.5x • Price / 2025E EPS with Pro Forma Adjustments (3) : 5.7x • Core Deposit Premium (4) : 3.3% Board Representation & Management • 3 directors from Sandy Spring, including CEO Daniel Schrider, to join the Atlantic Union Board of Directors • AUB’s executive management team remains in place • Sandy Spring Chief Banking Officer, Joseph O’Brien, will be appointed President of the Greater Washington D.C. Region and Maryland and as Integration Executive. He will serve on AUB’s Executive Leadership Team Diligence & Timing • Conducted extensive due diligence process across all key business functions • Customary regulatory and both Atlantic Union and Sandy Spring shareholder approvals required • Anticipated closing by the end of Q3’25 Notes: Estimated financial impact is presented for illustrative purposes only, as of the quarter ended 9/30/2024. Pro Forma data is sub ject to various assumptions and uncertainties. See disclaimer "Pro Forma Forward - Looking Data." See Appendix for a reconciliation of non - GAAP measures to their nearest comparables 1. Pro forma ownership assumes common equity raise base offering of $350MM with full exercise of 15% greenshoe of the base offer ing amount for illustrative purposes 2. Based on AUB’s closing share price as of 10/18/2024 and Sandy Spring’s current outstanding shares on a fully diluted transact ion basis 3. Adjustments include all merger - related pro forma adjustments, including cost savings, intangible amortization, loan credit mark, interest rate marks, earnings impact from equity raise and CRE loan sale, and other transaction adjustments . There is no assurance that we or Sandy Spring will be able to find a prospective purchaser for the CRE loan sale before the consummation of the merger or sell the loans at a price or other terms acceptable to us 4. Core deposits for core deposit premium calculation defined as total deposits less jumbo time deposits
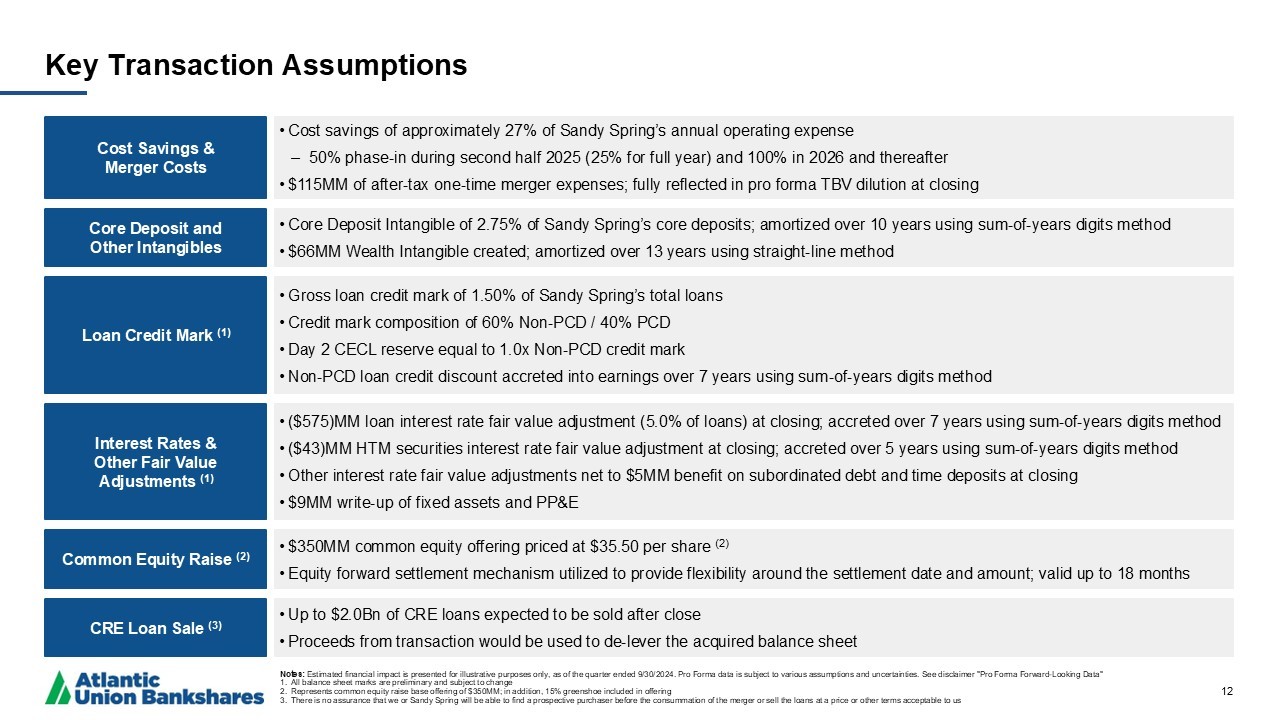
Cost Savings & Merger Costs • Cost savings of approximately 27% of Sandy Spring’s annual operating expense ‒ 50% phase - in during second half 2025 (25% for full year) and 100% in 2026 and thereafter • $115MM of after - tax one - time merger expenses; fully reflected in pro forma TBV dilution at closing Key Transaction Assumptions 12 Loan Credit Mark (1) Interest Rates & Other Fair Value Adjustments (1) Core Deposit and Other Intangibles Common Equity Raise (2) CRE Loan Sale (3) • Gross loan credit mark of 1.50% of Sandy Spring’s total loans • Credit mark composition of 60% Non - PCD / 40% PCD • Day 2 CECL reserve equal to 1.0x Non - PCD credit mark • Non - PCD loan credit discount accreted into earnings over 7 years using sum - of - years digits method • ($575)MM loan interest rate fair value adjustment (5.0% of loans) at closing; accreted over 7 years using sum - of - years digits me thod • ($43)MM HTM securities interest rate fair value adjustment at closing; accreted over 5 years using sum - of - years digits method • Other interest rate fair value adjustments net to $5MM benefit on subordinated debt and time deposits at closing • $9MM write - up of fixed assets and PP&E • Core Deposit Intangible of 2.75% of Sandy Spring’s core deposits; amortized over 10 years using sum - of - years digits method • $66MM Wealth Intangible created; amortized over 13 years using straight - line method • $350MM common equity offering priced at $35.50 per share (2) • Equity forward settlement mechanism utilized to provide flexibility around the settlement date and amount; valid up to 18 mon ths • Up to $2.0Bn of CRE loans expected to be sold after close • Proceeds from transaction would be used to de - lever the acquired balance sheet Notes: Estimated financial impact is presented for illustrative purposes only, as of the quarter ended 9/30/2024. Pro Forma data is sub ject to various assumptions and uncertainties. See disclaimer "Pro Forma Forward - Looking Data" 1. All balance sheet marks are preliminary and subject to change 2. Represents common equity raise base offering of $350MM; in addition, 15% greenshoe included in offering 3. There is no assurance that we or Sandy Spring will be able to find a prospective purchaser before the consummation of the mer ger or sell the loans at a price or other terms acceptable to us
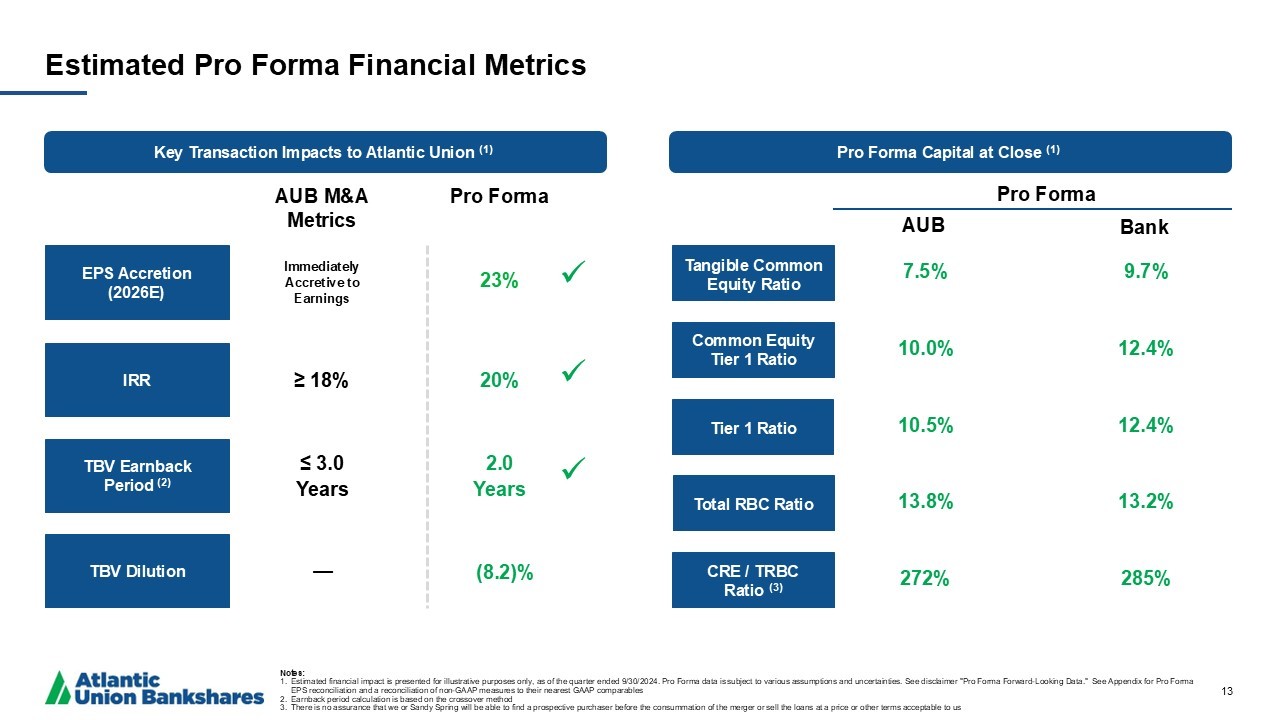
Estimated Pro Forma Financial Metrics 13 EPS Accretion (2026E) TBV Dilution TBV Earnback Period (2) Tangible Common Equity Ratio Common Equity Tier 1 Ratio 2.0 Years Tier 1 Ratio Total RBC Ratio 10.5% IRR 20% ≥ 18% ≤ 3.0 Years 10.0% 7.5% 13.8% Pro Forma AUB M&A Metrics Immediately Accretive to Earnings 23 % (8.2)% x x x CRE / TRBC Ratio (3) 272% Notes: 1. Estimated financial impact is presented for illustrative purposes only, as of the quarter ended 9/30/2024. Pro Forma data is sub ject to various assumptions and uncertainties. See disclaimer "Pro Forma Forward - Looking Data." See Appendix for Pro Forma EPS reconciliation and a reconciliation of non - GAAP measures to their nearest GAAP comparables 2. Earnback period calculation is based on the crossover method 3. There is no assurance that we or Sandy Spring will be able to find a prospective purchaser before the consummation of the mer ger or sell the loans at a price or other terms acceptable to us Key Transaction Impacts to Atlantic Union (1) Pro Forma Capital at Close (1) 12.4% 12.4% 9.7% 13.2% 285% Bank AUB Pro Forma —
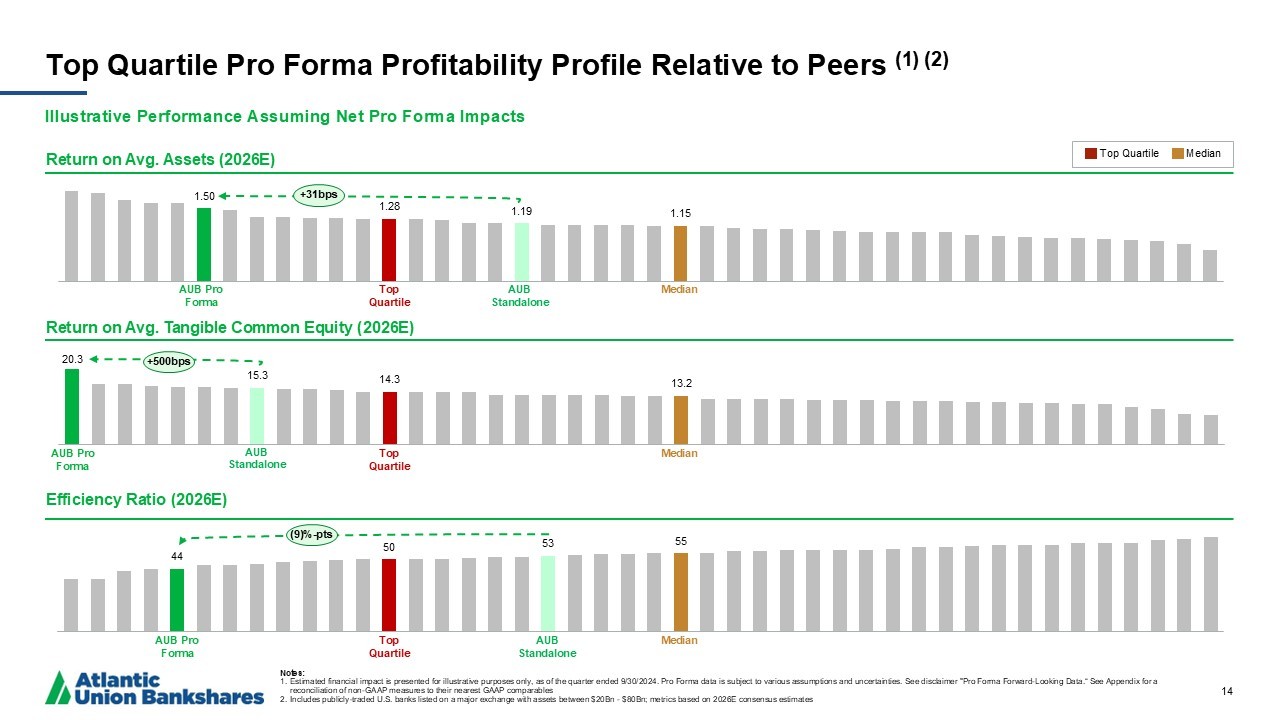
Top Quartile Pro Forma Profitability Profile Relative to Peers (1) (2) Notes: 1. Estimated financial impact is presented for illustrative purposes only, as of the quarter ended 9/30/2024. Pro Forma data is sub ject to various assumptions and uncertainties. See disclaimer "Pro Forma Forward - Looking Data.“ See Appendix for a reconciliation of non - GAAP measures to their nearest GAAP comparables 2. Includes publicly - traded U.S. banks listed on a major exchange with assets between $20Bn - $80Bn; metrics based on 2026E consens us estimates Illustrative Performance Assuming Net Pro Forma Impacts 14 Return on Avg. Assets ( 2026E) Return on Avg. Tangible Common Equity ( 2026E) Efficiency Ratio ( 2026E) 1.50 1.28 1.19 1.15 HOMB OZK AX EWBC CBSH AUB PF PB ABCB SSB UMBF UBSI HWC Top Quartile WBS CATY WSFS PNFP AUB ONB GBCI FNB SNV PFS Median EBC COLB FULT UCB CADE WTFC BOKF CFR WAFD CUBI CMA FHB ASB VLY TCBI SFNC FIBK BANC BOH BKU AUB Pro Forma AUB Standalone 20.3 15.3 14.3 13.2 AUB PF UMBF WBS SSB PFS EWBC AX AUB HOMB ONB OZK COLB Top Quartile SNV PB CFR GBCI FNB BOH CBSH CADE PNFP FULT Median FHB WAFD WSFS ABCB HWC CMA WTFC UCB ASB FIBK CATY CUBI BOKF VLY UBSI EBC SFNC BANC TCBI BKU 44 50 53 55 OZK EWBC PB HOMB AUB PF WBS COLB PFS AX CATY WAFD SSB Top Quartile ONB UBSI ABCB CUBI FNB AUB PNFP VLY SNV UMBF Median UCB WTFC GBCI HWC BANC EBC ASB CADE FULT CBSH WSFS BOH FHB SFNC FIBK BKU TCBI CFR BOKF CMA AUB Standalone AUB Standalone Median Top Quartile Top Quartile Top Quartile Top Quartile Median Median Median AUB Pro Forma AUB Pro Forma +31bps +500bps (9)% - pts
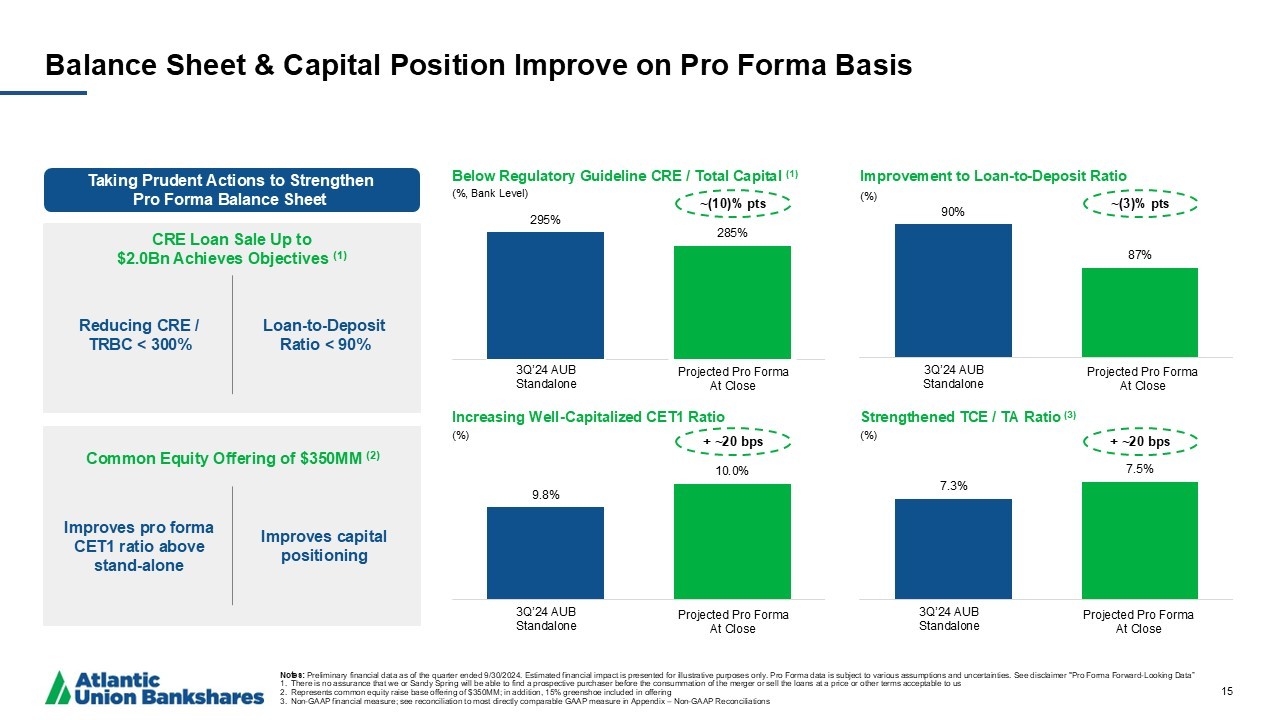
295% 285% 3Q'24 AUB… Pro Forma 90% 87% 3Q'24 AUB… Pro Forma 7.3% 7.5% 3Q'24 AUB… Pro Forma 9.8% 10.0% 3Q'24 AUB… Pro Forma Balance Sheet & Capital Position Improve on Pro Forma Basis Below Regulatory Guideline CRE / Total Capital (1) (%, Bank Level) Improvement to Loan - to - Deposit Ratio (%) Increasing Well - Capitalized CET1 Ratio (%) Strengthened TCE / TA Ratio (3) (%) Taking Prudent Actions to Strengthen Pro Forma Balance Sheet 15 ~(10)% pts ~(3)% pts + ~20 bps + ~20 bps CRE Loan Sale Up to $2.0Bn Achieves Objectives (1) Common Equity Offering of $350MM (2) 3Q’24 AUB Standalone Projected Pro Forma At Close 3Q’24 AUB Standalone Projected Pro Forma At Close 3Q’24 AUB Standalone Projected Pro Forma At Close 3Q’24 AUB Standalone Projected Pro Forma At Close Reducing CRE / TRBC < 300% Loan - to - Deposit Ratio < 90% Improves pro forma CET1 ratio above stand - alone Improves capital positioning Notes: Preliminary financial data as of the quarter ended 9/30/2024. Estimated financial impact is presented for illustrative purpos es only. Pro Forma data is subject to various assumptions and uncertainties. See disclaimer "Pro Forma Forward - Looking Data” 1. There is no assurance that we or Sandy Spring will be able to find a prospective purchaser before the consummation of the mer ger or sell the loans at a price or other terms acceptable to us 2. Represents common equity raise base offering of $350MM; in addition, 15% greenshoe included in offering 3. Non - GAAP financial measure; see reconciliation to most directly comparable GAAP measure in Appendix – Non - GAAP Reconciliations
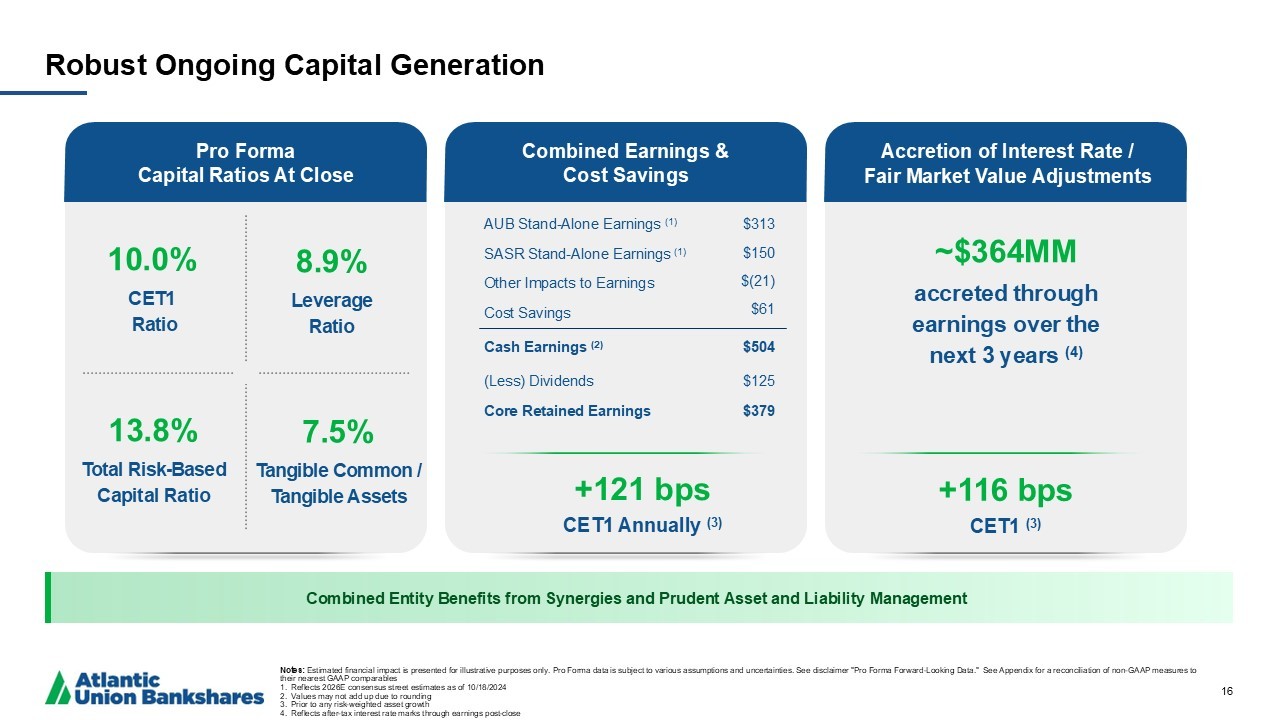
Pro Forma Capital Ratios At Close Combined Earnings & Cost Savings Accretion of Interest Rate / Fair Market Value Adjustments Notes: Estimated financial impact is presented for illustrative purposes only. Pro Forma data is subject to various assumptions and unc ertainties. See disclaimer "Pro Forma Forward - Looking Data." See Appendix for a reconciliation of non - GAAP measures to their nearest GAAP comparables 1. Reflects 2026E consensus street estimates as of 10/18/2024 2. Values may not add up due to rounding 3. Prior to any risk - weighted asset growth 4. Reflects after - tax interest rate marks through earnings post - close Robust Ongoing Capital Generation 16 accreted through earnings over the next 3 years (4) AUB Stand - Alone Earnings (1) SASR Stand - Alone Earnings (1) Other Impacts to Earnings Cost Savings $313 $150 $(21) $61 Cash Earnings (2) $504 (Less) Dividends Core Retained Earnings $125 $379 +121 bps CET1 Annually (3) +116 bps CET1 (3) Combined Entity Benefits from Synergies and Prudent Asset and Liability Management 8.9% Leverage Ratio 10.0% CET1 Ratio 13.8% Total Risk - Based Capital Ratio 7.5% Tangible Common / Tangible Assets ~$364MM
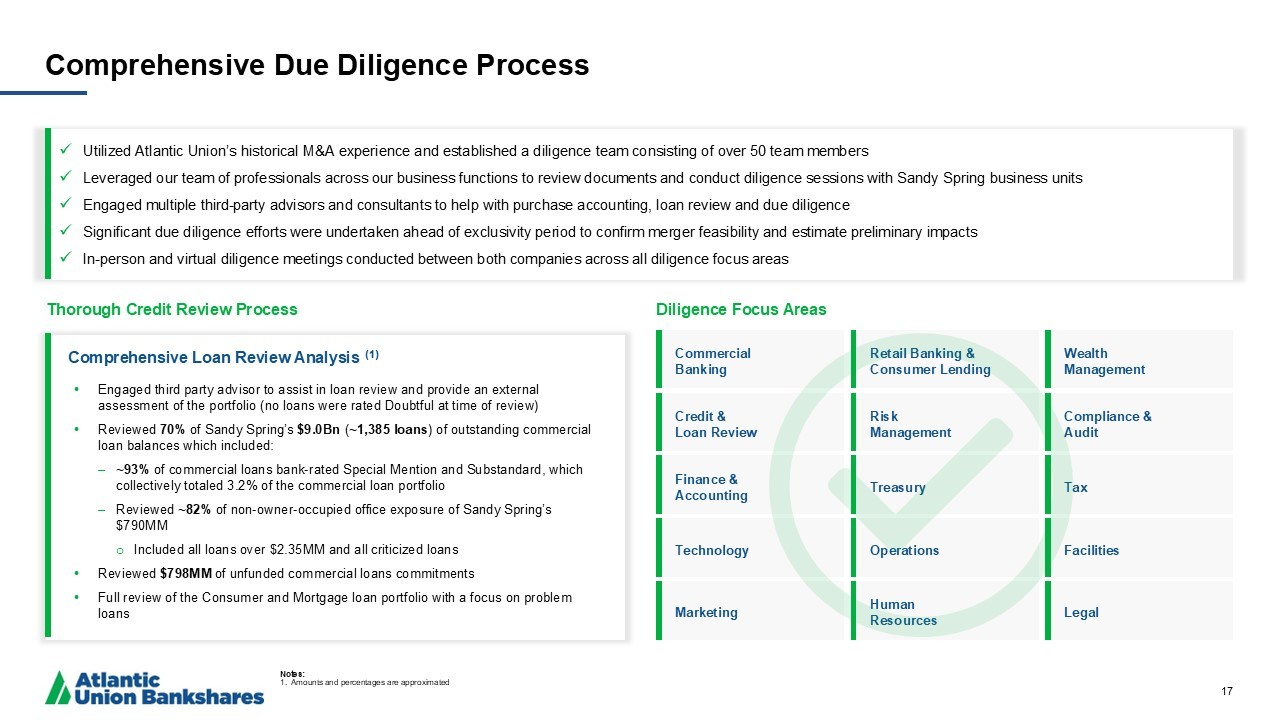
Comprehensive Due Diligence Process 17 x Utilized Atlantic Union’s historical M&A experience and established a diligence team consisting of over 50 team members x Leveraged our team of professionals across our business functions to review documents and conduct diligence sessions with San dy Spring business units x Engaged multiple third - party advisors and consultants to help with purchase accounting, loan review and due diligence x Significant due diligence efforts were undertaken ahead of exclusivity period to confirm merger feasibility and estimate prel imi nary impacts x In - person and virtual diligence meetings conducted between both companies across all diligence focus areas • Engaged third party advisor to assist in loan review and provide an external assessment of the portfolio (no loans were rated Doubtful at time of review) • Reviewed 70% of Sandy Spring’s $9.0Bn ( ~1,385 loans ) of outstanding commercial loan balances which included: ‒ ~93% of commercial loans bank - rated Special Mention and Substandard, which collectively totaled 3.2% of the commercial loan portfolio ‒ Reviewed ~82% of non - owner - occupied office exposure of Sandy Spring’s $790MM o Included all loans over $2.35MM and all criticized loans • Reviewed $798MM of unfunded commercial loans commitments • Full review of the Consumer and Mortgage loan portfolio with a focus on problem loans Thorough Credit Review Process Diligence Focus Areas Notes: 1. Amounts and percentages are approximated Comprehensive Loan Review Analysis (1) Credit & Loan Review Risk Management Compliance & Audit Finance & Accounting Treasury Tax Technology Operations Facilities Marketing Human Resources Legal Commercial Banking Retail Banking & Consumer Lending Wealth Management
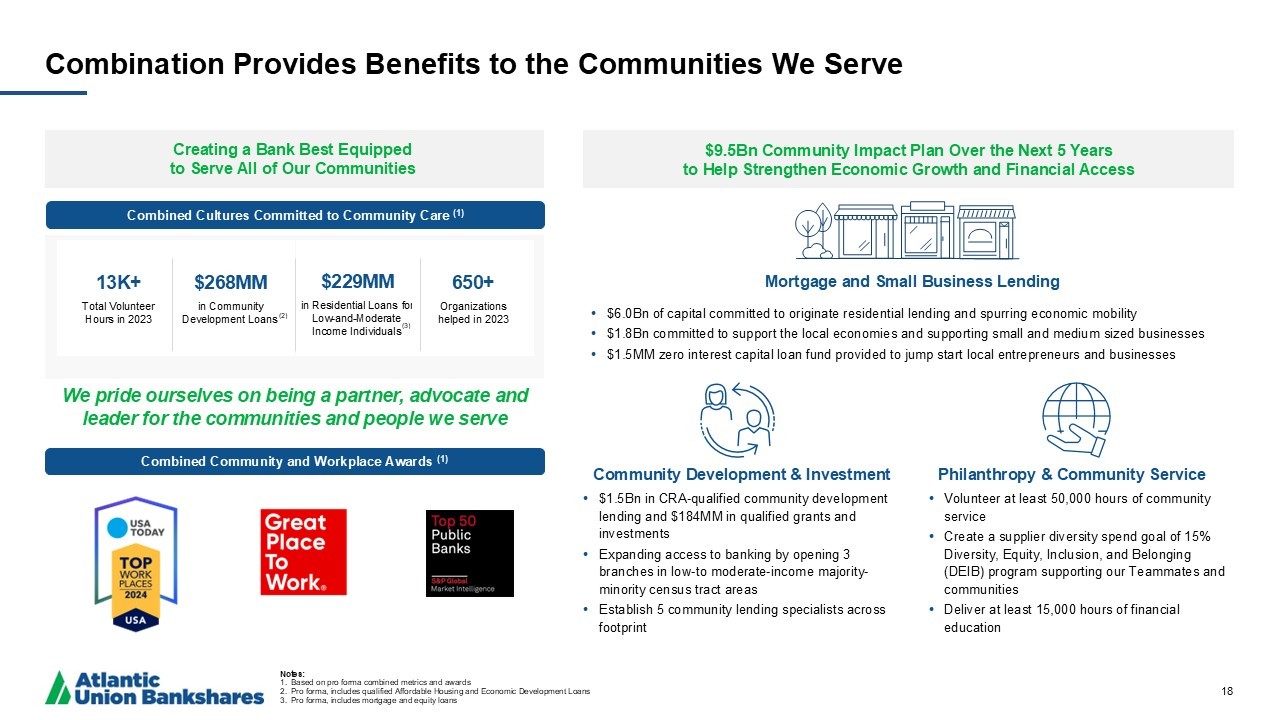
Combination Provides Benefits to the Communities We Serve 18 • $6.0Bn of capital committed to originate residential lending and spurring economic mobility • $1.8Bn committed to support the local economies and supporting small and medium sized businesses • $1.5MM zero interest capital loan fund provided to jump start local entrepreneurs and businesses $9.5Bn Community Impact Plan Over the Next 5 Years to Help Strengthen Economic Growth and Financial Access Mortgage and Small Business Lending • $1.5Bn in CRA - qualified community development lending and $184MM in qualified grants and investments • Expanding access to banking by opening 3 branches in low - to moderate - income majority - minority census tract areas • Establish 5 community lending specialists across footprint • Volunteer at least 50,000 hours of community service • Create a supplier diversity spend goal of 15% Diversity, Equity, Inclusion, and Belonging (DEIB) program supporting our Teammates and communities • Deliver at least 15,000 hours of financial education Community Development & Investment Philanthropy & Community Service Combined Cultures Committed to Community Care (1) Combined Community and Workplace Awards (1) We pride ourselves on being a partner, advocate and leader for the communities and people we serve Creating a Bank Best Equipped to Serve All of Our Communities $229MM in Residential Loans for Low - and - Moderate Income Individuals 13K+ Total Volunteer Hours in 2023 $268MM in Community Development Loans Notes: 1. Based on pro forma combined metrics and awards 2. Pro forma, includes qualified Affordable Housing and Economic Development Loans 3. Pro forma, includes mortgage and equity loans 650+ Organizations helped in 2023 (2) (3)
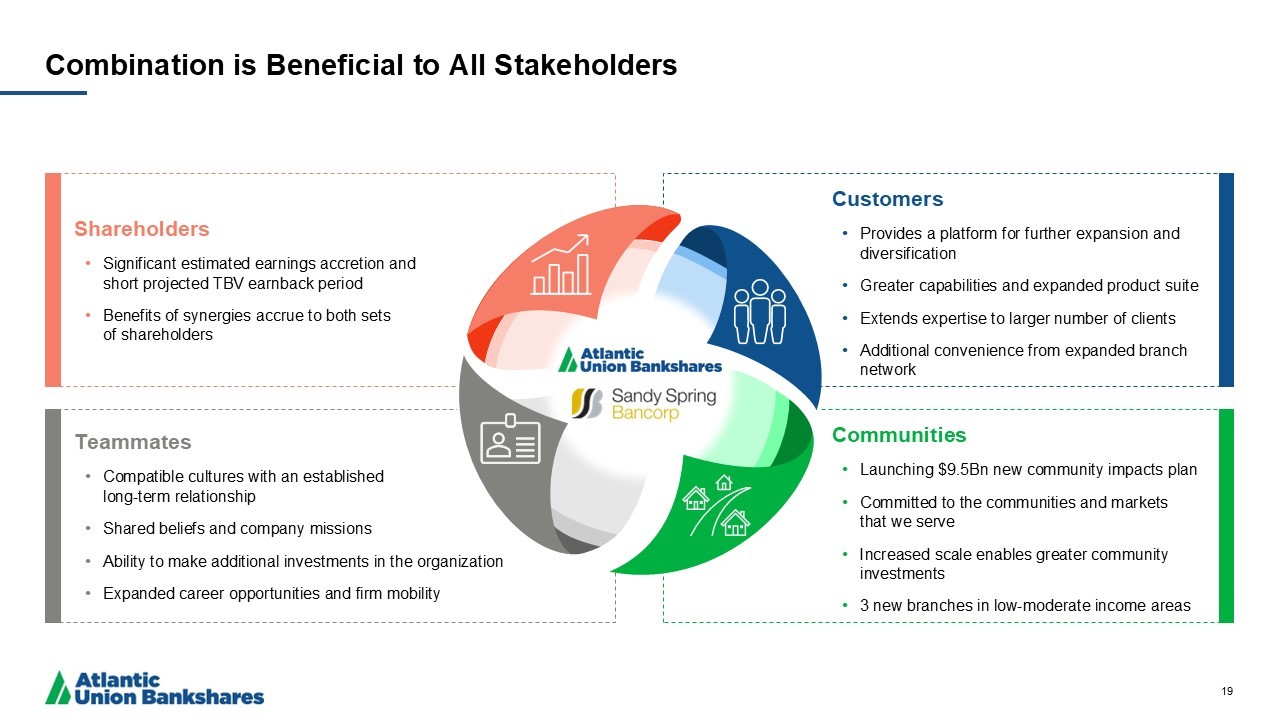
Shareholders • Significant estimated earnings accretion and short projected TBV earnback period • Benefits of synergies accrue to both sets of shareholders Customers • Provides a platform for further expansion and diversification • Greater capabilities and expanded product suite • Extends expertise to larger number of clients • Additional convenience from expanded branch network Teammates • Compatible cultures with an established long - term relationship • Shared beliefs and company missions • Ability to make additional investments in the organization • Expanded career opportunities and firm mobility Communities • Launching $9.5Bn new community impacts plan • Committed to the communities and markets that we serve • Increased scale enables greater community investments • 3 new branches in low - moderate income areas Combination is Beneficial to All Stakeholders 19
20 Enhancing Our Shareholder Value Proposition Financial Strength Strong Growth Potential Peer - Leading Performance Attractive Financial Profile Leading Regional Presence
Appendix
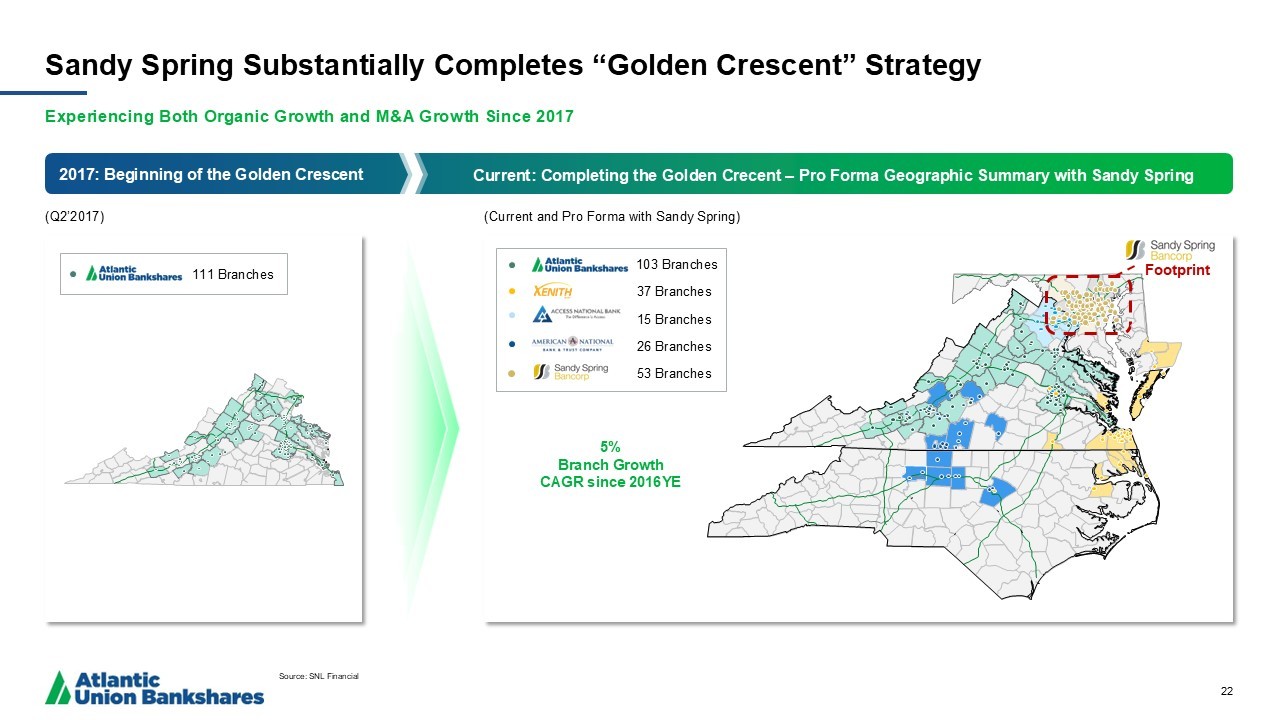
Sandy Spring Substantially Completes “Golden Crescent” Strategy Experiencing Both Organic Growth and M&A Growth Since 2017 22 Source: SNL Financial (Q2’2017) (Current and Pro Forma with Sandy Spring) Footprint 5% Branch Growth CAGR since 2016YE 37 Branches 15 Branches 26 Branches 53 Branches 103 Branches 111 Branches 2017: Beginning of the Golden Crescent Current: Completing the Golden Crecent – Pro Forma Geographic Summary with Sandy Spring
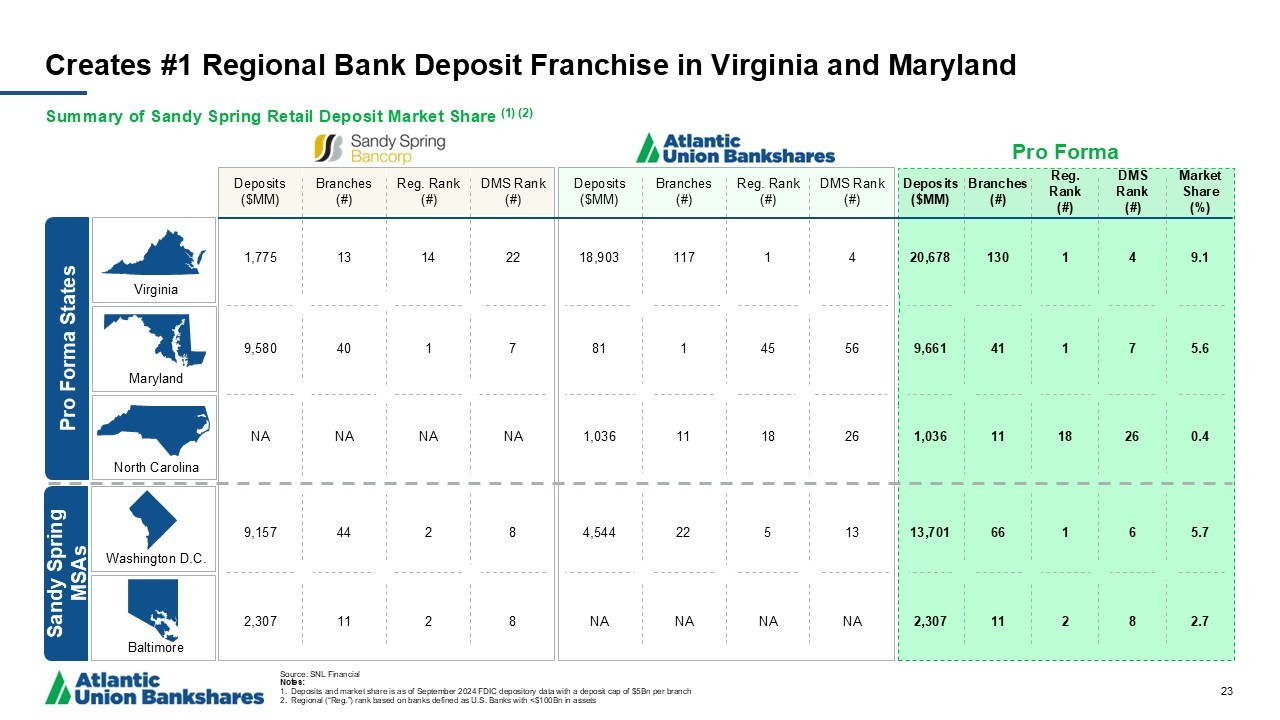
Creates #1 Regional Bank Deposit Franchise in Virginia and Maryland 23 Source: SNL Financial Notes: 1. Deposits and market share is as of September 2024 FDIC depository data with a deposit cap of $5Bn per branch 2. Regional (“Reg.”) rank based on banks defined as U.S. Banks with <$100Bn in assets Pro Forma Virginia Maryland North Carolina Baltimore Washington D.C. 1,775 13 14 22 9.1 18,903 117 1 4 20,678 130 1 4 9,580 40 1 7 5.6 81 1 45 56 9,661 41 1 7 9,157 44 2 8 5.7 4,544 22 5 13 13,701 66 1 6 2,307 11 2 8 2.7 NA NA NA NA 2,307 11 2 8 Pro Forma States Sandy Spring MSAs Deposits ($MM) Branches (#) Reg. Rank (#) DMS Rank (#) Market Share (%) Deposits ($MM) Branches (#) Reg. Rank (#) DMS Rank (#) Deposits ($MM) Branches (#) Reg. Rank (#) DMS Rank (#) NA NA NA NA 0.4 1,036 11 18 26 1,036 11 18 26 v v v Summary of Sandy Spring Retail Deposit Market Share (1) (2)
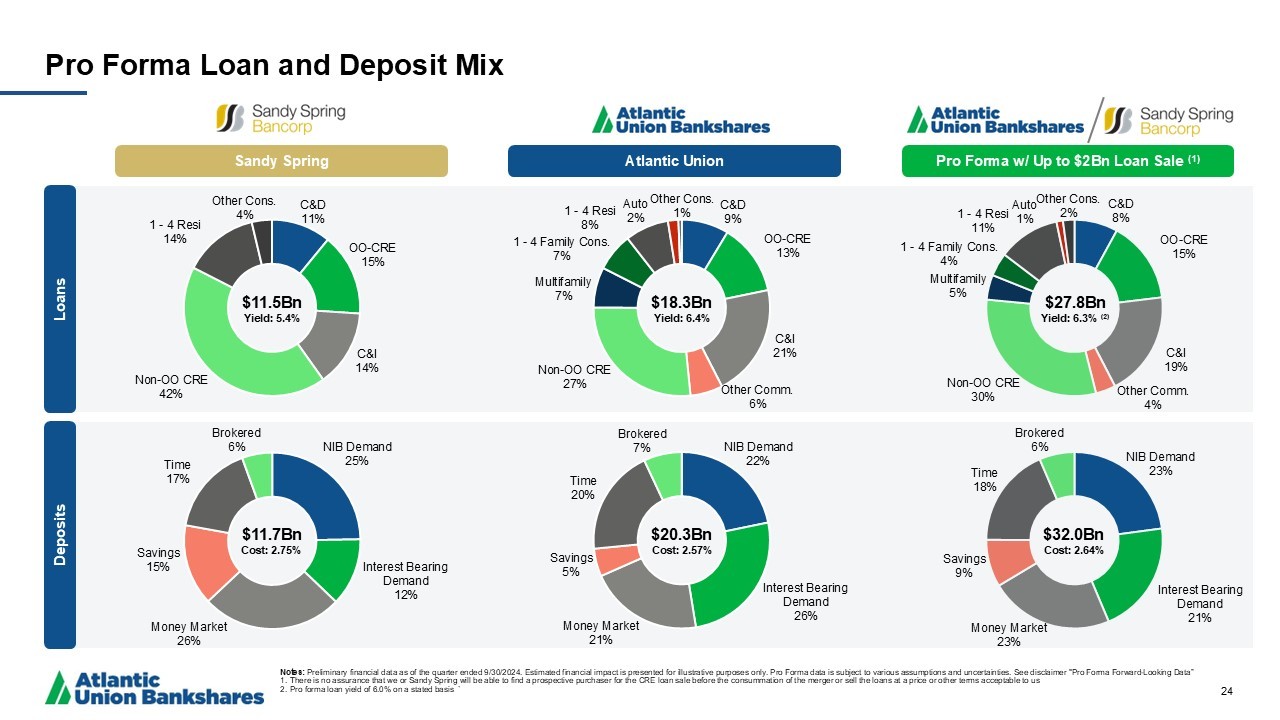
C&D 8% OO - CRE 15% C&I 19% Other Comm. 4% Non - OO CRE 30% Multifamily 5% 1 - 4 Family Cons. 4% 1 - 4 Resi 11% Auto 1% Other Cons. 2% NIB Demand 23% Interest Bearing Demand 21% Money Market 23% Savings 9% Time 18% Brokered 6% NIB Demand 25% Interest Bearing Demand 12% Money Market 26% Savings 15% Time 17% Brokered 6% C&D 9% OO - CRE 13% C&I 21% Other Comm. 6% Non - OO CRE 27% Multifamily 7% 1 - 4 Family Cons. 7% 1 - 4 Resi 8% Auto 2% Other Cons. 1% C&D 11% OO - CRE 15% C&I 14% Non - OO CRE 42% 1 - 4 Resi 14% Other Cons. 4% NIB Demand 22% Interest Bearing Demand 26% Money Market 21% Savings 5% Time 20% Brokered 7% Pro Forma Loan and Deposit Mix Notes: Preliminary financial data as of the quarter ended 9/30/2024. Estimated financial impact is presented for illustrative purpos es only. Pro Forma data is subject to various assumptions and uncertainties. See disclaimer "Pro Forma Forward - Looking Data” 1. There is no assurance that we or Sandy Spring will be able to find a prospective purchaser for the CRE loan sale before the c ons ummation of the merger or sell the loans at a price or other terms acceptable to us 2. Pro forma loan yield of 6.0% on a stated basis ` 24 Pro Forma w/ Up to $2Bn Loan Sale (1) Atlantic Union Sandy Spring $11.7Bn Cost: 2.75% $20.3Bn Cost: 2.57% $32.0Bn Cost: 2.64% $11.5Bn Yield: 5.4% $18.3Bn Yield: 6.4% $27.8Bn Yield: 6.3% (2) Loans Deposits
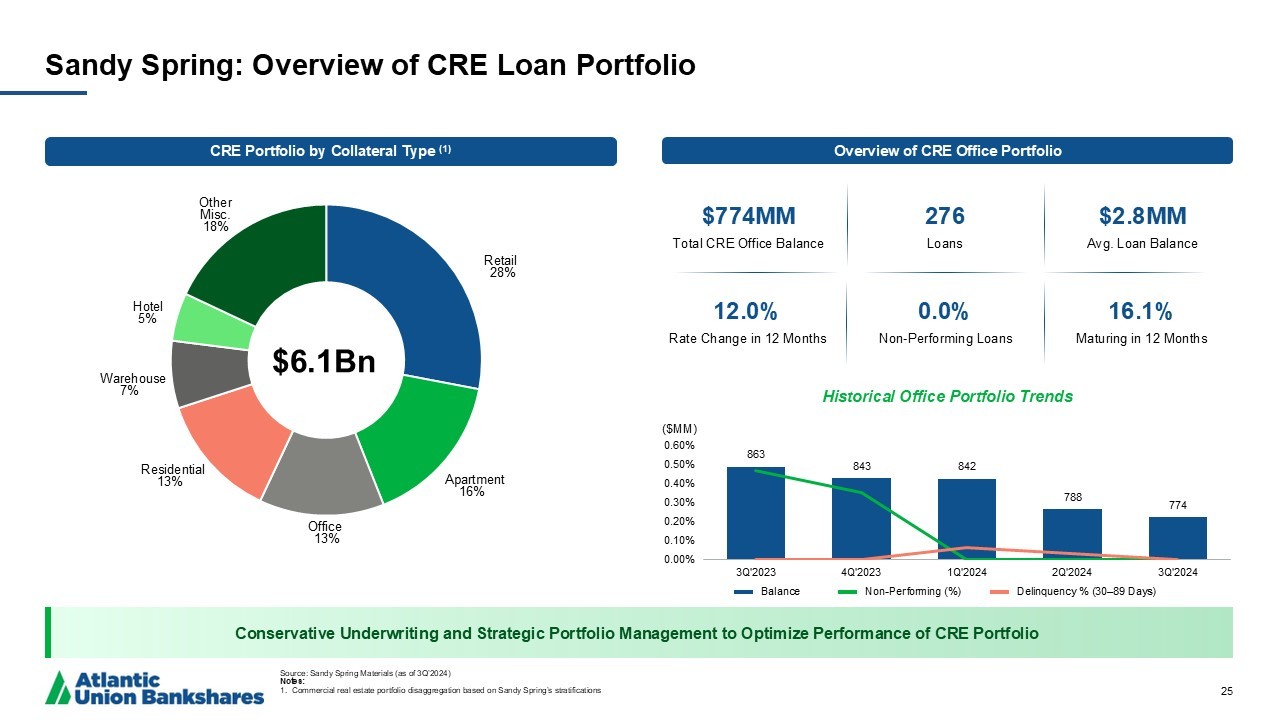
CRE Portfolio by Collateral Type (1) Sandy Spring: Overview of CRE Loan Portfolio 25 Conservative Underwriting and Strategic Portfolio Management to Optimize Performance of CRE Portfolio Retail 28% Apartment 16% Office 13% Residential 13% Warehouse 7 % Hotel 5% Other Misc. 18% $6.1Bn Source: Sandy Spring Materials (as of 3Q’2024) Notes: 1. Commercial real estate portfolio disaggregation based on Sandy Spring’s stratifications Overview of CRE Office Portfolio $774MM Total CRE Office Balance 276 Loans $2.8MM Avg. Loan Balance 12.0% Rate Change in 12 Months 0.0 % Non - Performing Loans 16.1% Maturing in 12 Months Historical Office Portfolio Trends Balance Non - Performing (%) Delinquency % (30 – 89 Days) ($MM) 863 843 842 788 774 0.00% 0.10% 0.20% 0.30% 0.40% 0.50% 0.60% 3Q'2023 4Q'2023 1Q'2024 2Q'2024 3Q'2024
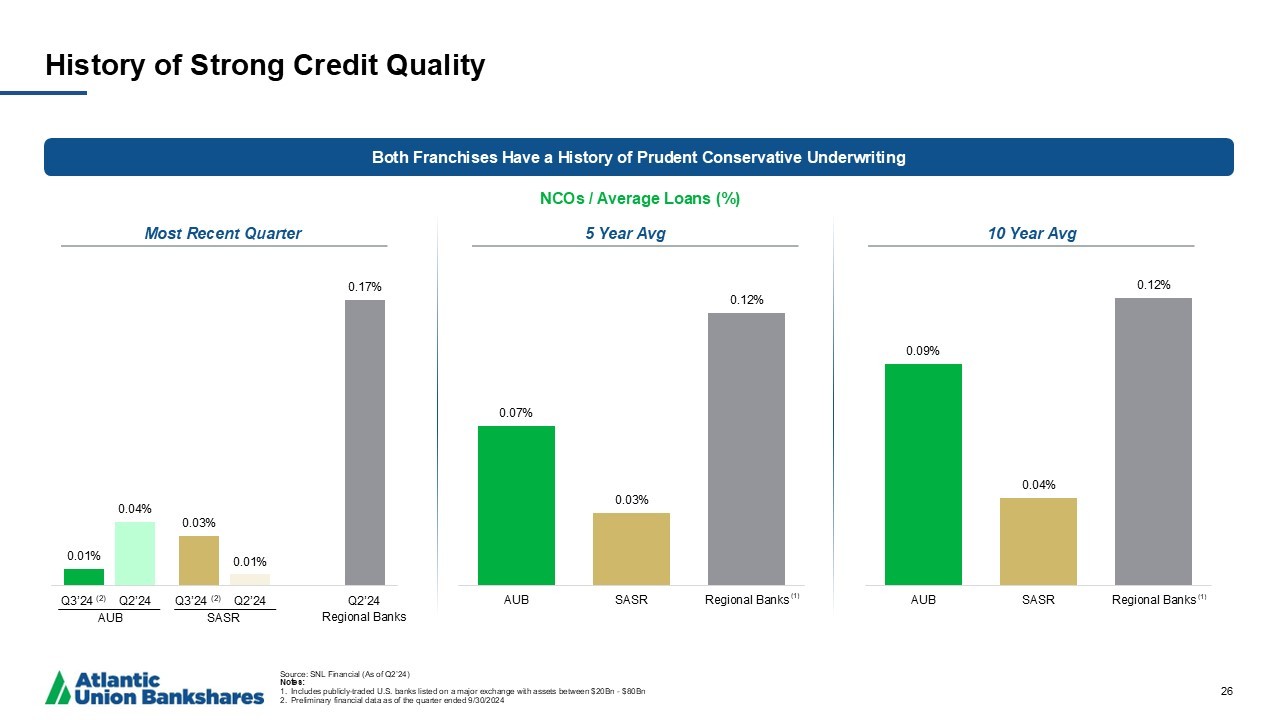
0.01% 0.03% 0.04% 0.01% 0.17% AUB SASR Regional Banks 0.07% 0.03% 0.12% AUB SASR Regional Banks 0.09% 0.04% 0.12% AUB SASR Regional Banks History of Strong Credit Quality 26 NCOs / Average Loans (%) Both Franchises Have a History of Prudent Conservative Underwriting (1) 5 Year Avg 10 Year Avg Most Recent Quarter (1) (1) Source: SNL Financial (As of Q2’24) Notes: 1. Includes publicly - traded U.S. banks listed on a major exchange with assets between $20Bn - $80Bn 2. Preliminary financial data as of the quarter ended 9/30/2024 AUB SASR Q3’24 (2) Q3’24 (2) Q2’24 Q2’24 Q2’24 Regional Banks
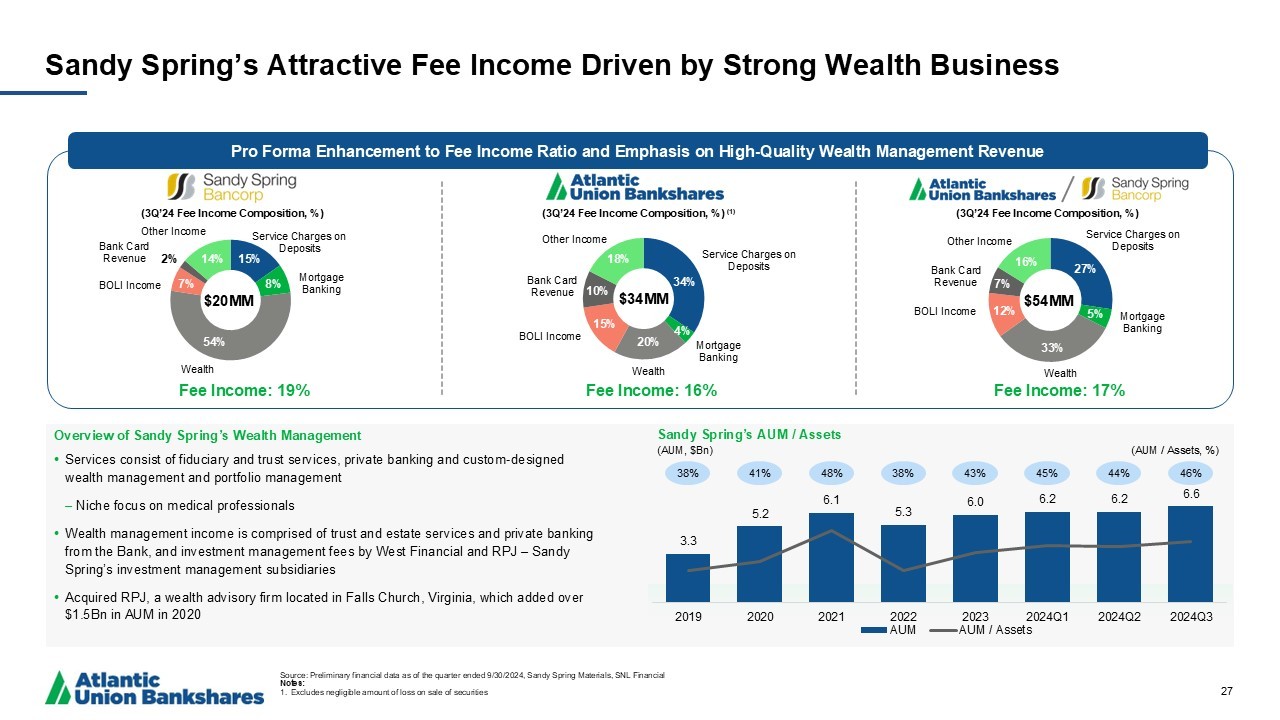
3.3 5.2 6.1 5.3 6.0 6.2 6.2 6.6 30% 40% 50% 60% 0.0 2.0 4.0 6.0 8.0 2019 2020 2021 2022 2023 2024Q1 2024Q2 2024Q3 AUM AUM / Assets Sandy Spring’s Attractive Fee Income Driven by Strong Wealth Business 27 Sandy Spring’s AUM / Assets (AUM, $Bn) (AUM / Assets, %) 38% 41% 48% 38% 43% 45% 46% • Services consist of fiduciary and trust services, private banking and custom - designed wealth management and portfolio management ‒ Niche focus on medical professionals • Wealth management income is comprised of trust and estate services and private banking from the Bank, and investment management fees by West Financial and RPJ – Sandy Spring’s investment management subsidiaries • Acquired RPJ, a wealth advisory firm located in Falls Church, Virginia, which added over $1.5Bn in AUM in 2020 Overview of Sandy Spring’s Wealth Management Source: Preliminary financial data as of the quarter ended 9/30/2024, Sandy Spring Materials, SNL Financial Notes: 1. Excludes negligible amount of loss on sale of securities 44% Service Charges on Deposits Mortgage Banking Wealth BOLI Income Bank Card Revenue Other Income Service Charges on Deposits Mortgage Banking Wealth BOLI Income Bank Card Revenue Other Income Fee Income: 19% Fee Income: 16% Pro Forma Enhancement to Fee Income Ratio and Emphasis on High - Quality Wealth Management Revenue (3Q’24 Fee Income Composition, %) (3Q’24 Fee Income Composition, %) (1) (3Q’24 Fee Income Composition, %) Fee Income: 17% Service Charges on Deposits Mortgage Banking Wealth BOLI Income Bank Card Revenue Other Income 54% 7% 14% 15% 8% 2% $34MM $54MM $20MM 20% 15% 10% 18% 34% 4% 27% 16% 7% 12% 33% 5%
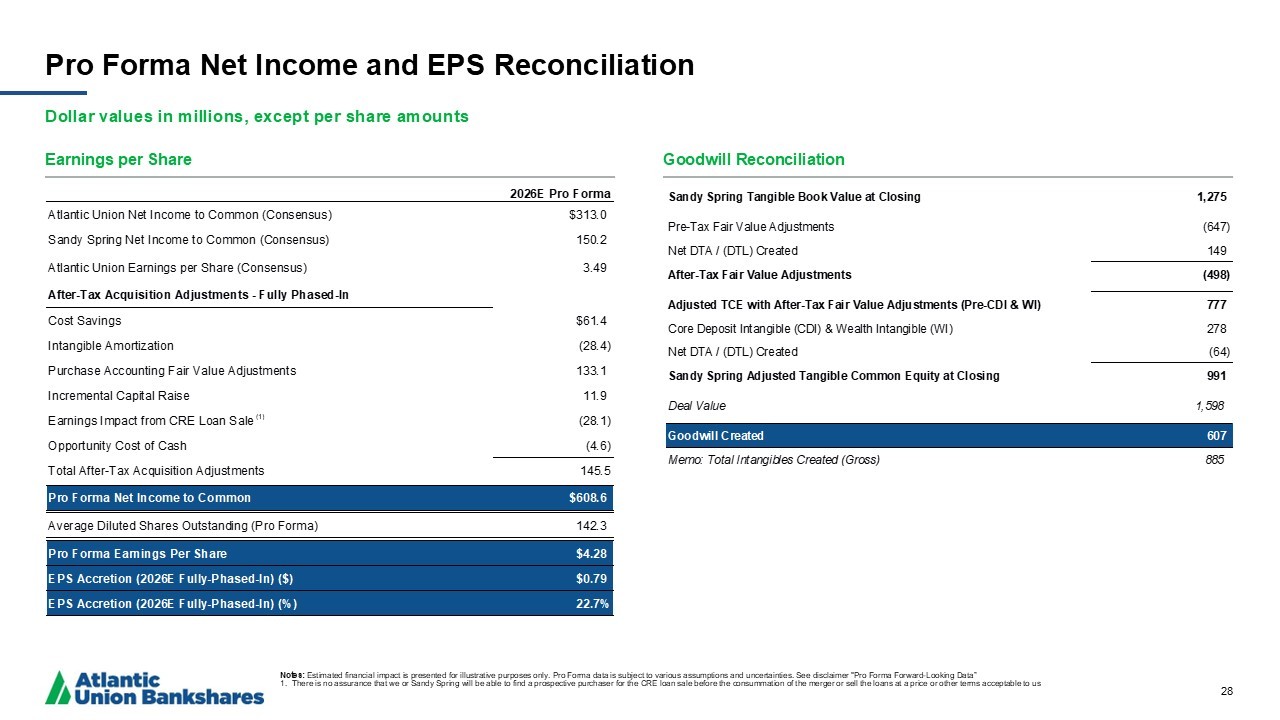
Sandy Spring Tangible Book Value at Closing 1,275 Pre-Tax Fair Value Adjustments (647) Net DTA / (DTL) Created 149 After-Tax Fair Value Adjustments (498) Adjusted TCE with After-Tax Fair Value Adjustments (Pre-CDI & WI) 777 Core Deposit Intangible (CDI) & Wealth Intangible (WI) 278 Net DTA / (DTL) Created (64) Sandy Spring Adjusted Tangible Common Equity at Closing 991 Deal Value 1,598 Goodwill Created 607 Memo: Total Intangibles Created (Gross) 885 2026E Pro Forma Atlantic Union Net Income to Common (Consensus) $313.0 Sandy Spring Net Income to Common (Consensus) 150.2 Atlantic Union Earnings per Share (Consensus) 3.49 After-Tax Acquisition Adjustments - Fully Phased-In Cost Savings $61.4 Intangible Amortization (28.4) Purchase Accounting Fair Value Adjustments 133.1 Incremental Capital Raise 11.9 Earnings Impact from CRE Loan Sale (28.1) Opportunity Cost of Cash (4.6) Total After-Tax Acquisition Adjustments 145.5 Pro Forma Net Income to Common $608.6 Average Diluted Shares Outstanding (Pro Forma) 142.3 Pro Forma Earnings Per Share $4.28 EPS Accretion (2026E Fully-Phased-In) ($) $0.79 EPS Accretion (2026E Fully-Phased-In) (%) 22.7% Pro Forma Net Income and EPS Reconciliation Dollar values in millions, except per share amounts 28 Earnings per Share Goodwill Reconciliation (1) Notes: Estimated financial impact is presented for illustrative purposes only. Pro Forma data is subject to various assumptions and unc ertainties. See disclaimer "Pro Forma Forward - Looking Data” 1. There is no assurance that we or Sandy Spring will be able to find a prospective purchaser for the CRE loan sale before the c ons ummation of the merger or sell the loans at a price or other terms acceptable to us
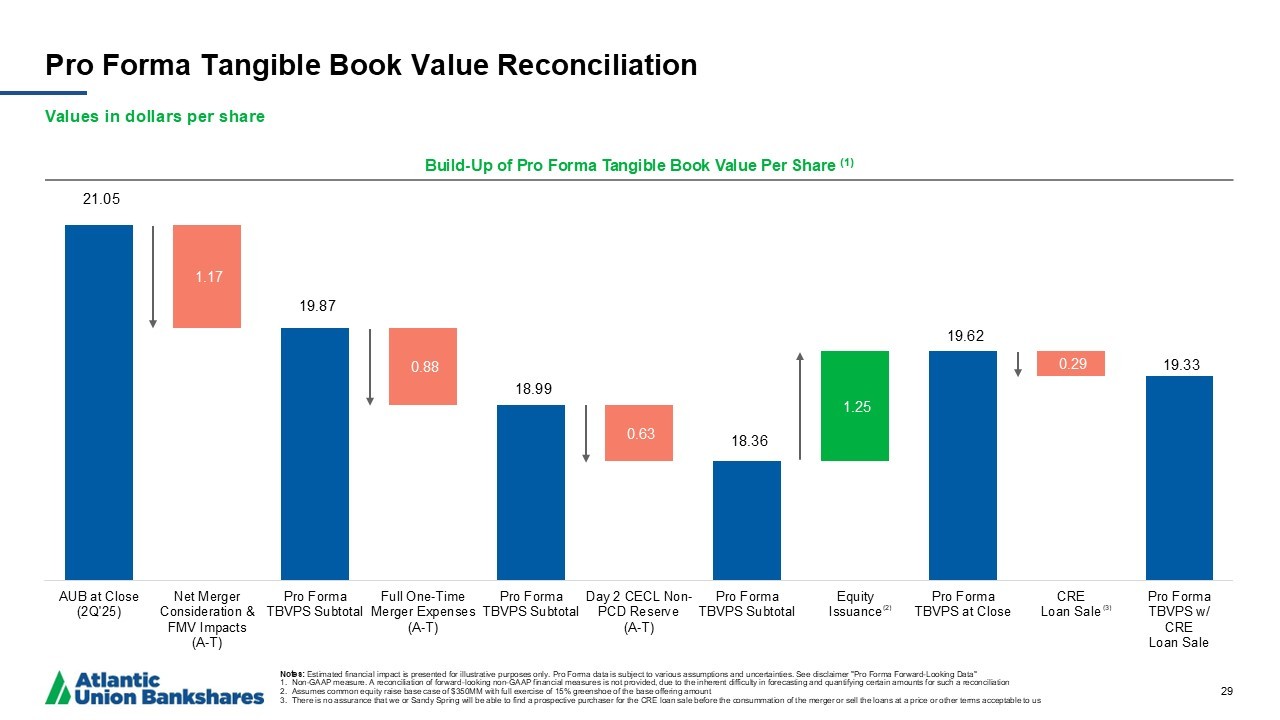
21.05 19.87 18.99 18.36 19.62 19.33 1.17 0.88 0.63 1.25 0.29 AUB at Close (2Q'25) Net Merger Consideration & FMV Impacts (A-T) Pro Forma TBVPS Subtotal Full One-Time Merger Expenses (A-T) Pro Forma TBVPS Subtotal Day 2 CECL Non- PCD Reserve (A-T) Pro Forma TBVPS Subtotal Equity Issuance Pro Forma TBVPS at Close CRE Loan Sale Pro Forma TBVPS w/ CRE Loan Sale Pro Forma Tangible Book Value Reconciliation Values in dollars per share 29 Build - Up of Pro Forma Tangible Book Value Per Share (1) Notes: Estimated financial impact is presented for illustrative purposes only. Pro Forma data is subject to various assumptions and unc ertainties. See disclaimer "Pro Forma Forward - Looking Data" 1. Non - GAAP measure. A reconciliation of forward - looking non - GAAP financial measures is not provided, due to the inherent difficult y in forecasting and quantifying certain amounts for such a reconciliation 2. Assumes common equity raise base case of $350MM with full exercise of 15% greenshoe of the base offering amount 3. There is no assurance that we or Sandy Spring will be able to find a prospective purchaser for the CRE loan sale before the c ons ummation of the merger or sell the loans at a price or other terms acceptable to us (2) (3)
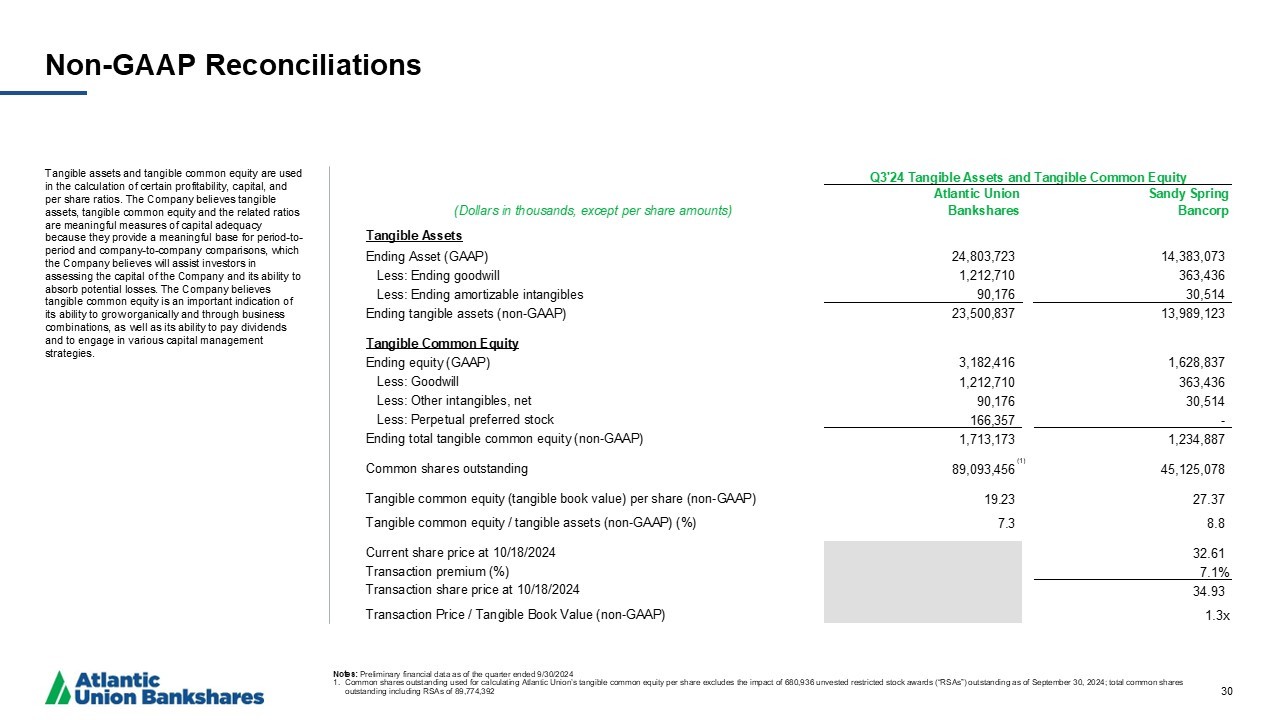
Q3'24 Tangible Assets and Tangible Common Equity Atlantic Union Sandy Spring (Dollars in thousands, except per share amounts) Bankshares Bancorp Tangible Assets Ending Asset (GAAP) 24,803,723 14,383,073 Less: Ending goodwill 1,212,710 363,436 Less: Ending amortizable intangibles 90,176 30,514 Ending tangible assets (non-GAAP) 23,500,837 13,989,123 Tangible Common Equity Ending equity (GAAP) 3,182,416 1,628,837 Less: Goodwill 1,212,710 363,436 Less: Other intangibles, net 90,176 30,514 Less: Perpetual preferred stock 166,357 - Ending total tangible common equity (non-GAAP) 1,713,173 1,234,887 Common shares outstanding 89,093,456 45,125,078 Tangible common equity (tangible book value) per share (non-GAAP) 19.23 27.37 Tangible common equity / tangible assets (non-GAAP) (%) 7.3 8.8 Current share price at 10/18/2024 32.61 Transaction premium (%) 7.1% Transaction share price at 10/18/2024 34.93 Transaction Price / Tangible Book Value (non-GAAP) 1.3x Non - GAAP Reconciliations Tangible assets and tangible common equity are used in the calculation of certain profitability, capital, and per share ratios. The Company believes tangible assets, tangible common equity and the related ratios are meaningful measures of capital adequacy because they provide a meaningful base for period - to - period and company - to - company comparisons, which the Company believes will assist investors in assessing the capital of the Company and its ability to absorb potential losses. The Company believes tangible common equity is an important indication of its ability to grow organically and through business combinations, as well as its ability to pay dividends and to engage in various capital management strategies. 30 Notes: Preliminary financial data as of the quarter ended 9/30/2024 1. Common shares outstanding used for calculating Atlantic Union’s tangible common equity per share excludes the impact of 680,9 36 unvested restricted stock awards (“RSAs”) outstanding as of September 30, 2024; total common shares outstanding including RSAs of 89,774,392 (1)