
Exhibit 99.3
Merger Investor Presentation NYSE: AUB July 25, 2023
2 Caution About Forward - Looking Statements Certain statements in this presentation constitute “forward - looking statements” within the meaning of the Private Securities Lit igation Reform Act of 1995. Examples of forward - looking statements include, but are not limited to, statements regarding the outlook and expectations of Atlantic Union Bankshares Corporation (“Atlantic Union or AU B”) and American National Bankshares Inc. (“American National or AMNB”) with respect to the proposed transaction, the strategic benefits and financial benefits of the proposed transaction, including the expecte d i mpact of the proposed transaction on the combined company’s future financial performance (including anticipated accretion to earnings per share, the tangible book value earn - back period and other operating and return metrics), the timing of the closing of the proposed transaction, the ability to successfully integrate the combined businesses, and statements on the slides entitled “Key Transaction Assumptions” and “Estimated Pro For ma Financial Metrics.” Such statements are often characterized by the use of qualified words (and their derivatives) such as “may,” “will,” “anticipate,” “could,” “should,” “would,” “believe,” “contemplate,” “exp ect ,” “estimate,” “continue,” “plan,” “project” and “intend,” as well as words of similar meaning or other statements concerning opinions or judgment of Atlantic Union or American National or their management about future even ts. Forward - looking statements are based on assumptions as of the time they are made and are subject to risks, uncertainties and other factors that are difficult to predict with regard to timing, extent, l ike lihood and degree of occurrence, which could cause actual results to differ materially from anticipated results, expressed or implied by such forward - looking statements. Such risks, uncertainties and assumptions, include , among others, the following: Although each of Atlantic Union and American National believes that its expectations with respect to forward - looking statements are based upon reasonable assumptions within the bounds of its existing knowledge of its business and operations, there can be no assurance that actual results of Atlantic Union or American National will not di ffe r materially from any projected future results expressed or implied by such forward - looking statements. Additional factors that could cause results to differ materially from those described above can be found in Atlan tic Union’s most recent annual report on Form 10 - K and quarterly reports on Form 10 - Q, and other documents subsequently filed by Atlantic Union with the Securities Exchange Commission (“SEC”), and in American Nationa l’s most recent annual report on Form 10 - K and quarterly reports on Form 10 - Q, and other documents subsequently filed by American National with the SEC. The actual results anticipated may not be realized or, eve n if substantially realized, they may not have the expected consequences to or effects on Atlantic Union, American National or their respective businesses or operations. Investors are cautioned not to rely too he avi ly on any such forward - looking statements. Forward - looking statements speak only as of the date they are made and Atlantic Union and American National undertake no obligation to update or clarify these forward - looki ng statements, whether as a result of new information, future events or otherwise. the occurrence of any event, change or other circumstances that could give rise to the right of one or both of the parties to te rminate the merger agreement; the failure to obtain necessary regulatory approvals (and the risk that such approvals may result in the imposition of condit ion s that could adversely affect the combined company or the expected benefits of the proposed transaction) and the approval by American National shareholders, on a timely basis or at all; the possibility that the anticipated benefits of the proposed transaction, including anticipated cost savings and strategic g ain s, are not realized when expected or at all; the possibility that the integration of the two companies may be more difficult, time - consuming or costly than expected; the impact of purchase accounting with respect to the proposed transaction, or any change in the assumptions used regarding t he assets acquired and liabilities assumed to determine their fair value and credit marks; the outcome of any legal proceedings that may be instituted against Atlantic Union or American National; the possibility that the proposed transaction may be more expensive or take longer to complete than anticipated, including as a result of unexpected factors or events; diversion of management’s attention from ongoing business operations and opportunities; potential adverse reactions or changes to business or employee relationships, including those resulting from the announcement or completion of the proposed transaction; changes in Atlantic Union’s or American National’s share price before closing; risks relating to the potential dilutive effect of shares of Atlantic Union’s common stock to be issued in the proposed trans act ion; other factors that may affect future results of Atlantic Union or American National including changes in asset quality and cr edi t risk; the inability to sustain revenue and earnings growth; changes in interest rates; deposit flows; inflation; customer borrowing, repayment, investment and deposit practices; the impact, extent and timing of t ech nological changes; capital management activities; and other actions of the Federal Reserve Board and legislative and regulatory actions and reforms.
3 Additional Information Important Additional Information and Where to Find It In connection with the proposed transaction, Atlantic Union intends to file with the SEC a Registration Statement on Form S - 4 (“Registration Statement”) that will include a Proxy Statement of American National and a Prospectus of Atlantic Union (“Proxy Statement/Prospectus”), and each of Atlantic Union and American National may file with the SEC other relevant documents concerning the proposed transaction. A definitive Proxy Statement/Prospectus will be sent to the shareholders of American National to seek their approval of the proposed transaction. Before making any voting or investment decision, investors and shareholders of American National are urged to read the Registration Statement and Proxy Statement/Prospectus regarding the proposed transaction when they become available and any other relevant documents filed with the SEC, as well as any amendments or supplements to those documents, because they will contain important information about Atlantic Union, American National and the proposed transaction and related matters. This communication does not constitute an offer to sell or the solicitation of an offer to buy any securities or the solicitation of any vote or approval with respect to the proposed transaction between Atlantic Union and American National. No offer of securities shall be made except by means of a prospectus meeting the requirements of the Securities Act of 1933, as amended, and no offer to sell or solicitation of an offer to buy shall be made in any jurisdiction in which such offer, solicitation or sale would be unlawful prior to registration or qualification under the securities laws of such jurisdiction. A copy of the Registration Statement, Proxy Statement/Prospectus, as well as other filings containing information about Atlantic Union and American National, may be obtained, free of charge, at the SEC’s website (http://www.sec.gov) when they are filed. You will also be able to obtain these documents, when they are filed, free of charge, from Atlantic Union by accessing Atlantic Union’s website at https://investors.atlanticunionbank.com or from American National by accessing American National’s website at https://amnb.com/investors. Copies of the Registration Statement, Proxy Statement/Prospectus and the filings with the SEC that will be incorporated by reference therein can also be obtained, without charge, by directing a request to Atlantic Union Investor Relations, Atlantic Union Bankshares Corporation, 4300 Cox Road, Richmond, Virginia 23060, or by calling 804.448.0937, or to American National by directing a request to American National Investor Relations, American National Bankshares Inc., 628 Main Street, Danville, Virginia, 24541, or by calling 434.792.5111. The information on Atlantic Union’s and American National’s websites is not, and shall not be deemed to be, a part of this communication or incorporated into other filings either company makes with the SEC. Participants in the Solicitation Atlantic Union, American National and certain of their respective directors, executive officers and employees may be deemed to be participants in the solicitation of proxies in respect of the proposed transaction. Information regarding Atlantic Union’s directors and executive officers is available in its definitive proxy statement, which was filed with the SEC on March 21, 2023, and the other documents filed with the SEC. Information regarding American National’s directors and executive officers is available in its definitive proxy statement, which was filed with the SEC on April 6, 2023, and the other documents filed with the SEC. Information regarding the persons who may, under the rules of the SEC, be deemed participants in the proxy solicitation and a description of their direct and indirect interests, by security holdings or otherwise, will be contained in the Registration Statement, Proxy Statement/Prospectus and other relevant materials to be filed with the SEC, when they become available. Free copies of these documents may be obtained as described in the preceding paragraph.
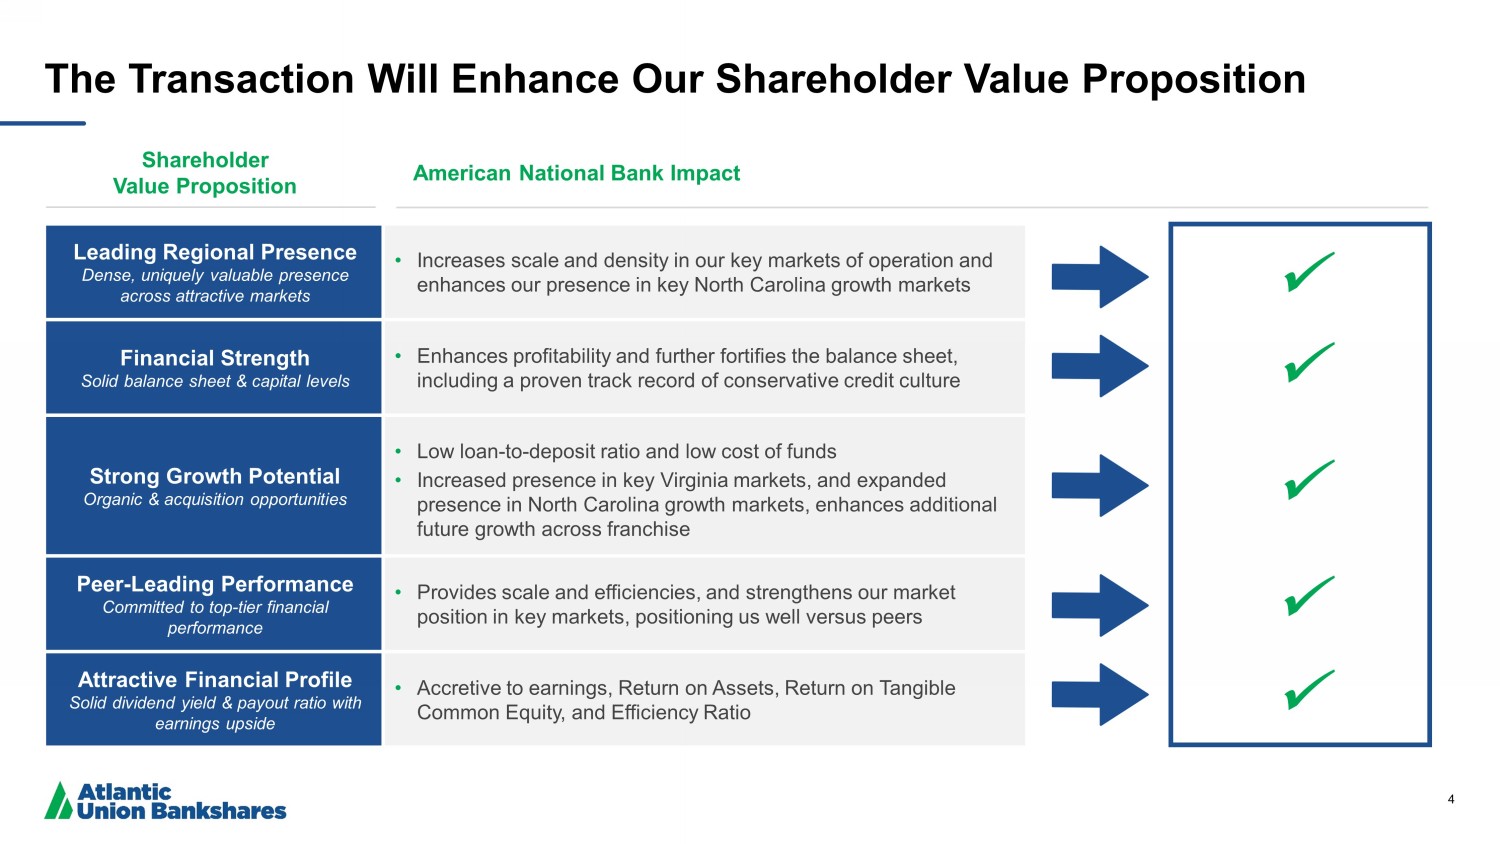
4 The Transaction Will Enhance Our Shareholder Value Proposition Leading Regional Presence Dense, uniquely valuable presence across attractive markets • Increases scale and density in our key markets of operation and enhances our presence in key North Carolina growth markets Financial Strength Solid balance sheet & capital levels • Enhances profitability and further fortifies the balance sheet, including a proven track record of conservative credit culture Strong Growth Potential Organic & acquisition opportunities • Low loan - to - deposit ratio and low cost of funds • Increased presence in key Virginia markets, and expanded presence in North Carolina growth markets, enhances additional future growth across franchise Peer - Leading Performance Committed to top - tier financial performance • Provides scale and efficiencies, and strengthens our market position in key markets, positioning us well versus peers Attractive Financial Profile Solid dividend yield & payout ratio with earnings upside • Accretive to earnings, Return on Assets, Return on Tangible Common Equity, and Efficiency Ratio Shareholder Value Proposition American National Bank Impact x x x x x
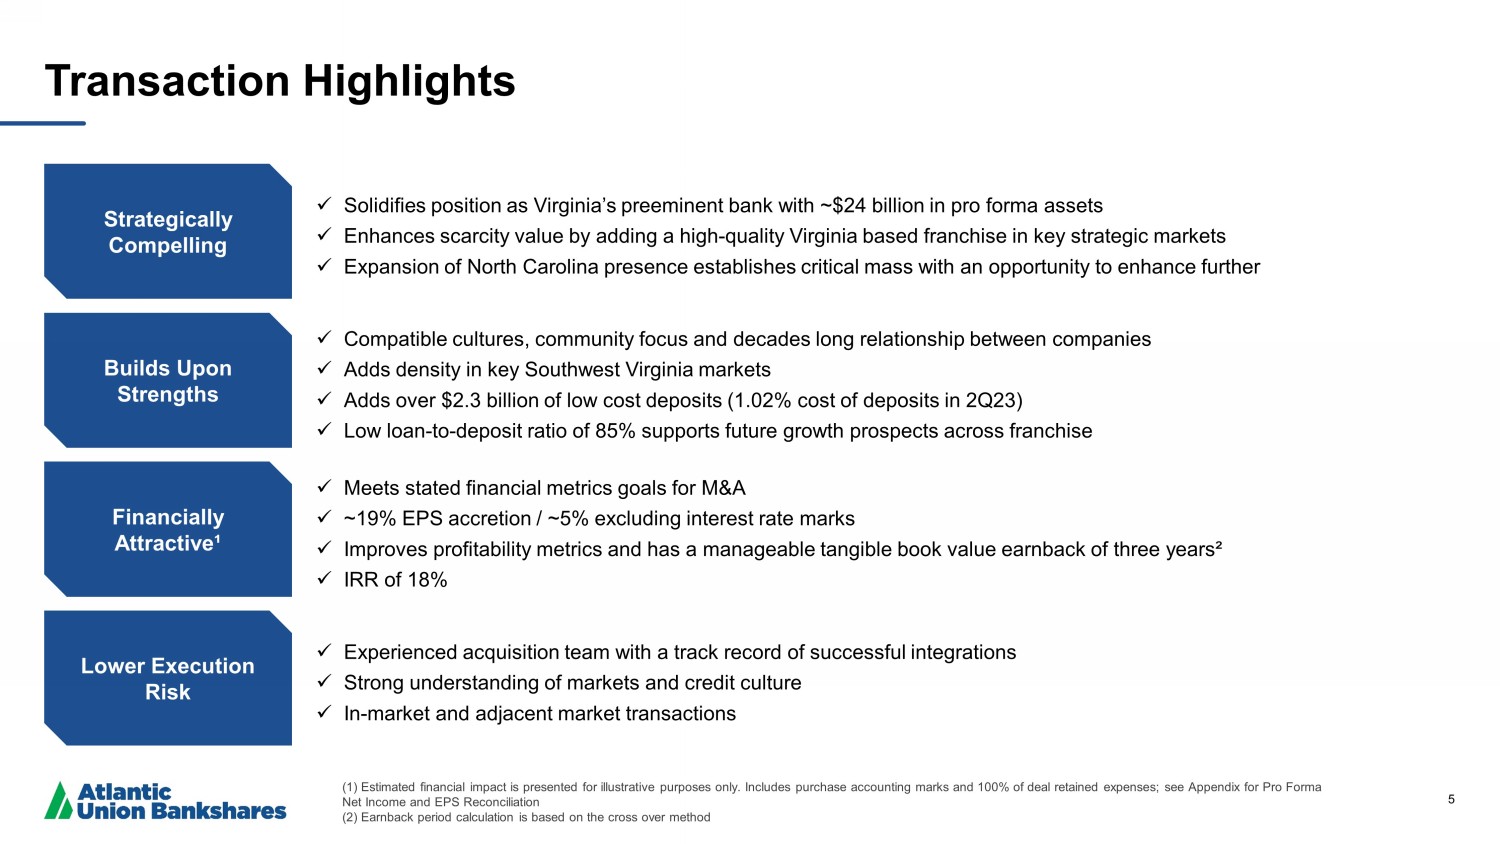
5 Transaction Highlights x Solidifies position as Virginia’s preeminent bank with ~$24 billion in pro forma assets x Enhances scarcity value by adding a high - quality Virginia based franchise in key strategic markets x Expansion of North Carolina presence establishes critical mass with an opportunity to enhance further Strategically Compelling Builds Upon Strengths Financially Attractive¹ Lower Execution Risk x Compatible cultures, community focus and decades long relationship between companies x Adds density in key Southwest Virginia markets x Adds over $2.3 billion of low cost deposits (1.02% cost of deposits in 2Q23) x Low loan - to - deposit ratio of 85% supports future growth prospects across franchise x Meets stated financial metrics goals for M&A x ~19% EPS accretion / ~5% excluding interest rate marks x Improves profitability metrics and has a manageable tangible book value earnback of three years² x IRR of 18% x Experienced acquisition team with a track record of successful integrations x Strong understanding of markets and credit culture x In - market and adjacent market transactions (1) Estimated financial impact is presented for illustrative purposes only. Includes purchase accounting marks and 100% of de al retained expenses; see Appendix for Pro Forma Net Income and EPS Reconciliation (2) Earnback period calculation is based on the cross over method
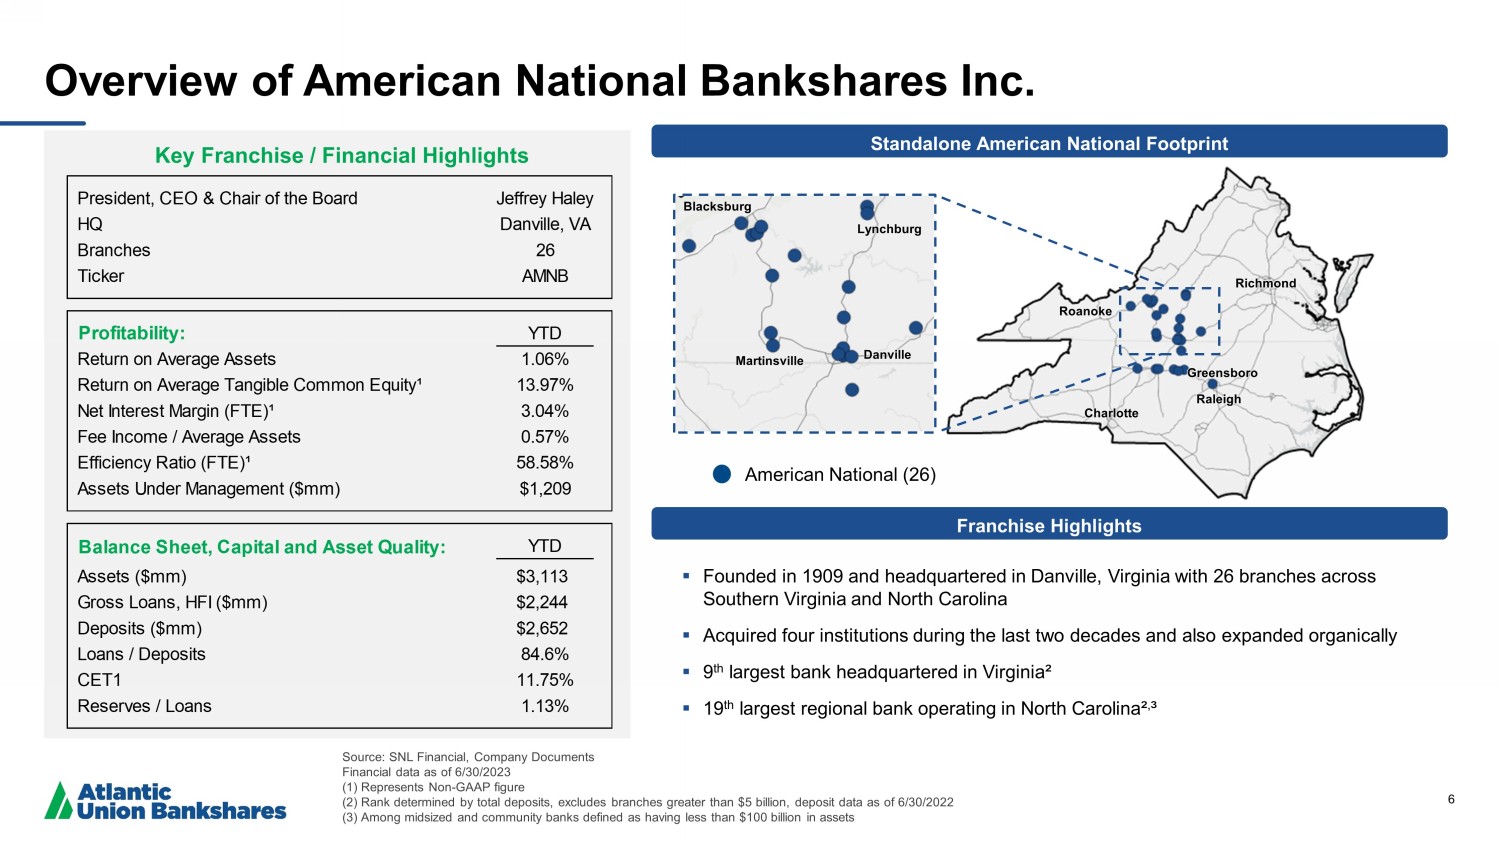
6 Overview of American National Bankshares Inc. Key Franchise / Financial Highlights Profitability: YTD Return on Average Assets 1.06% Return on Average Tangible Common Equity¹ 13.97% Net Interest Margin (FTE)¹ 3.04% Fee Income / Average Assets 0.57% Efficiency Ratio (FTE)¹ 58.58% Assets Under Management ($mm) $1,209 Balance Sheet, Capital and Asset Quality: YTD Assets ($mm) $3,113 Gross Loans, HFI ($mm) $2,244 Deposits ($mm) $2,652 Loans / Deposits 84.6% CET1 11.75% Reserves / Loans 1.13% President, CEO & Chair of the Board Jeffrey Haley HQ Danville, VA Branches 26 Ticker AMNB Source: SNL Financial, Company Documents Financial data as of 6/30/2023 (1) Represents Non - GAAP figure (2) Rank determined by total deposits, excludes branches greater than $5 billion, deposit data as of 6/30/2022 (3) Among midsized and community banks defined as having less than $100 billion in assets ▪ Founded in 1909 and headquartered in Danville, Virginia with 26 branches across Southern Virginia and North Carolina ▪ Acquired four institutions during the last two decades and also expanded organically ▪ 9 th largest bank headquartered in Virginia² ▪ 19 th largest regional bank operating in North Carolina² , ³ Franchise Highlights Standalone American National Footprint American National (26) Greensboro Raleigh R oanoke Richmond Charlotte Blacksburg Martinsville Lynchburg Danville
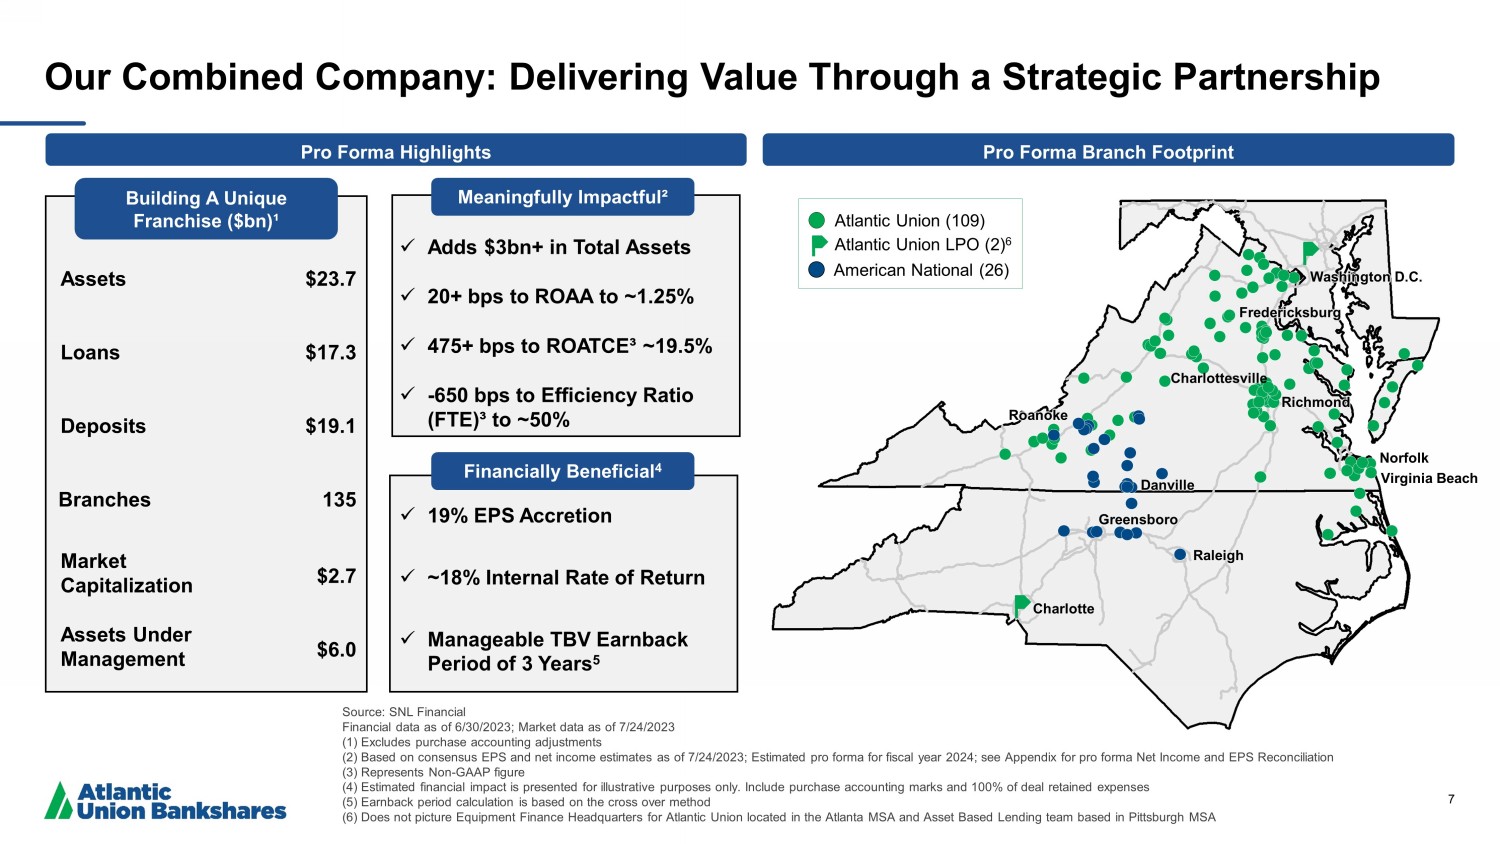
7 Our Combined Company: Delivering Value Through a Strategic Partnership Source: SNL Financial Financial data as of 6 /30/2023; Market data as of 7/24/2023 (1) Excludes purchase accounting adjustments (2) Based on consensus EPS and net income estimates as of 7/24/2023; Estimated pro forma for fiscal year 2024; see Appendix f or pro forma Net Income and EPS Reconciliation (3) Represents Non - GAAP figure (4) Estimated financial impact is presented for illustrative purposes only. Include purchase accounting marks and 100% of deal re tai ned expenses (5) Earnback period calculation is based on the cross over method (6) Does not picture Equipment Finance Headquarters for Atlantic Union located in the Atlanta MSA and Asset Based Lending team ba sed in Pittsburgh MSA R oanoke Norfolk Raleigh Richmond Charlotte Greensboro Washington D.C. Virginia Beach Fredericksburg Atlantic Union (109) Atlantic Union LPO (2) 6 American National (26) Charlottesville Building A Unique Franchise ($bn)¹ Meaningfully Impactful² Assets $23.7 Loans $17.3 Deposits $19.1 Market Capitalization $2.7 x Adds $3bn+ in Total Assets x 20+ bps to ROAA to ~1.25% x 475+ bps to ROATCE³ ~19.5% x - 650 bps to Efficiency Ratio (FTE)³ to ~50% Pro Forma Branch Footprint Financially Beneficial 4 x 19% EPS Accretion x ~18% Internal Rate of Return x Manageable TBV Earnback Period of 3 Years 5 Pro Forma Highlights Assets Under Management $6.0 Branches 135 Danville

8 Deposits Market RankInstitution ($mm) Share (%) 1 Pro Forma $17,771 21.5% 2 Atlantic Union 15,725 19.0 3 TowneBank 10,929 13.2 4 Capital One Financial Corp. 8,669 10.5 5 Carter Bankshares 3,341 4.0 6 Burke & Herbert Financial Services 2,960 3.6 7 Primis Financial Corp. 2,446 3.0 8 Blue Ridge Bankshares Inc. 2,317 2.8 9 First Bancorp Inc. 2,213 2.7 10 American National 2,046 2.5 To All Institutions in Market $82,790 Enhancing Our Presence in Key Markets Virginia: All Banks Roanoke - Blacksburg MSA Adds $834mm In - market deposits 16.16% Pro Forma Deposit Market Share #1 Pro Forma Market Share² Piedmont Triad¹ Adds $778mm In - market deposits 5.44% Pro Forma Deposit Market Share #6 Pro Forma Market Share² Danville - Martinsville MSA Adds $972mm In - market deposits 27.64% Pro Forma Deposit Market Share #2 Pro Forma Market Share² Lynchburg Adds $400mm In - market deposits 8.63% Pro Forma Deposit Market Share #2 Pro Forma Market Share² North Carolina Deposits Market RankInstitution ($mm) Share (%) 1 Truist Financial $50,865 21.6% 2 Wells Fargo 38,834 16.5 3 Bank of America 27,157 11.5 4 Pro Forma 17,771 7.5 5 Atlantic Union 15,725 6.7 6 TowneBank 10,929 4.6 7 United Bankshares 9,205 3.9 8 Capital One Financial Corp. 8,669 3.7 9 PNC Financial Services 5,935 2.5 17 American National 2,046 0.9 To All Institutions in Market $235,670 Virginia: Banks Headquartered in VA Source: SNL Financial; FDIC deposit data Deposit data as of 6/30/2022; excludes branches greater than $5 billion (1) Piedmont Triad Region includes Alamance, Caswell, Davidson, Davie, Forsyth, Guilford, Montgomery, Randolph, Rockingham, S tok es, Surry and Yadkin counties (2) Among midsized and community banks less than $100 billion in assets
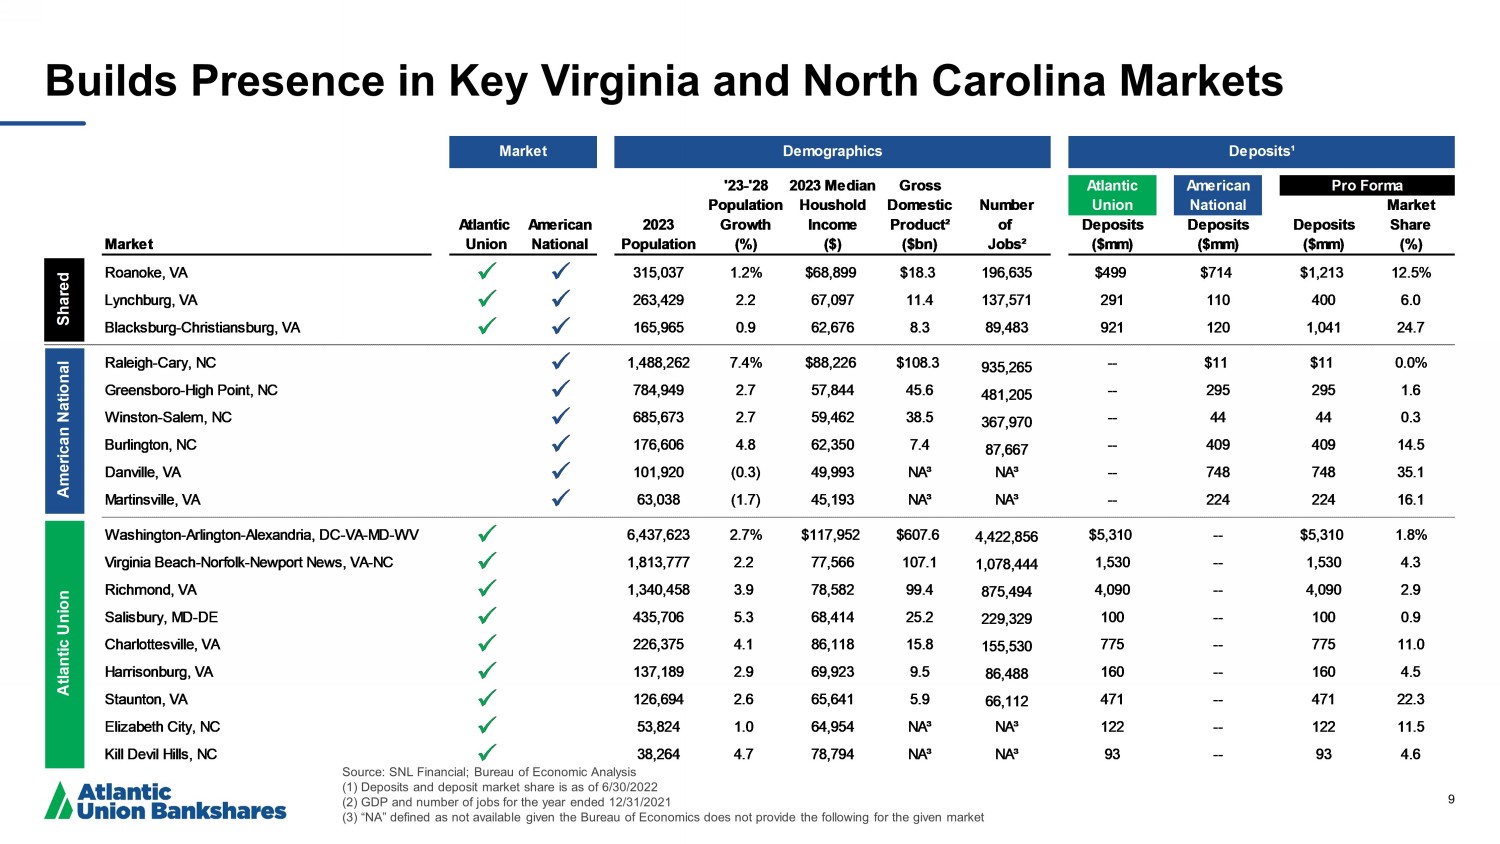
9 Builds Presence in Key Virginia and North Carolina Markets Source: SNL Financial; Bureau of Economic Analysis (1) Deposits and deposit market share is as of 6/30/2022 (2) GDP and number of jobs for the year ended 12/31/2021 (3) “NA” defined as not available given the Bureau of Economics does not provide the following for the given market '23-'28 2023 Median Gross Atlantic American Pro Forma Population Houshold Domestic Number Union National Market Atlantic American 2023 Growth Income Product² of Deposits Deposits Deposits Share Market Union National Population (%) ($) ($bn) Jobs² ($mm) ($mm) ($mm) (%) Roanoke, VA x x 315,037 1.2% $68,899 $18.3 196,635 $499 $714 $1,213 12.5% Lynchburg, VA x x 263,429 2.2 67,097 11.4 137,571 291 110 400 6.0 Blacksburg-Christiansburg, VA x x 165,965 0.9 62,676 8.3 89,483 921 120 1,041 24.7 Raleigh-Cary, NC x 1,488,262 7.4% $88,226 $108.3 935,265 -- $11 $11 0.0% Greensboro-High Point, NC x 784,949 2.7 57,844 45.6 481,205 -- 295 295 1.6 Winston-Salem, NC x 685,673 2.7 59,462 38.5 367,970 -- 44 44 0.3 Burlington, NC x 176,606 4.8 62,350 7.4 87,667 -- 409 409 14.5 Danville, VA x 101,920 (0.3) 49,993 NA³ NA³ -- 748 748 35.1 Martinsville, VA x 63,038 (1.7) 45,193 NA³ NA³ -- 224 224 16.1 Washington-Arlington-Alexandria, DC-VA-MD-WV x 6,437,623 2.7% $117,952 $607.6 4,422,856 $5,310 -- $5,310 1.8% Virginia Beach-Norfolk-Newport News, VA-NC x 1,813,777 2.2 77,566 107.1 1,078,444 1,530 -- 1,530 4.3 Richmond, VA x 1,340,458 3.9 78,582 99.4 875,494 4,090 -- 4,090 2.9 Salisbury, MD-DE x 435,706 5.3 68,414 25.2 229,329 100 -- 100 0.9 Charlottesville, VA x 226,375 4.1 86,118 15.8 155,530 775 -- 775 11.0 Harrisonburg, VA x 137,189 2.9 69,923 9.5 86,488 160 -- 160 4.5 Staunton, VA x 126,694 2.6 65,641 5.9 66,112 471 -- 471 22.3 Elizabeth City, NC x 53,824 1.0 64,954 NA³ NA³ 122 -- 122 11.5 Kill Devil Hills, NC x 38,264 4.7 78,794 NA³ NA³ 93 -- 93 4.6 Market Demographics Deposits¹ Shared American National Atlantic Union
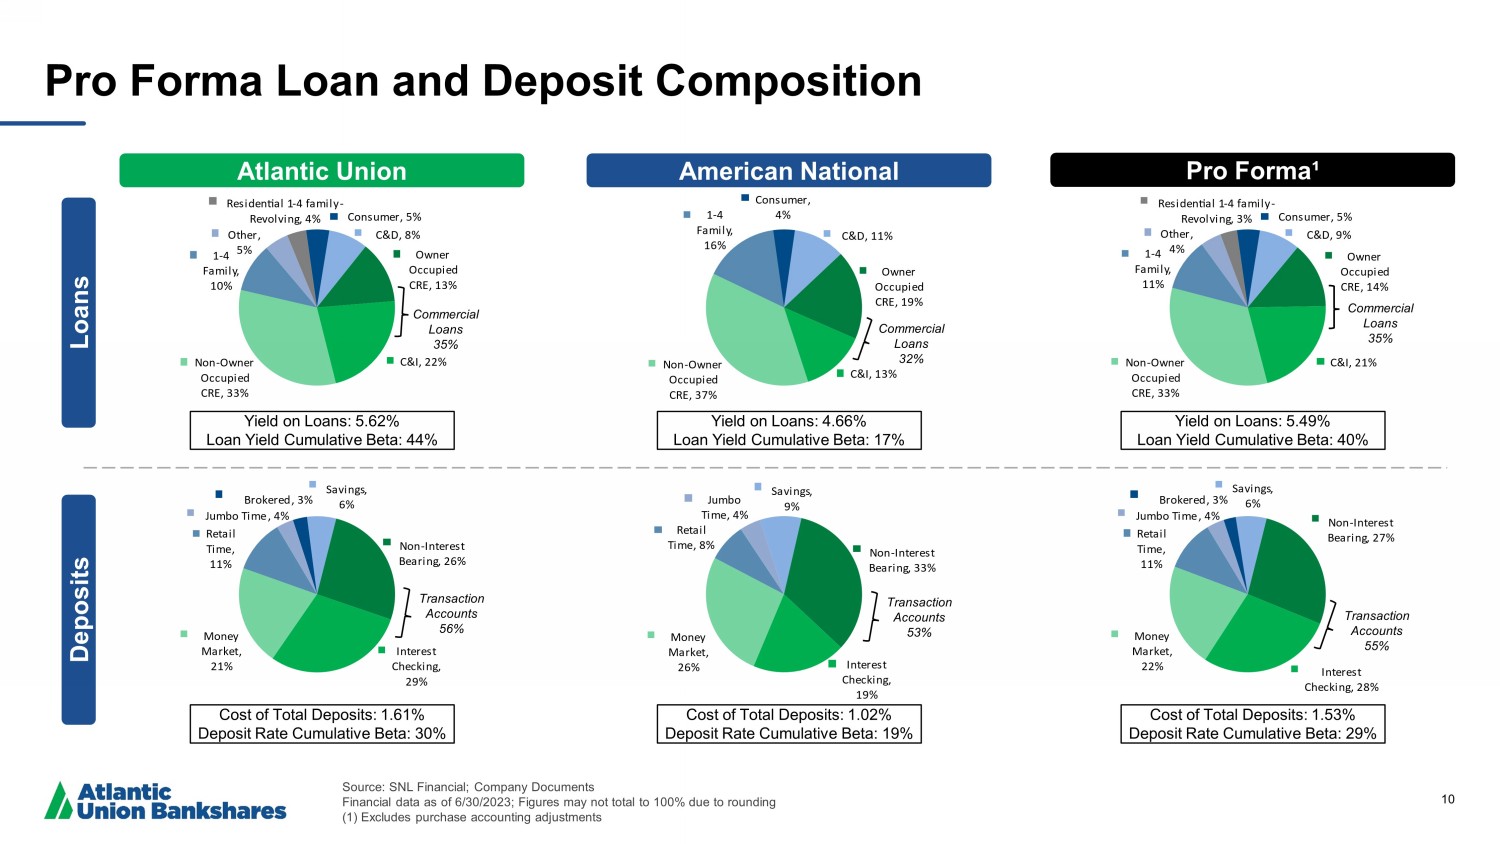
10 Loans Deposits Atlantic Union American National Pro Forma¹ Yield on Loans: 5.62% Loan Yield Cumulative Beta: 44% Yield on Loans: 4.66% Loan Yield Cumulative Beta: 17% Yield on Loans: 5.49% Loan Yield Cumulative Beta: 40% ƌŽŬĞƌĞĚ ϯ ^ĂǀŝŶŐƐ ϲ EŽŶ Ͳ /ŶƚĞƌĞƐƚ ĞĂƌŝŶŐ Ϯϲ /ŶƚĞƌĞƐƚ ŚĞĐŬŝŶŐ Ϯ DŽŶĞ DĂƌŬĞƚ Ϯ ZĞƚĂŝů dŝŵĞ :ƵŵďŽdŝŵĞ Cost of Total Deposits: 1.61% Deposit Rate Cumulative Beta: 30% ^ĂǀŝŶŐƐ EŽŶ Ͳ /ŶƚĞƌĞƐƚ ĞĂƌŝŶŐ ϯϯ /ŶƚĞƌĞƐƚ ŚĞĐŬŝŶŐ DŽŶĞ DĂƌŬĞƚ Ϯϲ ZĞƚĂŝů dŝŵĞ ϴ :ƵŵďŽ dŝŵĞ Cost of Total Deposits: 1.02% Deposit Rate Cumulative Beta: 19% Cost of Total Deposits: 1.53% Deposit Rate Cumulative Beta: 29% Commercial Loans 35% Commercial Loans 32% Commercial Loans 35% Transaction Accounts 56% Transaction Accounts 53% Transaction Accounts 55% Pro Forma Loan and Deposit Composition Source: SNL Financial; Company Documents Financial data as of 6/30/2023; Figures may not total to 100% due to rounding (1) Excludes purchase accounting adjustments
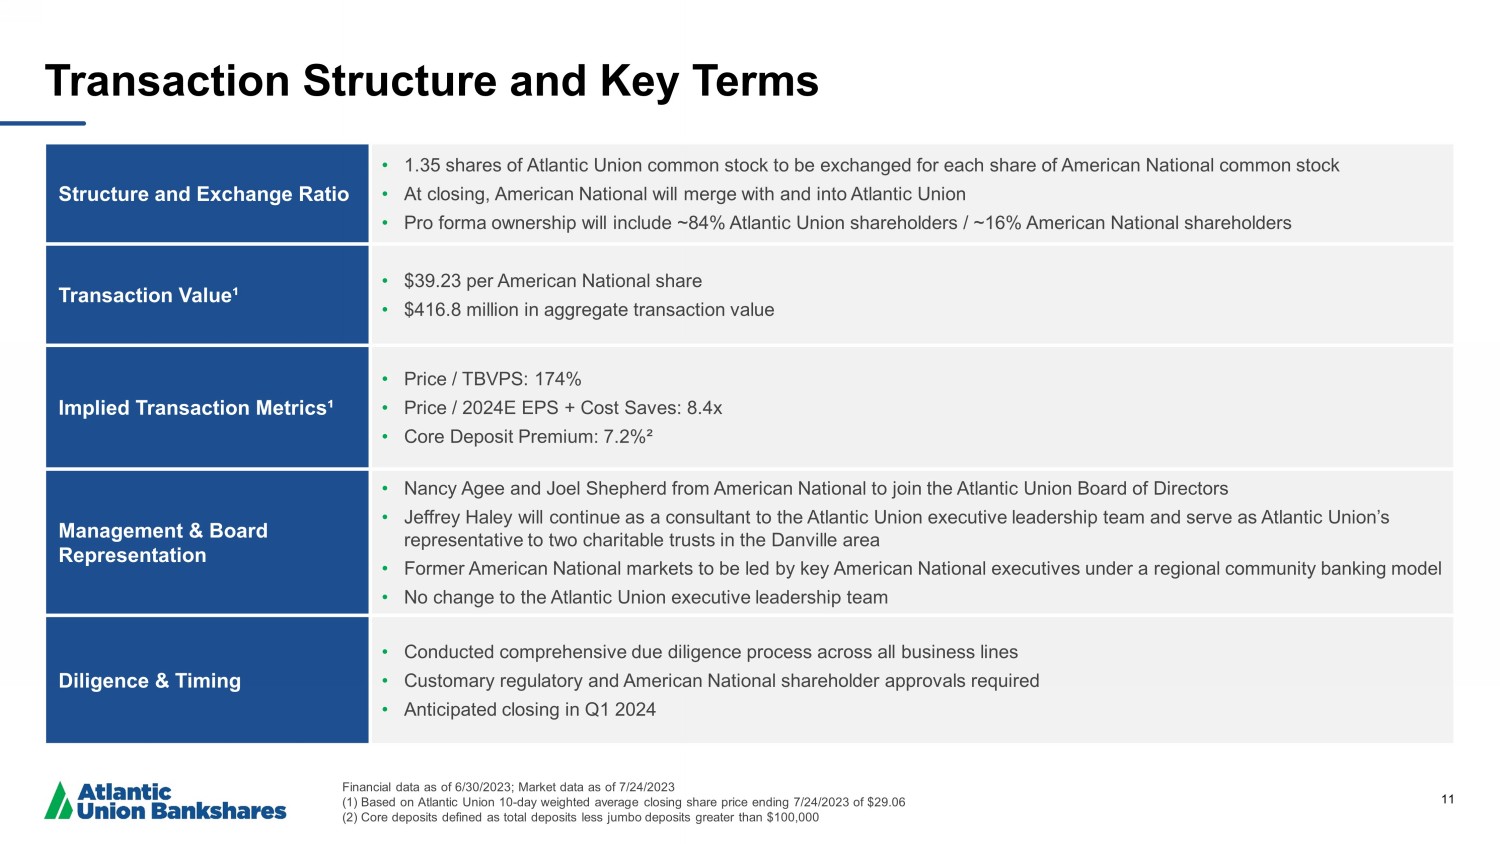
11 Transaction Structure and Key Terms Structure and Exchange Ratio • 1.35 shares of Atlantic Union common stock to be exchanged for each share of American National common stock • At closing, American National will merge with and into Atlantic Union • Pro forma ownership will include ~84% Atlantic Union shareholders / ~16% American National shareholders Transaction Value¹ • $39.23 per American National share • $416.8 million in aggregate transaction value Implied Transaction Metrics¹ • Price / TBVPS: 174% • Price / 2024E EPS + Cost Saves: 8.4 x • Core Deposit Premium: 7.2%² Management & Board Representation • Nancy Agee and Joel Shepherd from American National to join the Atlantic Union Board of Directors • Jeffrey Haley will continue as a consultant to the Atlantic Union executive leadership team and serve as Atlantic Union’s representative to two charitable trusts in the Danville area • Former American National markets to be led by key American National executives under a regional community banking model • No change to the Atlantic Union executive leadership team Diligence & Timing • Conducted comprehensive due diligence process across all business lines • Customary regulatory and American National shareholder approvals required • Anticipated closing in Q1 2024 Financial data as of 6/30/2023; Market data as of 7/24/2023 (1) Based on Atlantic Union 10 - day weighted average closing share price ending 7/24/2023 of $29.06 (2) Core deposits defined as total deposits less jumbo deposits greater than $100,000

12 Key Transaction Assumptions Gross Credit Mark • Total gross credit mark of $25.4 million • 1.13% of total loans • $4.3 million on purchased credit deteriorated (“PCD”) loans • $21.0 million on non - PCD loans • Non - PCD CECL¹ reserve of $19.7 million established Day - 2 Other Pre - tax Fair Value Marks And Transaction Assumptions • $119.7 million write - down of loans • $8.4 million write - up of fixed assets • $13.7 million write - down of liabilities • $68 million pre - tax unrealized loss embedded in American National’s June 30th AOCI realized through income over a six - year period Other Intangibles • $87.2 million core deposit intangible (“CDI”), approximately 3.75% of non - time deposits • $7.5 million wealth intangible asset Estimated Expense Savings • 40% of American National's noninterest expense • Assumes 75% of cost savings achieved in 2024 Estimated Transaction Expenses • Approximately $32.0 million, after - tax Financial data as of 6/30/2023 (1) CECL defined as current expected credit loss; accounting standard that requires financial institutions to measure credit los ses on financial instruments based on expected credit loses rather than incurred losses
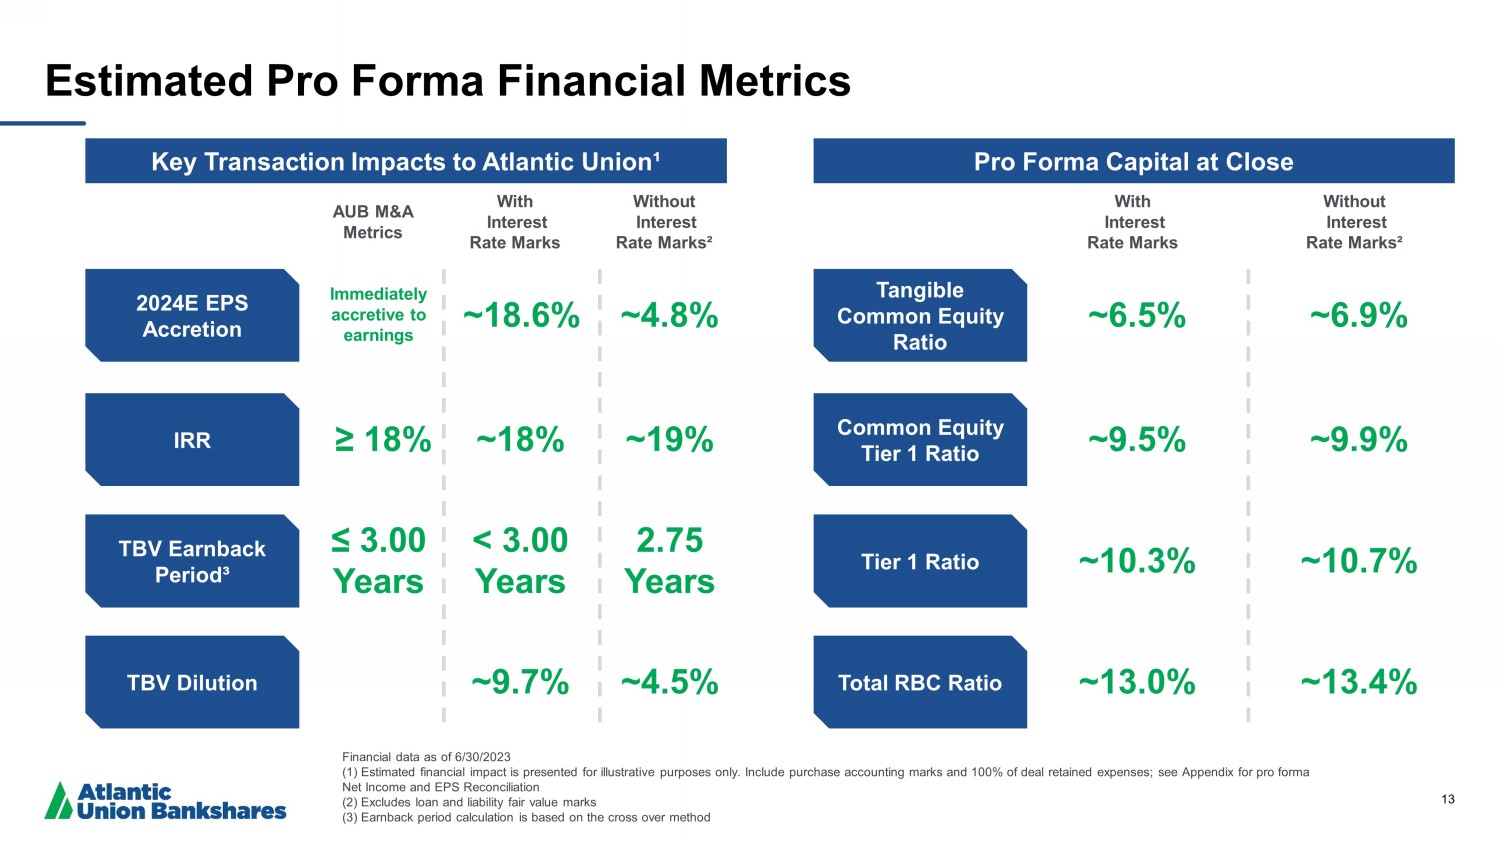
13 Estimated Pro Forma Financial Metrics Financial data as of 6/30/2023 (1) Estimated financial impact is presented for illustrative purposes only. Include purchase accounting marks and 100% of dea l r etained expenses; see Appendix for pro forma Net Income and EPS Reconciliation (2) Excludes loan and liability fair value marks (3) Earnback period calculation is based on the cross over method Key Transaction Impacts to Atlantic Union¹ Pro Forma Capital at Close 2024E EPS Accretion TBV Dilution TBV Earnback Period³ Tangible Common Equity Ratio Common Equity Tier 1 Ratio ~9.5% ~9.9% ~6.5% ~6.9% ~18.6% ~4.8% ~9.7% ~4.5% < 3.00 Years 2.75 Years With Interest Rate Marks With Interest Rate Marks Without Interest Rate Marks² Without Interest Rate Marks² Tier 1 Ratio Total RBC Ratio ~10.3% ~13.0% ~10.7% ~13.4% IRR ~18% ~19% AUB M&A Metrics ≥ 18% ≤ 3.00 Years Immediately accretive to earnings
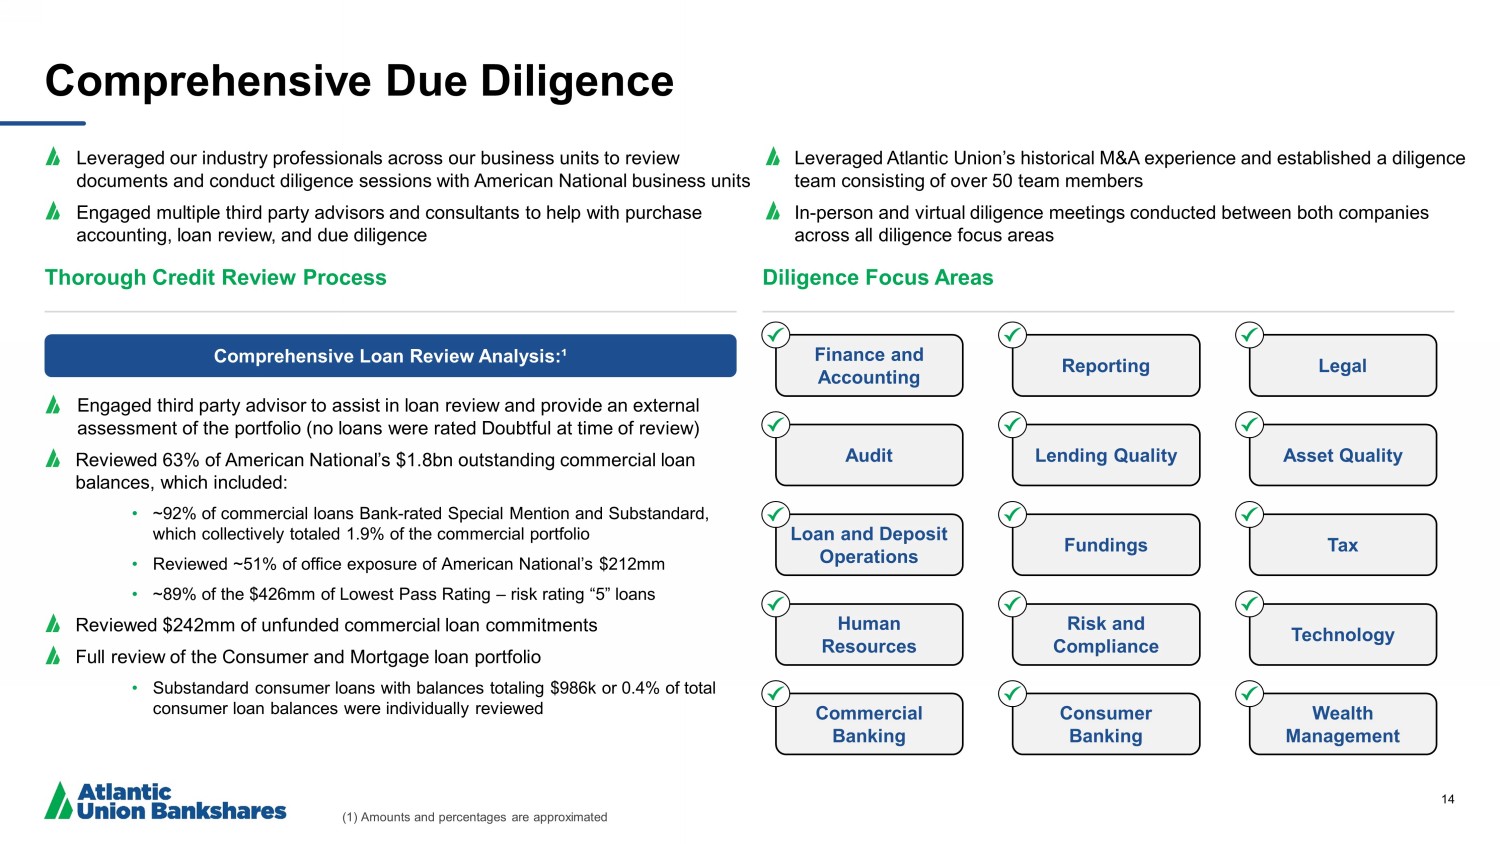
14 Comprehensive Due Diligence Leveraged our industry professionals across our business units to review documents and conduct diligence sessions with American National business units Engaged multiple third party advisors and consultants to help with purchase accounting, loan review, and due diligence Thorough Credit Review Process Diligence Focus Areas Legal Reporting Audit Asset Quality Lending Quality Loan and Deposit Operations Tax Fundings Human Resources Technology Risk and Compliance Comprehensive Loan Review Analysis:¹ Leveraged Atlantic Union’s historical M&A experience and established a diligence team consisting of over 50 team members In - person and virtual diligence meetings conducted between both companies across all diligence focus areas Engaged third party advisor to assist in loan review and provide an external assessment of the portfolio (no loans were rated Doubtful at time of review) Reviewed 63% of American National’s $1.8bn outstanding commercial loan balances, which included: • ~92% of commercial loans Bank - rated Special Mention and Substandard, which collectively totaled 1.9% of the commercial portfolio • Reviewed ~51% of office exposure of American National’s $212mm • ~89% of the $426mm of Lowest Pass Rating – risk rating “5” loans Reviewed $242mm of unfunded commercial loan commitments Full review of the Consumer and Mortgage loan portfolio • Substandard consumer loans with balances totaling $986k or 0.4% of total consumer loan balances were individually reviewed Finance and Accounting Commercial Banking Wealth Management Consumer Banking (1) Amounts and percentages are approximated
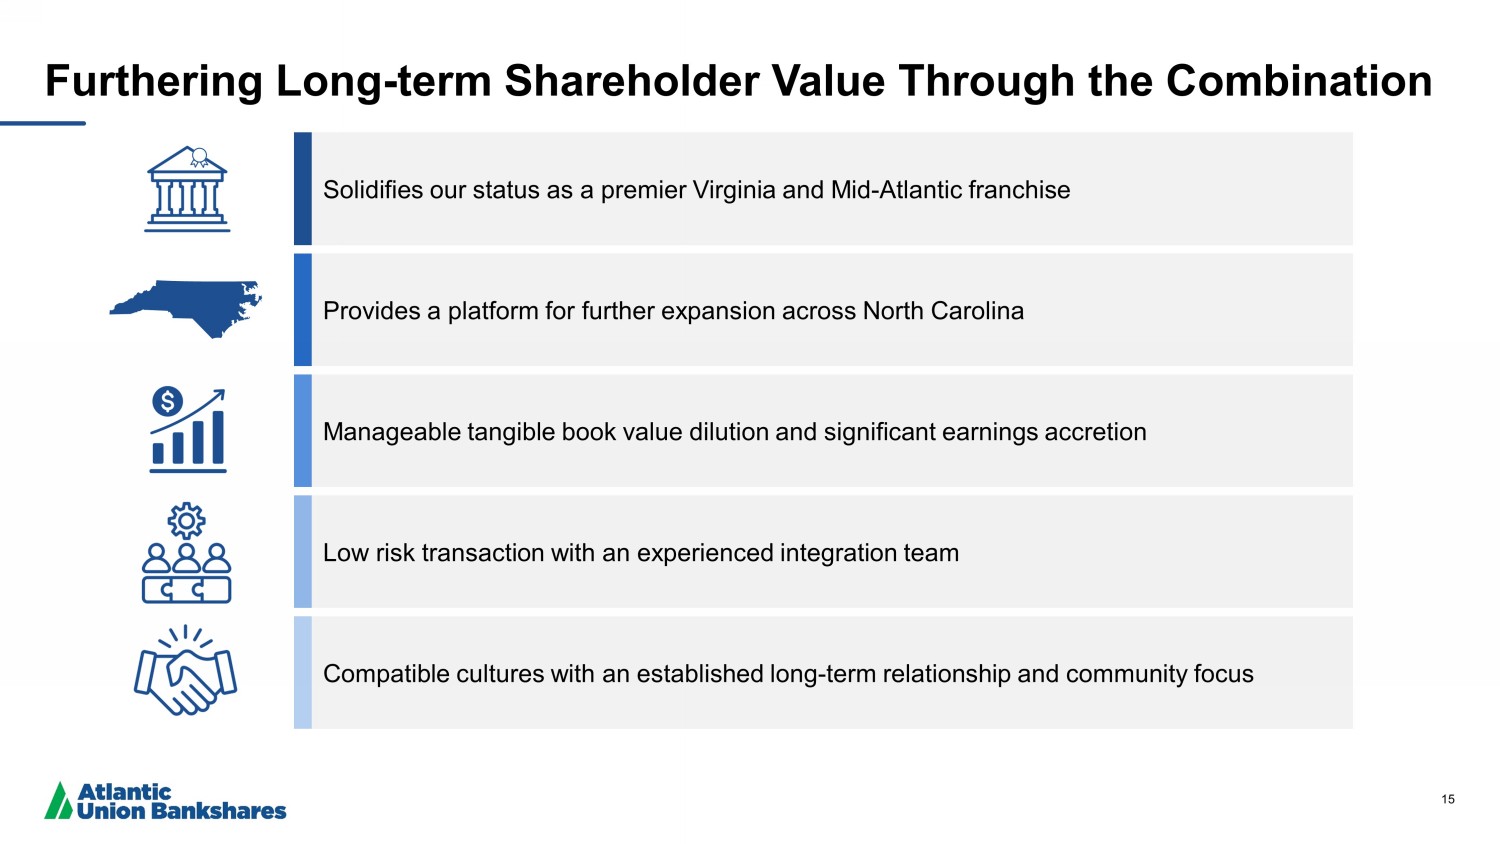
15 Furthering Long - term Shareholder Value Through the Combination Solidifies our status as a premier Virginia and Mid - Atlantic franchise Provides a platform for further expansion across North Carolina Manageable tangible book value dilution and significant earnings accretion Low risk transaction with an experienced integration team Compatible cultures with an established long - term relationship and community focus

16 Appendix
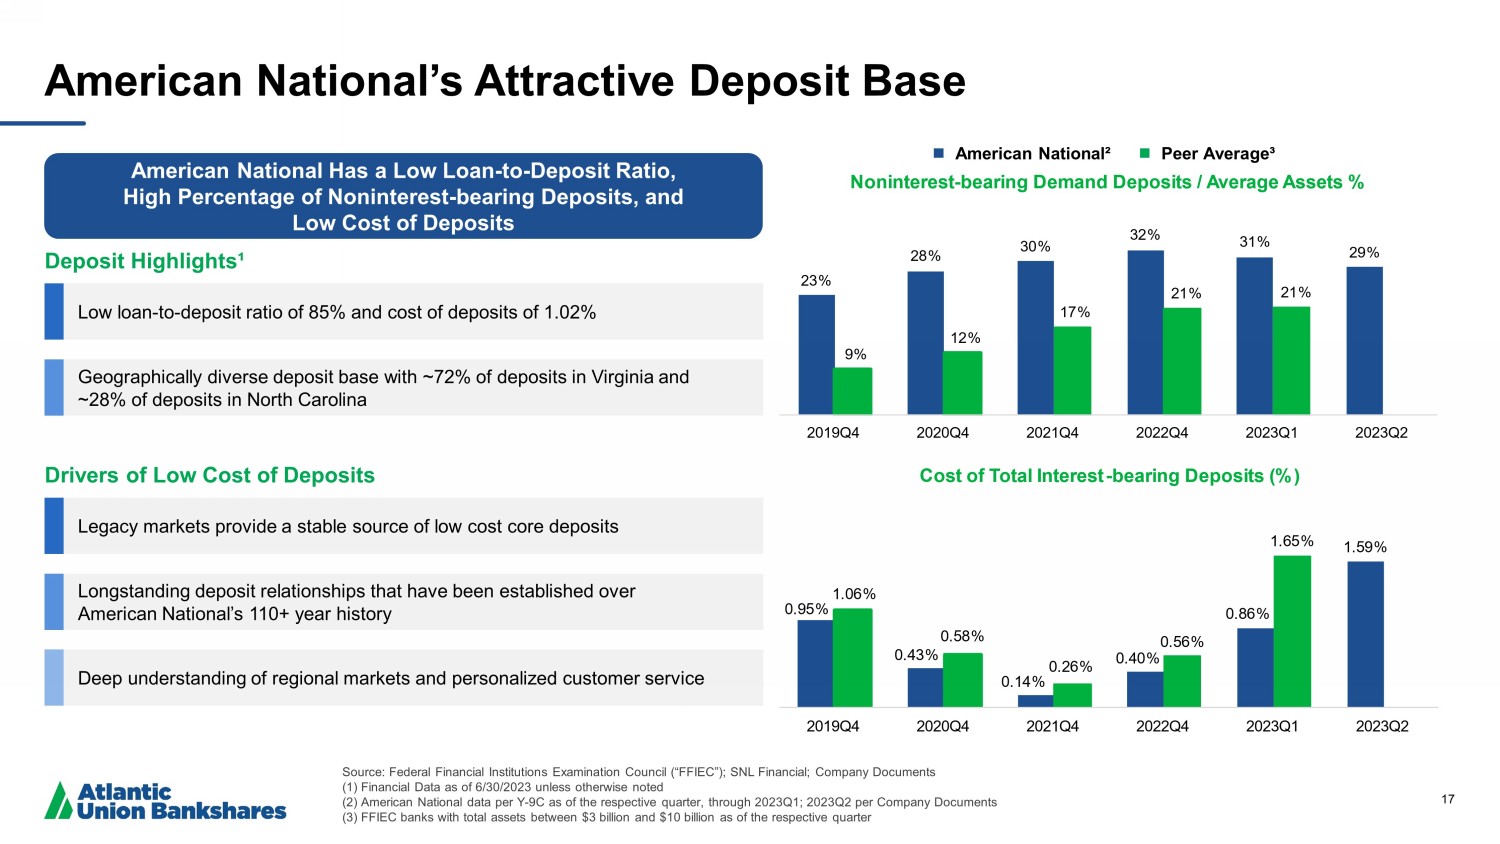
17 4 4 4 4 4 4 1RQLQWHUHVW EHDULQJ'HPDQG'HSRVLWV $YHUDJH$VVHWV 4 4 4 4 4 4 &RVWRI7RWDO,QWHUHVW EHDULQJ'HSRVLWV American National Has a Low Loan - to - Deposit Ratio, High Percentage of Noninterest - bearing Deposits, and Low Cost of Deposits American National’s Attractive Deposit Base American National² Peer Average³ Deposit Highlights¹ Low loan - to - deposit ratio of 85% and cost of deposits of 1.02% Geographically diverse deposit base with ~72% of deposits in Virginia and ~28% of deposits in North Carolina Drivers of Low Cost of Deposits Legacy markets provide a stable source of low cost core deposits Longstanding deposit relationships that have been established over American National’s 110+ year history Deep understanding of regional markets and personalized customer service Source: Federal Financial Institutions Examination Council (“FFIEC”); SNL Financial; Company Documents (1) Financial Data as of 6/30/2023 unless otherwise noted (2) American National data per Y - 9C as of the respective quarter, through 2023Q1; 2023Q2 per Company Documents (3) FFIEC banks with total assets between $3 billion and $10 billion as of the respective quarter
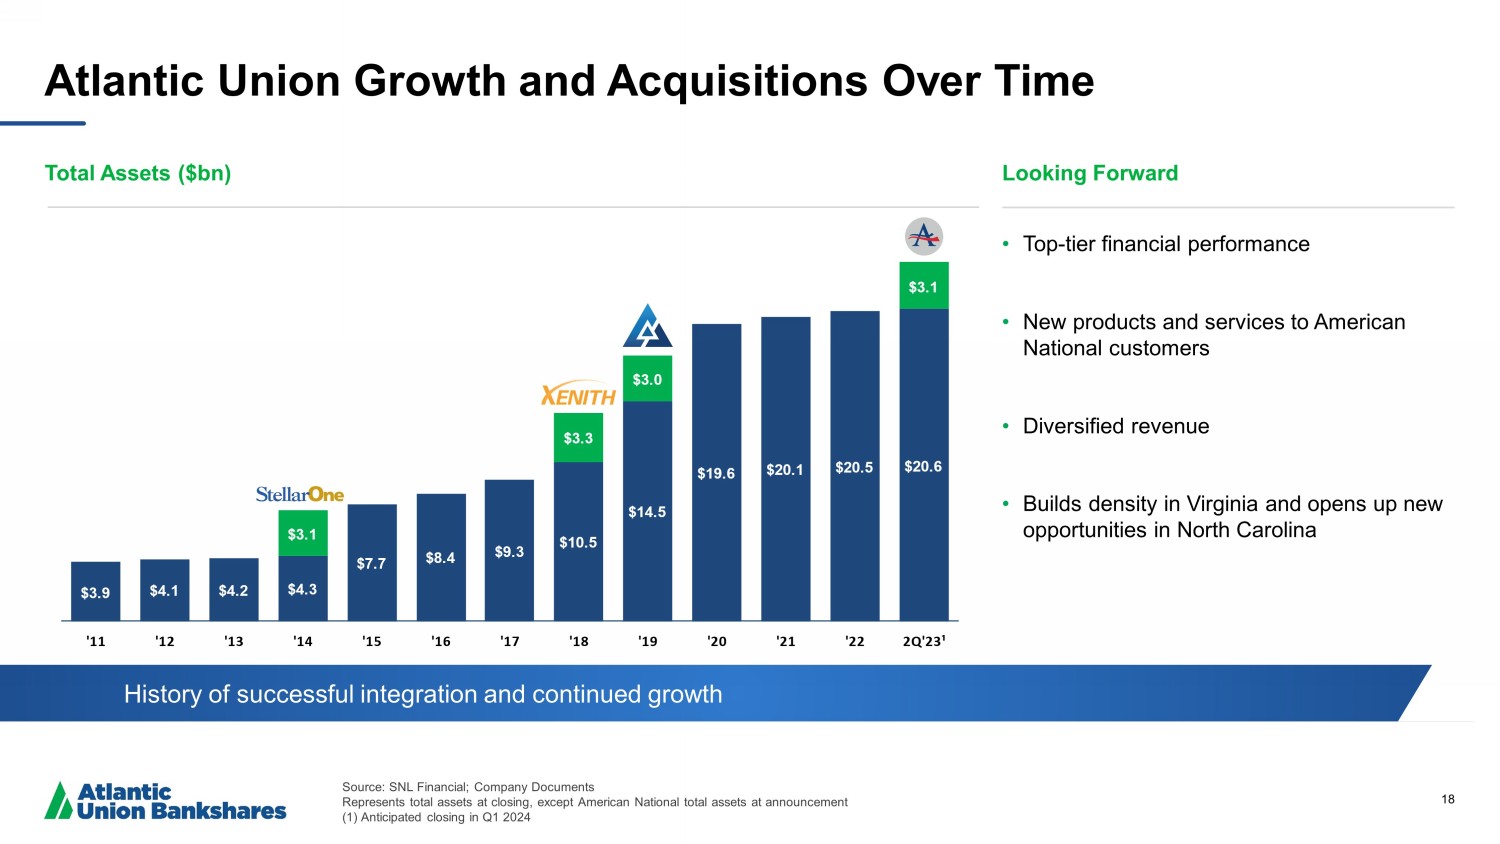
18 Ζ Ζ Ϯ Ζ ϯ Ζ Ζ ϱ Ζ ϲ Ζ ϳ Ζ ϴ Ζ Ζ ϮϬ Ζ Ϯ Ζ ϮϮ Ϯ Y Ζ Ϯϯ Ϸ • Top - tier financial performance • New products and services to American National customers • Diversified revenue • Builds density in Virginia and opens up new opportunities in North Carolina Atlantic Union Growth and Acquisitions Over Time Total Assets ($bn) Looking Forward History of successful integration and continued growth Source: SNL Financial; Company Documents Represents total assets at closing, except American National total assets at announcement (1) Anticipated closing in Q1 2024
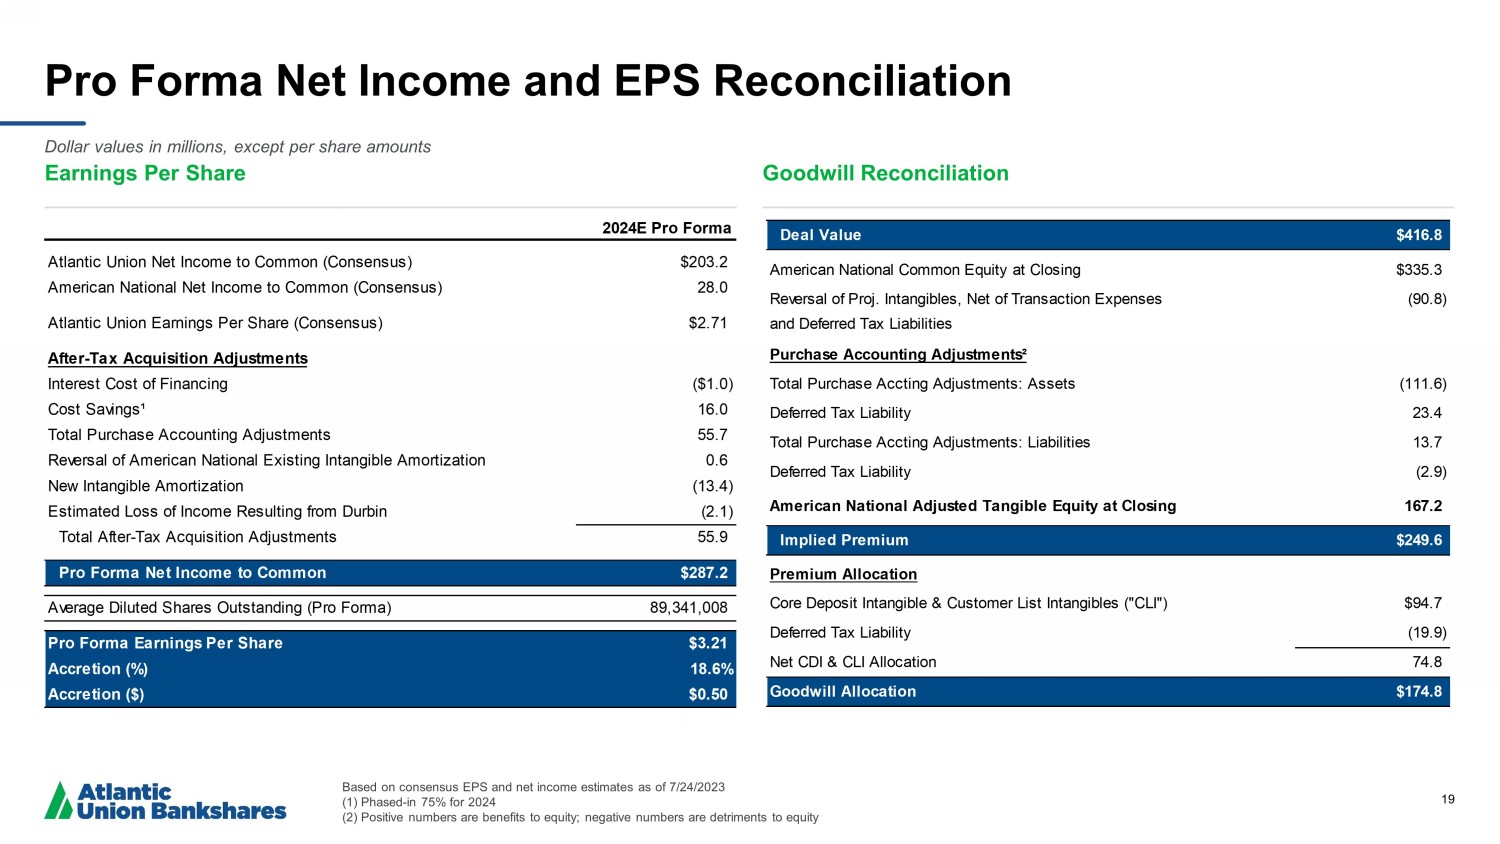
19 Pro Forma Net Income and EPS Reconciliation Earnings Per Share Goodwill Reconciliation Deal Value $416.8 American National Common Equity at Closing $335.3 Reversal of Proj. Intangibles, Net of Transaction Expenses (90.8) and Deferred Tax Liabilities Purchase Accounting Adjustments² Total Purchase Accting Adjustments: Assets (111.6) Deferred Tax Liability 23.4 Total Purchase Accting Adjustments: Liabilities 13.7 Deferred Tax Liability (2.9) American National Adjusted Tangible Equity at Closing 167.2 Implied Premium $249.6 Premium Allocation Core Deposit Intangible & Customer List Intangibles ("CLI") $94.7 Deferred Tax Liability (19.9) Net CDI & CLI Allocation 74.8 Goodwill Allocation $174.8 Based on consensus EPS and net income estimates as of 7/24/2023 (1) Phased - in 75% for 2024 (2) Positive numbers are benefits to equity; negative numbers are detriments to equity Dollar values in millions, except per share amounts 2024E Pro Forma Atlantic Union Net Income to Common (Consensus) $203.2 American National Net Income to Common (Consensus) 28.0 Atlantic Union Earnings Per Share (Consensus) $2.71 After-Tax Acquisition Adjustments Interest Cost of Financing ($1.0) Cost Savings¹ 16.0 Total Purchase Accounting Adjustments 55.7 Reversal of American National Existing Intangible Amortization 0.6 New Intangible Amortization (13.4) Estimated Loss of Income Resulting from Durbin (2.1) Total After-Tax Acquisition Adjustments 55.9 Pro Forma Net Income to Common $287.2 Average Diluted Shares Outstanding (Pro Forma) 89,341,008 Pro Forma Earnings Per Share $3.21 Accretion (%) 18.6% Accretion ($) $0.50
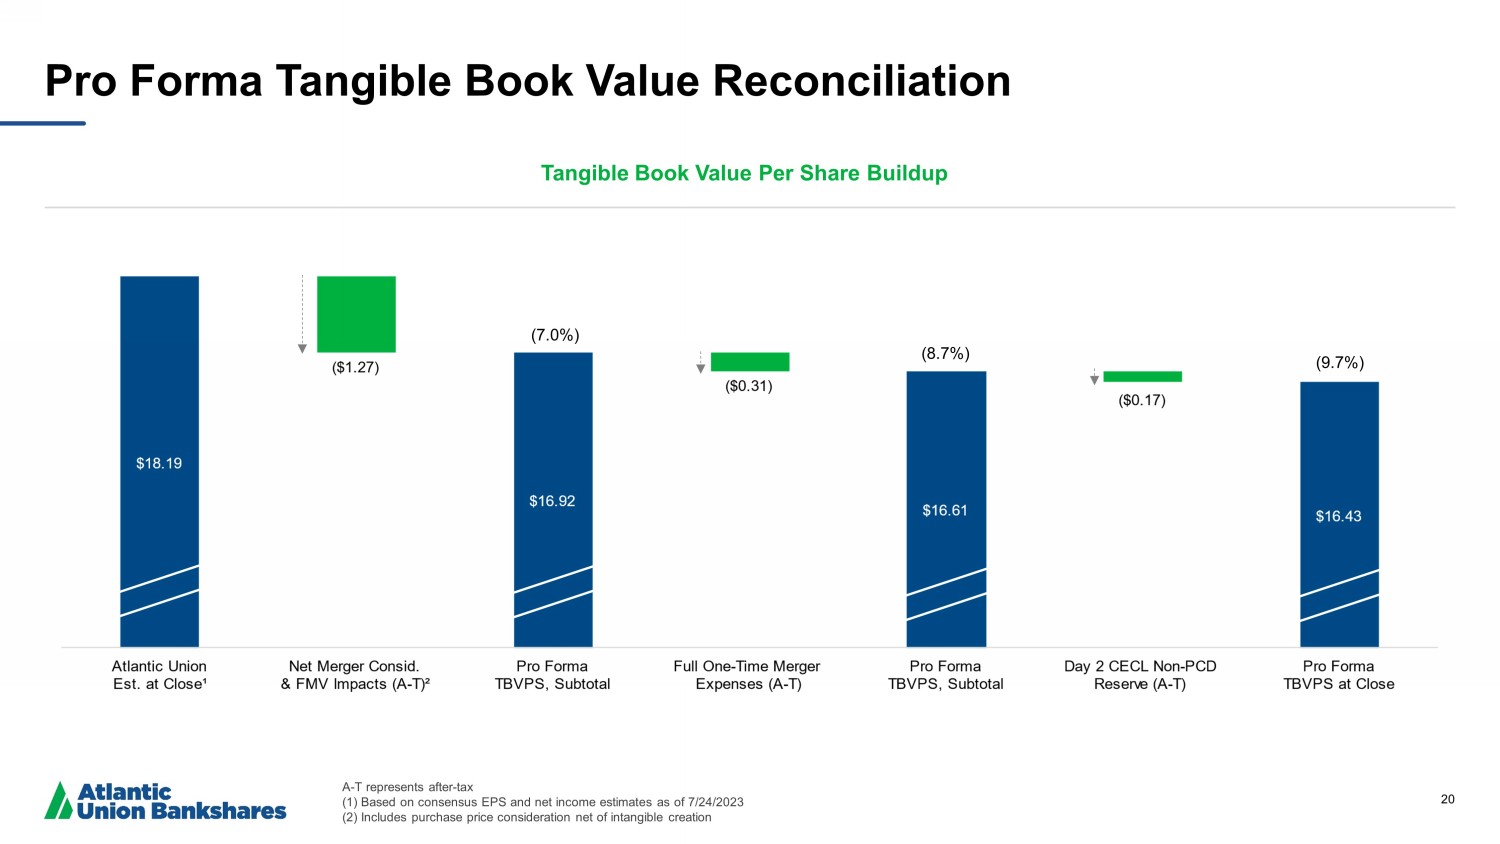
20 Pro Forma Tangible Book Value Reconciliation A - T represents after - tax (1) Based on consensus EPS and net income estimates as of 7/24/2023 (2) Includes purchase price consideration net of intangible creation Tangible Book Value Per Share Buildup (7.0%) (8.7%) (9.7%)