Exhibit 99.1
| Investor Presentation May - June, 2026 |

| 2 This presentation and statements by our management may constitute “forward FORWARD-LOOKING STATEMENTS -looking statements” within the meaning of the Private Securities Litigation Reform Act of 1995. Forward-looking statements are statements that include, without limitation, statements regarding our strategic initiatives, priorities, plan and vision; our acquisition of Sandy Spring Bancorp, Inc. (“Sandy Spring”), including expectations with regard to the benefits of the Sandy Spring acquisition; statements regarding our strategic expansion into North Carolina and the impacts of such strategy; statements regarding our business, financial and operating results, including our deposit base and funding; the impact of changes in economic conditions, anticipated changes in the interest rate environment and the related impacts on our net interest margin, changes in economic, fiscal or trade policy and the potential impacts on our business, loan demand and economic conditions in our markets and nationally; management’s beliefs regarding our liquidity, capital resources, asset quality, CRE loan portfolio and our customer relationships; statements regarding our strategy, statements that include other projections, predictions, expectations, or beliefs about future events or results or otherwise are not statements of historical fact, and statements on the slides entitled “Our Strategic Priorities”, “Highlights”, “Harnessing Organic Power”, “2026 Financial Outlook” and “North Carolina Expansion Strategy”. Such forward-looking statements are based on certain assumptions as of the time they are made, and are inherently subject to known and unknown risks, uncertainties, and other factors, some of which cannot be predicted or quantified, that may cause actual results, performance, or achievements to be materially different from those expressed or implied by such forward-looking statements. Forward-looking statements are often characterized by the use of qualified words (and their derivatives) such as “expect,” “believe,” “estimate,” “plan,” “project,” “anticipate,” “intend,” “will,” “may,” “view,” “opportunity,” “seek to,” “potential,” “continue,” “confidence,” or words of similar meaning or other statements concerning opinions or judgment of Atlantic Union Bankshares Corporation (the “Company,” “AUB,” “we,” “us” or “our”) and our management about future events. Although we believe that our expectations with respect to forward-looking statements are based on reasonable assumptions within the bounds of our existing knowledge of our business and operations, there can be no assurance that actual future results, performance, or achievements of, or trends affecting, us will not differ materially from any projected future results, performance, achievements or trends expressed or implied by such forward-looking statements. Actual future results, performance, achievements or trends may differ materially from historical results or those anticipated depending on a variety of factors, including, but not limited to, the effects of or changes in: • market interest rates and their related impacts on macroeconomic conditions, customer and client behavior, our funding costs and our loan and securities portfolios; • economic conditions, including inflation and recessionary conditions and their related impacts on economic growth and customer and client behavior; • U.S. and global trade policies and tensions, including changes in, or the imposition of, tariffs and/or trade barriers and the economic impacts, volatility and uncertainty resulting therefrom, and geopolitical instability; • volatility in the financial services sector, including failures or rumors of failures of other depository institutions, along with actions taken by governmental agencies to address such turmoil, and the effects on the ability of depository institutions, including us, to attract and retain depositors and to borrow or raise capital; • legislative or regulatory changes and requirements, including changes in federal state or local tax laws and changes impacting the rulemaking, supervision, examination and enforcement priorities of the federal banking agencies; • the sufficiency of liquidity and changes in our capital position; • general economic and financial market conditions in the United States generally and particularly in the markets in which we operate and which our loans are concentrated, including the effects of declines in real estate values, an increase in unemployment levels, U.S. fiscal debt, budget and tax matters, U.S. government shutdowns, and slowdowns in economic growth; • the impact of purchase accounting with respect to the Sandy Spring acquisition, or any change in the assumptions used regarding the assets acquired and liabilities assumed to determine the fair value and credit marks; • the possibility that the anticipated benefits of our acquisition activity, including our acquisitions of Sandy Spring and American National, including anticipated cost savings and strategic gains, are not realized when expected or at all, including as a result of the strength of the economy, competitive factors in the areas where we do business, or as a result of other unexpected factors or events; • potential adverse reactions or changes to business or employee relationships, including those resulting from our acquisitions of Sandy Spring and American National; • our ability to identify, recruit and retain key employees • monetary, fiscal and regulatory policies of the U.S. government, including policies of the U.S. Department of the Treasury and the Federal Reserve; • the quality or composition of our loan or investment portfolios and changes in these portfolios; • demand for loan products and financial services in our market areas; • our ability to manage our growth or implement our growth strategy; • the effectiveness of expense reduction plans; • the introduction of new lines of business or new products and services; • real estate values in our lending area; • changes in accounting principles, standards, rules, and interpretations, and the related impact on our financial statements; • an insufficient ACL or volatility in the ACL resulting from the CECL methodology, either alone or as that may be affected by changing economic conditions, credit concentrations, inflation, changing interest rates, or other factors; • concentrations of loans secured by real estate, particularly commercial real estate; • the effectiveness of our credit processes and management of our credit risk; • our ability to compete in the market for financial services and increased competition from fintech companies; • technological risks and developments, and cyber threats, attacks, or events; • emerging issues related to the development and use of artificial intelligence that could give rise to legal or regulatory action or increase the risk of a cybersecurity attack or the probability that such an attack would be successful; • operational, technological, cultural, regulatory, legal, credit, and other risks associated with the exploration, consummation and integration of potential future acquisitions, whether involving stock or cash consideration; • the potential adverse effects of unusual and infrequently occurring events, such as weather-related disasters, terrorist acts, geopolitical conflicts or public health events (such as pandemics), and of governmental and societal responses thereto; these potential adverse effects may include, without limitation, adverse effects on macroeconomic conditions, the ability of our borrowers to satisfy their obligations to us, on the value of collateral securing loans, on the demand for our loans or our other products and services, on supply chains and methods used to distribute products and services, on incidents of cyberattack and fraud, on our liquidity or capital positions, on risks posed by reliance on third-party service providers, on other aspects of our business operations and on financial markets and economic growth; • performance by our counterparties or vendors; • deposit flows; • the availability of financing and the terms thereof; • the level of prepayments on loans and mortgage-backed securities; • actual or potential claims, damages, and fines related to litigation or government actions, which may result in, among other things, additional costs, fines, penalties, restrictions on our business activities, reputational harm, or other adverse consequences; • any event or development that would cause us to conclude that there was an impairment of any asset, including intangible assets, such as goodwill; and • other factors, many of which are beyond our control. Please also refer to such other factors as discussed throughout Part I, Item 1A. “Risk Factors” and Part II, Item 7. “Management’s Discussion and Analysis of Financial Condition and Results of Operations” of our Annual Report on Form 10-K for the year ended December 31, 2025, and related disclosures in other filings, which have been filed with the U.S. Securities and Exchange Commission (“SEC”) and are available on the SEC’s website at www.sec.gov. All risk factors and uncertainties described herein and therein should be considered in evaluating forward-looking statements, and all forward-looking statements are expressly qualified by the cautionary statements contained or referred to herein and therein. The actual results or developments anticipated may not be realized or, even if substantially realized, they may not have the expected consequences to or effects on the Company or our businesses or operations. Readers are cautioned not to rely too heavily on forward-looking statements. Forward-looking statements speak only as of the date they are made. We do not intend or assume any obligation to update, revise or clarify any forward-looking statements that may be made from time to time by or on behalf of the Company, whether because of new information, future events or otherwise, except as required by law. |
| 3 ADDITIONAL INFORMATION Non-GAAP Financial Measures This presentation contains certain financial information determined by methods other than in accordance with generally accepted accounting principles in the United States (“GAAP”). These non-GAAP financial measures are a supplement to GAAP, which is used to prepare our financial statements, and should not be considered in isolation or as a substitute for comparable measures calculated in accordance with GAAP. In addition, our non-GAAP financial measures may not be comparable to non-GAAP financial measures of other companies. We use the non-GAAP financial measures discussed herein in our analysis of our performance. Our management believes that these non-GAAP financial measures provide additional understanding of ongoing operations, enhance comparability of results of operations with prior periods, show the effects of significant gains and charges in the periods presented without the impact of items or events that may obscure trends in our underlying performance, or show the potential effects of accumulated other comprehensive income (or AOCI) or unrealized losses on securities on our capital. This presentation also includes certain projections of non-GAAP financial measures. Due to the inherent variability and difficulty associated with making accurate forecasts and projections of information that is excluded from these projected non-GAAP measures, and the fact that some of the excluded information is not currently ascertainable or accessible, we are unable to quantify certain amounts that would be required to be included in the most directly comparable projected GAAP financial measures without unreasonable effort. Consequently, no disclosure of projected comparable GAAP measures is included, and no reconciliation of forward-looking non-GAAP financial information is included. Please see “Reconciliation of Non-GAAP Disclosures” at the end of this presentation for a reconciliation to the nearest GAAP financial measure. No Offer or Solicitation This presentation does not constitute an offer to sell or a solicitation of an offer to buy any securities. No offer of securities shall be made except by means of a prospectus meeting the requirements of the Securities Act of 1933, as amended, and no offer to sell or solicitation of an offer to buy shall be made in any jurisdiction in which such offer, solicitation or sale would be unlawful. Market and Industry Data Unless otherwise indicated, market data and certain industry forecast data used in this presentation were obtained from internal reports, where appropriate, as well as third party sources and other publicly available information. Data regarding the industries and markets in which the Company competes, its market position and market share within these industries are inherently imprecise and are subject to significant business, economic and competitive uncertainties beyond the Company's control. In addition, assumptions and estimates of the Company and its industries' future performance are necessarily subject to a high degree of uncertainty and risk due to a variety of factors. These and other factors could cause future performance to differ materially from assumptions and estimates. About Atlantic Union Bankshares Corporation Headquartered in Richmond, Virginia, Atlantic Union Bankshares Corporation (NYSE: AUB) is the holding company for Atlantic Union Bank. Atlantic Union Bank has branches and ATMs located in Virginia, Maryland, North Carolina and Washington, D.C. Certain non-bank financial services affiliates of Atlantic Union Bank include: Atlantic Union Equipment Finance, Inc., which provides equipment financing; AUB Investments, Inc., which provides investment services; and Atlantic Union Capital Markets, Inc., which provides capital market services. |
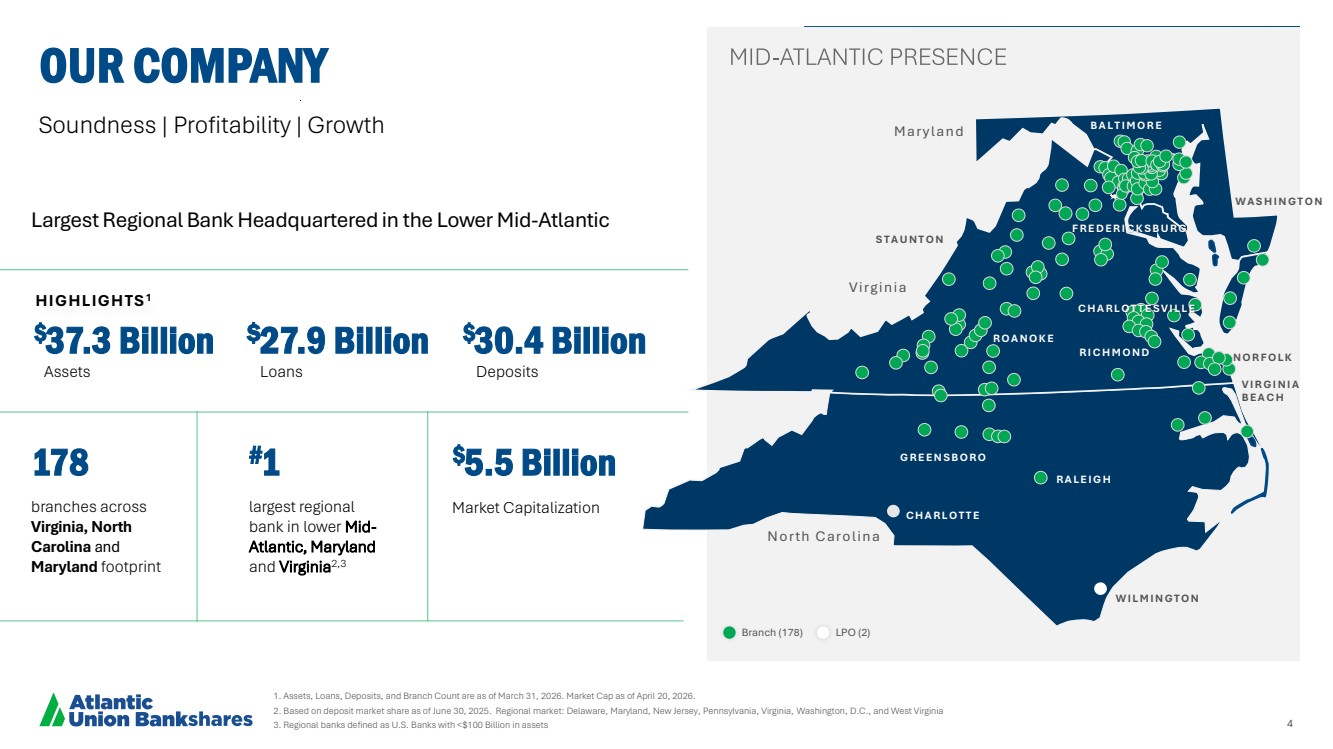
| 4 N O R F O L K V I R G I N I A B E A C H M a ry l a n d V irg in ia No rth C a ro l in a C H A R L O T T E W I L M I N G T O N B A L T I M O R E R A L E I G H G R E E N S B O R O W A S H I N G T O N R O A N O K E S T A U N T O N C H A R L O T T E S V I L L E R I C H M O N D F R E D E R I C K S B U R G HIGHLIGHTS1 branches across Virginia, North Carolina and Maryland footprint 178 largest regional bank in lower Mid-Atlantic, Maryland and Virginia2,3 #1 $37.3 Billion Assets $27.9 Billion Loans $30.4 Billion Deposits $5.5 Billion Market Capitalization Soundness | Profitability | Growth 1. Assets, Loans, Deposits, and Branch Count are as of March 31, 2026. Market Cap as of April 20, 2026. 2. Based on deposit market share as of June 30, 2025. Regional market: Delaware, Maryland, New Jersey, Pennsylvania, Virginia, Washington, D.C., and West Virginia 3. Regional banks defined as U.S. Banks with <$100 Billion in assets OUR COMPANY Branch (178) LPO (2) Largest Regional Bank Headquartered in the Lower Mid-Atlantic |
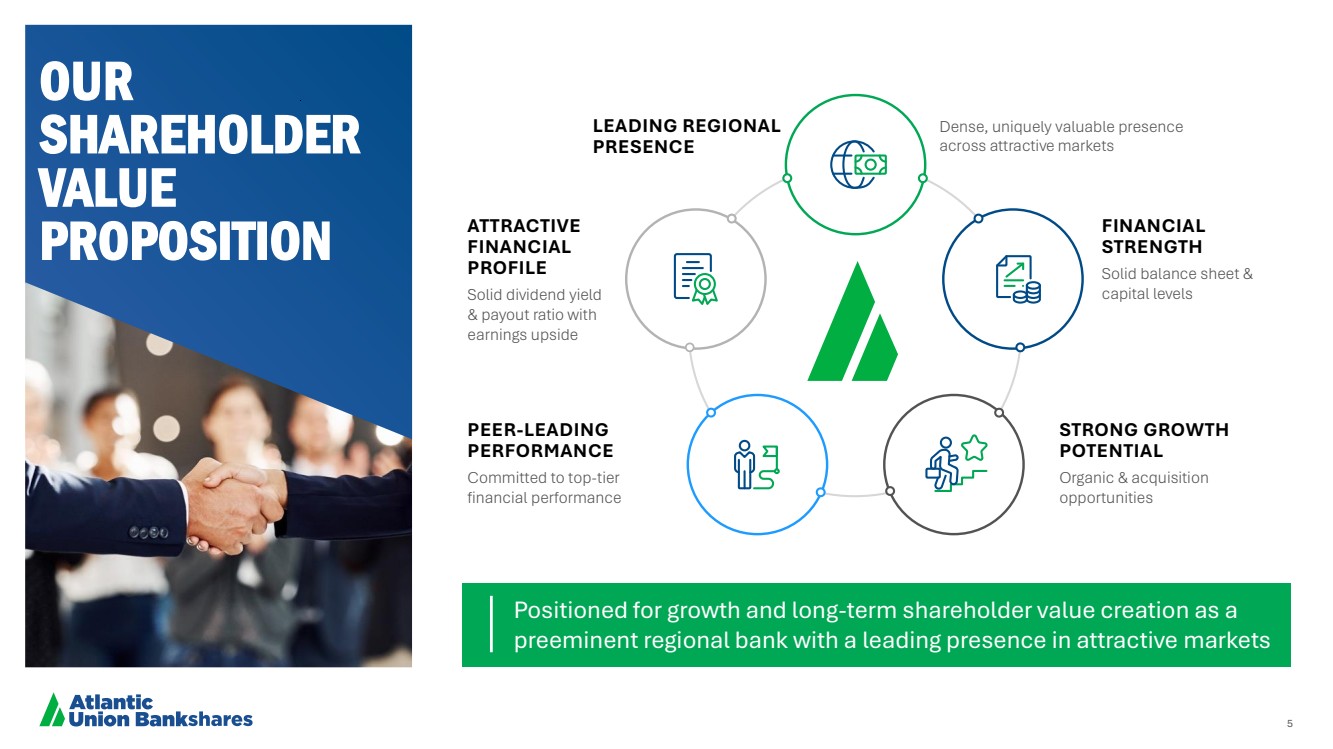
| 5 Dense, uniquely valuable presence across attractive markets FINANCIAL STRENGTH Solid balance sheet & capital levels PEER-LEADING PERFORMANCE Committed to top-tier financial performance ATTRACTIVE FINANCIAL PROFILE Solid dividend yield & payout ratio with earnings upside STRONG GROWTH POTENTIAL Organic & acquisition opportunities OUR SHAREHOLDER VALUE PROPOSITION Positioned for growth and long-term shareholder value creation as a preeminent regional bank with a leading presence in attractive markets LEADING REGIONAL PRESENCE |
| 6 Our Core Values Continue to Make us Successful CARING Working together toward common goals, acting with kindness, respect, and a genuine concern for others. COURAGEOUS Speaking openly, honestly, and accepting our challenges and mistakes as opportunities to learn and grow. COMMITTED Driven to help our clients, Teammates, and company succeed, doing what is right and accountable for our actions. Select awards received over the last three years |

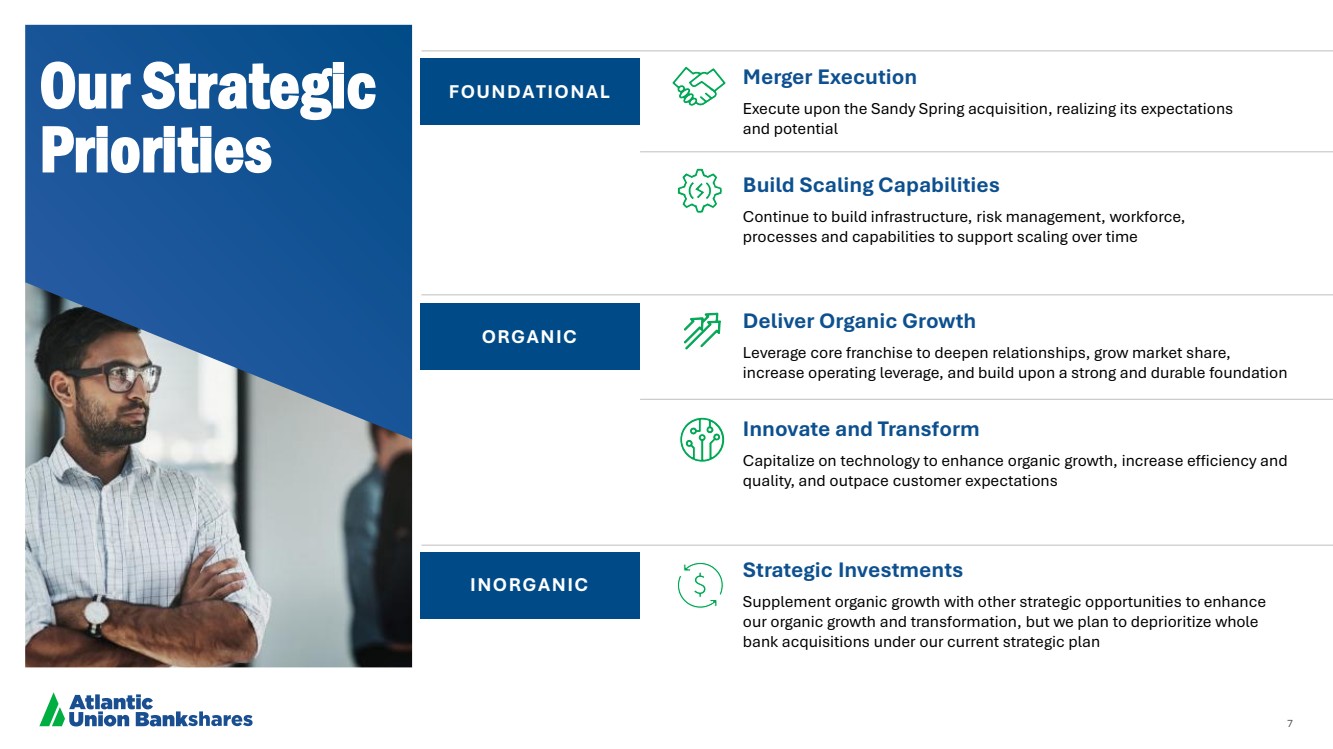
| 7 Our Strategic Priorities Merger Execution Execute upon the Sandy Spring acquisition, realizing its expectations and potential Build Scaling Capabilities Continue to build infrastructure, risk management, workforce, processes and capabilities to support scaling over time Deliver Organic Growth Leverage core franchise to deepen relationships, grow market share, increase operating leverage, and build upon a strong and durable foundation Innovate and Transform Capitalize on technology to enhance organic growth, increase efficiency and quality, and outpace customer expectations Strategic Investments Supplement organic growth with other strategic opportunities to enhance our organic growth and transformation, but we plan to deprioritize whole bank acquisitions under our current strategic plan FOUNDATIONAL ORGANIC INORGANIC |
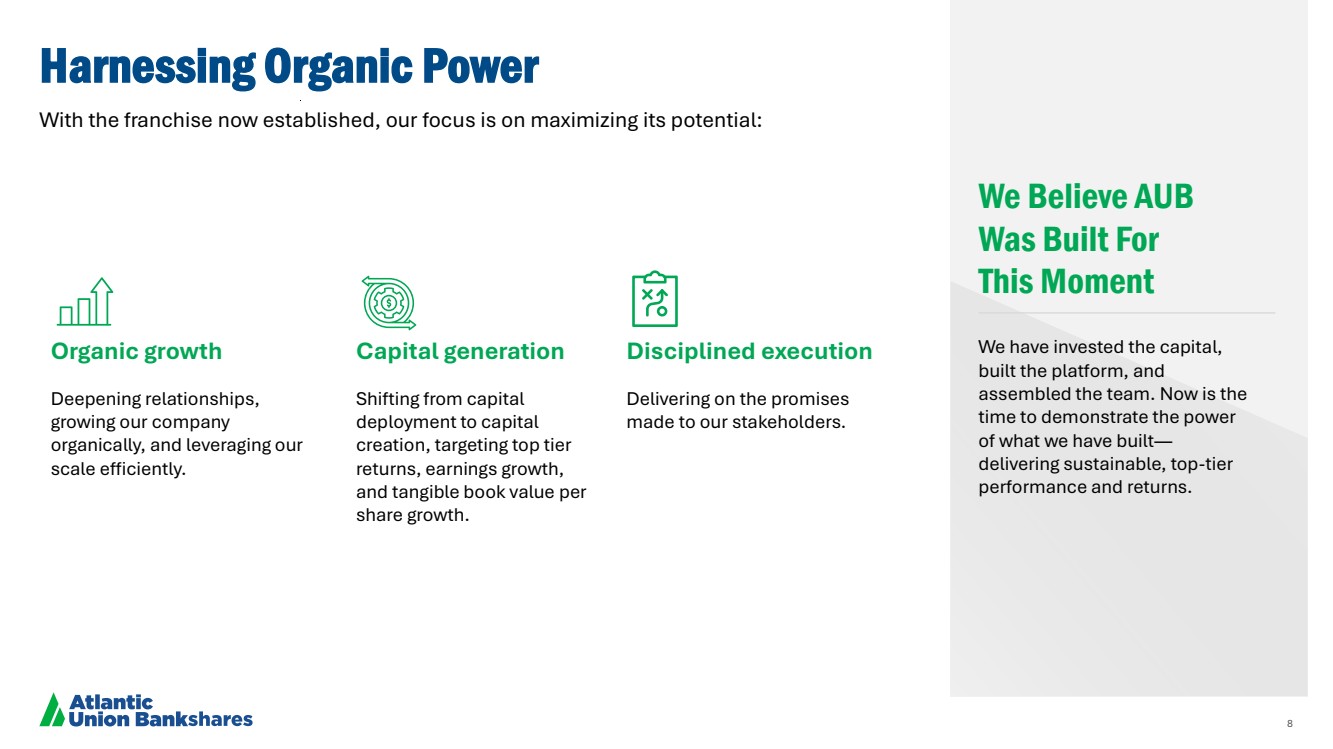
| 8 Harnessing Organic Power With the franchise now established, our focus is on maximizing its potential: We Believe AUB Was Built For This Moment We have invested the capital, built the platform, and assembled the team. Now is the time to demonstrate the power of what we have built— delivering sustainable, top-tier performance and returns. Organic growth Deepening relationships, growing our company organically, and leveraging our scale efficiently. Capital generation Shifting from capital deployment to capital creation, targeting top tier returns, earnings growth, and tangible book value per share growth. Disciplined execution Delivering on the promises made to our stakeholders. |
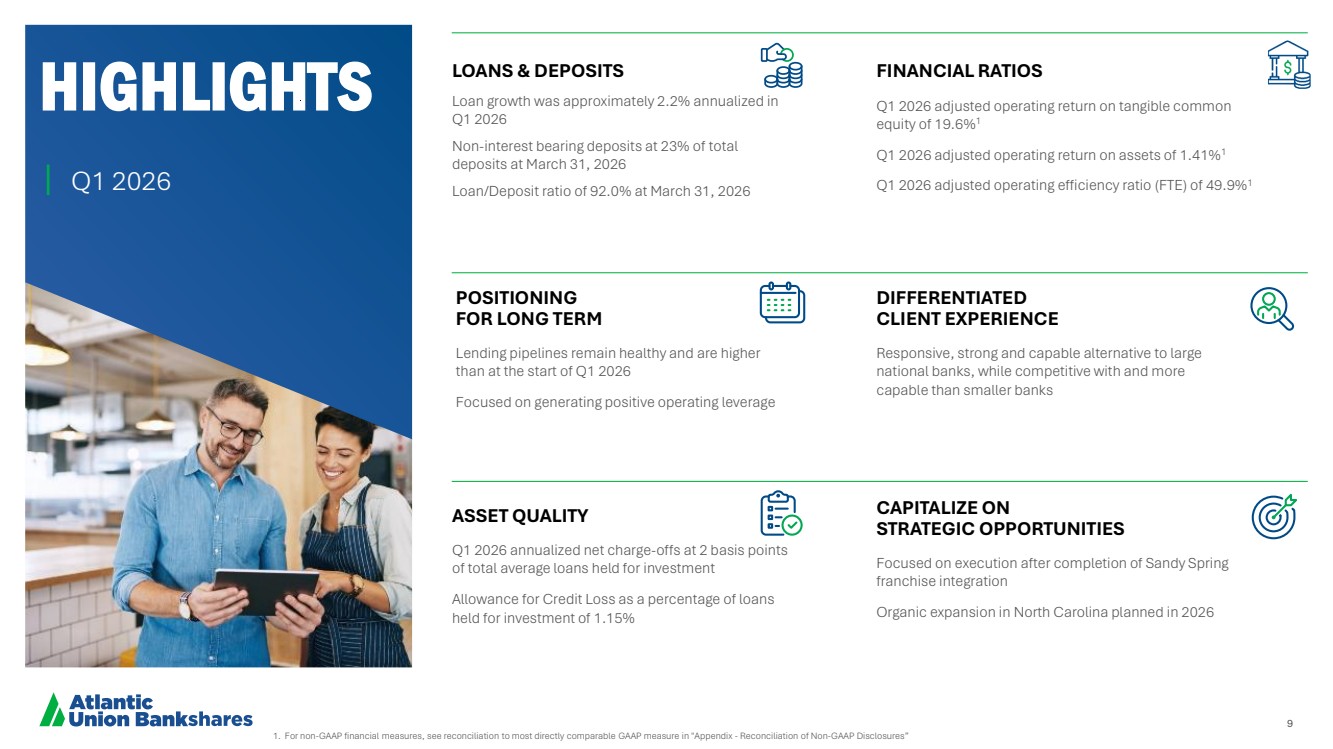
| 9 1. For non-GAAP financial measures, see reconciliation to most directly comparable GAAP measure in "Appendix - Reconciliation of Non-GAAP Disclosures” HIGHLIGHTS Q1 2026 LOANS & DEPOSITS Loan growth was approximately 2.2% annualized in Q1 2026 Non-interest bearing deposits at 23% of total deposits at March 31, 2026 Loan/Deposit ratio of 92.0% at March 31, 2026 POSITIONING FOR LONG TERM Lending pipelines remain healthy and are higher than at the start of Q1 2026 Focused on generating positive operating leverage DIFFERENTIATED CLIENT EXPERIENCE Responsive, strong and capable alternative to large national banks, while competitive with and more capable than smaller banks CAPITALIZE ON STRATEGIC OPPORTUNITIES Focused on execution after completion of Sandy Spring franchise integration Organic expansion in North Carolina planned in 2026 FINANCIAL RATIOS Q1 2026 adjusted operating return on tangible common equity of 19.6%1 Q1 2026 adjusted operating return on assets of 1.41%1 Q1 2026 adjusted operating efficiency ratio (FTE) of 49.9%1 ASSET QUALITY Q1 2026 annualized net charge-offs at 2 basis points of total average loans held for investment Allowance for Credit Loss as a percentage of loans held for investment of 1.15% 9 |
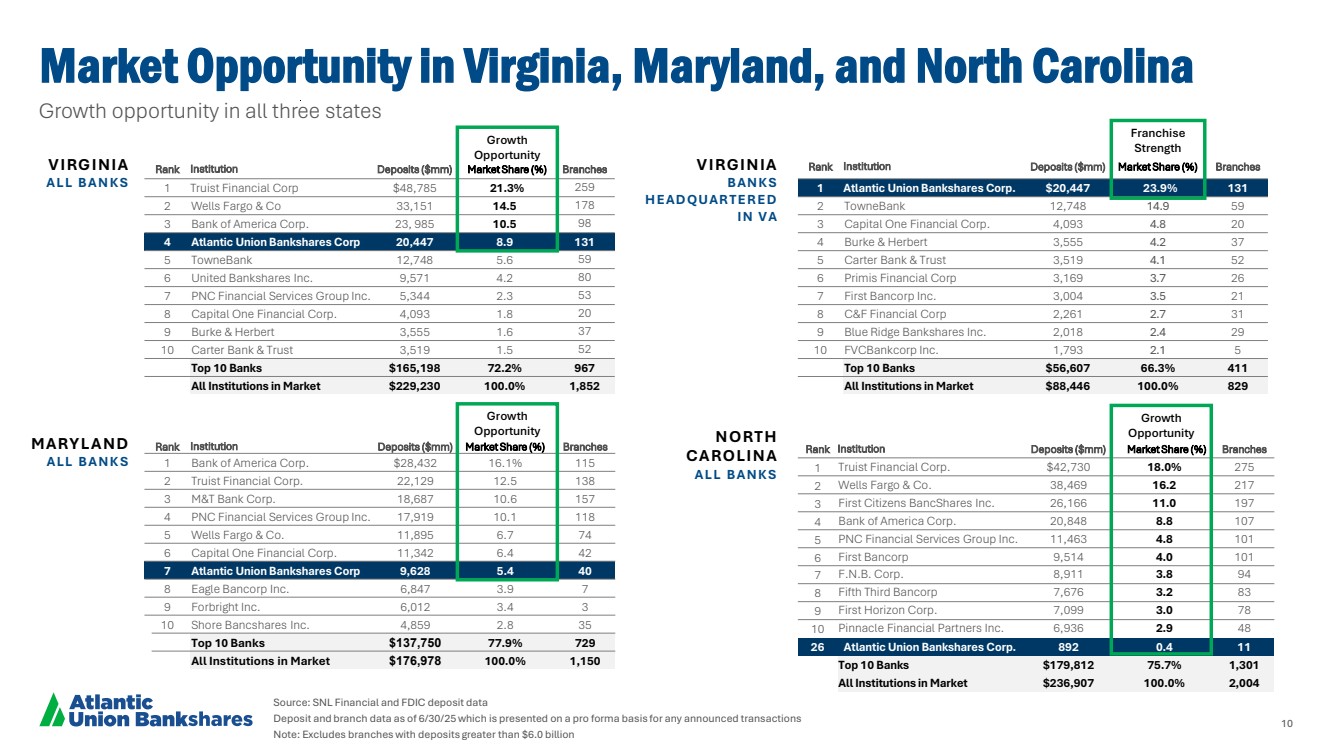
| 10 Growth opportunity in all three states Source: SNL Financial and FDIC deposit data Deposit and branch data as of 6/30/25 which is presented on a pro forma basis for any announced transactions Note: Excludes branches with deposits greater than $6.0 billion Market Opportunity in Virginia, Maryland, and North Carolina NORTH CAROLINA A LL B A N K S MARYL AND A LL B A N K S Rank Institution Deposits ($mm) Market Share (%) Branches 1 Truist Financial Corp. $42,730 18.0% 275 2 Wells Fargo & Co. 38,469 16.2 217 3 First Citizens BancShares Inc. 26,166 11.0 197 4 Bank of America Corp. 20,848 8.8 107 5 PNC Financial Services Group Inc. 11,463 4.8 101 6 First Bancorp 9,514 4.0 101 7 F.N.B. Corp. 8,911 3.8 94 8 Fifth Third Bancorp 7,676 3.2 83 9 First Horizon Corp. 7,099 3.0 78 10 Pinnacle Financial Partners Inc. 6,936 2.9 48 26 Atlantic Union Bankshares Corp. 892 0.4 11 Top 10 Banks $179,812 75.7% 1,301 All Institutions in Market $236,907 100.0% 2,004 Rank Institution Deposits ($mm) Market Share (%) Branches 1 Bank of America Corp. $28,432 16.1% 115 2 Truist Financial Corp. 22,129 12.5 138 3 M&T Bank Corp. 18,687 10.6 157 4 PNC Financial Services Group Inc. 17,919 10.1 118 5 Wells Fargo & Co. 11,895 6.7 74 6 Capital One Financial Corp. 11,342 6.4 42 7 Atlantic Union Bankshares Corp 9,628 5.4 40 8 Eagle Bancorp Inc. 6,847 3.9 7 9 Forbright Inc. 6,012 3.4 3 10 Shore Bancshares Inc. 4,859 2.8 35 Top 10 Banks $137,750 77.9% 729 All Institutions in Market $176,978 100.0% 1,150 Growth Opportunity Growth Opportunity Rank Institution Deposits ($mm) Market Share (%) Branches 1 Truist Financial Corp $48,785 21.3% 259 2 Wells Fargo & Co 33,151 14.5 178 3 Bank of America Corp. 23, 985 10.5 98 4 Atlantic Union Bankshares Corp 20,447 8.9 131 5 TowneBank 12,748 5.6 59 6 United Bankshares Inc. 9,571 4.2 80 7 PNC Financial Services Group Inc. 5,344 2.3 53 8 Capital One Financial Corp. 4,093 1.8 20 9 Burke & Herbert 3,555 1.6 37 10 Carter Bank & Trust 3,519 1.5 52 Top 10 Banks $165,198 72.2% 967 All Institutions in Market $229,230 100.0% 1,852 VIRGINIA A LL B A N K S VIRGINIA BANKS HEADQUART ERE D IN VA Rank Institution Deposits ($mm) Market Share (%) Branches 1 Atlantic Union Bankshares Corp. $20,447 23.9% 131 2 TowneBank 12,748 14.9 59 3 Capital One Financial Corp. 4,093 4.8 20 4 Burke & Herbert 3,555 4.2 37 5 Carter Bank & Trust 3,519 4.1 52 6 Primis Financial Corp 3,169 3.7 26 7 First Bancorp Inc. 3,004 3.5 21 8 C&F Financial Corp 2,261 2.7 31 9 Blue Ridge Bankshares Inc. 2,018 2.4 29 10 FVCBankcorp Inc. 1,793 2.1 5 Top 10 Banks $56,607 66.3% 411 All Institutions in Market $88,446 100.0% 829 Growth Opportunity Franchise Strength |
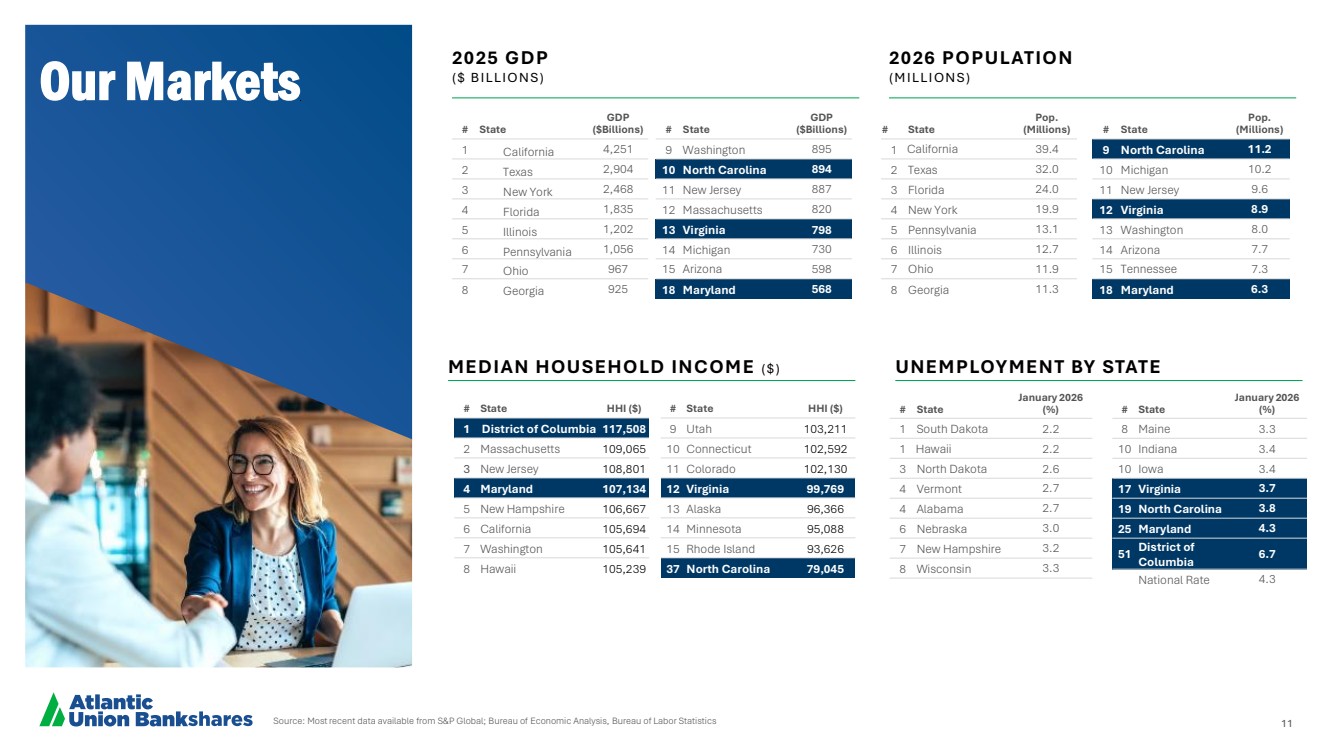
| Source: Most recent data available from S&P Global; Bureau of Economic Analysis, Bureau of Labor Statistics 11 Our Markets # State Pop. (Millions) 1 California 39.4 2 Texas 32.0 3 Florida 24.0 4 New York 19.9 5 Pennsylvania 13.1 6 Illinois 12.7 7 Ohio 11.9 8 Georgia 11.3 # State HHI ($) 1 District of Columbia 117,508 2 Massachusetts 109,065 3 New Jersey 108,801 4 Maryland 107,134 5 New Hampshire 106,667 6 California 105,694 7 Washington 105,641 8 Hawaii 105,239 # State GDP ($Billions) 1 California 4,251 2 Texas 2,904 3 New York 2,468 4 Florida 1,835 5 Illinois 1,202 6 Pennsylvania 1,056 7 Ohio 967 8 Georgia 925 # State Pop. (Millions) 9 North Carolina 11.2 10 Michigan 10.2 11 New Jersey 9.6 12 Virginia 8.9 13 Washington 8.0 14 Arizona 7.7 15 Tennessee 7.3 18 Maryland 6.3 # State HHI ($) 9 Utah 103,211 10 Connecticut 102,592 11 Colorado 102,130 12 Virginia 99,769 13 Alaska 96,366 14 Minnesota 95,088 15 Rhode Island 93,626 37 North Carolina 79,045 # State GDP ($Billions) 9 Washington 895 10 North Carolina 894 11 New Jersey 887 12 Massachusetts 820 13 Virginia 798 14 Michigan 730 15 Arizona 598 18 Maryland 568 MEDIAN HOUSEHOLD INCOME ($) 2026 POPULATION ( M I LLI O N S ) 2025 GDP ( $ B I LLI O N S ) UNEMPLOYMENT BY STATE # State January 2026 (%) 1 South Dakota 2.2 1 Hawaii 2.2 3 North Dakota 2.6 4 Vermont 2.7 4 Alabama 2.7 6 Nebraska 3.0 7 New Hampshire 3.2 8 Wisconsin 3.3 # State January 2026 (%) 8 Maine 3.3 10 Indiana 3.4 10 Iowa 3.4 17 Virginia 3.7 19 North Carolina 3.8 25 Maryland 4.3 51 District of Columbia 6.7 National Rate 4.3 |
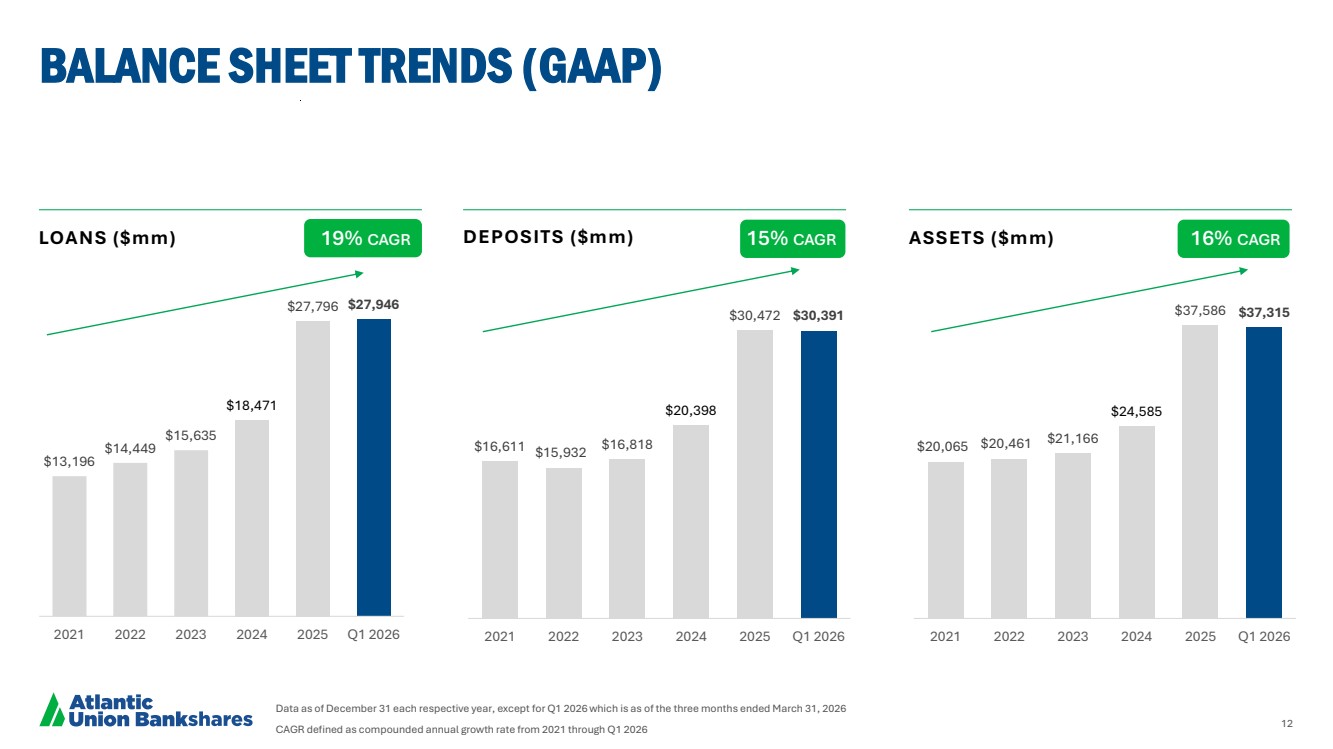
| 12 LOANS ($mm) $16,611 $15,932 $16,818 $20,398 $30,472 $30,391 2021 2022 2023 2024 2025 Q1 2026 Data as of December 31 each respective year, except for Q1 2026 which is as of the three months ended March 31, 2026 CAGR defined as compounded annual growth rate from 2021 through Q1 2026 BALANCE SHEET TRENDS (GAAP) $20,065 $20,461 $21,166 $24,585 $37,586 $37,315 2021 2022 2023 2024 2025 Q1 2026 $13,196 $14,449 $15,635 $18,471 $27,796 $27,946 2021 2022 2023 2024 2025 Q1 2026 19% CAGR DEPOSITS ($mm) 15% CAGR ASSETS ($mm) 16% CAGR |
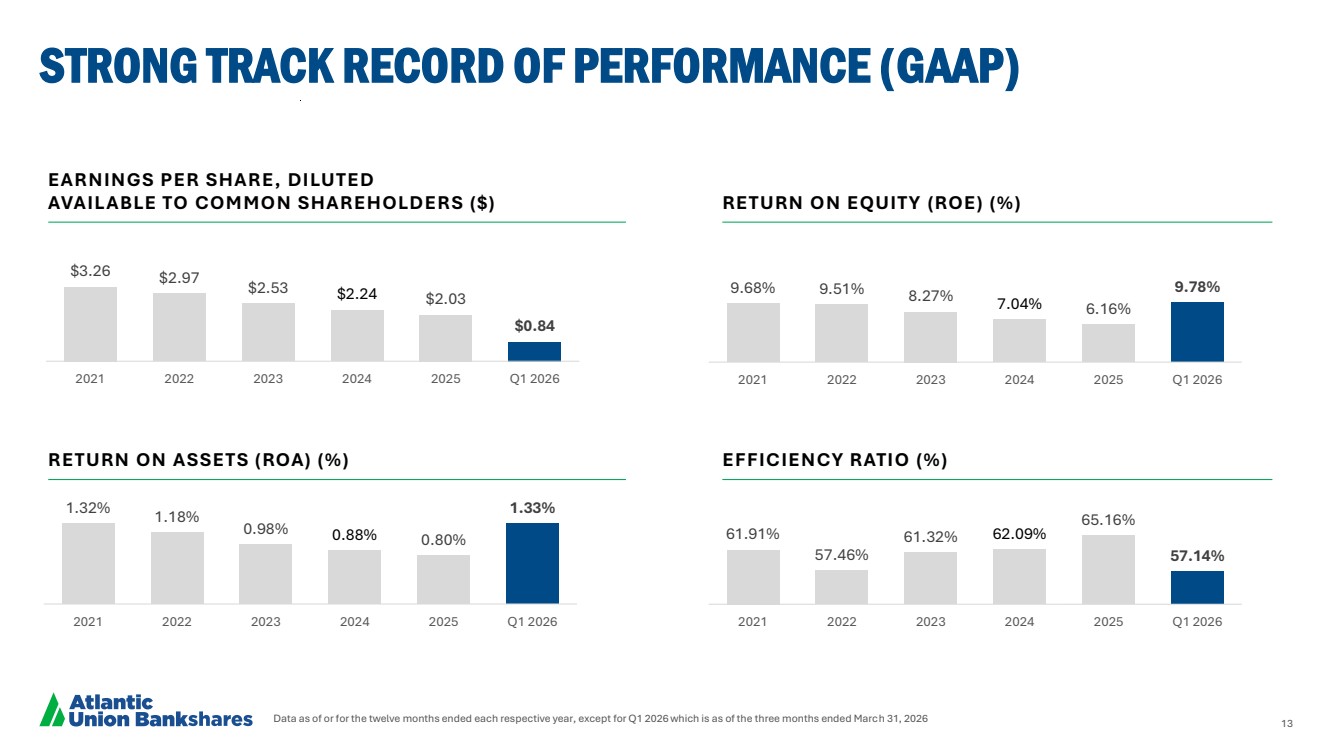
| 13 Data as of or for the twelve months ended each respective year, except for Q1 2026 which is as of the three months ended March 31, 2026 STRONG TRACK RECORD OF PERFORMANCE (GAAP) $3.26 $2.97 $2.53 $2.24 $2.03 $0.84 2021 2022 2023 2024 2025 Q1 2026 9.68% 9.51% 8.27% 7.04% 6.16% 9.78% 2021 2022 2023 2024 2025 Q1 2026 61.91% 57.46% 61.32% 62.09% 65.16% 57.14% 2021 2022 2023 2024 2025 Q1 2026 1.32% 1.18% 0.98% 0.88% 0.80% 1.33% 2021 2022 2023 2024 2025 Q1 2026 EARNINGS PER SHARE, DILUTED AVAILABLE TO COMMON SHAREHOLDERS ($) RETURN ON EQUITY (ROE) (%) RETURN ON ASSETS (ROA) (%) EFFICIENCY RATIO (%) |
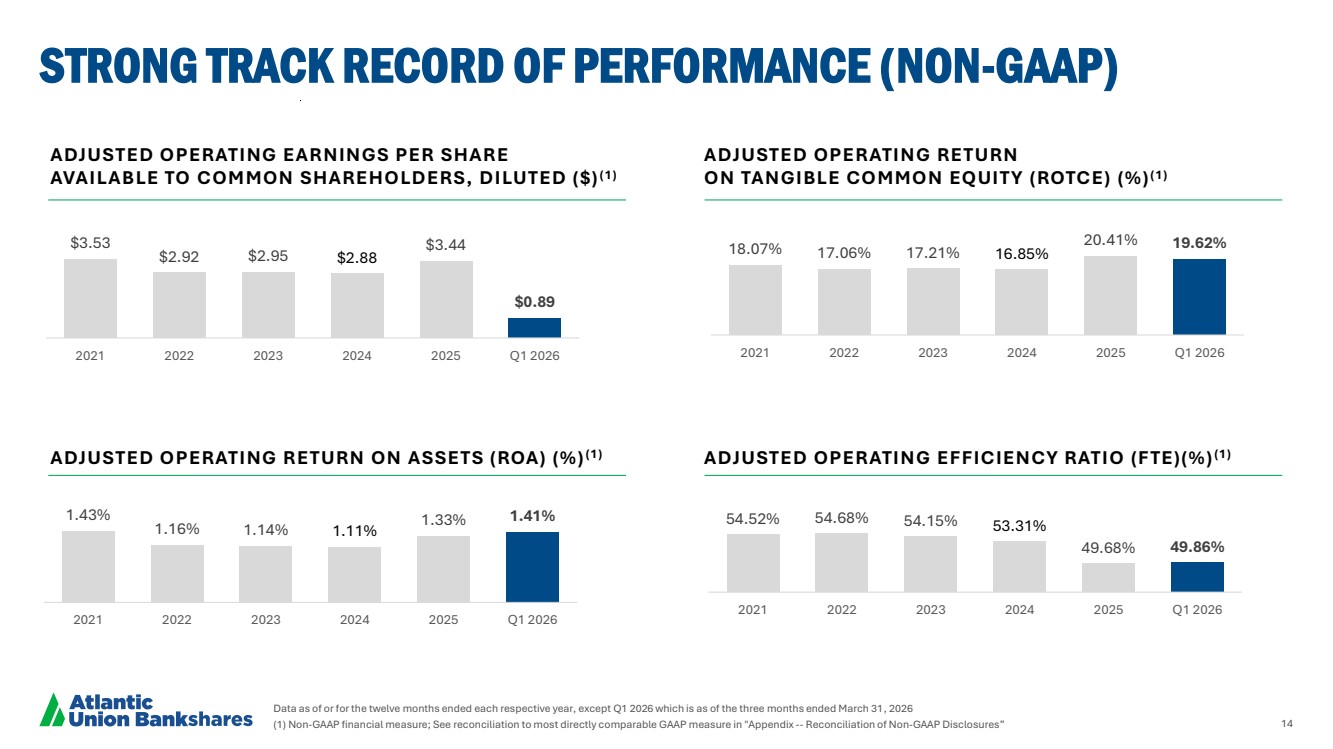
| 14 STRONG TRACK RECORD OF PERFORMANCE (NON-GAAP) Data as of or for the twelve months ended each respective year, except Q1 2026 which is as of the three months ended March 31, 2026 (1) Non-GAAP financial measure; See reconciliation to most directly comparable GAAP measure in "Appendix -- Reconciliation of Non-GAAP Disclosures” ADJUSTED OPERATING EARNINGS PER SHARE AVAILABLE TO COMMON SHAREHOLDERS, DILUTED ($)(1) ADJUSTED OPERATING RETURN ON TANGIBLE COMMON EQUITY (ROTCE) (%)(1) ADJUSTED OPERATING RETURN ON ASSETS (ROA) (%)(1) ADJUSTED OPERATING EFFICIENCY RATIO (FTE)(%)(1) $3.53 $2.92 $2.95 $2.88 $3.44 $0.89 2021 2022 2023 2024 2025 Q1 2026 18.07% 17.06% 17.21% 16.85% 20.41% 19.62% 2021 2022 2023 2024 2025 Q1 2026 54.52% 54.68% 54.15% 53.31% 49.68% 49.86% 2021 2022 2023 2024 2025 Q1 2026 1.43% 1.16% 1.14% 1.11% 1.33% 1.41% 2021 2022 2023 2024 2025 Q1 2026 |
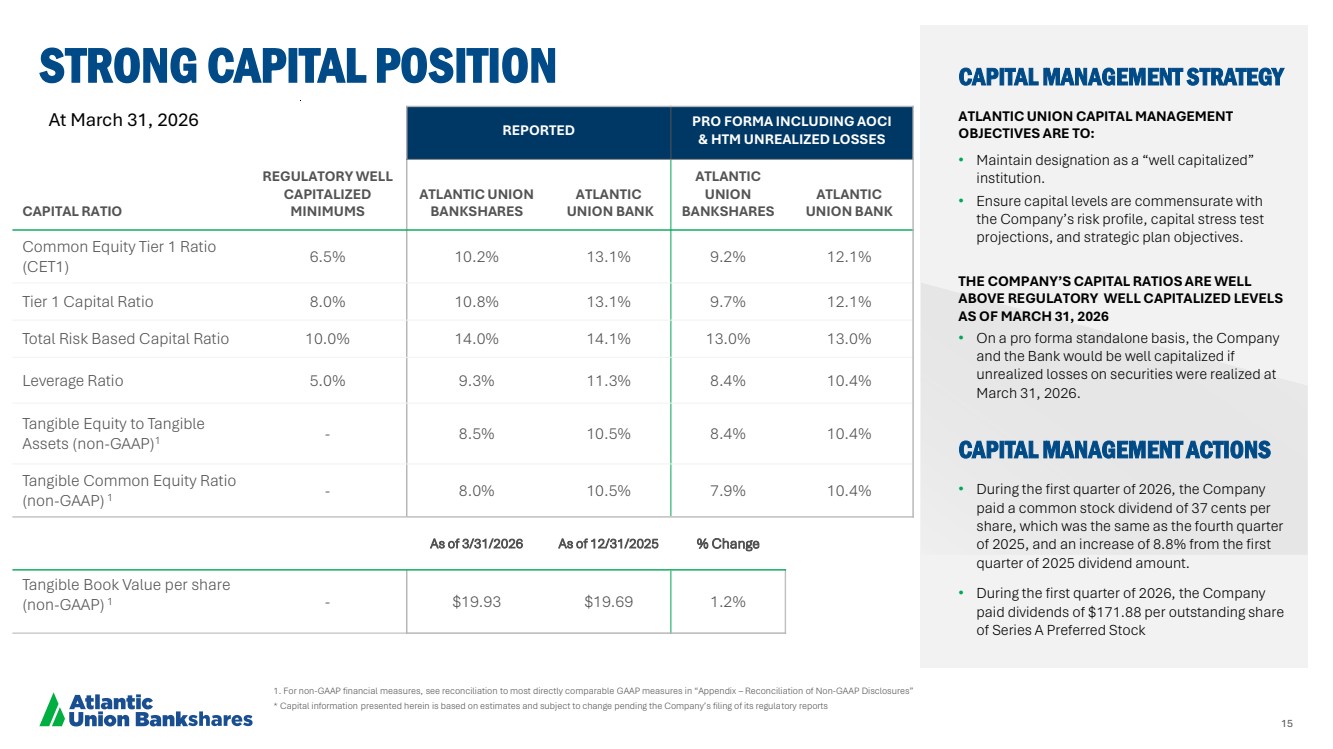
| 15 CAPITAL RATIO REGULATORY WELL CAPITALIZED MINIMUMS REPORTED PRO FORMA INCLUDING AOCI & HTM UNREALIZED LOSSES ATLANTIC UNION BANKSHARES ATLANTIC UNION BANK ATLANTIC UNION BANKSHARES ATLANTIC UNION BANK Common Equity Tier 1 Ratio (CET1) 6.5% 10.2% 13.1% 9.2% 12.1% Tier 1 Capital Ratio 8.0% 10.8% 13.1% 9.7% 12.1% Total Risk Based Capital Ratio 10.0% 14.0% 14.1% 13.0% 13.0% Leverage Ratio 5.0% 9.3% 11.3% 8.4% 10.4% Tangible Equity to Tangible Assets (non-GAAP)1 - 8.5% 10.5% 8.4% 10.4% Tangible Common Equity Ratio (non-GAAP) 1 - 8.0% 10.5% 7.9% 10.4% As of 3/31/2026 As of 12/31/2025 % Change Tangible Book Value per share (non-GAAP) 1 - $19.93 $19.69 1.2% 1. For non-GAAP financial measures, see reconciliation to most directly comparable GAAP measures in “Appendix – Reconciliation of Non-GAAP Disclosures” * Capital information presented herein is based on estimates and subject to change pending the Company’s filing of its regulatory reports STRONG CAPITAL POSITION CAPITAL MANAGEMENT STRATEGY ATLANTIC UNION CAPITAL MANAGEMENT OBJECTIVES ARE TO: • Maintain designation as a “well capitalized” institution. • Ensure capital levels are commensurate with the Company’s risk profile, capital stress test projections, and strategic plan objectives. THE COMPANY’S CAPITAL RATIOS ARE WELL ABOVE REGULATORY WELL CAPITALIZED LEVELS AS OF MARCH 31, 2026 • On a pro forma standalone basis, the Company and the Bank would be well capitalized if unrealized losses on securities were realized at March 31, 2026. CAPITAL MANAGEMENT ACTIONS • During the first quarter of 2026, the Company paid a common stock dividend of 37 cents per share, which was the same as the fourth quarter of 2025, and an increase of 8.8% from the first quarter of 2025 dividend amount. • During the first quarter of 2026, the Company paid dividends of $171.88 per outstanding share of Series A Preferred Stock At March 31, 2026 |
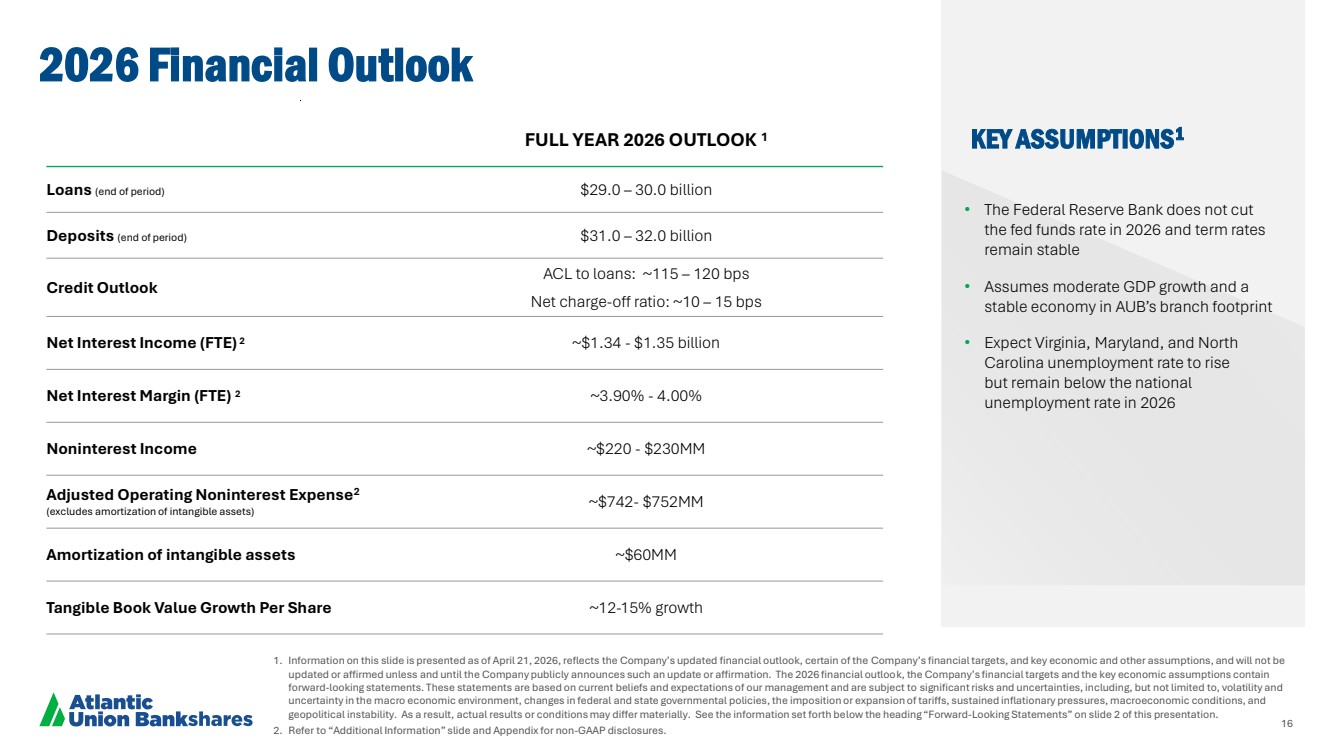
| 16 2026 Financial Outlook 1. Information on this slide is presented as of April 21, 2026, reflects the Company’s updated financial outlook, certain of the Company’s financial targets, and key economic and other assumptions, and will not be updated or affirmed unless and until the Company publicly announces such an update or affirmation. The 2026 financial outlook, the Company’s financial targets and the key economic assumptions contain forward-looking statements. These statements are based on current beliefs and expectations of our management and are subject to significant risks and uncertainties, including, but not limited to, volatility and uncertainty in the macro economic environment, changes in federal and state governmental policies, the imposition or expansion of tariffs, sustained inflationary pressures, macroeconomic conditions, and geopolitical instability. As a result, actual results or conditions may differ materially. See the information set forth below the heading “Forward-Looking Statements” on slide 2 of this presentation. 2. Refer to “Additional Information” slide and Appendix for non-GAAP disclosures. FULL YEAR 2026 OUTLOOK 1 Loans (end of period) $29.0 – 30.0 billion Deposits (end of period) $31.0 – 32.0 billion Credit Outlook ACL to loans: ~115 – 120 bps Net charge-off ratio: ~10 – 15 bps Net Interest Income (FTE) 2 ~$1.34 - $1.35 billion Net Interest Margin (FTE) 2 ~3.90% - 4.00% Noninterest Income ~$220 - $230MM Adjusted Operating Noninterest Expense2 (excludes amortization of intangible assets) ~$742- $752MM Amortization of intangible assets ~$60MM Tangible Book Value Growth Per Share ~12-15% growth • The Federal Reserve Bank does not cut the fed funds rate in 2026 and term rates remain stable • Assumes moderate GDP growth and a stable economy in AUB’s branch footprint • Expect Virginia, Maryland, and North Carolina unemployment rate to rise but remain below the national unemployment rate in 2026 KEY ASSUMPTIONS1 |
| Q1 2026 APPENDIX |

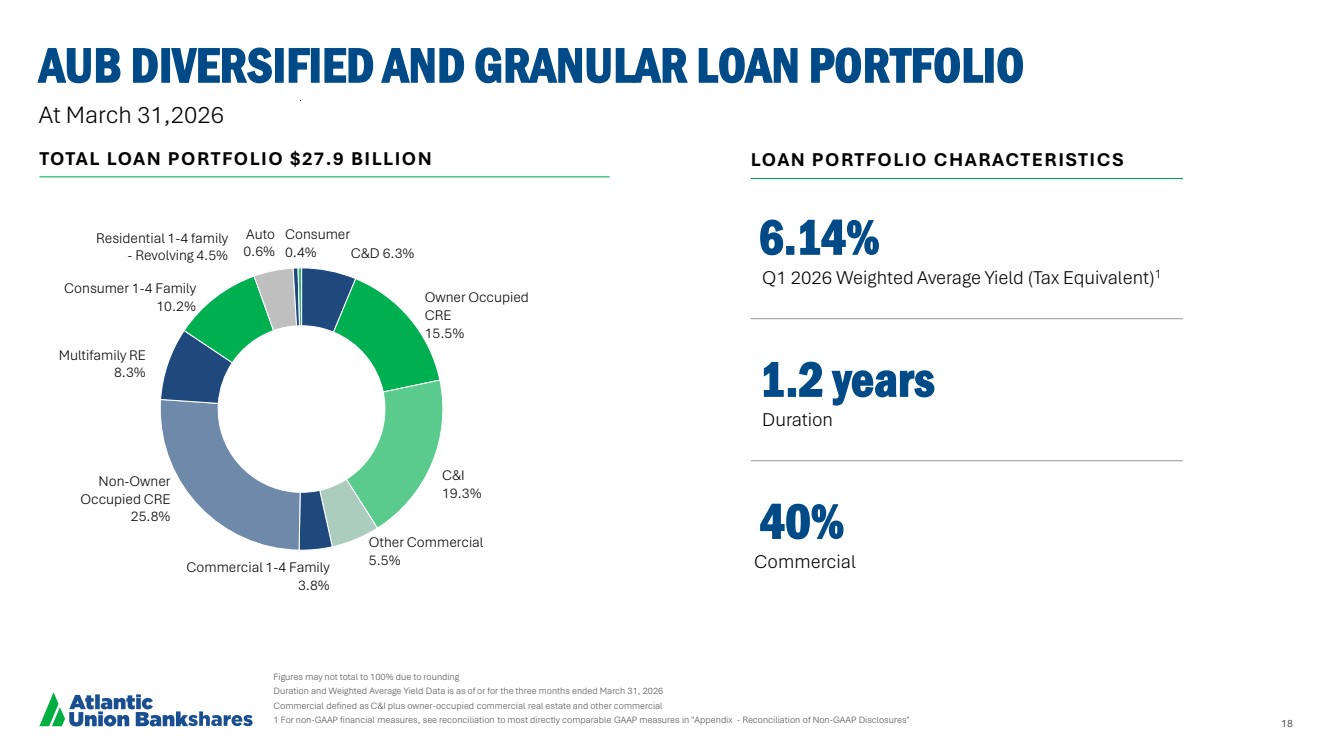
| 18 AUB DIVERSIFIED AND GRANULAR LOAN PORTFOLIO Figures may not total to 100% due to rounding Duration and Weighted Average Yield Data is as of or for the three months ended March 31, 2026 Commercial defined as C&I plus owner-occupied commercial real estate and other commercial 1 For non-GAAP financial measures, see reconciliation to most directly comparable GAAP measures in "Appendix - Reconciliation of Non-GAAP Disclosures" Duration Q2 2025 Weighted Average Yield (Tax Equivalent) C&D 6.3% Owner Occupied CRE 15.5% C&I 19.3% Other Commercial 5.5% Commercial 1-4 Family 3.8% Non-Owner Occupied CRE 25.8% Multifamily RE 8.3% Consumer 1-4 Family 10.2% Residential 1-4 family - Revolving 4.5% Auto 0.6% Consumer 0.4% TOTAL LOAN PORTFOLIO $27.9 BILLION Total Portfolio Characteristics At March 31,2026 LOAN PORTFOLIO CHARACTERISTICS 1.2 years Duration 40% Commercial 6.14% Q1 2026 Weighted Average Yield (Tax Equivalent)1 |
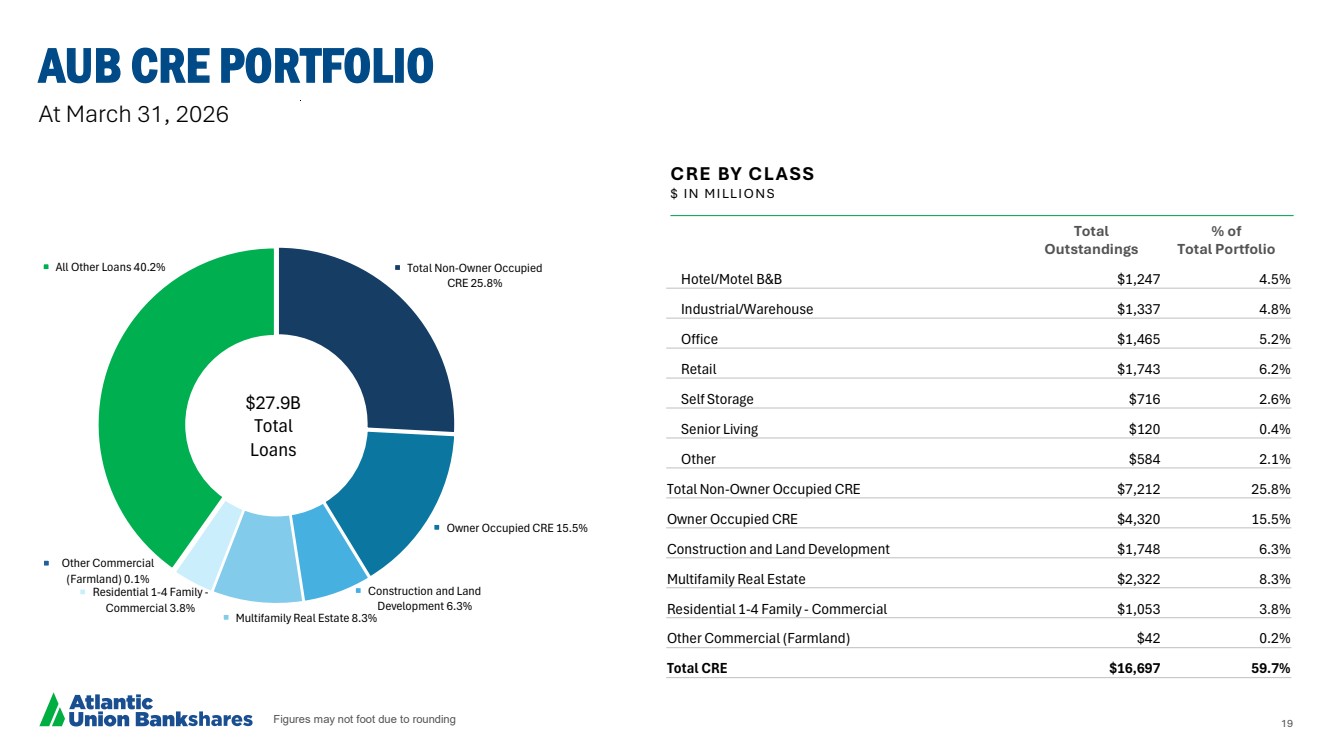
| 19 Total Non-Owner Occupied CRE 25.8% Owner Occupied CRE 15.5% Construction and Land Development 6.3% Multifamily Real Estate 8.3% Residential 1-4 Family - Commercial 3.8% Other Commercial (Farmland) 0.1% All Other Loans 40.2% Figures may not foot due to rounding AUB CRE PORTFOLIO At March 31, 2026 CRE BY CLASS $ I N M I LLI O N S Total Outstandings % of Total Portfolio Hotel/Motel B&B $1,247 4.5% Industrial/Warehouse $1,337 4.8% Office $1,465 5.2% Retail $1,743 6.2% Self Storage $716 2.6% Senior Living $120 0.4% Other $584 2.1% Total Non-Owner Occupied CRE $7,212 25.8% Owner Occupied CRE $4,320 15.5% Construction and Land Development $1,748 6.3% Multifamily Real Estate $2,322 8.3% Residential 1-4 Family - Commercial $1,053 3.8% Other Commercial (Farmland) $42 0.2% Total CRE $16,697 59.7% $27.9B Total Loans |
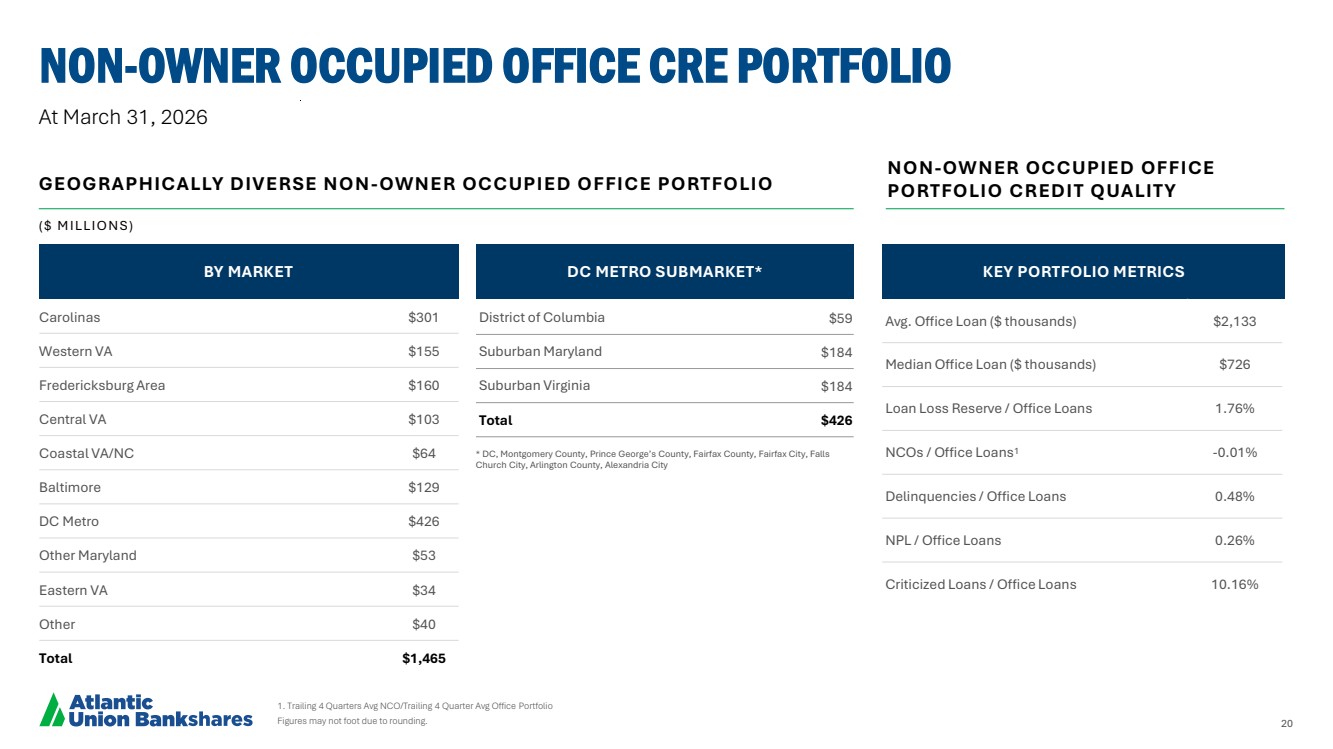
| 20 At March 31, 2026 1. Trailing 4 Quarters Avg NCO/Trailing 4 Quarter Avg Office Portfolio Figures may not foot due to rounding. NON-OWNER OCCUPIED OFFICE CRE PORTFOLIO NON-OWNER OCCUPIED OFFICE GEOGRAPHICALLY DIVERSE NON PORTFOLIO CREDIT QUALITY -OWNER OCCUPIED OFFICE PORTFOLIO * DC, Montgomery County, Prince George’s County, Fairfax County, Fairfax City, Falls Church City, Arlington County, Alexandria City ( $ M I LLI O N S ) Carolinas $301 Western VA $155 Fredericksburg Area $160 Central VA $103 Coastal VA/NC $64 Baltimore $129 DC Metro $426 Other Maryland $53 Eastern VA $34 Other $40 Total $1,465 BY MARKET DC METRO SUBMARKET* KEY PORTFOLIO METRICS Avg. Office Loan ($ thousands) $2,133 Median Office Loan ($ thousands) $726 Loan Loss Reserve / Office Loans 1.76% NCOs / Office Loans1 -0.01% Delinquencies / Office Loans 0.48% NPL / Office Loans 0.26% Criticized Loans / Office Loans 10.16% District of Columbia $59 Suburban Maryland $184 Suburban Virginia $184 Total $426 |
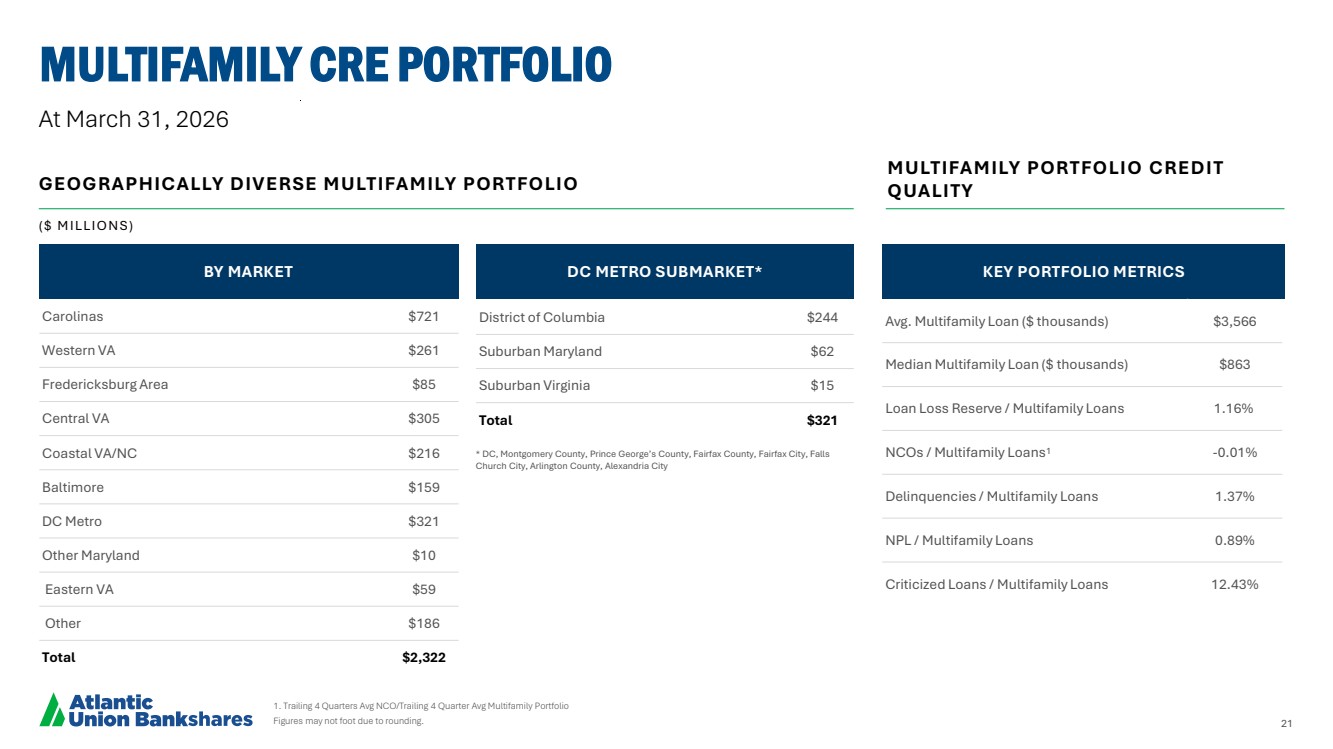
| 21 MULTIFAMILY CRE PORTFOLIO 1. Trailing 4 Quarters Avg NCO/Trailing 4 Quarter Avg Multifamily Portfolio Figures may not foot due to rounding. Carolinas $721 Western VA $261 Fredericksburg Area $85 Central VA $305 Coastal VA/NC $216 Baltimore $159 DC Metro $321 Other Maryland $10 Eastern VA $59 Other $186 Total $2,322 At March 31, 2026 * DC, Montgomery County, Prince George’s County, Fairfax County, Fairfax City, Falls Church City, Arlington County, Alexandria City BY MARKET MULTIFAMILY PORTFOLIO CREDIT GEOGRAPHICALLY DIVERSE MULTIFAMILY PORTFOLIO QUALITY DC METRO SUBMARKET* KEY PORTFOLIO METRICS ( $ M I LLI O N S ) Avg. Multifamily Loan ($ thousands) $3,566 Median Multifamily Loan ($ thousands) $863 Loan Loss Reserve / Multifamily Loans 1.16% NCOs / Multifamily Loans1 -0.01% Delinquencies / Multifamily Loans 1.37% NPL / Multifamily Loans 0.89% Criticized Loans / Multifamily Loans 12.43% District of Columbia $244 Suburban Maryland $62 Suburban Virginia $15 Total $321 |
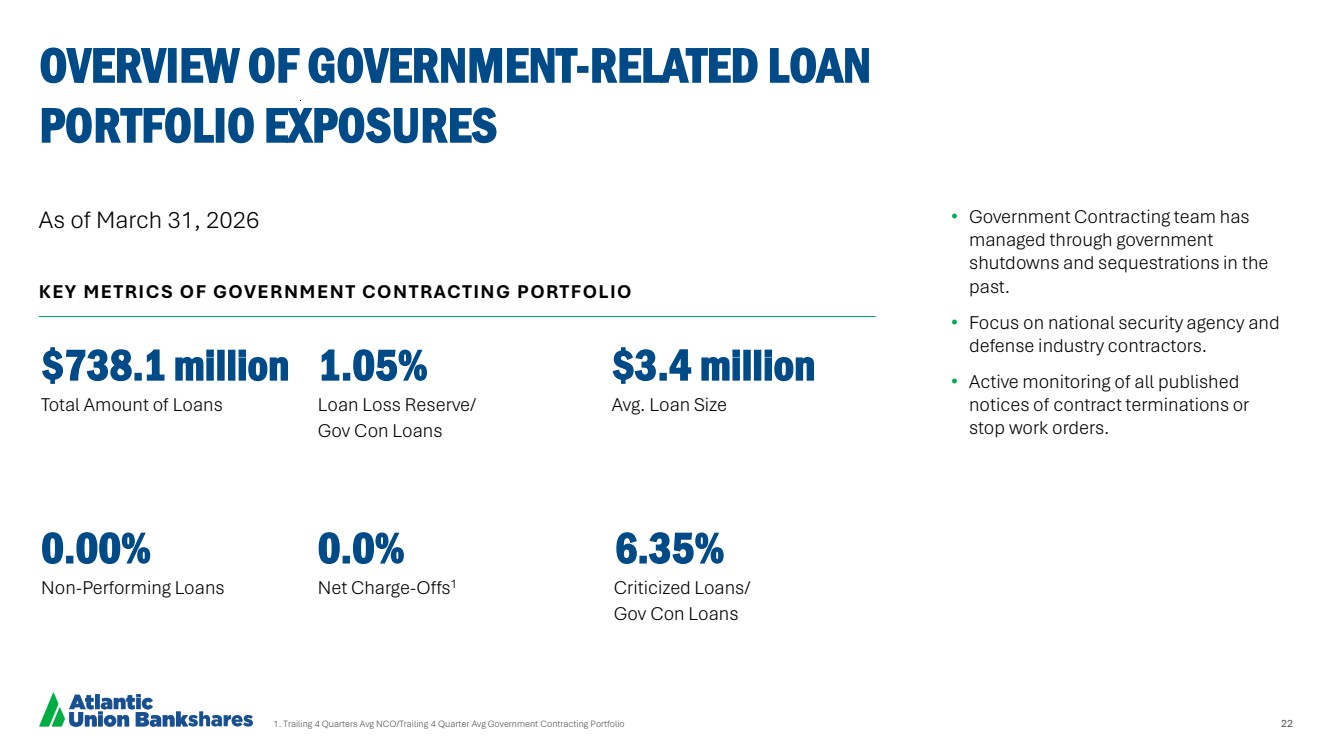
| 22 $738.1 million 1.05% $3.4 million Total Amount of Loans Loan Loss Reserve/ Gov Con Loans Avg. Loan Size 0.00% 0.0% 6.35% Non-Performing Loans Net Charge-Offs1 Criticized Loans/ Gov Con Loans 1. Trailing 4 Quarters Avg NCO/Trailing 4 Quarter Avg Government Contracting Portfolio OVERVIEW OF GOVERNMENT-RELATED LOAN PORTFOLIO EXPOSURES • Government Contracting team has managed through government shutdowns and sequestrations in the past. • Focus on national security agency and defense industry contractors. • Active monitoring of all published notices of contract terminations or stop work orders. KEY METRICS OF GOVERNMENT CONTRACTING PORTFOLIO As of March 31, 2026 |
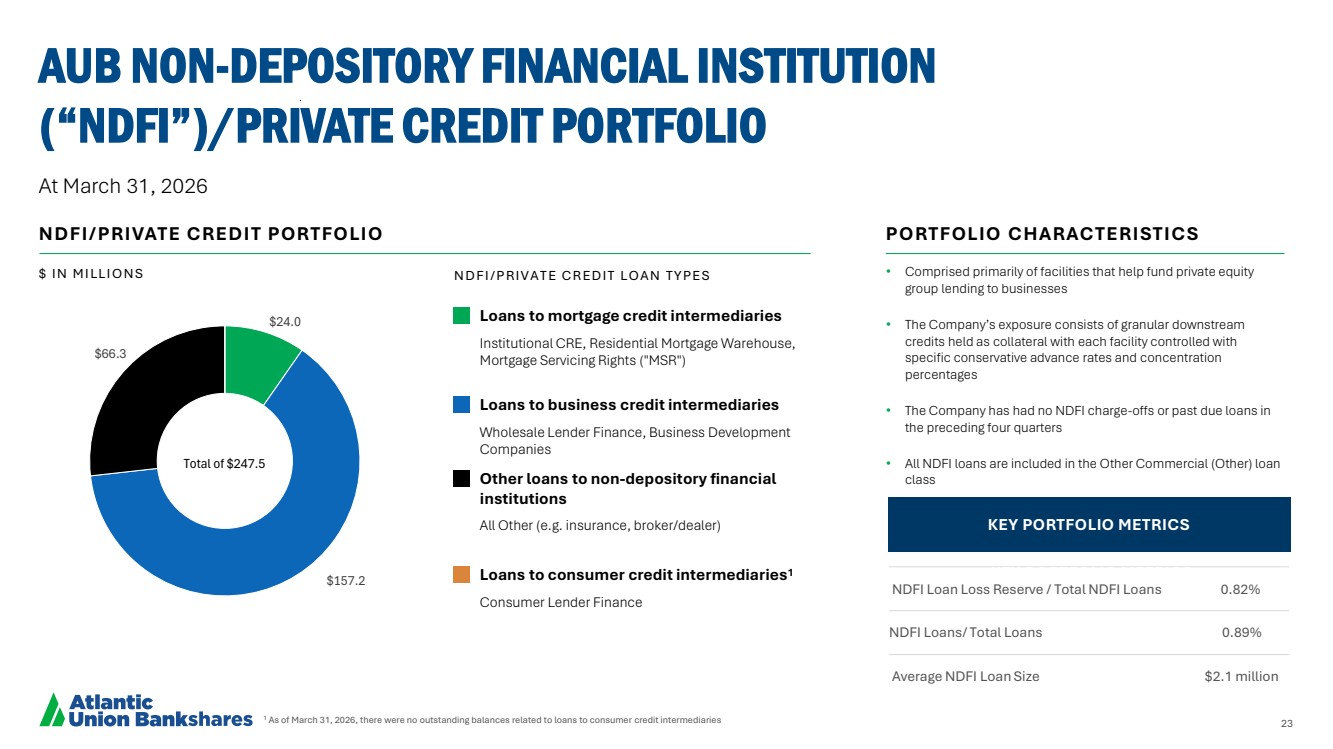
| 23 • Comprised primarily of facilities that help fund private equity group lending to businesses • The Company’s exposure consists of granular downstream credits held as collateral with each facility controlled with specific conservative advance rates and concentration percentages • The Company has had no NDFI charge-offs or past due loans in the preceding four quarters • All NDFI loans are included in the Other Commercial (Other) loan class 1 As of March 31, 2026, there were no outstanding balances related to loans to consumer credit intermediaries AUB NON-DEPOSITORY FINANCIAL INSTITUTION (“NDFI”)/PRIVATE CREDIT PORTFOLIO At March 31, 2026 $24.0 $157.2 $66.3 NDFI/PRIVATE CREDIT PORTFOLIO PORTFOLIO CHARACTERISTICS $ I N M I LLI O N S Loans to mortgage credit intermediaries Institutional CRE, Residential Mortgage Warehouse, Mortgage Servicing Rights ("MSR") Loans to business credit intermediaries Wholesale Lender Finance, Business Development Companies Other loans to non-depository financial institutions All Other (e.g. insurance, broker/dealer) Loans to consumer credit intermediaries1 Consumer Lender Finance N D F I / P R I V A T E C R E D I T LO A N T Y P E S Total of $247.5 NDFI Loan Loss Reserve / Total NDFI Loans 0.82% NDFI Loans/ Total Loans 0.89% Average NDFI Loan Size $2.1 million KEY PORTFOLIO METRICS KEY PORTFOLIO METRICS |
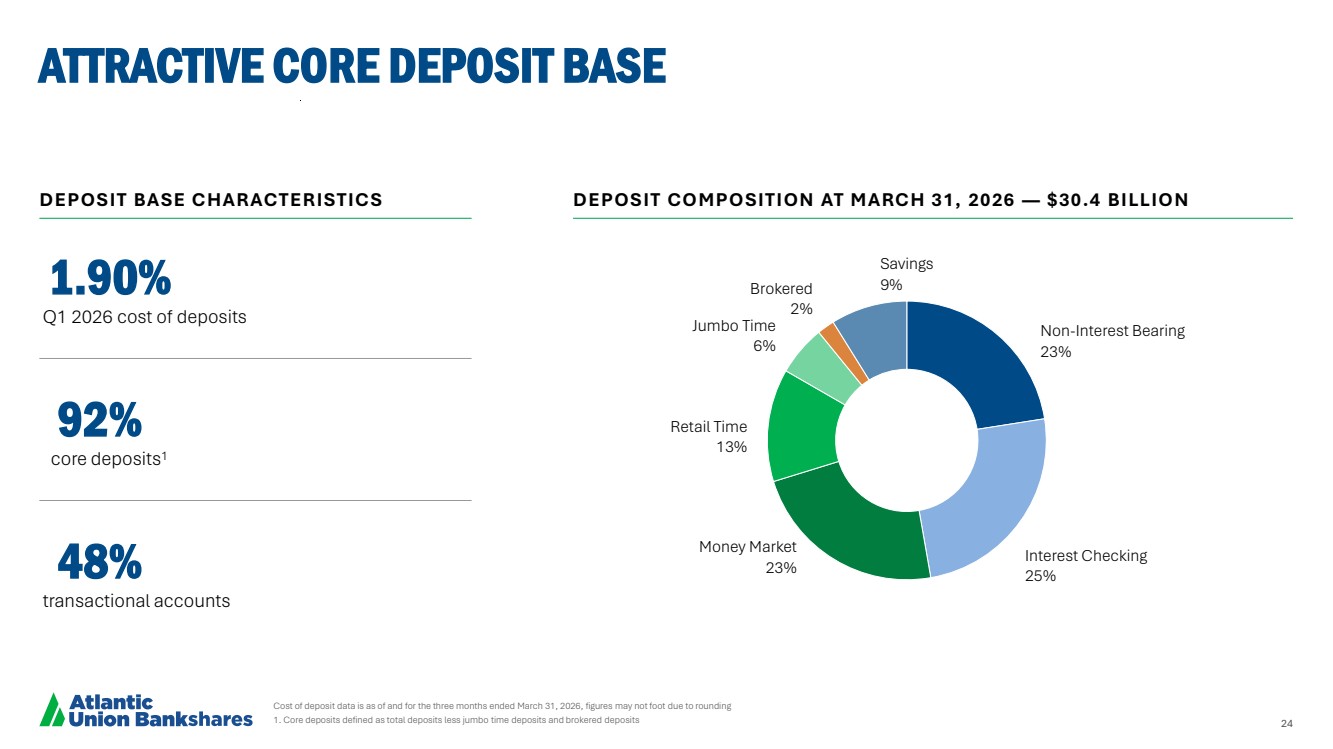
| 24 ATTRACTIVE CORE DEPOSIT BASE Cost of deposit data is as of and for the three months ended March 31, 2026, figures may not foot due to rounding 1. Core deposits defined as total deposits less jumbo time deposits and brokered deposits Non-Interest Bearing 23% Interest Checking 25% Money Market 23% Retail Time 13% Jumbo Time 6% Brokered 2% Savings 9% DEPOSIT BASE CHARACTERISTICS DEPOSIT COMPOSITION AT MARCH 31, 2026 — $30.4 BILLION 92% core deposits1 48% transactional accounts 1.90% Q1 2026 cost of deposits |
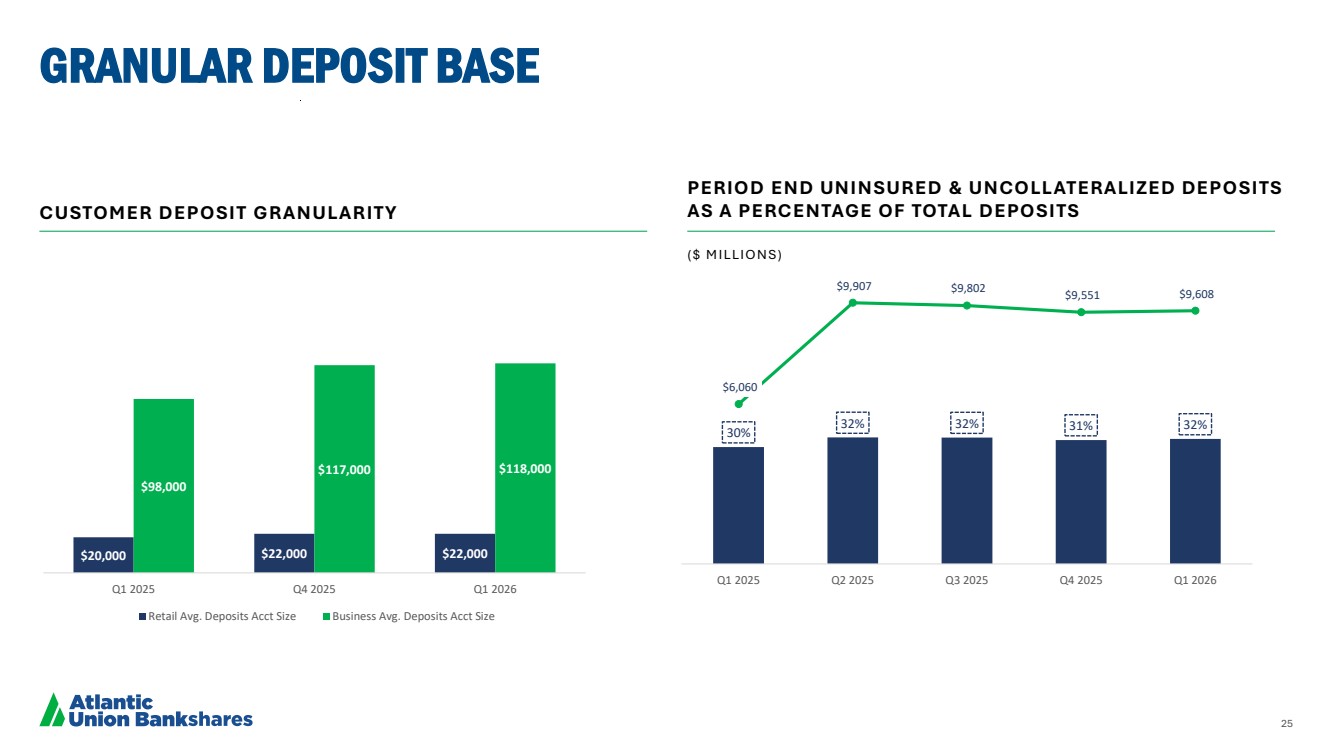
| 25 GRANULAR DEPOSIT BASE CUSTOMER DEPOSIT GRANULARITY PERIOD END UNINSURED & UNCOLLATERALIZED DEPOSITS AS A PERCENTAGE OF TOTAL DEPOSITS ( $ M I LLI O N S ) $20,000 $22,000 $22,000 $98,000 $117,000 $118,000 Q1 2025 Q4 2025 Q1 2026 Retail Avg. Deposits Acct Size Business Avg. Deposits Acct Size 30% 32% 32% 31% 32% $6,060 $9,907 $9,802 $9,551 $9,608 Q1 2025 Q2 2025 Q3 2025 Q4 2025 Q1 2026 |
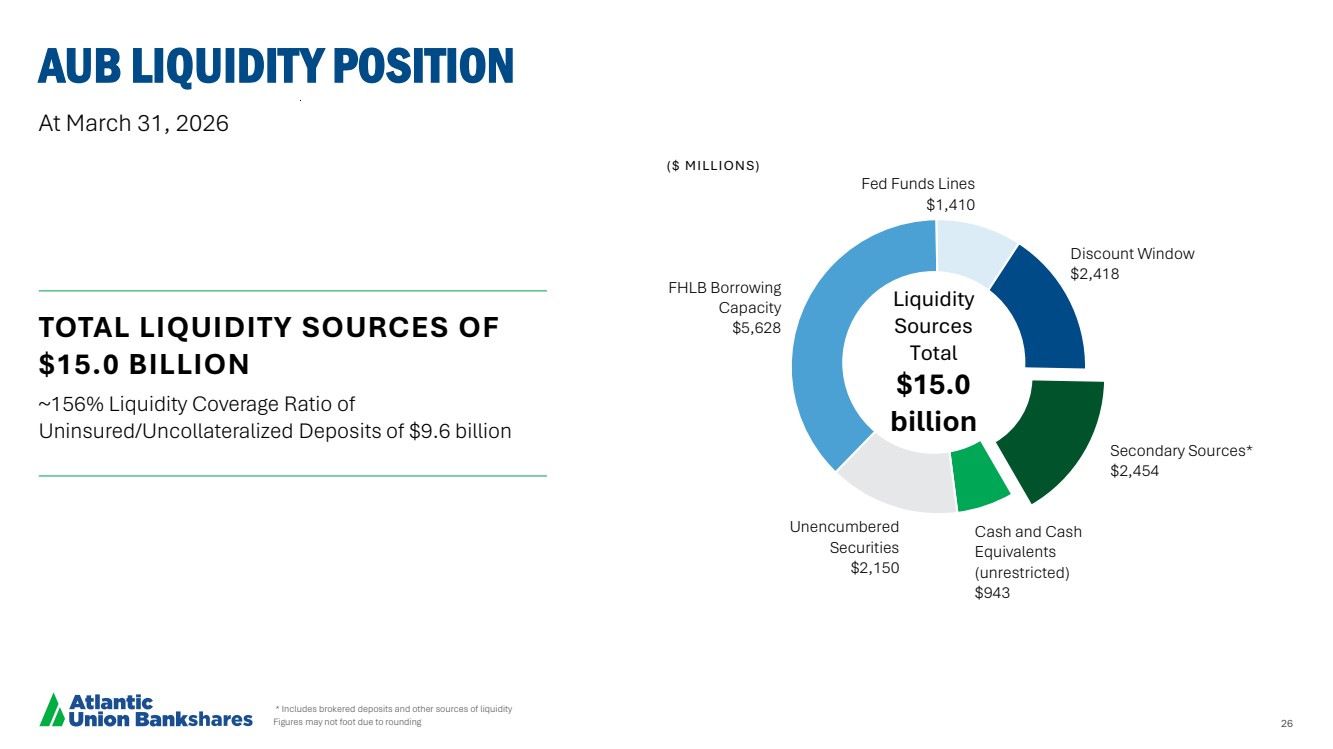
| 26 Cash and Cash Equivalents (unrestricted) $943 Unencumbered Securities $2,150 FHLB Borrowing Capacity $5,628 Fed Funds Lines $1,410 Discount Window $2,418 Secondary Sources* $2,454 AUB LIQUIDITY POSITION * Includes brokered deposits and other sources of liquidity Figures may not foot due to rounding Liquidity Sources Total $15.0 billion At March 31, 2026 TOTAL LIQUIDITY SOURCES OF $15.0 BILLION ~156% Liquidity Coverage Ratio of Uninsured/Uncollateralized Deposits of $9.6 billion ($ MILLIONS) |
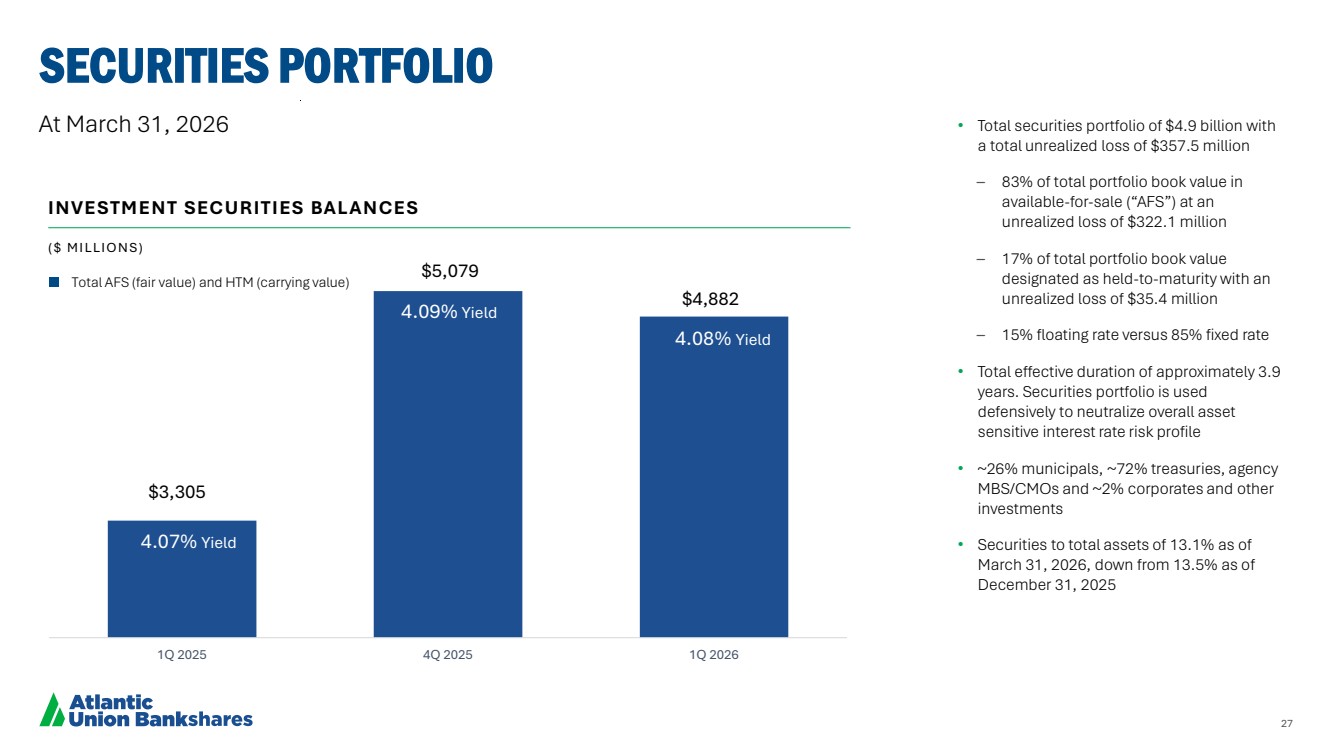
| 27 SECURITIES PORTFOLIO • Total securities portfolio of $4.9 billion with a total unrealized loss of $357.5 million – 83% of total portfolio book value in available-for-sale (“AFS”) at an unrealized loss of $322.1 million – 17% of total portfolio book value designated as held-to-maturity with an unrealized loss of $35.4 million – 15% floating rate versus 85% fixed rate • Total effective duration of approximately 3.9 years. Securities portfolio is used defensively to neutralize overall asset sensitive interest rate risk profile • ~26% municipals, ~72% treasuries, agency MBS/CMOs and ~2% corporates and other investments • Securities to total assets of 13.1% as of March 31, 2026, down from 13.5% as of December 31, 2025 $3,305 $5,079 $4,882 1Q 2025 4Q 2025 1Q 2026 4.07% Yield 4.09% Yield 4.08% Yield INVESTMENT SECURITIES BALANCES Total AFS (fair value) and HTM (carrying value) At March 31, 2026 ( $ M I LLI O N S ) |
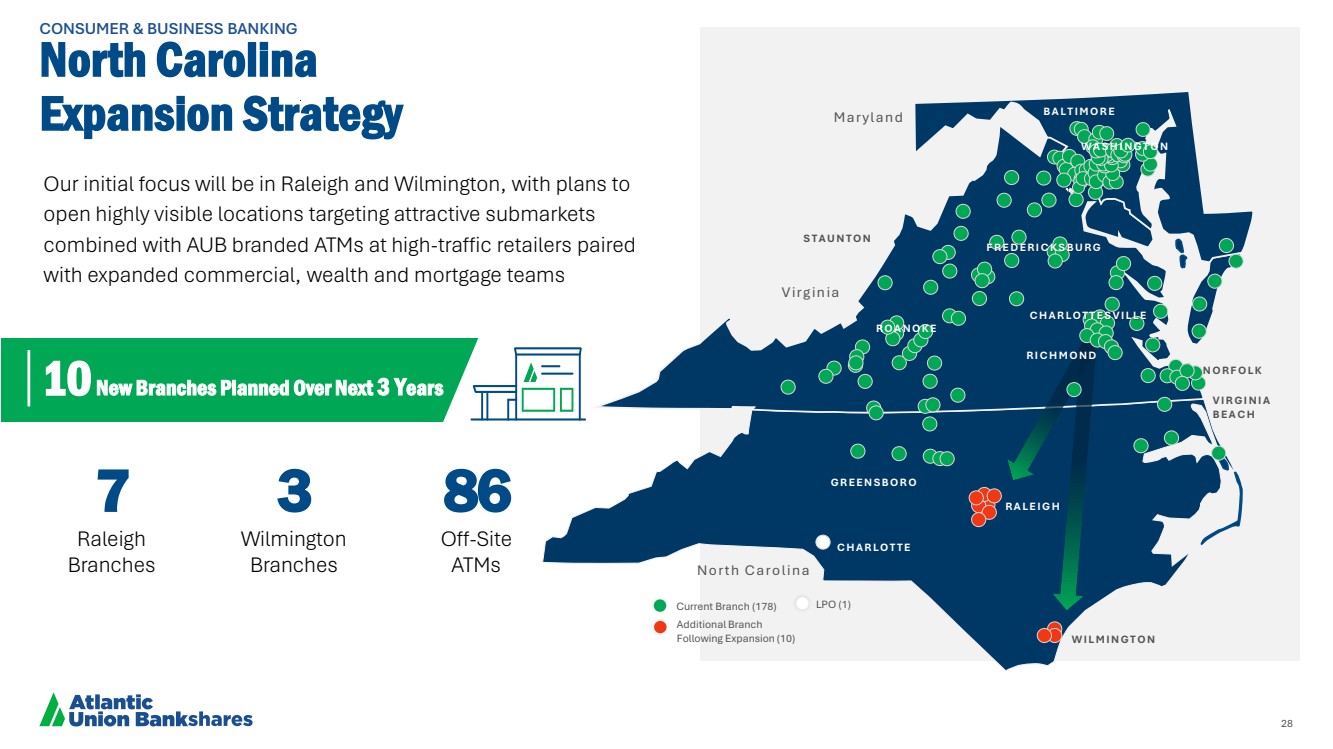
| 28 10 New Branches Planned Over Next 3 Years Our initial focus will be in Raleigh and Wilmington, with plans to open highly visible locations targeting attractive submarkets combined with AUB branded ATMs at high-traffic retailers paired with expanded commercial, wealth and mortgage teams North Carolina Expansion Strategy 7 Raleigh Branches 3 Wilmington Branches 86 Off-Site ATMs N O R F O L K V I R G I N I A B E A C H M a ry l a n d V irg in ia No rth C a ro l in a C H A R L O T T E W I L M I N G T O N B A L T I M O R E R A L E I G H G R E E N S B O R O R O A N O K E S T A U N T O N C H A R L O T T E S V I L L E R I C H M O N D F R E D E R I C K S B U R G Current Branch (178) LPO (1) Additional Branch Following Expansion (10) CONSUMER & BUSINESS BANKING W A S H I N G T O N |
| 29 RECONCILIATION OF NON-GAAP DISCLOSURES We have provided supplemental performance measures determined by methods other than in accordance with GAAP. These non-GAAP financial measures are a supplement to GAAP, which we use to prepare our financial statements, and should not be considered in isolation or as a substitute for comparable measures calculated in accordance with GAAP. In addition, our non-GAAP financial measures may not be comparable to non-GAAP financial measures of other companies. We use the non-GAAP financial measures discussed herein in our analysis of our performance. Management believes that these non-GAAP financial measures provide additional understanding of ongoing operations, enhance comparability of results of operations with prior periods and show the effects of significant gains and charges in the periods presented without the impact of items or events that may obscure trends in our underlying performance or show the potential effects of accumulated other comprehensive income or unrealized losses on held to maturity securities on our capital. Due to the impact of completing the Sandy Spring acquisition in the second quarter of 2025 and the acquisition of American National Bankshares in the second quarter of 2024, we updated our non-GAAP operating measures beginning in the second quarter of 2025 to exclude the CECL Day 1 non-PCD loans and RUC provision expense. The CECL Day 1 non-PCD loans and RUC provision expense is comprised of the initial provision expense on non-PCD loans, which represents the CECL “double count” of the non-PCD credit mark, and the additional provision for unfunded commitments. The Company does not view the CECL Day 1 non-PCD loans and RUC provision expense as organic costs to run the Company’s business and believes this updated presentation provides investors with additional information to assist in period-to-period and company-to-company comparisons of operating performance, which will aid investors in analyzing the Company’s performance. Prior period non-GAAP operating measures presented in this presentation have been recast to conform to this updated presentation. |
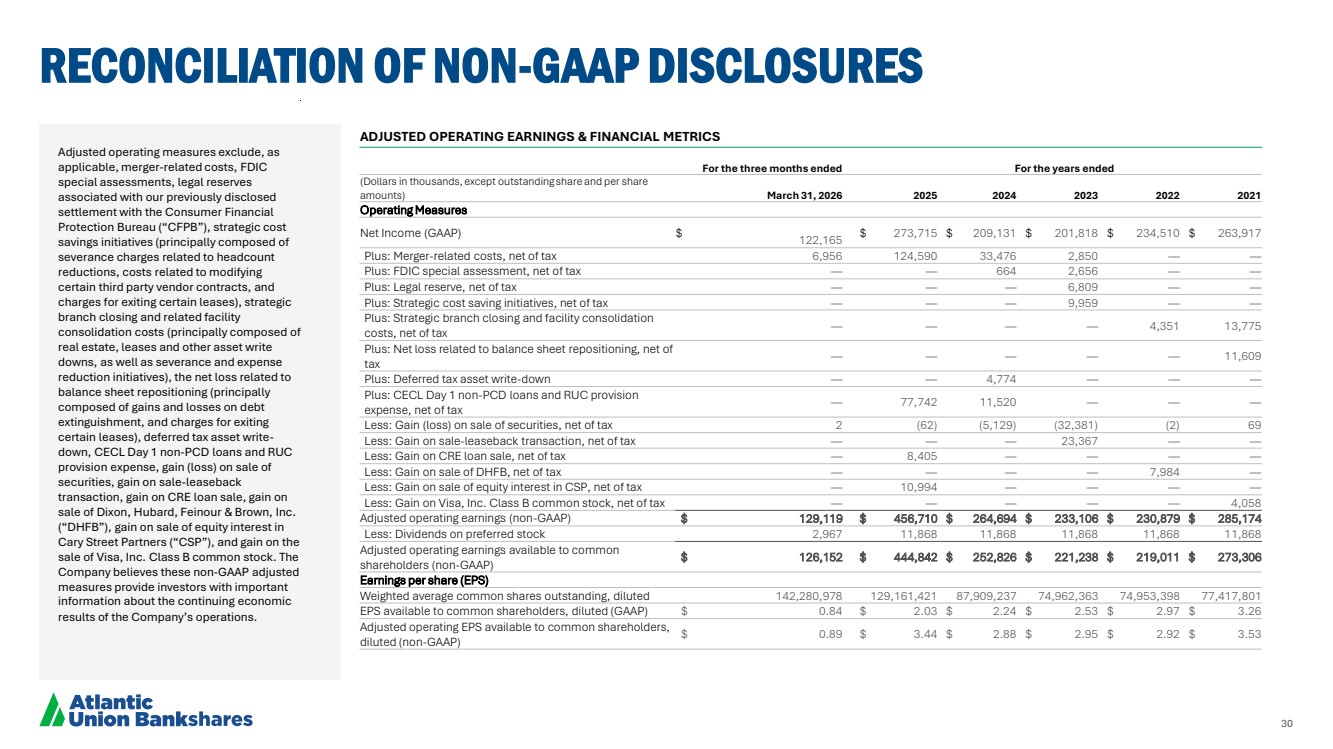
| 30 RECONCILIATION OF NON-GAAP DISCLOSURES Adjusted operating measures exclude, as applicable, merger-related costs, FDIC special assessments, legal reserves associated with our previously disclosed settlement with the Consumer Financial Protection Bureau (“CFPB”), strategic cost savings initiatives (principally composed of severance charges related to headcount reductions, costs related to modifying certain third party vendor contracts, and charges for exiting certain leases), strategic branch closing and related facility consolidation costs (principally composed of real estate, leases and other asset write downs, as well as severance and expense reduction initiatives), the net loss related to balance sheet repositioning (principally composed of gains and losses on debt extinguishment, and charges for exiting certain leases), deferred tax asset write-down, CECL Day 1 non-PCD loans and RUC provision expense, gain (loss) on sale of securities, gain on sale-leaseback transaction, gain on CRE loan sale, gain on sale of Dixon, Hubard, Feinour & Brown, Inc. (“DHFB”), gain on sale of equity interest in Cary Street Partners (“CSP”), and gain on the sale of Visa, Inc. Class B common stock. The Company believes these non-GAAP adjusted measures provide investors with important information about the continuing economic results of the Company’s operations. ADJUSTED OPERATING EARNINGS & FINANCIAL METRICS For the three months ended For the years ended (Dollars in thousands, except outstanding share and per share amounts) March 31, 2026 2025 2024 2023 2022 2021 Operating Measures Net Income (GAAP) $ 122,165 $ 273,715 $ 209,131 $ 201,818 $ 234,510 $ 263,917 Plus: Merger-related costs, net of tax 6,956 124,590 33,476 2,850 — — Plus: FDIC special assessment, net of tax — — 664 2,656 — — Plus: Legal reserve, net of tax — — — 6,809 — — Plus: Strategic cost saving initiatives, net of tax — — — 9,959 — — Plus: Strategic branch closing and facility consolidation costs, net of tax — — — — 4,351 13,775 Plus: Net loss related to balance sheet repositioning, net of tax — — — — — 11,609 Plus: Deferred tax asset write-down — — 4,774 — — — Plus: CECL Day 1 non-PCD loans and RUC provision expense, net of tax — 77,742 11,520 — — — Less: Gain (loss) on sale of securities, net of tax 2 (62) (5,129) (32,381) (2) 69 Less: Gain on sale-leaseback transaction, net of tax — — — 23,367 — — Less: Gain on CRE loan sale, net of tax — 8,405 — — — — Less: Gain on sale of DHFB, net of tax — — — — 7,984 — Less: Gain on sale of equity interest in CSP, net of tax — 10,994 — — — — Less: Gain on Visa, Inc. Class B common stock, net of tax — — — — — 4,058 Adjusted operating earnings (non-GAAP) $ 129,119 $ 456,710 $ 264,694 $ 233,106 $ 230,879 $ 285,174 Less: Dividends on preferred stock 2,967 11,868 11,868 11,868 11,868 11,868 Adjusted operating earnings available to common shareholders (non-GAAP) $ 126,152 $ 444,842 $ 252,826 $ 221,238 $ 219,011 $ 273,306 Earnings per share (EPS) Weighted average common shares outstanding, diluted 142,280,978 129,161,421 87,909,237 74,962,363 74,953,398 77,417,801 EPS available to common shareholders, diluted (GAAP) $ 0.84 $ 2.03 $ 2.24 $ 2.53 $ 2.97 $ 3.26 Adjusted operating EPS available to common shareholders, diluted (non-GAAP) $ 0.89 $ 3.44 $ 2.88 $ 2.95 $ 2.92 $ 3.53 |
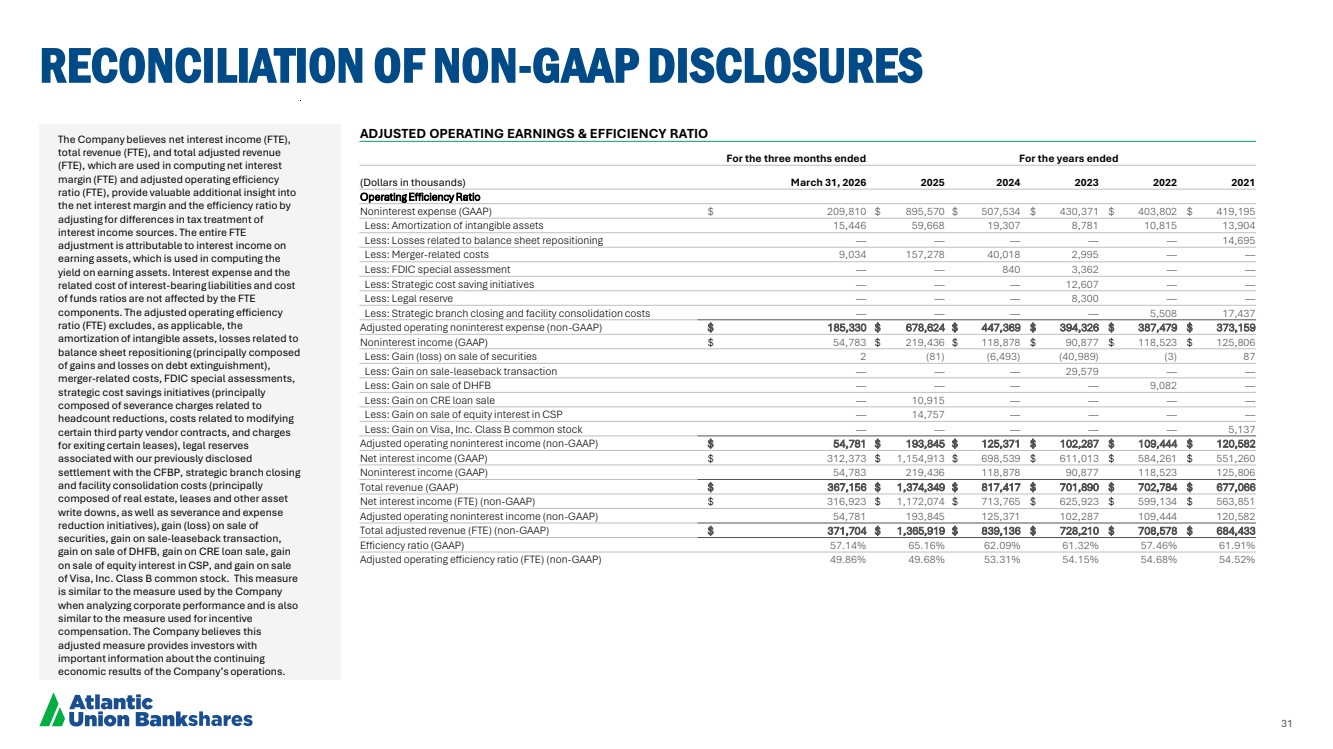
| 31 RECONCILIATION OF NON-GAAP DISCLOSURES The Company believes net interest income (FTE), total revenue (FTE), and total adjusted revenue (FTE), which are used in computing net interest margin (FTE) and adjusted operating efficiency ratio (FTE), provide valuable additional insight into the net interest margin and the efficiency ratio by adjusting for differences in tax treatment of interest income sources. The entire FTE adjustment is attributable to interest income on earning assets, which is used in computing the yield on earning assets. Interest expense and the related cost of interest-bearing liabilities and cost of funds ratios are not affected by the FTE components. The adjusted operating efficiency ratio (FTE) excludes, as applicable, the amortization of intangible assets, losses related to balance sheet repositioning (principally composed of gains and losses on debt extinguishment), merger-related costs, FDIC special assessments, strategic cost savings initiatives (principally composed of severance charges related to headcount reductions, costs related to modifying certain third party vendor contracts, and charges for exiting certain leases), legal reserves associated with our previously disclosed settlement with the CFBP, strategic branch closing and facility consolidation costs (principally composed of real estate, leases and other asset write downs, as well as severance and expense reduction initiatives), gain (loss) on sale of securities, gain on sale-leaseback transaction, gain on sale of DHFB, gain on CRE loan sale, gain on sale of equity interest in CSP, and gain on sale of Visa, Inc. Class B common stock. This measure is similar to the measure used by the Company when analyzing corporate performance and is also similar to the measure used for incentive compensation. The Company believes this adjusted measure provides investors with important information about the continuing economic results of the Company’s operations. ADJUSTED OPERATING EARNINGS & EFFICIENCY RATIO For the three months ended For the years ended (Dollars in thousands) March 31, 2026 2025 2024 2023 2022 2021 Operating Efficiency Ratio Noninterest expense (GAAP) $ 209,810 $ 895,570 $ 507,534 $ 430,371 $ 403,802 $ 419,195 Less: Amortization of intangible assets 15,446 59,668 19,307 8,781 10,815 13,904 Less: Losses related to balance sheet repositioning — — — — — 14,695 Less: Merger-related costs 9,034 157,278 40,018 2,995 — — Less: FDIC special assessment — — 840 3,362 — — Less: Strategic cost saving initiatives — — — 12,607 — — Less: Legal reserve — — — 8,300 — — Less: Strategic branch closing and facility consolidation costs — — — — 5,508 17,437 Adjusted operating noninterest expense (non-GAAP) $ 185,330 $ 678,624 $ 447,369 $ 394,326 $ 387,479 $ 373,159 Noninterest income (GAAP) $ 54,783 $ 219,436 $ 118,878 $ 90,877 $ 118,523 $ 125,806 Less: Gain (loss) on sale of securities 2 (81) (6,493) (40,989) (3) 87 Less: Gain on sale-leaseback transaction — — — 29,579 — — Less: Gain on sale of DHFB — — — — 9,082 — Less: Gain on CRE loan sale — 10,915 — — — — Less: Gain on sale of equity interest in CSP — 14,757 — — — — Less: Gain on Visa, Inc. Class B common stock — — — — — 5,137 Adjusted operating noninterest income (non-GAAP) $ 54,781 $ 193,845 $ 125,371 $ 102,287 $ 109,444 $ 120,582 Net interest income (GAAP) $ 312,373 $ 1,154,913 $ 698,539 $ 611,013 $ 584,261 $ 551,260 Noninterest income (GAAP) 54,783 219,436 118,878 90,877 118,523 125,806 Total revenue (GAAP) $ 367,156 $ 1,374,349 $ 817,417 $ 701,890 $ 702,784 $ 677,066 Net interest income (FTE) (non-GAAP) $ 316,923 $ 1,172,074 $ 713,765 $ 625,923 $ 599,134 $ 563,851 Adjusted operating noninterest income (non-GAAP) 54,781 193,845 125,371 102,287 109,444 120,582 Total adjusted revenue (FTE) (non-GAAP) $ 371,704 $ 1,365,919 $ 839,136 $ 728,210 $ 708,578 $ 684,433 Efficiency ratio (GAAP) 57.14% 65.16% 62.09% 61.32% 57.46% 61.91% Adjusted operating efficiency ratio (FTE) (non-GAAP) 49.86% 49.68% 53.31% 54.15% 54.68% 54.52% |
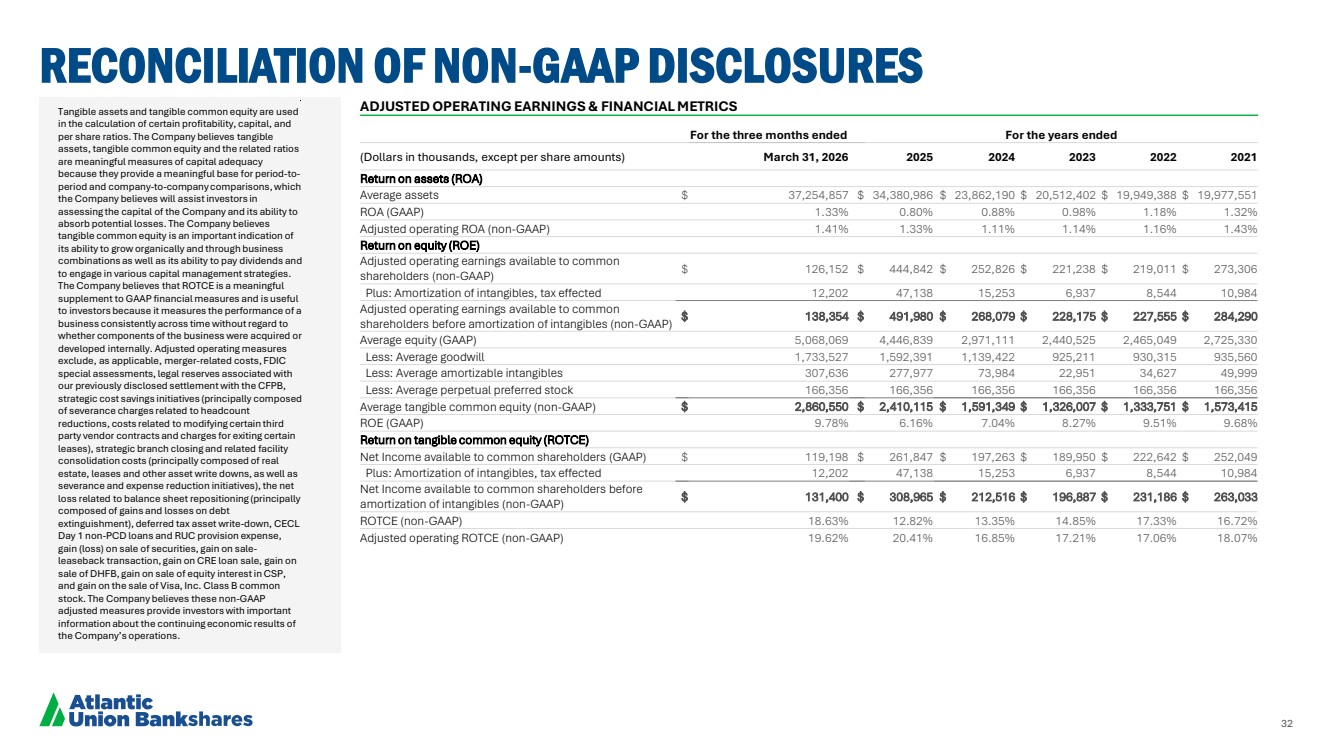
| 32 RECONCILIATION OF NON-GAAP DISCLOSURES Tangible assets and tangible common equity are used in the calculation of certain profitability, capital, and per share ratios. The Company believes tangible assets, tangible common equity and the related ratios are meaningful measures of capital adequacy because they provide a meaningful base for period-to-period and company-to-company comparisons, which the Company believes will assist investors in assessing the capital of the Company and its ability to absorb potential losses. The Company believes tangible common equity is an important indication of its ability to grow organically and through business combinations as well as its ability to pay dividends and to engage in various capital management strategies. The Company believes that ROTCE is a meaningful supplement to GAAP financial measures and is useful to investors because it measures the performance of a business consistently across time without regard to whether components of the business were acquired or developed internally. Adjusted operating measures exclude, as applicable, merger-related costs, FDIC special assessments, legal reserves associated with our previously disclosed settlement with the CFPB, strategic cost savings initiatives (principally composed of severance charges related to headcount reductions, costs related to modifying certain third party vendor contracts and charges for exiting certain leases), strategic branch closing and related facility consolidation costs (principally composed of real estate, leases and other asset write downs, as well as severance and expense reduction initiatives), the net loss related to balance sheet repositioning (principally composed of gains and losses on debt extinguishment), deferred tax asset write-down, CECL Day 1 non-PCD loans and RUC provision expense, gain (loss) on sale of securities, gain on sale-leaseback transaction, gain on CRE loan sale, gain on sale of DHFB, gain on sale of equity interest in CSP, and gain on the sale of Visa, Inc. Class B common stock. The Company believes these non-GAAP adjusted measures provide investors with important information about the continuing economic results of the Company’s operations. ADJUSTED OPERATING EARNINGS & FINANCIAL METRICS For the three months ended For the years ended (Dollars in thousands, except per share amounts) March 31, 2026 2025 2024 2023 2022 2021 Return on assets (ROA) Average assets $ 37,254,857 $ 34,380,986 $ 23,862,190 $ 20,512,402 $ 19,949,388 $ 19,977,551 ROA (GAAP) 1.33% 0.80% 0.88% 0.98% 1.18% 1.32% Adjusted operating ROA (non-GAAP) 1.41% 1.33% 1.11% 1.14% 1.16% 1.43% Return on equity (ROE) Adjusted operating earnings available to common shareholders (non-GAAP) $ 126,152 $ 444,842 $ 252,826 $ 221,238 $ 219,011 $ 273,306 Plus: Amortization of intangibles, tax effected 12,202 47,138 15,253 6,937 8,544 10,984 Adjusted operating earnings available to common shareholders before amortization of intangibles (non-GAAP) $ 138,354 $ 491,980 $ 268,079 $ 228,175 $ 227,555 $ 284,290 Average equity (GAAP) 5,068,069 4,446,839 2,971,111 2,440,525 2,465,049 2,725,330 Less: Average goodwill 1,733,527 1,592,391 1,139,422 925,211 930,315 935,560 Less: Average amortizable intangibles 307,636 277,977 73,984 22,951 34,627 49,999 Less: Average perpetual preferred stock 166,356 166,356 166,356 166,356 166,356 166,356 Average tangible common equity (non-GAAP) $ 2,860,550 $ 2,410,115 $ 1,591,349 $ 1,326,007 $ 1,333,751 $ 1,573,415 ROE (GAAP) 9.78% 6.16% 7.04% 8.27% 9.51% 9.68% Return on tangible common equity (ROTCE) Net Income available to common shareholders (GAAP) $ 119,198 $ 261,847 $ 197,263 $ 189,950 $ 222,642 $ 252,049 Plus: Amortization of intangibles, tax effected 12,202 47,138 15,253 6,937 8,544 10,984 Net Income available to common shareholders before amortization of intangibles (non-GAAP) $ 131,400 $ 308,965 $ 212,516 $ 196,887 $ 231,186 $ 263,033 ROTCE (non-GAAP) 18.63% 12.82% 13.35% 14.85% 17.33% 16.72% Adjusted operating ROTCE (non-GAAP) 19.62% 20.41% 16.85% 17.21% 17.06% 18.07% |
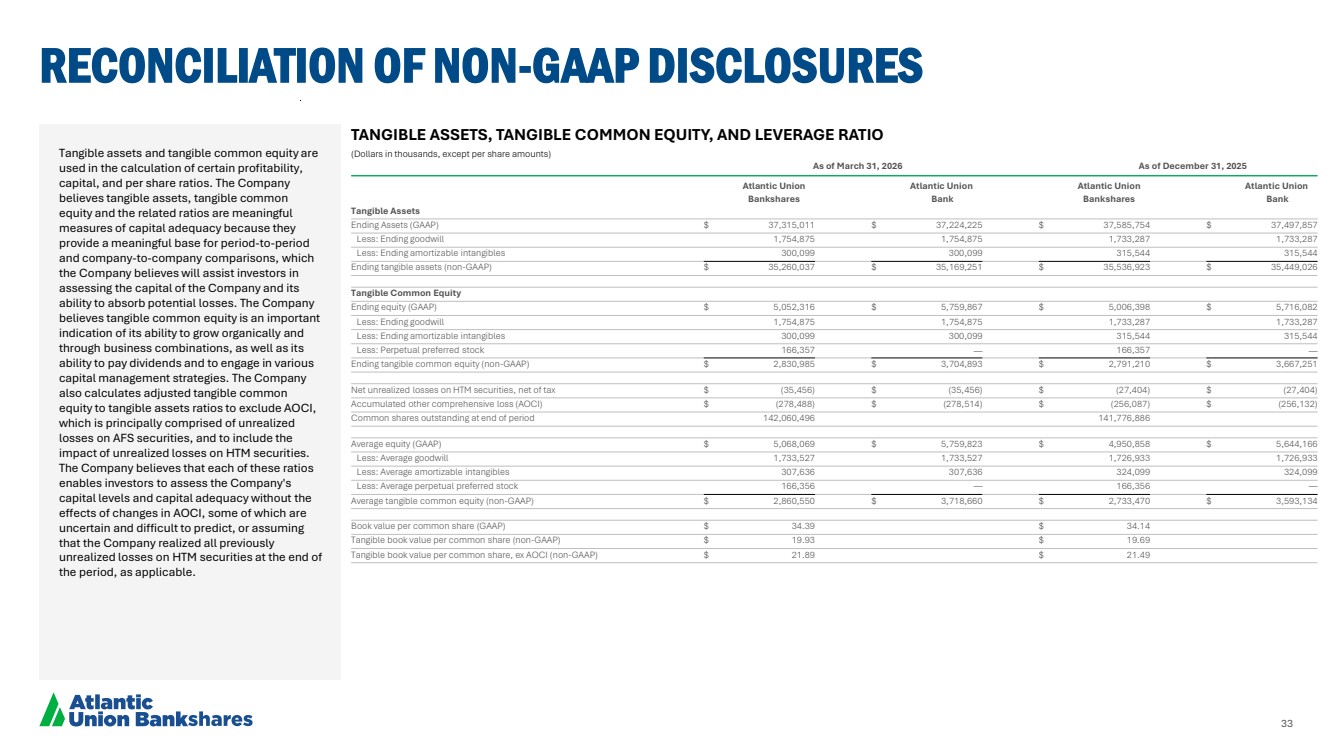
| 33 RECONCILIATION OF NON-GAAP DISCLOSURES Tangible assets and tangible common equity are used in the calculation of certain profitability, capital, and per share ratios. The Company believes tangible assets, tangible common equity and the related ratios are meaningful measures of capital adequacy because they provide a meaningful base for period-to-period and company-to-company comparisons, which the Company believes will assist investors in assessing the capital of the Company and its ability to absorb potential losses. The Company believes tangible common equity is an important indication of its ability to grow organically and through business combinations, as well as its ability to pay dividends and to engage in various capital management strategies. The Company also calculates adjusted tangible common equity to tangible assets ratios to exclude AOCI, which is principally comprised of unrealized losses on AFS securities, and to include the impact of unrealized losses on HTM securities. The Company believes that each of these ratios enables investors to assess the Company's capital levels and capital adequacy without the effects of changes in AOCI, some of which are uncertain and difficult to predict, or assuming that the Company realized all previously unrealized losses on HTM securities at the end of the period, as applicable. TANGIBLE ASSETS, TANGIBLE COMMON EQUITY, AND LEVERAGE RATIO (Dollars in thousands, except per share amounts) As of March 31, 2026 As of December 31, 2025 Atlantic Union Atlantic Union Atlantic Union Atlantic Union Bankshares Bank Bankshares Bank Tangible Assets Ending Assets (GAAP) $ 37,315,011 $ 37,224,225 $ 37,585,754 $ 37,497,857 Less: Ending goodwill 1,754,875 1,754,875 1,733,287 1,733,287 Less: Ending amortizable intangibles 300,099 300,099 315,544 315,544 Ending tangible assets (non-GAAP) $ 35,260,037 $ 35,169,251 $ 35,536,923 $ 35,449,026 Tangible Common Equity Ending equity (GAAP) $ 5,052,316 $ 5,759,867 $ 5,006,398 $ 5,716,082 Less: Ending goodwill 1,754,875 1,754,875 1,733,287 1,733,287 Less: Ending amortizable intangibles 300,099 300,099 315,544 315,544 Less: Perpetual preferred stock 166,357 — 166,357 — Ending tangible common equity (non-GAAP) $ 2,830,985 $ 3,704,893 $ 2,791,210 $ 3,667,251 Net unrealized losses on HTM securities, net of tax $ (35,456) $ (35,456) $ (27,404) $ (27,404) Accumulated other comprehensive loss (AOCI) $ (278,488) $ (278,514) $ (256,087) $ (256,132) Common shares outstanding at end of period 142,060,496 141,776,886 Average equity (GAAP) $ 5,068,069 $ 5,759,823 $ 4,950,858 $ 5,644,166 Less: Average goodwill 1,733,527 1,733,527 1,726,933 1,726,933 Less: Average amortizable intangibles 307,636 307,636 324,099 324,099 Less: Average perpetual preferred stock 166,356 — 166,356 — Average tangible common equity (non-GAAP) $ 2,860,550 $ 3,718,660 $ 2,733,470 $ 3,593,134 Book value per common share (GAAP) $ 34.39 $ 34.14 Tangible book value per common share (non-GAAP) $ 19.93 $ 19.69 Tangible book value per common share, ex AOCI (non-GAAP) $ 21.89 $ 21.49 |
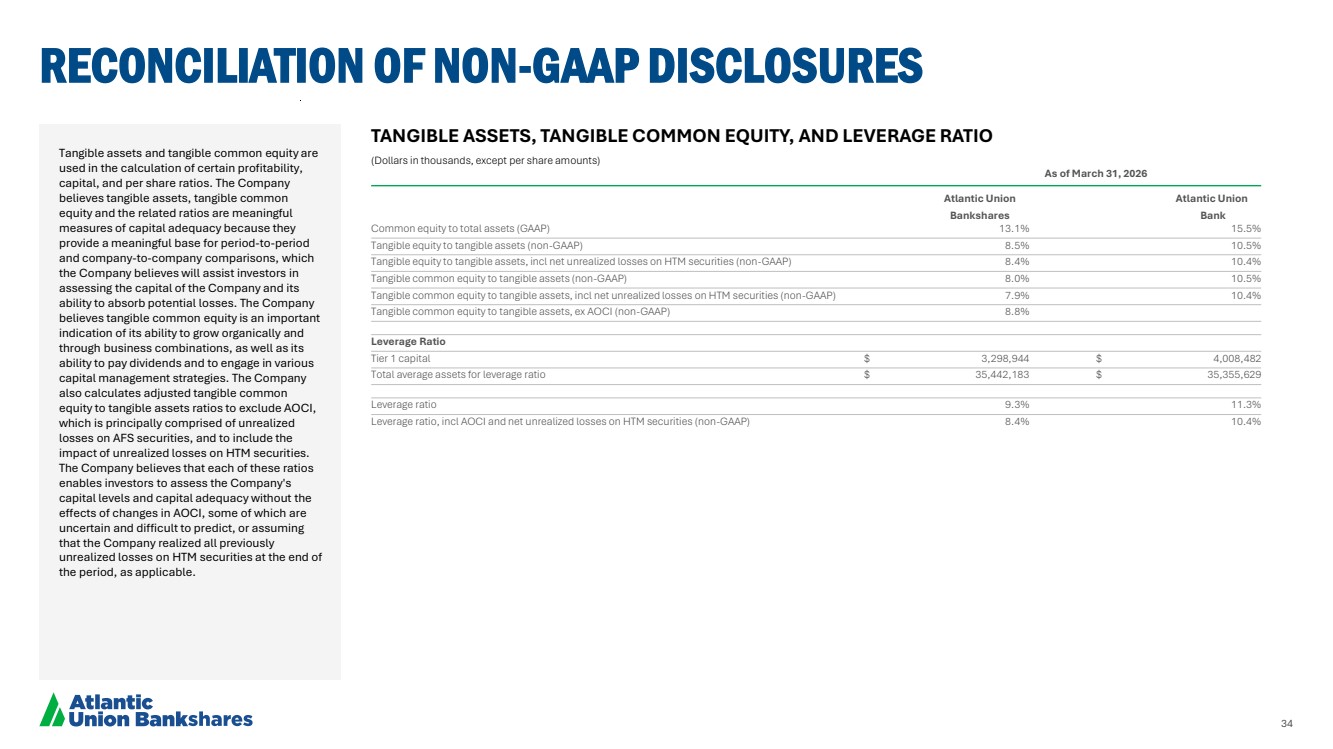
| 34 RECONCILIATION OF NON-GAAP DISCLOSURES Tangible assets and tangible common equity are used in the calculation of certain profitability, capital, and per share ratios. The Company believes tangible assets, tangible common equity and the related ratios are meaningful measures of capital adequacy because they provide a meaningful base for period-to-period and company-to-company comparisons, which the Company believes will assist investors in assessing the capital of the Company and its ability to absorb potential losses. The Company believes tangible common equity is an important indication of its ability to grow organically and through business combinations, as well as its ability to pay dividends and to engage in various capital management strategies. The Company also calculates adjusted tangible common equity to tangible assets ratios to exclude AOCI, which is principally comprised of unrealized losses on AFS securities, and to include the impact of unrealized losses on HTM securities. The Company believes that each of these ratios enables investors to assess the Company's capital levels and capital adequacy without the effects of changes in AOCI, some of which are uncertain and difficult to predict, or assuming that the Company realized all previously unrealized losses on HTM securities at the end of the period, as applicable. TANGIBLE ASSETS, TANGIBLE COMMON EQUITY, AND LEVERAGE RATIO (Dollars in thousands, except per share amounts) As of March 31, 2026 Atlantic Union Atlantic Union Bankshares Bank Common equity to total assets (GAAP) 13.1% 15.5% Tangible equity to tangible assets (non-GAAP) 8.5% 10.5% Tangible equity to tangible assets, incl net unrealized losses on HTM securities (non-GAAP) 8.4% 10.4% Tangible common equity to tangible assets (non-GAAP) 8.0% 10.5% Tangible common equity to tangible assets, incl net unrealized losses on HTM securities (non-GAAP) 7.9% 10.4% Tangible common equity to tangible assets, ex AOCI (non-GAAP) 8.8% Leverage Ratio Tier 1 capital $ 3,298,944 $ 4,008,482 Total average assets for leverage ratio $ 35,442,183 $ 35,355,629 Leverage ratio 9.3% 11.3% Leverage ratio, incl AOCI and net unrealized losses on HTM securities (non-GAAP) 8.4% 10.4% |
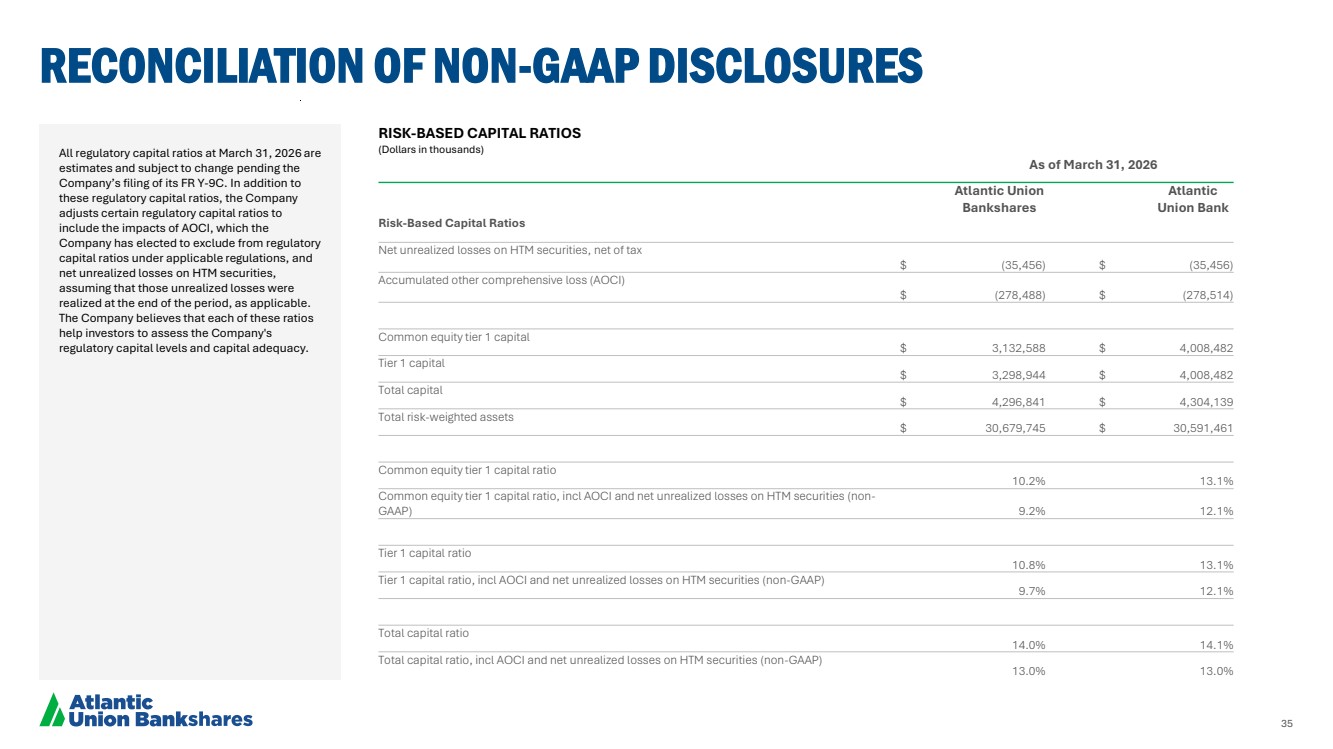
| 35 RECONCILIATION OF NON-GAAP DISCLOSURES All regulatory capital ratios at March 31, 2026 are estimates and subject to change pending the Company’s filing of its FR Y-9C. In addition to these regulatory capital ratios, the Company adjusts certain regulatory capital ratios to include the impacts of AOCI, which the Company has elected to exclude from regulatory capital ratios under applicable regulations, and net unrealized losses on HTM securities, assuming that those unrealized losses were realized at the end of the period, as applicable. The Company believes that each of these ratios help investors to assess the Company's regulatory capital levels and capital adequacy. RISK-BASED CAPITAL RATIOS (Dollars in thousands) As of March 31, 2026 Atlantic Union Bankshares Atlantic Union Bank Risk-Based Capital Ratios Net unrealized losses on HTM securities, net of tax $ (35,456) $ (35,456) Accumulated other comprehensive loss (AOCI) $ (278,488) $ (278,514) Common equity tier 1 capital $ 3,132,588 $ 4,008,482 Tier 1 capital $ 3,298,944 $ 4,008,482 Total capital $ 4,296,841 $ 4,304,139 Total risk-weighted assets $ 30,679,745 $ 30,591,461 Common equity tier 1 capital ratio 10.2% 13.1% Common equity tier 1 capital ratio, incl AOCI and net unrealized losses on HTM securities (non-GAAP) 9.2% 12.1% Tier 1 capital ratio 10.8% 13.1% Tier 1 capital ratio, incl AOCI and net unrealized losses on HTM securities (non-GAAP) 9.7% 12.1% Total capital ratio 14.0% 14.1% Total capital ratio, incl AOCI and net unrealized losses on HTM securities (non-GAAP) 13.0% 13.0% |
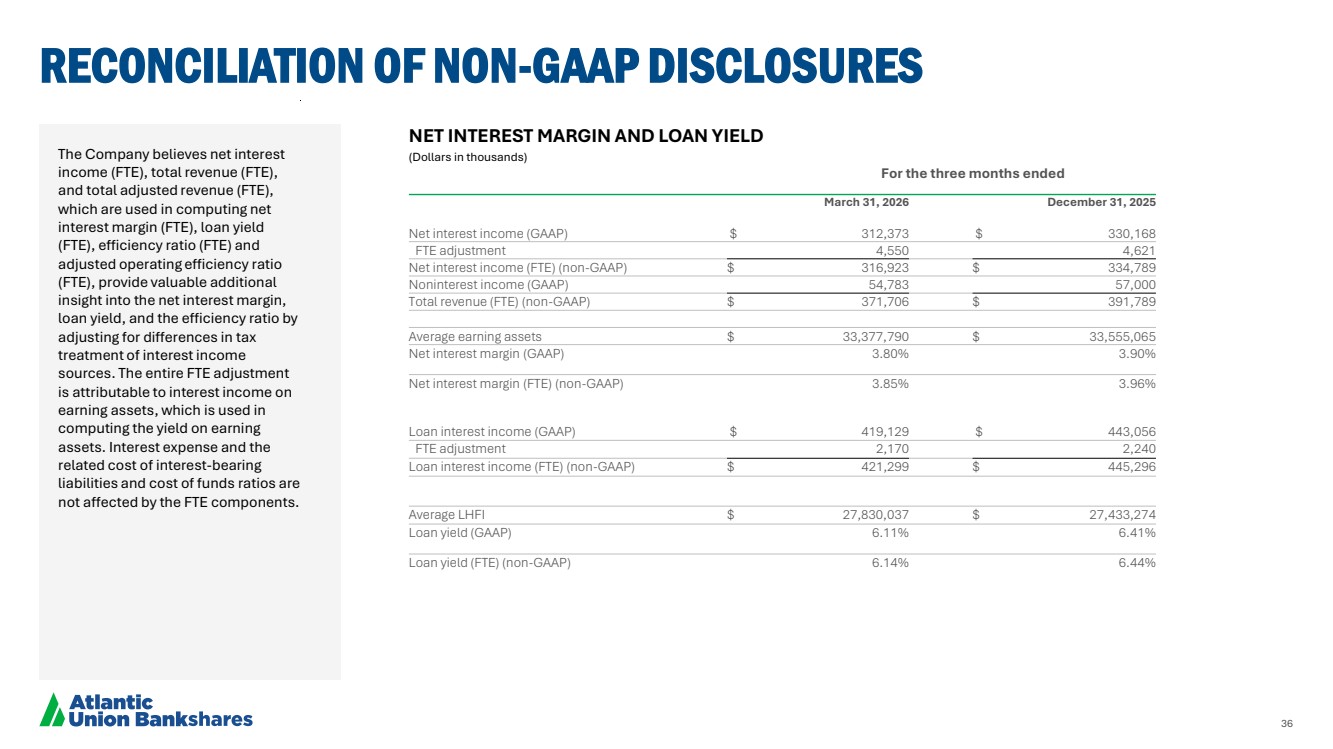
| 36 RECONCILIATION OF NON-GAAP DISCLOSURES The Company believes net interest income (FTE), total revenue (FTE), and total adjusted revenue (FTE), which are used in computing net interest margin (FTE), loan yield (FTE), efficiency ratio (FTE) and adjusted operating efficiency ratio (FTE), provide valuable additional insight into the net interest margin, loan yield, and the efficiency ratio by adjusting for differences in tax treatment of interest income sources. The entire FTE adjustment is attributable to interest income on earning assets, which is used in computing the yield on earning assets. Interest expense and the related cost of interest-bearing liabilities and cost of funds ratios are not affected by the FTE components. NET INTEREST MARGIN AND LOAN YIELD (Dollars in thousands) For the three months ended March 31, 2026 December 31, 2025 Net interest income (GAAP) $ 312,373 $ 330,168 FTE adjustment 4,550 4,621 Net interest income (FTE) (non-GAAP) $ 316,923 $ 334,789 Noninterest income (GAAP) 54,783 57,000 Total revenue (FTE) (non-GAAP) $ 371,706 $ 391,789 Average earning assets $ 33,377,790 $ 33,555,065 Net interest margin (GAAP) 3.80% 3.90% Net interest margin (FTE) (non-GAAP) 3.85% 3.96% Loan interest income (GAAP) $ 419,129 $ 443,056 FTE adjustment 2,170 2,240 Loan interest income (FTE) (non-GAAP) $ 421,299 $ 445,296 Average LHFI $ 27,830,037 $ 27,433,274 Loan yield (GAAP) 6.11% 6.41% Loan yield (FTE) (non-GAAP) 6.14% 6.44% |