| Q1 2025 EARNINGS PRESENTATION NYSE: AUB APRIL 24, 2025 |

| 2 FORWARD-LOOKING STATEMENTS This presentation and statements by our management may constitute “forward-looking statements” within the meaning of the Private Securities Litigation Reform Act of 1995. Forward-looking statements are statements that include, without limitation, statements regarding our recently completed acquisition of Sandy Spring Bancorp, Inc. (“Sandy Spring” or “SASR”) and expectations with regard to the benefits of the Sandy Spring acquisition, including anticipated accretion to earnings per share, the tangible book value earn-back period and other operating and return metrics; our business, financial and operating results, including our deposit base and funding; the impact of future economic conditions, anticipated changes in the interest rate environment and the related impacts on our net interest margin, changes in economic conditions; management’s beliefs regarding our liquidity, capital resources, asset quality, CRE loan portfolio and our customer relationships; statements that include other projections, predictions, expectations, or beliefs about future events or results or otherwise are not statements of historical fact, and statements on the slides entitled “2025 Financial Outlook (inclusive of Sandy Spring beginning April 1st)”, “Financially Compelling Transaction” and “Updates on Key Transaction Metrics”. Such forward-looking statements are based on certain assumptions as of the time they are made, and are inherently subject to known and unknown risks, uncertainties, and other factors, some of which cannot be predicted or quantified, that may cause actual results, performance, or achievements to be materially different from those expressed or implied by such forward-looking statements. Forward-looking statements are often characterized by the use of qualified words (and their derivatives) such as “expect,” “believe,” “estimate,” “plan,” “project,” “anticipate,” “intend,” “will,” “may,” “view,” “opportunity,” “seek to,” “potential,” “continue,” “confidence,” or words of similar meaning or other statements concerning opinions or judgment of Atlantic Union BanksharesCorporation (the “Company,” “AUB,” “we,” “us” or “our”) and our management about future events. Although we believe that our expectations with respect to forward-looking statements are based on reasonable assumptions within the bounds of our existing knowledge of our business and operations, there can be no assurance that actual future results, performance, or achievements of, or trends affecting, us will not differ materially from any projected future results, performance, achievements or trends expressed or implied by such forward-looking statements. Actual future results, performance, achievements or trends may differ materially from historical results or those anticipated depending on a variety of factors, including, but not limited to, the effects of or changes in: • market interest rates and their related impacts on macroeconomic conditions, customer and client behavior, our funding costs and our loan and securities portfolios; • economic conditions, including inflation and recessionary conditions and their related impacts on economic growth and customer and client behavior; • U.S. and global trade policies and tensions, including change in, or the imposition of, tariffs and/or trade barriers and the economic impacts, volatility and uncertainty resulting therefrom, and geopolitical instability; • volatility in the financial services sector, including failures or rumors of failures of other depository institutions, including us, to attract and retain depositors and to borrow or raise capital; • legislative or regulatory changes and requirements, including as part of the regulatory reform agenda of the Trump administration, including changes in federal state or local tax laws and changes impacting the rulemaking, supervision, examination and enforcement priorities of the federal banking agencies; • the sufficiency of liquidity and changes in our capital position; • general economic and financial market conditions in the United States generally and particularly in the markets in which we operate and which our loans are concentrated, including the effects of declines in real estate values, an increase in unemployment levels, U.S. fiscal debt, budget and tax matters, and slowdowns in economic growth; • the diversion of management’s attention from ongoing business operations and opportunities due to our recent acquisition of Sandy Spring; • the impact of purchase accounting with respect to the Sandy Spring acquisition, or change in the assumptions used regarding the assets acquired and liabilities assumed to determine the fair value and credit marks; • the possibility that the anticipated benefits of our acquisition activity, including our acquisitions of Sandy Spring and American National, including anticipated cost savings and strategic gains, are not realized when expected or at all, including as a result of the strength of the economy, competitive factors in the areas where we do business, or as a result of other unexpected factors or events, or with respect to our acquisition of Sandy Spring, as a result of the impact of, or problems arising from, the integration of the two companies; • the integration of the business and operations of Sandy Spring may take longer or be more costly than anticipated; • potential adverse reactions or changes to business or employee relationships, including those resulting from our acquisitions of Sandy Spring and American National; • monetary, fiscal and regulatory policies of the U.S. government, including the U.S. Department of the Treasury and the Federal Reserve; • the quality or composition of our loan or investment portfolios and changes therein; • demand for loan products and financial services in our market areas; • our ability to manage our growth or implement our growth strategy; • the effectiveness of expense reduction plans; • the introduction of new lines of business or new products and services; • our ability to identify, recruit and retain key employees; • real estate values in our lending area; • changes in accounting principles, standards, rules, and interpretations, and the related impact on our financial statements; • an insufficient ACL or volatility in the ACL resulting from the CECL methodology, either alone or as that may be affected by changing economic conditions, credit concentrations, inflation, changing interest rates, or other factors; • concentrations of loans secured by real estate, particularly commercial real estate; • the effectiveness of our credit processes and management of our credit risk; • our ability to compete in the market for financial services and increased competition from fintech companies; • technological risks and developments, and cyber threats, attacks, or events; • operational, technological, cultural, regulatory, legal, credit, and other risks associated with the exploration, consummation and integration of potential future acquisitions, whether involving stock or cash consideration; • the potential adverse effects of unusual and infrequently occurring events, such as weather-related disasters, terrorist acts, geopolitical conflicts or public health events (such as pandemics), and of governmental and societal responses thereto; these potential adverse effects may include, without limitation, adverse effects on the ability of our borrowers to satisfy their obligations to us, on the value of collateral securing loans, on the demand for our loans or our other products and services, on supply chains and methods used to distribute products and services, on incidents of cyberattack and fraud, on our liquidity or capital positions, on risks posed by reliance on third-party service providers, on other aspects of our business operations and on financial markets and economic growth; • performance by our counterparties or vendors; • deposit flows; • the availability of financing and the terms thereof; • the level of prepayments on loans and mortgage-backed securities; • actual or potential claims, damages, and fines related to litigation or government actions, which may result in, among other things, additional costs, fines, penalties, restrictions on our business activities, reputational harm, or other adverse consequences; • any event or development that would cause us to conclude that there was an impairment of any asset, including intangible assets, such as goodwill; and • other factors, many of which are beyond our control. Please also refer to such other factors as discussed throughout Part I, Item 1A. “Risk Factors” and Part II, Item 7. “Management’s Discussion and Analysis of Financial Condition and Results of Operations” of our Annual Report on Form 10-K for the year ended December 31, 2024, and related disclosures in other filings, which have been filed with the U.S. Securities and Exchange Commission (“SEC”) and are available on the SEC’s website at www.sec.gov. All risk factors and uncertainties described herein and therein should be considered in evaluating forward-looking statements, and all forward-looking statements are expressly qualified by the cautionary statements contained or referred to herein and therein. The actual results or developments anticipated may not be realized or, even if substantially realized, they may not have the expected consequences to or effects on the Company or our businesses or operations. Readers are cautioned not to rely too heavily on the forward-looking statements. Forward-looking statements speak only as of the date they are made. We do not intend or assume any obligation to update, revise or clarify any forward-looking statements that may be made from time to time by or on behalf of the Company, whether because of new information, future events or otherwise, except as required by law. |
| 3 ADDITIONAL INFORMATION Non-GAAP Financial Measures This presentation contains certain financial information determined by methods other than in accordance with generally accepted accounting principles in the United States (“GAAP”). These non-GAAP financial measures are a supplement to GAAP, which is used to prepare our financial statements, and should not be considered in isolation or as a substitute for comparable measures calculated in accordance with GAAP. In addition, our non-GAAP financial measures may not be comparable to non-GAAP financial measures of other companies. We use the non-GAAP financial measures discussed herein in our analysis of our performance. Our management believes that these non-GAAP financial measures provide additional understanding of ongoing operations, enhance comparability of results of operations with prior periods, show the effects of significant gains and charges in the periods presented without the impact of items or events that may obscure trends in our underlying performance, or show the potential effects of accumulated other comprehensive income (or AOCI) or unrealized losses on securities on our capital. This presentation also includes certain projections of non-GAAP financial measures. Due to the inherent variability and difficulty associated with making accurate forecasts and projections of information that is excluded from these projected non-GAAP measures, and the fact that some of the excluded information is not currently ascertainable or accessible, we are unable to quantify certain amounts that would be required to be included in the most directly comparable projected GAAP financial measures without unreasonable effort. Consequently, no disclosure of projected comparable GAAP measures is included, and no reconciliation of forward-looking non-GAAP financial information is included. Please see “Reconciliation of Non-GAAP Disclosures” at the end of this presentation for a reconciliation to the nearest GAAP financial measure. No Offer or Solicitation This presentation does not constitute an offer to sell or a solicitation of an offer to buy any securities. No offer of securities shall be made except by means of a prospectus meeting the requirements of the Securities Act of 1933, as amended, and no offer to sell or solicitation of an offer to buy shall be made in any jurisdiction in which such offer, solicitation or sale would be unlawful. About Atlantic Union Bankshares Corporation Headquartered in Richmond, Virginia, Atlantic Union Bankshares Corporation (NYSE: AUB) is the holding company for Atlantic Union Bank. Atlantic Union Bank has branches and ATMs located throughout Virginia and in portions of Maryland and North Carolina. Certain non-bank financial services affiliates of Atlantic Union Bank include: Atlantic Union Equipment Finance, Inc., which provides equipment financing; Atlantic Union Financial Consultants, LLC, which provides brokerage services; and Union Insurance Group, LLC, which offers various lines of insurance products. |
| 4 PRO FORMA AND MARKET AND INDUSTRY DATA Pro Forma Data Neither Atlantic Union’s nor Sandy Spring’s independent registered public accounting firms have studied, reviewed or performed any procedures with respect to the pro forma or pro forma forward-looking financial data for the purpose of inclusion in this presentation, and, accordingly, neither have expressed an opinion or provided any form of assurance with respect thereto for the purpose of this presentation. The pro forma combined data of Atlantic Union and Sandy Spring is as of March 31, 2025, and is based on the GAAP results of Atlantic Union and Sandy Spring for the applicable periods without adjustments, except where specifically noted. The pro forma combined data included in this presentation does not reflect any purchase accounting adjustments. All pro forma data should be reviewed in connection with the historical information of Atlantic Union and Sandy Spring, as applicable. These pro forma and pro forma forward-looking financial data are for illustrative purposes only and should not be relied on as necessarily being indicative of future results. The assumptions and estimates underlying the pro forma and pro forma forward-looking financial data are inherently uncertain and are subject to a wide variety of significant business, economic and competitive risks and uncertainties that could cause actual results to differ materially from those contained in the prospective financial information, including those in the “Forward-Looking Statements” disclaimer on slide 2 of this presentation. Pro forma and pro forma forward-looking financial data is inherently uncertain due to a number of factors outside of Atlantic Union’s and Sandy Spring’s control. Accordingly, there can be no assurance that the pro forma combined information, pro forma forward-looking financial data or prospective results are indicative of future performance of the combined company after the acquisition of Sandy Spring that consummated on April 1, 2025 or that actual results will not differ materially from those presented in the pro forma and pro forma forward-looking financial data. Inclusion of pro forma and pro forma financial data in this presentation should not be regarded as a representation by any person that the results contained in the prospective financial information will be achieved. Further, neither the pro forma nor the pro forma forward-looking financial data has been prepared in accordance with Article 11 of Regulation S-X, and, therefore, does not reflect any of the adjustments that would be required thereby. Market and Industry Data Unless otherwise indicated, market data and certain industry forecast data used in this presentation were obtained from internal reports, where appropriate, as well as third party sources and other publicly available information. Data regarding the industries in which the Company competes, its market position and market share within these industries are inherently imprecise and are subject to significant business, economic and competitive uncertainties beyond the Company's control. In addition, assumptions and estimates of the Company and its industries' future performance are necessarily subject to a high degree of uncertainty and risk due to a variety of factors. These and other factors could cause future performance to differ materially from assumptions and estimates. |
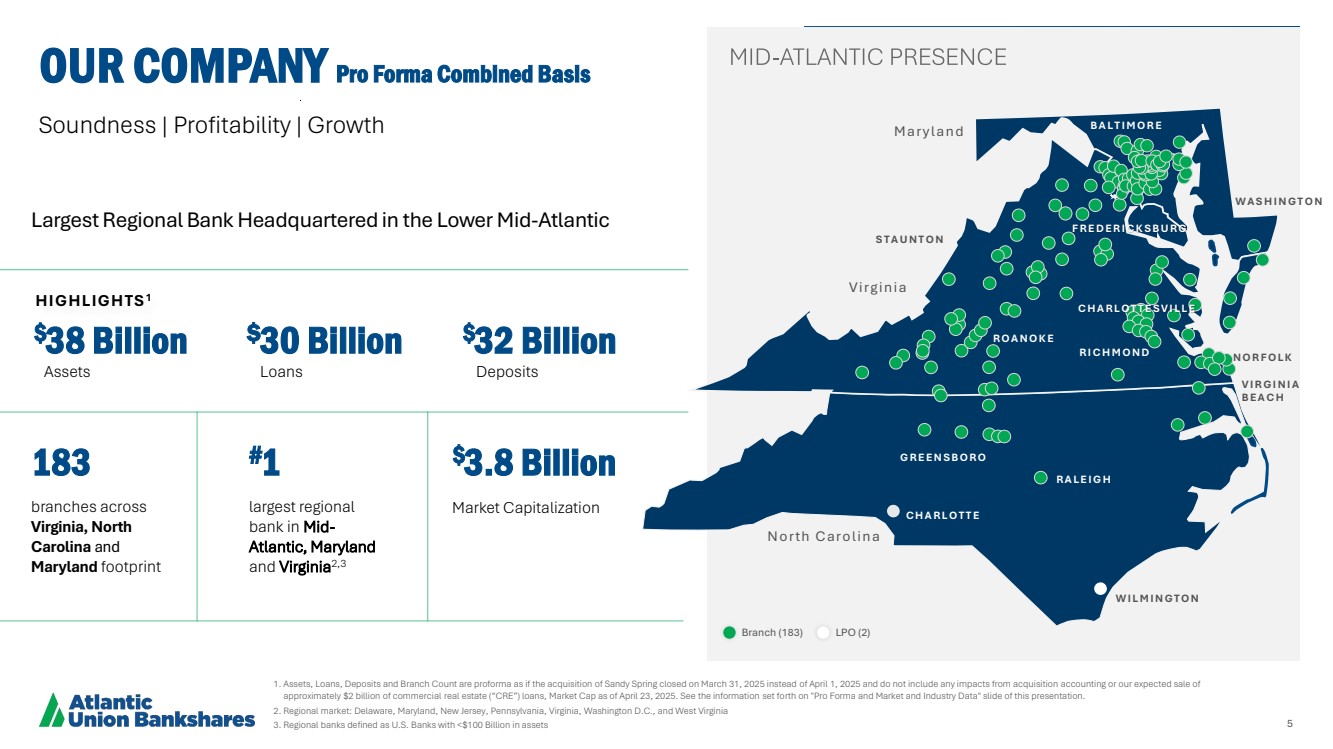
| 5 N O R F O L K V I R G I N I A B E A C H M a ry l a n d V irg in ia No rth C a ro l in a C H A R L O T T E W I L M I N G T O N B A L T I M O R E R A L E I G H G R E E N S B O R O W A S H I N G T O N R O A N O K E S T A U N T O N C H A R L O T T E S V I L L E R I C H M O N D F R E D E R I C K S B U R G HIGHLIGHTS1 branches across Virginia, North Carolina and Maryland footprint 183 largest regional bank in Mid-Atlantic, Maryland and Virginia2,3 #1 $38 Billion Assets $30 Billion Loans $32 Billion Deposits $3.8 Billion Market Capitalization Soundness | Profitability | Growth 1. Assets, Loans, Deposits and Branch Count are proforma as if the acquisition of Sandy Spring closed on March 31, 2025 instead of April 1, 2025 and do not include any impacts from acquisition accounting or our expected sale of approximately $2 billion of commercial real estate (“CRE”) loans, Market Cap as of April 23, 2025. See the information set forth on "Pro Forma and Market and Industry Data" slide of this presentation. 2. Regional market: Delaware, Maryland, New Jersey, Pennsylvania, Virginia, Washington D.C., and West Virginia 3. Regional banks defined as U.S. Banks with <$100 Billion in assets OUR COMPANY Pro Forma Combined Basis Branch (183) LPO (2) Largest Regional Bank Headquartered in the Lower Mid-Atlantic |
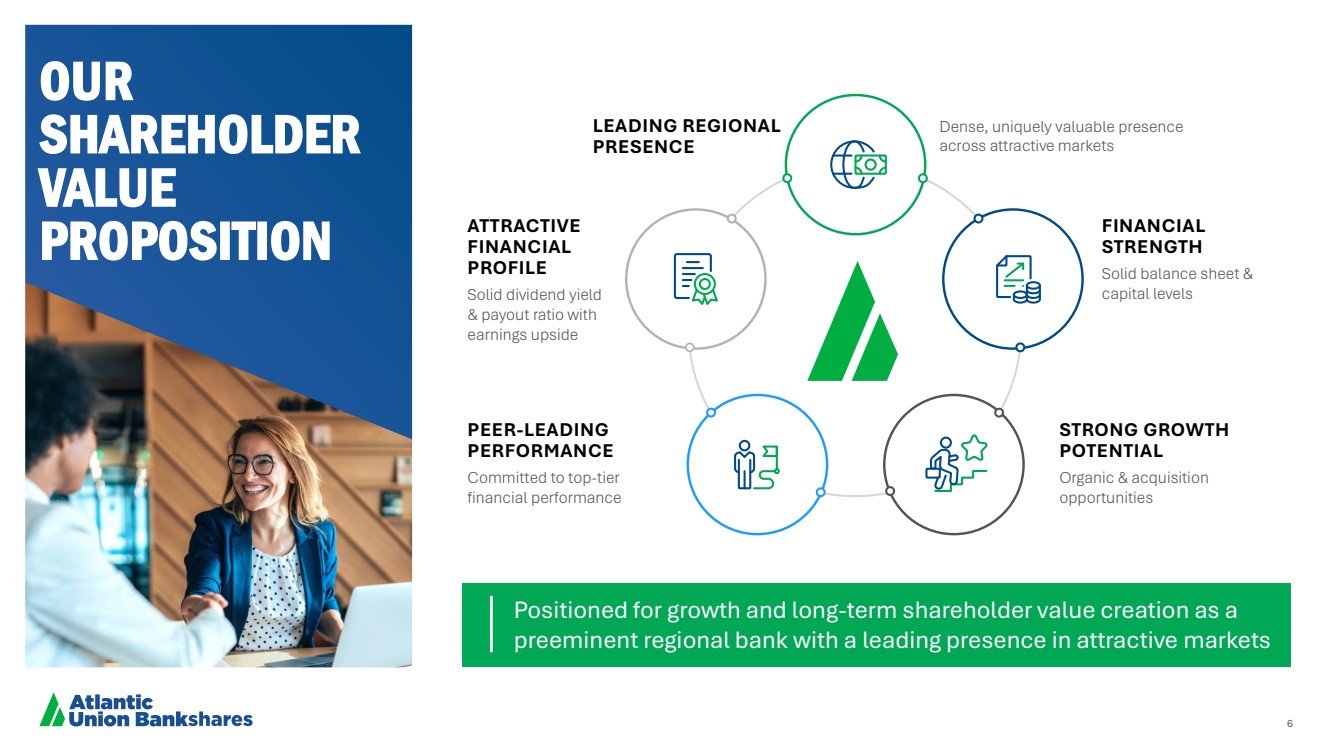
| 6 Dense, uniquely valuable presence across attractive markets FINANCIAL STRENGTH Solid balance sheet & capital levels PEER-LEADING PERFORMANCE Committed to top-tier financial performance ATTRACTIVE FINANCIAL PROFILE Solid dividend yield & payout ratio with earnings upside STRONG GROWTH POTENTIAL Organic & acquisition opportunities OUR SHAREHOLDER VALUE PROPOSITION Positioned for growth and long-term shareholder value creation as a preeminent regional bank with a leading presence in attractive markets LEADING REGIONAL PRESENCE |
| AUB Q1 2025 FINANCIAL RESULTS |

| 8 1. For non-GAAP financial measures, see reconciliation to most directly comparable GAAP measure in "Appendix - Reconciliation of Non-GAAP Disclosures” HIGHLIGHTS Q1 2025 LOAN & DEPOSIT GROWTH Average loan growth of approximately 1.3% annualized for Q1 2025 Deposit growth of approximately 2.1% annualized for Q1 2025 with demand deposits increasing $194 million while reducing brokered deposit by approximately $109 million Loan/Deposit ratio of 89.9% at March 31, 2025 POSITIONING FOR LONG TERM Lending pipelines remain healthy Focus on integration of Sandy Spring, performance of the core banking franchise, and building out North Carolina teams Disciplined expense management DIFFERENTIATED CLIENT EXPERIENCE Responsive, strong and capable alternative to large national banks, while competitive with and more capable than smaller banks CAPITALIZE ON STRATEGIC OPPORTUNITIES Closed the acquisition of Sandy Spring on April 1, 2025 Sandy Spring core systems conversion scheduled for October 2025 FINANCIAL RATIOS Q1 2025 adjusted operating return on tangible common equity of 13.2%1 Q1 2025 adjusted operating return on assets of 0.90%1 Q1 2025 adjusted operating efficiency ratio (FTE) of 57.02%1 Q1 2025 pretax pre-provision adjusted operating earnings of $84.2 million1 ASSET QUALITY Q1 2025 net charge-offs at 5 bps annualized Increased Allowance for Credit Loss to 1.13% of loans held for investment primarily reflecting the impacts of the increased uncertainty in the economic outlook 8 |

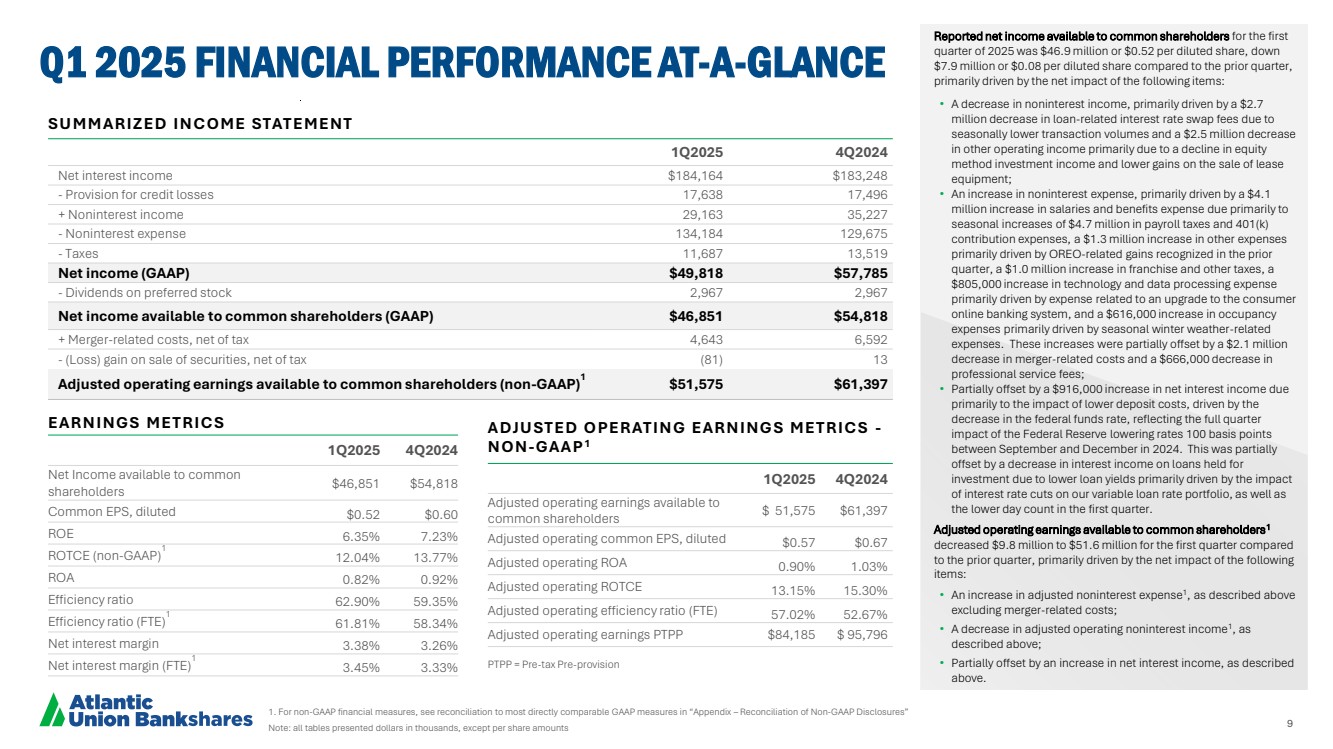
| 9 1. For non-GAAP financial measures, see reconciliation to most directly comparable GAAP measures in “Appendix – Reconciliation of Non-GAAP Disclosures” Note: all tables presented dollars in thousands, except per share amounts Q1 2025 FINANCIAL PERFORMANCE AT-A-GLANCE Reported net income available to common shareholders for the first quarter of 2025 was $46.9 million or $0.52 per diluted share, down $7.9 million or $0.08 per diluted share compared to the prior quarter, primarily driven by the net impact of the following items: • A decrease in noninterest income, primarily driven by a $2.7 million decrease in loan-related interest rate swap fees due to seasonally lower transaction volumes and a $2.5 million decrease in other operating income primarily due to a decline in equity method investment income and lower gains on the sale of lease equipment; • An increase in noninterest expense, primarily driven by a $4.1 million increase in salaries and benefits expense due primarily to seasonal increases of $4.7 million in payroll taxes and 401(k) contribution expenses, a $1.3 million increase in other expenses primarily driven by OREO-related gains recognized in the prior quarter, a $1.0 million increase in franchise and other taxes, a $805,000 increase in technology and data processing expense primarily driven by expense related to an upgrade to the consumer online banking system, and a $616,000 increase in occupancy expenses primarily driven by seasonal winter weather-related expenses. These increases were partially offset by a $2.1 million decrease in merger-related costs and a $666,000 decrease in professional service fees; • Partially offset by a $916,000 increase in net interest income due primarily to the impact of lower deposit costs, driven by the decrease in the federal funds rate, reflecting the full quarter impact of the Federal Reserve lowering rates 100 basis points between September and December in 2024. This was partially offset by a decrease in interest income on loans held for investment due to lower loan yields primarily driven by the impact of interest rate cuts on our variable loan rate portfolio, as well as the lower day count in the first quarter. Adjusted operating earnings available to common shareholders1 decreased $9.8 million to $51.6 million for the first quarter compared to the prior quarter, primarily driven by the net impact of the following items: • An increase in adjusted noninterest expense1 , as described above excluding merger-related costs; • A decrease in adjusted operating noninterest income1 , as described above; • Partially offset by an increase in net interest income, as described above. SUMMARIZED INCOME STATEMENT 1Q2025 4Q2024 Net interest income $184,164 $183,248 - Provision for credit losses 17,638 17,496 + Noninterest income 29,163 35,227 - Noninterest expense 134,184 129,675 - Taxes 11,687 13,519 Net income (GAAP) $49,818 $57,785 - Dividends on preferred stock 2,967 2,967 Net income available to common shareholders (GAAP) $46,851 $54,818 + Merger-related costs, net of tax 4,643 6,592 - (Loss) gain on sale of securities, net of tax (81) 13 Adjusted operating earnings available to common shareholders (non-GAAP)1 $51,575 $61,397 EARNINGS METRICS 1Q2025 4Q2024 Net Income available to common shareholders $46,851 $54,818 Common EPS, diluted $0.52 $0.60 ROE 6.35% 7.23% ROTCE (non-GAAP)1 12.04% 13.77% ROA 0.82% 0.92% Efficiency ratio 62.90% 59.35% Efficiency ratio (FTE)1 61.81% 58.34% Net interest margin 3.38% 3.26% Net interest margin (FTE)1 3.45% 3.33% ADJUSTED OPERATING EARNINGS METRICS - NON-GAAP1 1Q2025 4Q2024 Adjusted operating earnings available to common shareholders $ 51,575 $61,397 Adjusted operating common EPS, diluted $0.57 $0.67 Adjusted operating ROA 0.90% 1.03% Adjusted operating ROTCE 13.15% 15.30% Adjusted operating efficiency ratio (FTE) 57.02% 52.67% Adjusted operating earnings PTPP $84,185 $ 95,796 PTPP = Pre-tax Pre-provision |
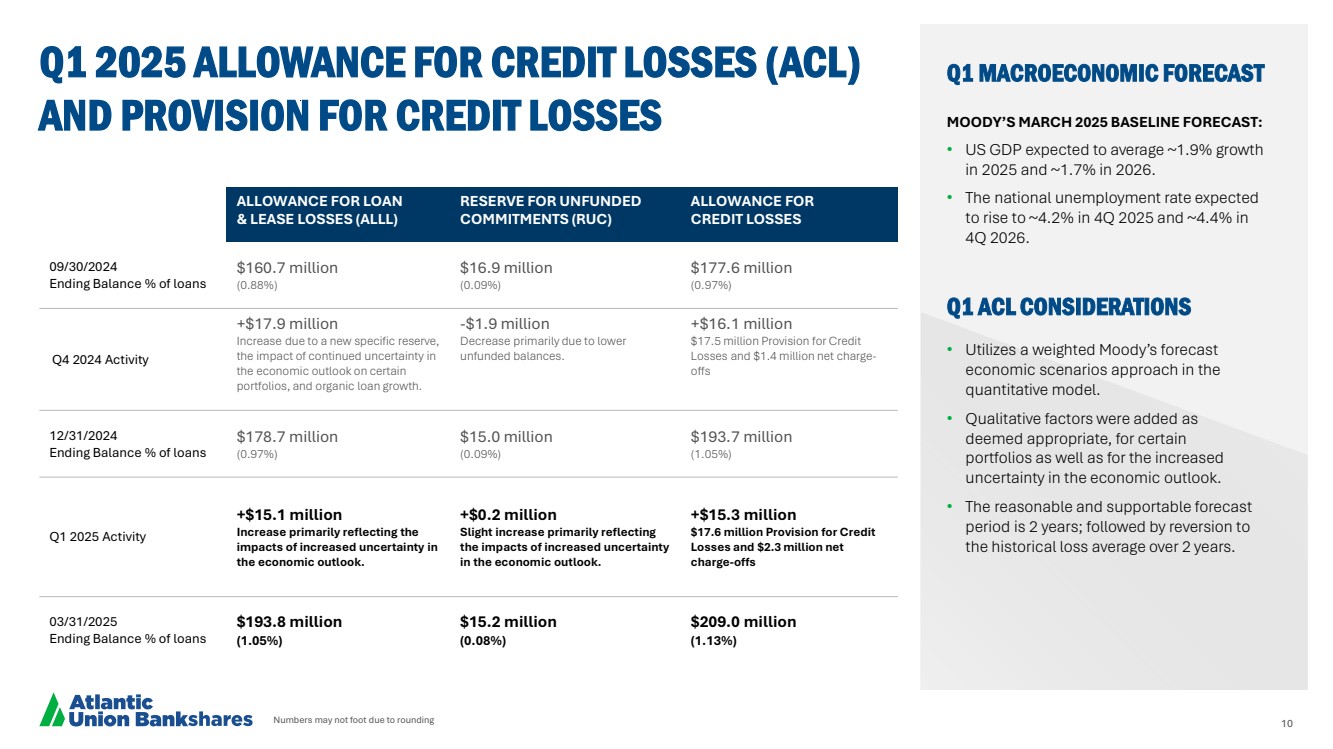
| 10 Numbers may not foot due to rounding Q1 2025 ALLOWANCE FOR CREDIT LOSSES (ACL) AND PROVISION FOR CREDIT LOSSES Q1 MACROECONOMIC FORECAST Q1 ACL CONSIDERATIONS MOODY’S MARCH 2025 BASELINE FORECAST: • US GDP expected to average ~1.9% growth in 2025 and ~1.7% in 2026. • The national unemployment rate expected to rise to ~4.2% in 4Q 2025 and ~4.4% in 4Q 2026. • Utilizes a weighted Moody’s forecast economic scenarios approach in the quantitative model. • Qualitative factors were added as deemed appropriate, for certain portfolios as well as for the increased uncertainty in the economic outlook. • The reasonable and supportable forecast period is 2 years; followed by reversion to the historical loss average over 2 years. ALLOWANCE FOR LOAN & LEASE LOSSES (ALLL) RESERVE FOR UNFUNDED COMMITMENTS (RUC) ALLOWANCE FOR CREDIT LOSSES 09/30/2024 Ending Balance % of loans $160.7 million (0.88%) $16.9 million (0.09%) $177.6 million (0.97%) Q4 2024 Activity +$17.9 million Increase due to a new specific reserve, the impact of continued uncertainty in the economic outlook on certain portfolios, and organic loan growth. -$1.9 million Decrease primarily due to lower unfunded balances. +$16.1 million $17.5 million Provision for Credit Losses and $1.4 million net charge-offs 12/31/2024 Ending Balance % of loans $178.7 million (0.97%) $15.0 million (0.09%) $193.7 million (1.05%) Q1 2025 Activity +$15.1 million Increase primarily reflecting the impacts of increased uncertainty in the economic outlook. +$0.2 million Slight increase primarily reflecting the impacts of increased uncertainty in the economic outlook. +$15.3 million $17.6 million Provision for Credit Losses and $2.3 million net charge-offs 03/31/2025 Ending Balance % of loans $193.8 million (1.05%) $15.2 million (0.08%) $209.0 million (1.13%) |
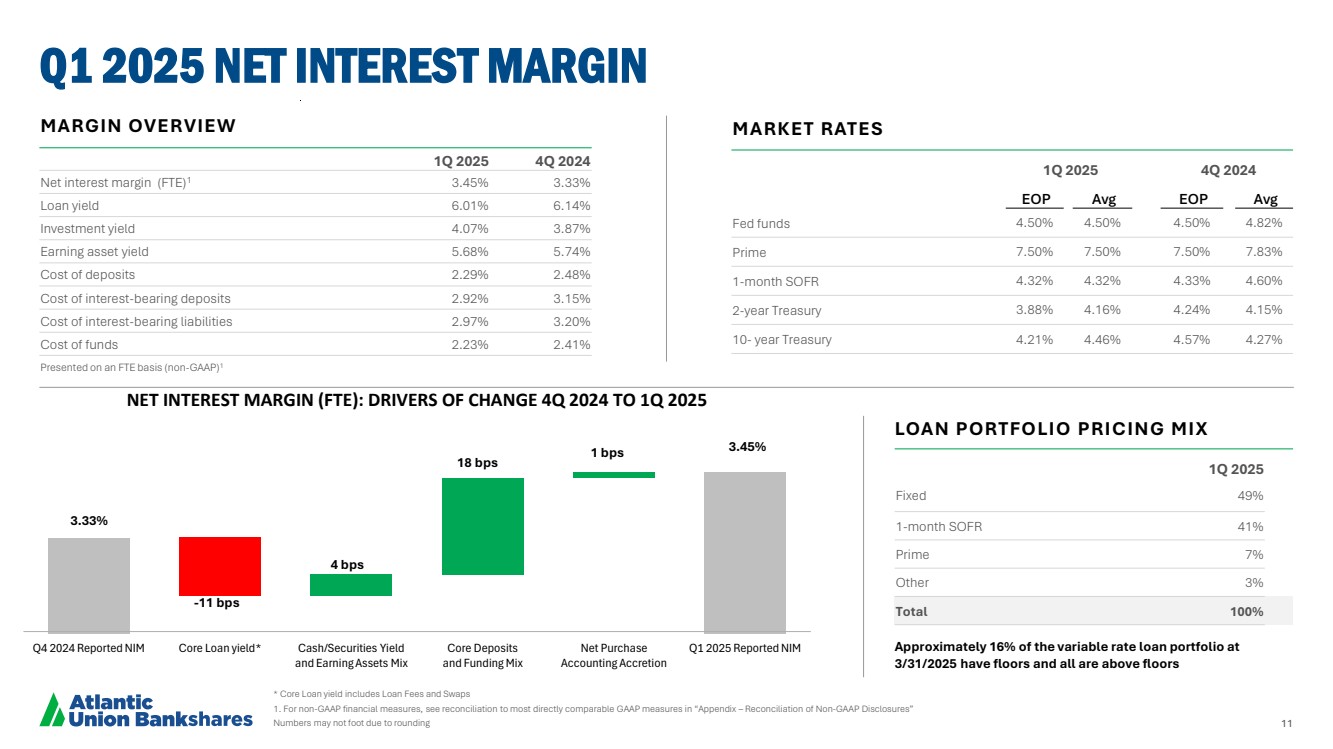
| 11 Q4 2024 Reported NIM Core Loan yield* Cash/Securities Yield and Earning Assets Mix Core Deposits and Funding Mix Net Purchase Accounting Accretion Q1 2025 Reported NIM NET INTEREST MARGIN (FTE): DRIVERS OF CHANGE 4Q 2024 TO 1Q 2025 * Core Loan yield includes Loan Fees and Swaps 1. For non-GAAP financial measures, see reconciliation to most directly comparable GAAP measures in “Appendix – Reconciliation of Non-GAAP Disclosures” Numbers may not foot due to rounding Q1 2025 NET INTEREST MARGIN MARKET RATES 1Q 2025 4Q 2024 EOP Avg EOP Avg Fed funds 4.50% 4.50% 4.50% 4.82% Prime 7.50% 7.50% 7.50% 7.83% 1-month SOFR 4.32% 4.32% 4.33% 4.60% 2-year Treasury 3.88% 4.16% 4.24% 4.15% 10- year Treasury 4.21% 4.46% 4.57% 4.27% MARGIN OVERVIEW 1Q 2025 4Q 2024 Net interest margin (FTE)1 3.45% 3.33% Loan yield 6.01% 6.14% Investment yield 4.07% 3.87% Earning asset yield 5.68% 5.74% Cost of deposits 2.29% 2.48% Cost of interest-bearing deposits 2.92% 3.15% Cost of interest-bearing liabilities 2.97% 3.20% Cost of funds 2.23% 2.41% Presented on an FTE basis (non-GAAP)1 Approximately 16% of the variable rate loan portfolio at 3/31/2025 have floors and all are above floors LOAN PORTFOLIO PRICING MIX 1Q 2025 Fixed 49% 1-month SOFR 41% Prime 7% Other 3% Total 100% 3.33% -11 bps 18 bps 1 bps 4 bps 3.45% |
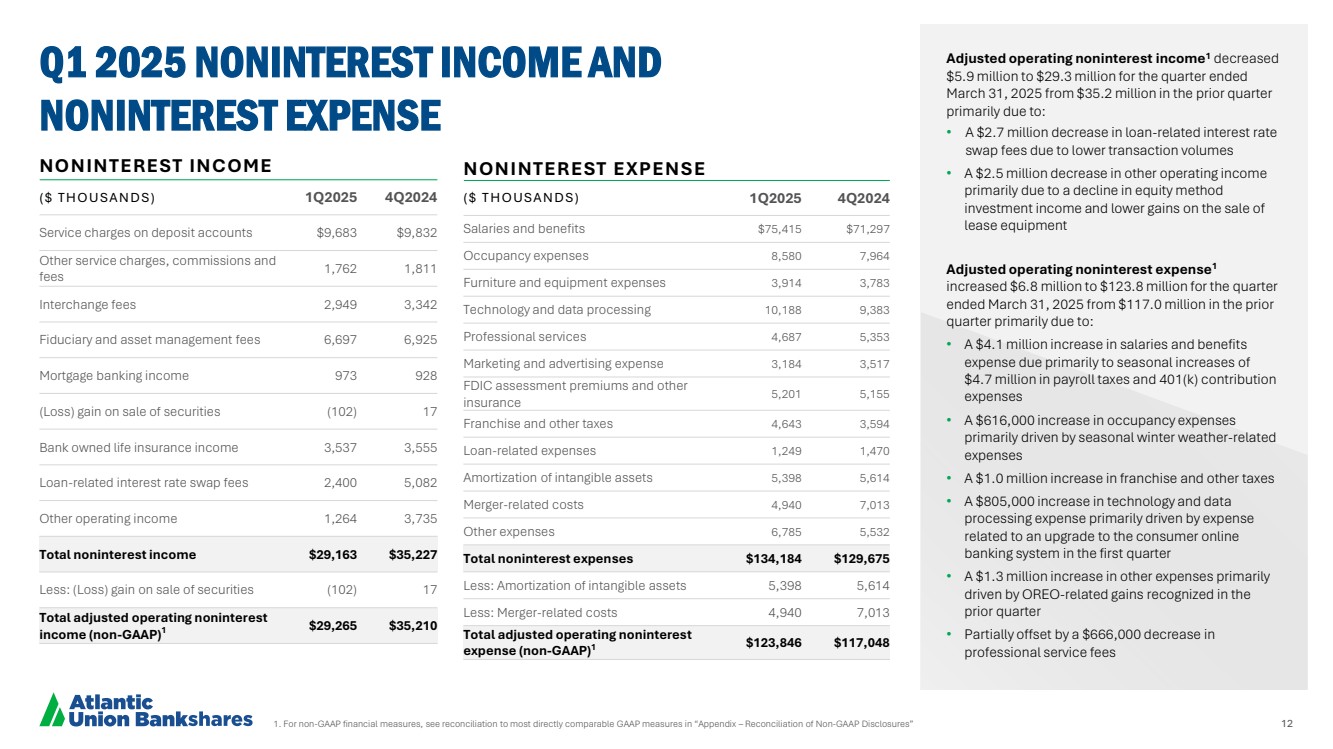
| 1. For non-GAAP financial measures, see reconciliation to most directly comparable GAAP measures in “Appendix – Reconciliation of Non-GAAP Disclosures” 12 Q1 2025 NONINTEREST INCOME AND NONINTEREST EXPENSE Adjusted operating noninterest income1 decreased $5.9 million to $29.3 million for the quarter ended March 31, 2025 from $35.2 million in the prior quarter primarily due to: • A $2.7 million decrease in loan-related interest rate swap fees due to lower transaction volumes • A $2.5 million decrease in other operating income primarily due to a decline in equity method investment income and lower gains on the sale of lease equipment Adjusted operating noninterest expense1 increased $6.8 million to $123.8 million for the quarter ended March 31, 2025 from $117.0 million in the prior quarter primarily due to: • A $4.1 million increase in salaries and benefits expense due primarily to seasonal increases of $4.7 million in payroll taxes and 401(k) contribution expenses • A $616,000 increase in occupancy expenses primarily driven by seasonal winter weather-related expenses • A $1.0 million increase in franchise and other taxes • A $805,000 increase in technology and data processing expense primarily driven by expense related to an upgrade to the consumer online banking system in the first quarter • A $1.3 million increase in other expenses primarily driven by OREO-related gains recognized in the prior quarter • Partially offset by a $666,000 decrease in professional service fees NONINTEREST EXPENSE ( $ T H O U S A N D S ) 1Q2025 4Q2024 Salaries and benefits $75,415 $71,297 Occupancy expenses 8,580 7,964 Furniture and equipment expenses 3,914 3,783 Technology and data processing 10,188 9,383 Professional services 4,687 5,353 Marketing and advertising expense 3,184 3,517 FDIC assessment premiums and other insurance 5,201 5,155 Franchise and other taxes 4,643 3,594 Loan-related expenses 1,249 1,470 Amortization of intangible assets 5,398 5,614 Merger-related costs 4,940 7,013 Other expenses 6,785 5,532 Total noninterest expenses $134,184 $129,675 Less: Amortization of intangible assets 5,398 5,614 Less: Merger-related costs 4,940 7,013 Total adjusted operating noninterest expense (non-GAAP)1 $123,846 $117,048 NONINTEREST INCOME ( $ T H O U S A N D S ) 1Q2025 4Q2024 Service charges on deposit accounts $9,683 $9,832 Other service charges, commissions and fees 1,762 1,811 Interchange fees 2,949 3,342 Fiduciary and asset management fees 6,697 6,925 Mortgage banking income 973 928 (Loss) gain on sale of securities (102) 17 Bank owned life insurance income 3,537 3,555 Loan-related interest rate swap fees 2,400 5,082 Other operating income 1,264 3,735 Total noninterest income $29,163 $35,227 Less: (Loss) gain on sale of securities (102) 17 Total adjusted operating noninterest income (non-GAAP)1 $29,265 $35,210 |
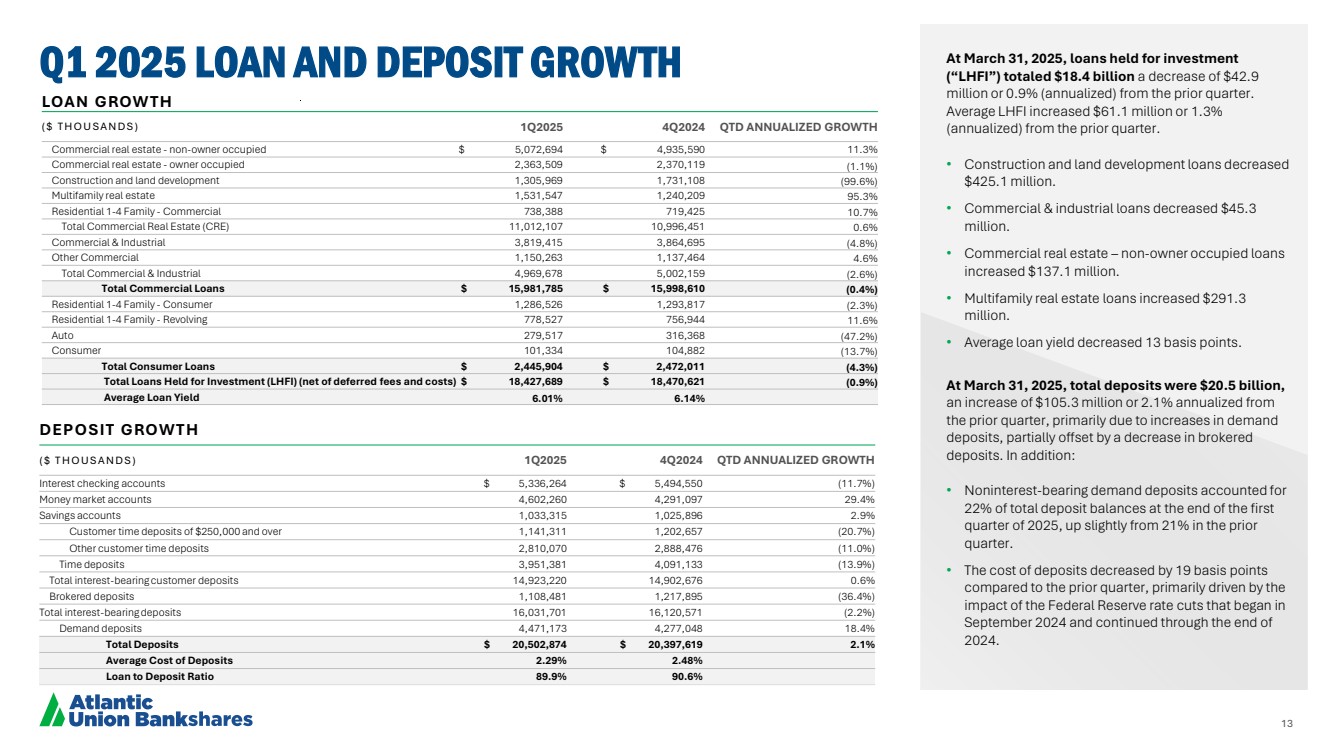
| 13 Q1 2025 LOAN AND DEPOSIT GROWTH LOAN GROWTH ( $ T H O U S A N D S ) 1Q2025 4Q2024 QTD ANNUALIZED GROWTH Commercial real estate - non-owner occupied $ 5,072,694 $ 4,935,590 11.3% Commercial real estate - owner occupied 2,363,509 2,370,119 (1.1%) Construction and land development 1,305,969 1,731,108 (99.6%) Multifamily real estate 1,531,547 1,240,209 95.3% Residential 1-4 Family - Commercial 738,388 719,425 10.7% Total Commercial Real Estate (CRE) 11,012,107 10,996,451 0.6% Commercial & Industrial 3,819,415 3,864,695 (4.8%) Other Commercial 1,150,263 1,137,464 4.6% Total Commercial & Industrial 4,969,678 5,002,159 (2.6%) Total Commercial Loans $ 15,981,785 $ 15,998,610 (0.4%) Residential 1-4 Family - Consumer 1,286,526 1,293,817 (2.3%) Residential 1-4 Family - Revolving 778,527 756,944 11.6% Auto 279,517 316,368 (47.2%) Consumer 101,334 104,882 (13.7%) Total Consumer Loans $ 2,445,904 $ 2,472,011 (4.3%) Total Loans Held for Investment (LHFI) (net of deferred fees and costs) $ 18,427,689 $ 18,470,621 (0.9%) Average Loan Yield 6.01% 6.14% DEPOSIT GROWTH ( $ T H O U S A N D S ) 1Q2025 4Q2024 QTD ANNUALIZED GROWTH Interest checking accounts $ 5,336,264 $ 5,494,550 (11.7%) Money market accounts 4,602,260 4,291,097 29.4% Savings accounts 1,033,315 1,025,896 2.9% Customer time deposits of $250,000 and over 1,141,311 1,202,657 (20.7%) Other customer time deposits 2,810,070 2,888,476 (11.0%) Time deposits 3,951,381 4,091,133 (13.9%) Total interest-bearing customer deposits 14,923,220 14,902,676 0.6% Brokered deposits 1,108,481 1,217,895 (36.4%) Total interest-bearing deposits 16,031,701 16,120,571 (2.2%) Demand deposits 4,471,173 4,277,048 18.4% Total Deposits $ 20,502,874 $ 20,397,619 2.1% Average Cost of Deposits 2.29% 2.48% Loan to Deposit Ratio 89.9% 90.6% At March 31, 2025, loans held for investment (“LHFI”) totaled $18.4 billion a decrease of $42.9 million or 0.9% (annualized) from the prior quarter. Average LHFI increased $61.1 million or 1.3% (annualized) from the prior quarter. • Construction and land development loans decreased $425.1 million. • Commercial & industrial loans decreased $45.3 million. • Commercial real estate – non-owner occupied loans increased $137.1 million. • Multifamily real estate loans increased $291.3 million. • Average loan yield decreased 13 basis points. At March 31, 2025, total deposits were $20.5 billion, an increase of $105.3 million or 2.1% annualized from the prior quarter, primarily due to increases in demand deposits, partially offset by a decrease in brokered deposits. In addition: • Noninterest-bearing demand deposits accounted for 22% of total deposit balances at the end of the first quarter of 2025, up slightly from 21% in the prior quarter. • The cost of deposits decreased by 19 basis points compared to the prior quarter, primarily driven by the impact of the Federal Reserve rate cuts that began in September 2024 and continued through the end of 2024. |
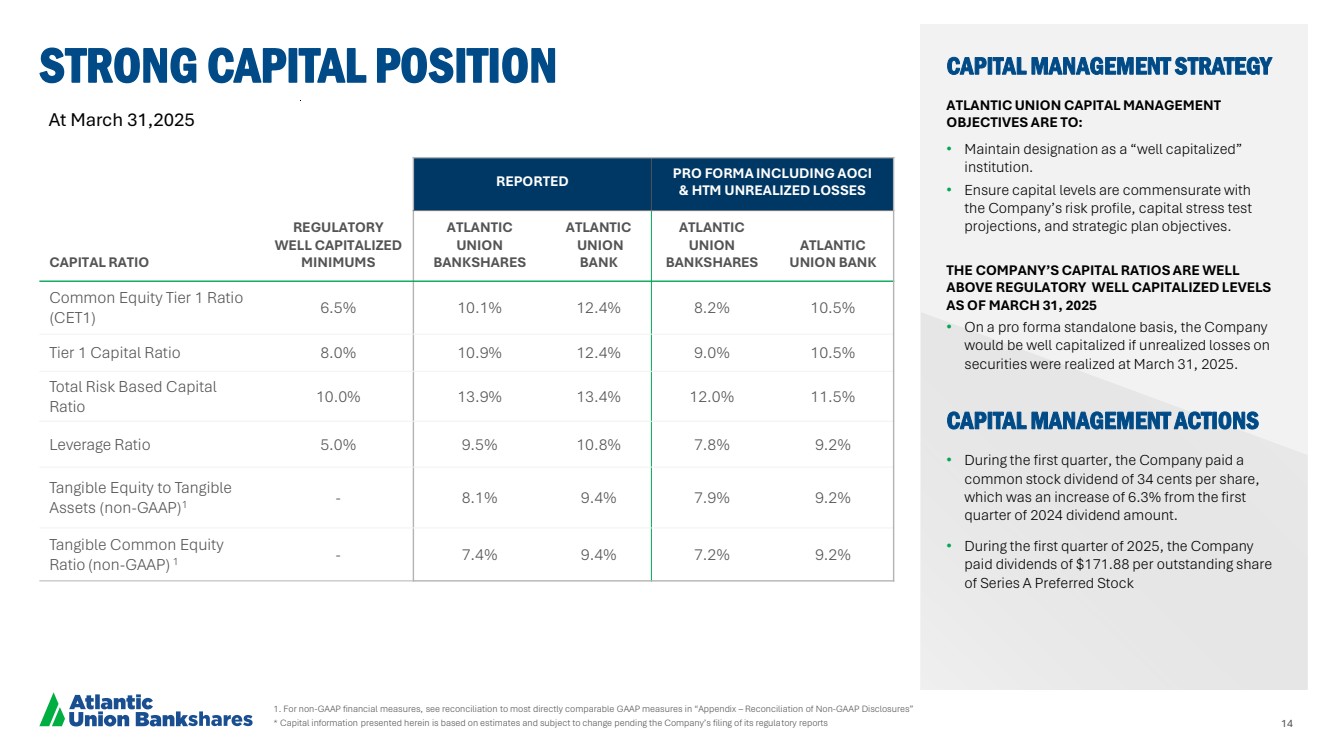
| 14 CAPITAL RATIO REGULATORY WELL CAPITALIZED MINIMUMS REPORTED PRO FORMA INCLUDING AOCI & HTM UNREALIZED LOSSES ATLANTIC UNION BANKSHARES ATLANTIC UNION BANK ATLANTIC UNION BANKSHARES ATLANTIC UNION BANK Common Equity Tier 1 Ratio (CET1) 6.5% 10.1% 12.4% 8.2% 10.5% Tier 1 Capital Ratio 8.0% 10.9% 12.4% 9.0% 10.5% Total Risk Based Capital Ratio 10.0% 13.9% 13.4% 12.0% 11.5% Leverage Ratio 5.0% 9.5% 10.8% 7.8% 9.2% Tangible Equity to Tangible Assets (non-GAAP)1 - 8.1% 9.4% 7.9% 9.2% Tangible Common Equity Ratio (non-GAAP) 1 - 7.4% 9.4% 7.2% 9.2% 1. For non-GAAP financial measures, see reconciliation to most directly comparable GAAP measures in “Appendix – Reconciliation of Non-GAAP Disclosures” * Capital information presented herein is based on estimates and subject to change pending the Company’s filing of its regulatory reports STRONG CAPITAL POSITION CAPITAL MANAGEMENT STRATEGY ATLANTIC UNION CAPITAL MANAGEMENT OBJECTIVES ARE TO: • Maintain designation as a “well capitalized” institution. • Ensure capital levels are commensurate with the Company’s risk profile, capital stress test projections, and strategic plan objectives. THE COMPANY’S CAPITAL RATIOS ARE WELL ABOVE REGULATORY WELL CAPITALIZED LEVELS AS OF MARCH 31, 2025 • On a pro forma standalone basis, the Company would be well capitalized if unrealized losses on securities were realized at March 31, 2025. CAPITAL MANAGEMENT ACTIONS • During the first quarter, the Company paid a common stock dividend of 34 cents per share, which was an increase of 6.3% from the first quarter of 2024 dividend amount. • During the first quarter of 2025, the Company paid dividends of $171.88 per outstanding share of Series A Preferred Stock At March 31,2025 |
| Including Sandy Spring franchise footprint AUB FRANCHISE PERSPECTIVES |
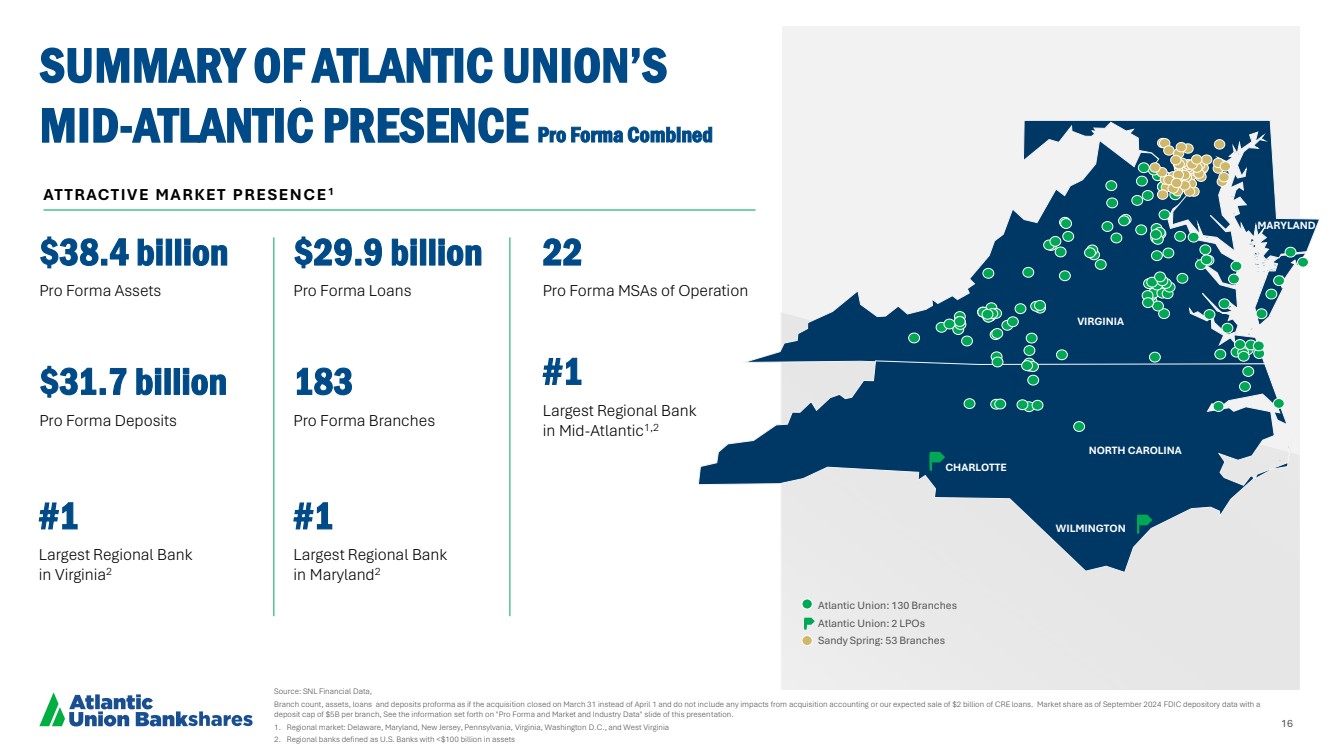
| 16 VIRGINIA NORTH CAROLINA CHARLOTTE WILMINGTON MARYLAND Atlantic Union: 130 Branches Atlantic Union: 2 LPOs Sandy Spring: 53 Branches #1 Largest Regional Bank in Mid-Atlantic1,2 22 Pro Forma MSAs of Operation #1 Largest Regional Bank in Virginia2 #1 Largest Regional Bank in Maryland2 183 Pro Forma Branches $38.4 billion Pro Forma Assets Source: SNL Financial Data, Branch count, assets, loans and deposits proforma as if the acquisition closed on March 31 instead of April 1 and do not include any impacts from acquisition accounting or our expected sale of $2 billion of CRE loans. Market share as of September 2024 FDIC depository data with a deposit cap of $5B per branch, See the information set forth on "Pro Forma and Market and Industry Data" slide of this presentation. 1. Regional market: Delaware, Maryland, New Jersey, Pennsylvania, Virginia, Washington D.C., and West Virginia 2. Regional banks defined as U.S. Banks with <$100 billion in assets SUMMARY OF ATLANTIC UNION’S MID-ATLANTIC PRESENCE Pro Forma Combined ATTRACTIVE MARKET PRESENCE1 $31.7 billion Pro Forma Deposits $29.9 billion Pro Forma Loans |
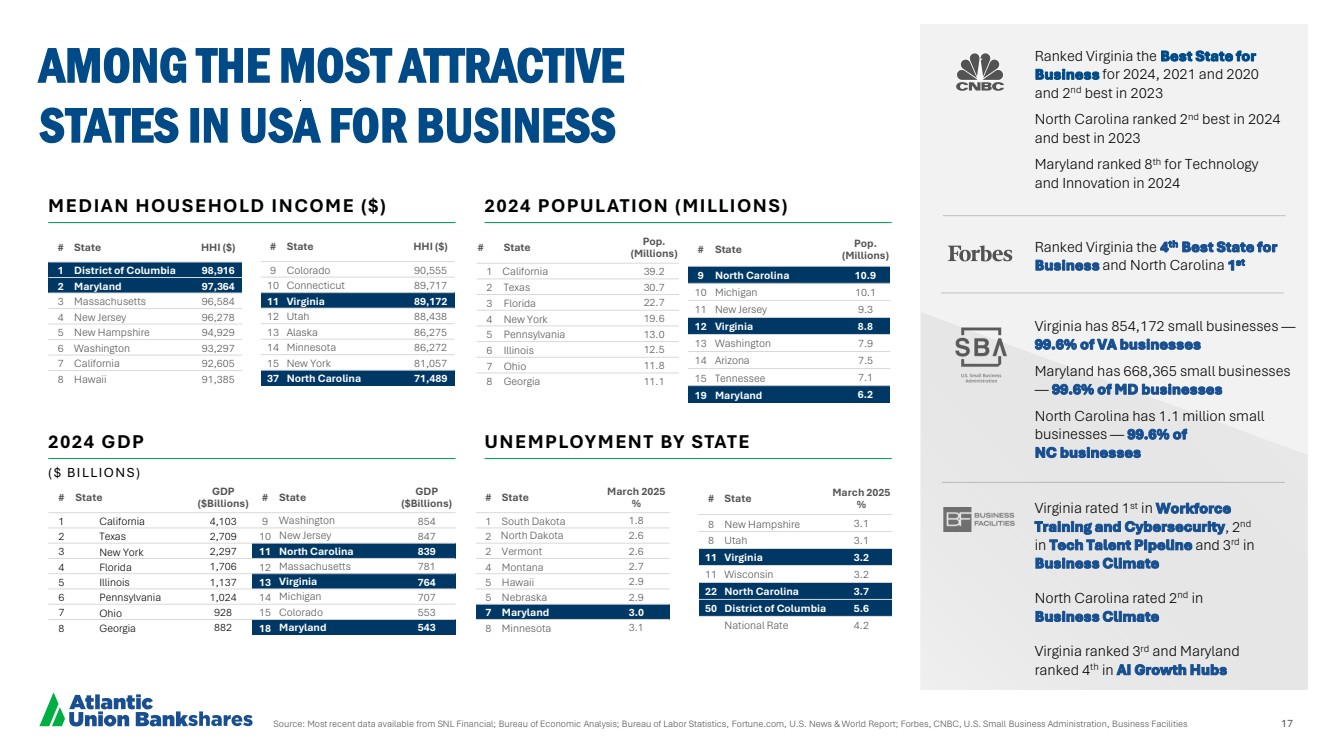
| Source: Most recent data available from SNL Financial; Bureau of Economic Analysis; Bureau of Labor Statistics, Fortune.com, U.S. News & World Report; Forbes, CNBC, U.S. Small Business Administration, Business Facilities 17 AMONG THE MOST ATTRACTIVE STATES IN USA FOR BUSINESS Virginia rated 1 st in Workforce Training and Cybersecurity, 2 nd in Tech Talent Pipeline and 3 rd in Business Climate North Carolina rated 2 nd in Business Climate Virginia ranked 3 rd and Maryland ranked 4 th in AI Growth Hubs # State March 2025 % 1 South Dakota 1.8 2 North Dakota 2.6 2 Vermont 2.6 4 Montana 2.7 5 Hawaii 2.9 5 Nebraska 2.9 7 Maryland 3.0 8 Minnesota 3.1 # State Pop. (Millions) 1 California 39.2 2 Texas 30.7 3 Florida 22.7 4 New York 19.6 5 Pennsylvania 13.0 6 Illinois 12.5 7 Ohio 11.8 8 Georgia 11.1 # State HHI ($) 1 District of Columbia 98,916 2 Maryland 97,364 3 Massachusetts 96,584 4 New Jersey 96,278 5 New Hampshire 94,929 6 Washington 93,297 7 California 92,605 8 Hawaii 91,385 # State GDP ($Billions) 1 California 4,103 2 Texas 2,709 3 New York 2,297 4 Florida 1,706 5 Illinois 1,137 6 Pennsylvania 1,024 7 Ohio 928 8 Georgia 882 # State Pop. (Millions) 9 North Carolina 10.9 10 Michigan 10.1 11 New Jersey 9.3 12 Virginia 8.8 13 Washington 7.9 14 Arizona 7.5 15 Tennessee 7.1 19 Maryland 6.2 # State HHI ($) 9 Colorado 90,555 10 Connecticut 89,717 11 Virginia 89,172 12 Utah 88,438 13 Alaska 86,275 14 Minnesota 86,272 15 New York 81,057 37 North Carolina 71,489 # State March 2025 % 8 New Hampshire 3.1 8 Utah 3.1 11 Virginia 3.2 11 Wisconsin 3.2 22 North Carolina 3.7 50 District of Columbia 5.6 National Rate 4.2 # State GDP ($Billions) 9 Washington 854 10 New Jersey 847 11 North Carolina 839 12 Massachusetts 781 13 Virginia 764 14 Michigan 707 15 Colorado 553 18 Maryland 543 Ranked Virginia the Best State for Business for 2024, 2021 and 2020 and 2nd best in 2023 North Carolina ranked 2nd best in 2024 and best in 2023 Maryland ranked 8th for Technology and Innovation in 2024 Ranked Virginia the 4 th Best State for Business and North Carolina 1 st Virginia has 854,172 small businesses — 99.6% of VA businesses Maryland has 668,365 small businesses — 99.6% of MD businesses North Carolina has 1.1 million small businesses — 99.6% of NC businesses MEDIAN HOUSEHOLD INCOME ($) 2024 POPULATION (MILLIONS) 2024 GDP UNEMPLOYMENT BY STATE ( $ B I LLI O N S ) |
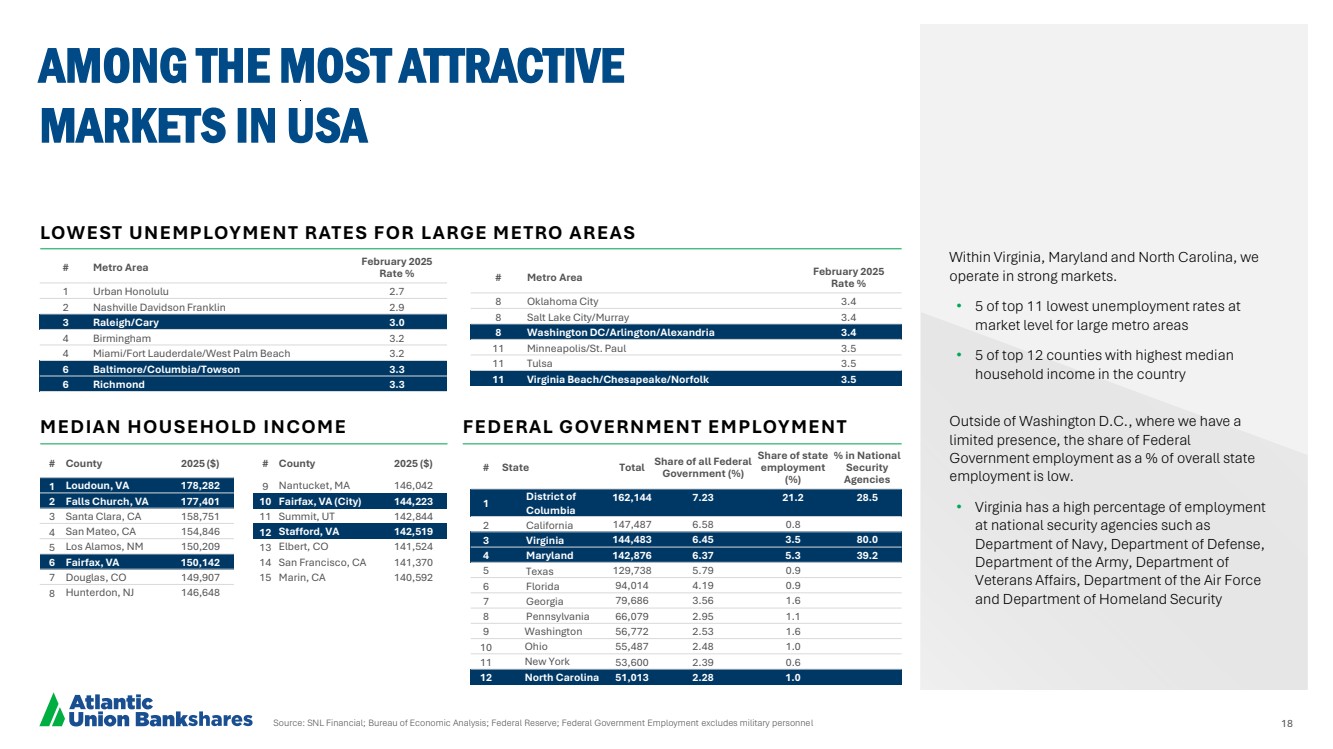
| Source: SNL Financial; Bureau of Economic Analysis; Federal Reserve; Federal Government Employment excludes military personnel 18 AMONG THE MOST ATTRACTIVE MARKETS IN USA # County 2025 ($) 1 Loudoun, VA 178,282 2 Falls Church, VA 177,401 3 Santa Clara, CA 158,751 4 San Mateo, CA 154,846 5 Los Alamos, NM 150,209 6 Fairfax, VA 150,142 7 Douglas, CO 149,907 8 Hunterdon, NJ 146,648 # State Total Share of all Federal Government (%) Share of state employment (%) % in National Security Agencies 1 District of Columbia 162,144 7.23 21.2 28.5 2 California 147,487 6.58 0.8 3 Virginia 144,483 6.45 3.5 80.0 4 Maryland 142,876 6.37 5.3 39.2 5 Texas 129,738 5.79 0.9 6 Florida 94,014 4.19 0.9 7 Georgia 79,686 3.56 1.6 8 Pennsylvania 66,079 2.95 1.1 9 Washington 56,772 2.53 1.6 10 Ohio 55,487 2.48 1.0 11 New York 53,600 2.39 0.6 12 North Carolina 51,013 2.28 1.0 # Metro Area February 2025 Rate % 8 Oklahoma City 3.4 8 Salt Lake City/Murray 3.4 8 Washington DC/Arlington/Alexandria 3.4 11 Minneapolis/St. Paul 3.5 11 Tulsa 3.5 11 Virginia Beach/Chesapeake/Norfolk 3.5 # County 2025 ($) 9 Nantucket, MA 146,042 10 Fairfax, VA (City) 144,223 11 Summit, UT 142,844 12 Stafford, VA 142,519 13 Elbert, CO 141,524 14 San Francisco, CA 141,370 15 Marin, CA 140,592 LOWEST UNEMPLOYMENT RATES FOR LARGE METRO AREAS MEDIAN HOUSEHOLD INCOME FEDERAL GOVERNMENT EMPLOYMENT # Metro Area February 2025 Rate % 1 Urban Honolulu 2.7 2 Nashville Davidson Franklin 2.9 3 Raleigh/Cary 3.0 4 Birmingham 3.2 4 Miami/Fort Lauderdale/West Palm Beach 3.2 6 Baltimore/Columbia/Towson 3.3 6 Richmond 3.3 Within Virginia, Maryland and North Carolina, we operate in strong markets. • 5 of top 11 lowest unemployment rates at market level for large metro areas • 5 of top 12 counties with highest median household income in the country Outside of Washington D.C., where we have a limited presence, the share of Federal Government employment as a % of overall state employment is low. • Virginia has a high percentage of employment at national security agencies such as Department of Navy, Department of Defense, Department of the Army, Department of Veterans Affairs, Department of the Air Force and Department of Homeland Security |
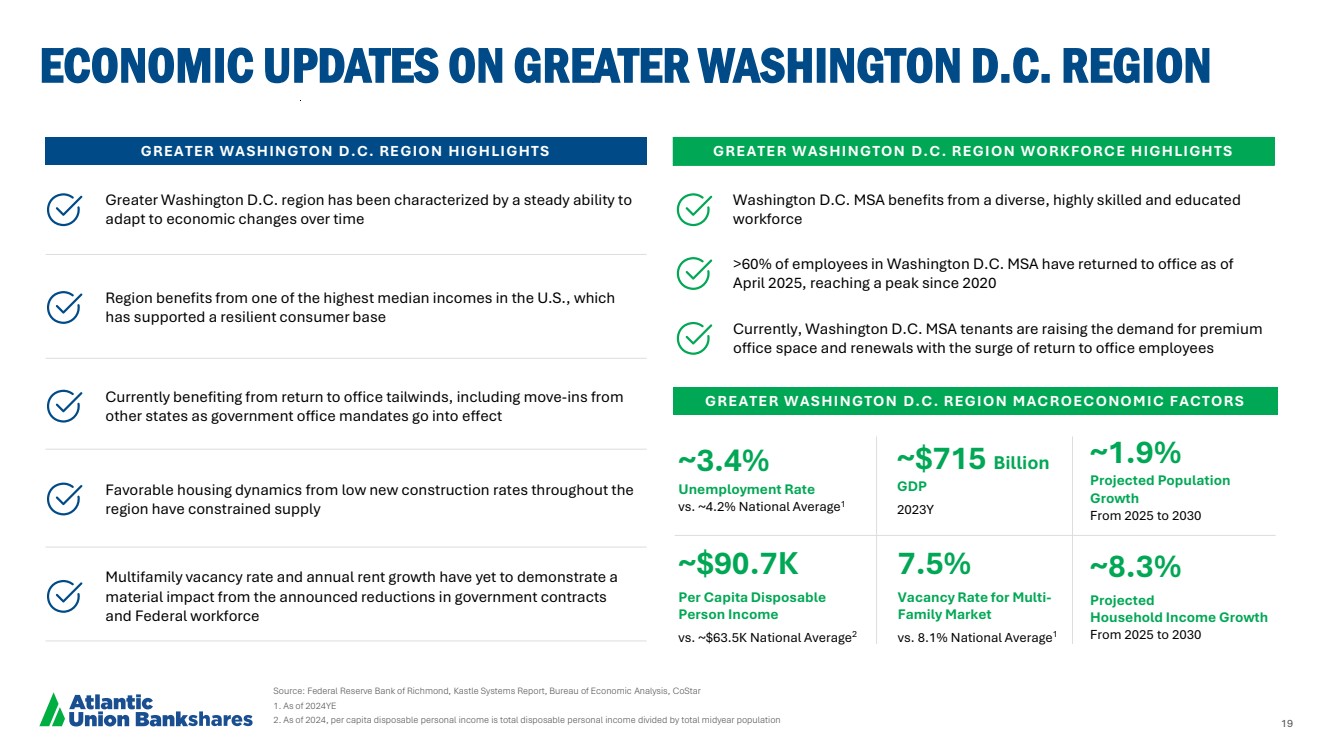
| 19 GREATER WASHINGTON D.C. REGION MACROECONOMIC FACTORS ~3.4% Unemployment Rate vs. ~4.2% National Average1 ~1.9% Projected Population Growth From 2025 to 2030 ~$715 Billion GDP 2023Y ~$90.7K Per Capita Disposable Person Income vs. ~$63.5K National Average2 7.5% Vacancy Rate for Multi-Family Market vs. 8.1% National Average1 ~8.3% Projected Household Income Growth From 2025 to 2030 Greater Washington D.C. region has been characterized by a steady ability to adapt to economic changes over time GREATER WASHINGTON D.C. REGION HIGHLIGHTS Region benefits from one of the highest median incomes in the U.S., which has supported a resilient consumer base Multifamily vacancy rate and annual rent growth have yet to demonstrate a material impact from the announced reductions in government contracts and Federal workforce Favorable housing dynamics from low new construction rates throughout the region have constrained supply Currently benefiting from return to office tailwinds, including move-ins from other states as government office mandates go into effect GREATER WASHINGTON D.C. REGION WORKFORCE HIGHLIGHTS >60% of employees in Washington D.C. MSA have returned to office as of April 2025, reaching a peak since 2020 Currently, Washington D.C. MSA tenants are raising the demand for premium office space and renewals with the surge of return to office employees Washington D.C. MSA benefits from a diverse, highly skilled and educated workforce Source: Federal Reserve Bank of Richmond, Kastle Systems Report, Bureau of Economic Analysis, CoStar 1. As of 2024YE 2. As of 2024, per capita disposable personal income is total disposable personal income divided by total midyear population ECONOMIC UPDATES ON GREATER WASHINGTON D.C. REGION |
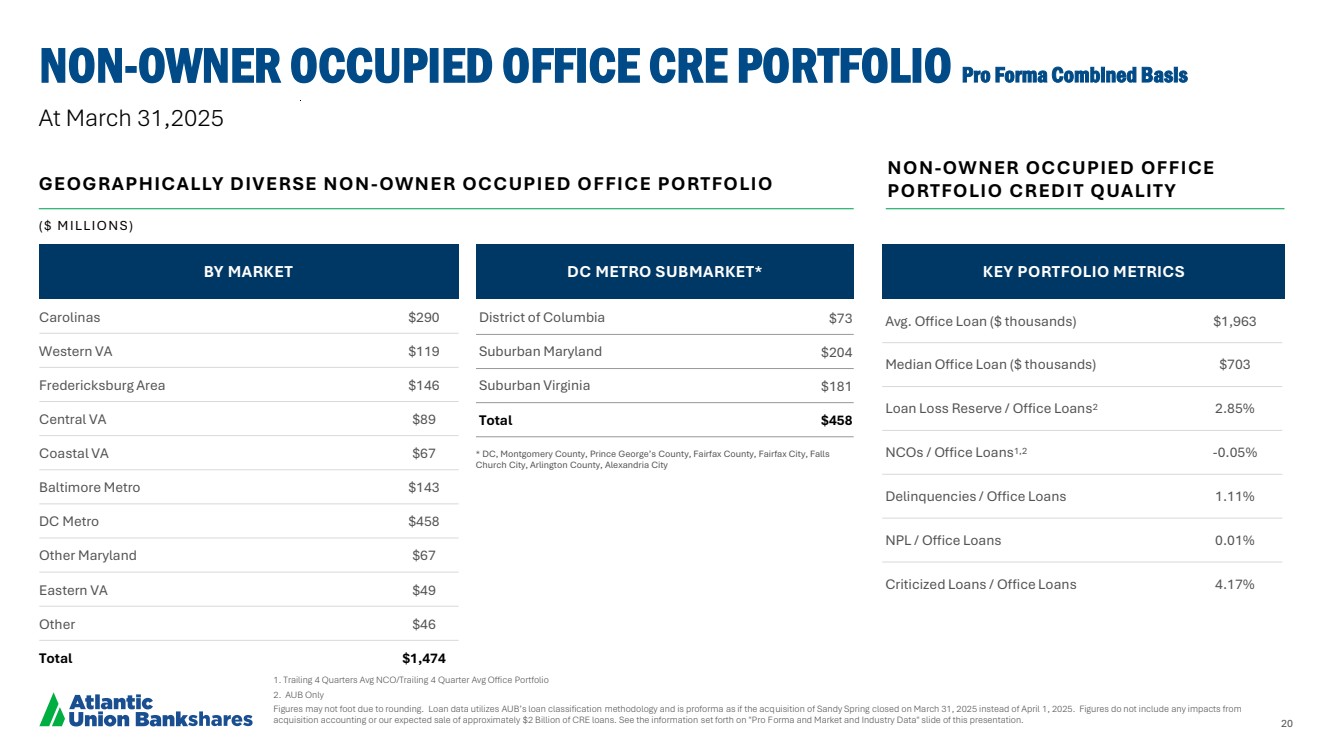
| 20 At March 31,2025 1. Trailing 4 Quarters Avg NCO/Trailing 4 Quarter Avg Office Portfolio 2. AUB Only Figures may not foot due to rounding. Loan data utilizes AUB’s loan classification methodology and is proforma as if the acquisition of Sandy Spring closed on March 31, 2025 instead of April 1, 2025. Figures do not include any impacts from acquisition accounting or our expected sale of approximately $2 Billion of CRE loans. See the information set forth on "Pro Forma and Market and Industry Data" slide of this presentation. NON-OWNER OCCUPIED OFFICE CRE PORTFOLIO Pro Forma Combined Basis NON-OWNER OCCUPIED OFFICE GEOGRAPHICALLY DIVERSE NON PORTFOLIO CREDIT QUALITY -OWNER OCCUPIED OFFICE PORTFOLIO * DC, Montgomery County, Prince George’s County, Fairfax County, Fairfax City, Falls Church City, Arlington County, Alexandria City ( $ M I LLI O N S ) Avg. Office Loan ($ thousands) $1,963 Median Office Loan ($ thousands) $703 Loan Loss Reserve / Office Loans2 2.85% NCOs / Office Loans1,2 -0.05% Delinquencies / Office Loans 1.11% NPL / Office Loans 0.01% Criticized Loans / Office Loans 4.17% Carolinas $290 Western VA $119 Fredericksburg Area $146 Central VA $89 Coastal VA $67 Baltimore Metro $143 DC Metro $458 Other Maryland $67 Eastern VA $49 Other $46 Total $1,474 District of Columbia $73 Suburban Maryland $204 Suburban Virginia $181 Total $458 BY MARKET DC METRO SUBMARKET* KEY PORTFOLIO METRICS |
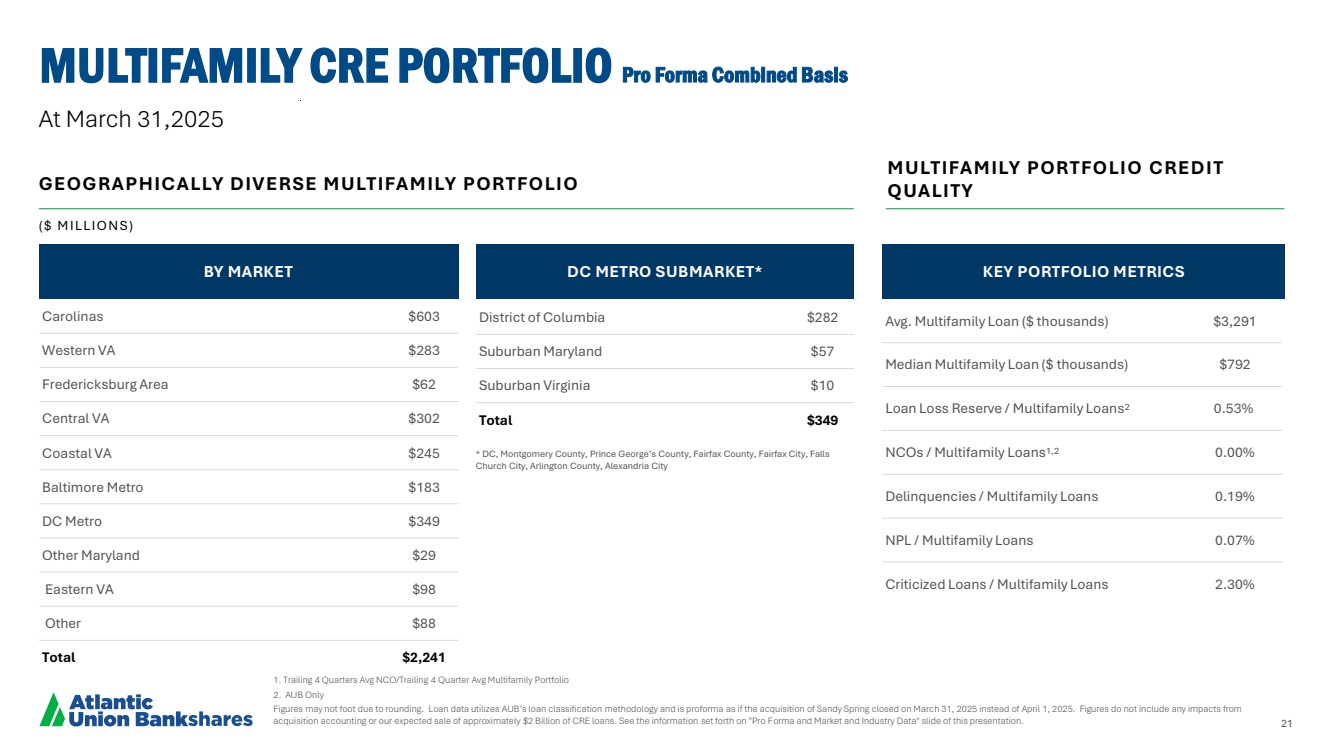
| 21 MULTIFAMILY CRE PORTFOLIO Pro Forma Combined Basis 1. Trailing 4 Quarters Avg NCO/Trailing 4 Quarter Avg Multifamily Portfolio 2. AUB Only Figures may not foot due to rounding. Loan data utilizes AUB’s loan classification methodology and is proforma as if the acquisition of Sandy Spring closed on March 31, 2025 instead of April 1, 2025. Figures do not include any impacts from acquisition accounting or our expected sale of approximately $2 Billion of CRE loans. See the information set forth on "Pro Forma and Market and Industry Data" slide of this presentation. Avg. Multifamily Loan ($ thousands) $3,291 Median Multifamily Loan ($ thousands) $792 Loan Loss Reserve / Multifamily Loans2 0.53% NCOs / Multifamily Loans1,2 0.00% Delinquencies / Multifamily Loans 0.19% NPL / Multifamily Loans 0.07% Criticized Loans / Multifamily Loans 2.30% Carolinas $603 Western VA $283 Fredericksburg Area $62 Central VA $302 Coastal VA $245 Baltimore Metro $183 DC Metro $349 Other Maryland $29 Eastern VA $98 Other $88 Total $2,241 At March 31,2025 District of Columbia $282 Suburban Maryland $57 Suburban Virginia $10 Total $349 * DC, Montgomery County, Prince George’s County, Fairfax County, Fairfax City, Falls Church City, Arlington County, Alexandria City BY MARKET MULTIFAMILY PORTFOLIO CREDIT GEOGRAPHICALLY DIVERSE MULTIFAMILY PORTFOLIO QUALITY DC METRO SUBMARKET* KEY PORTFOLIO METRICS ( $ M I LLI O N S ) |
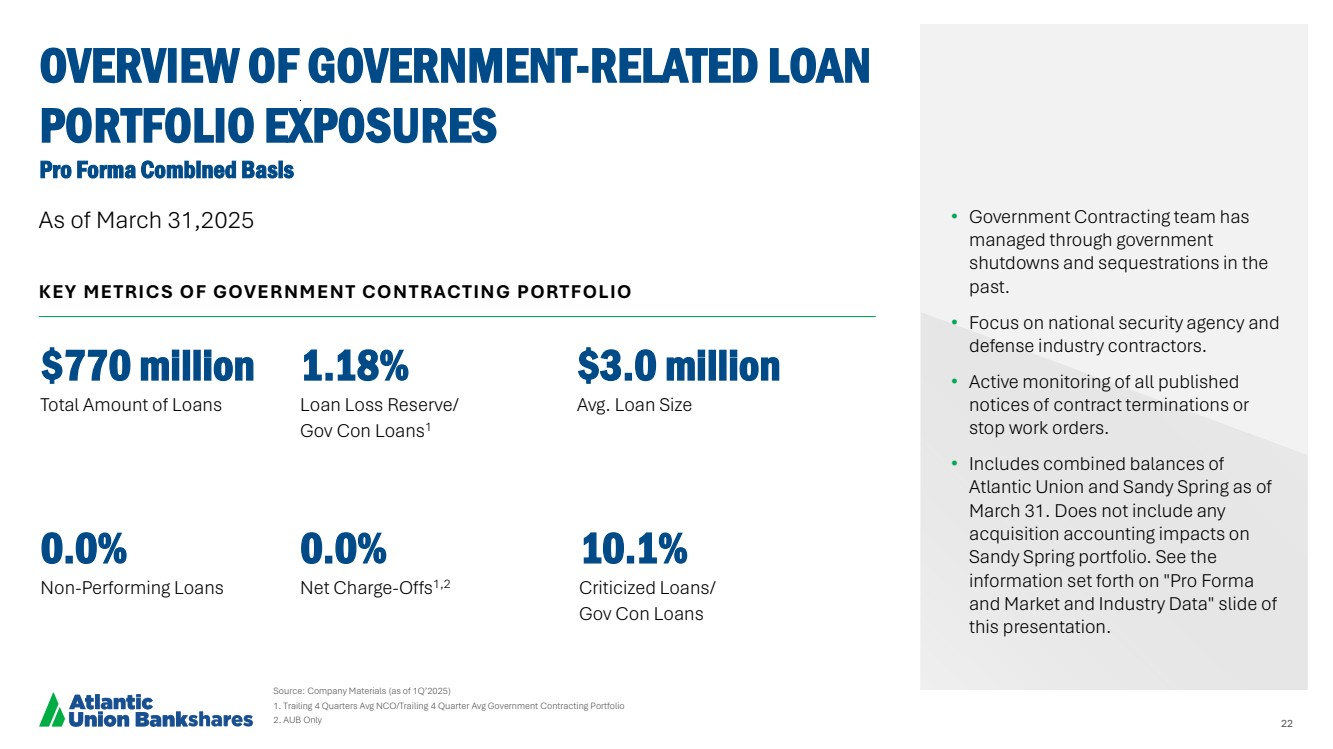
| 22 $770 million 1.18% $3.0 million Total Amount of Loans Loan Loss Reserve/ Gov Con Loans1 Avg. Loan Size 0.0% 0.0% 10.1% Non-Performing Loans Net Charge-Offs1,2 Criticized Loans/ Gov Con Loans Source: Company Materials (as of 1Q’2025) 1. Trailing 4 Quarters Avg NCO/Trailing 4 Quarter Avg Government Contracting Portfolio 2. AUB Only OVERVIEW OF GOVERNMENT-RELATED LOAN PORTFOLIO EXPOSURES Pro Forma Combined Basis • Government Contracting team has managed through government shutdowns and sequestrations in the past. • Focus on national security agency and defense industry contractors. • Active monitoring of all published notices of contract terminations or stop work orders. • Includes combined balances of Atlantic Union and Sandy Spring as of March 31. Does not include any acquisition accounting impacts on Sandy Spring portfolio. See the information set forth on "Pro Forma and Market and Industry Data" slide of this presentation. KEY METRICS OF GOVERNMENT CONTRACTING PORTFOLIO As of March 31,2025 |
| SANDY SPRING MERGER UPDATE |

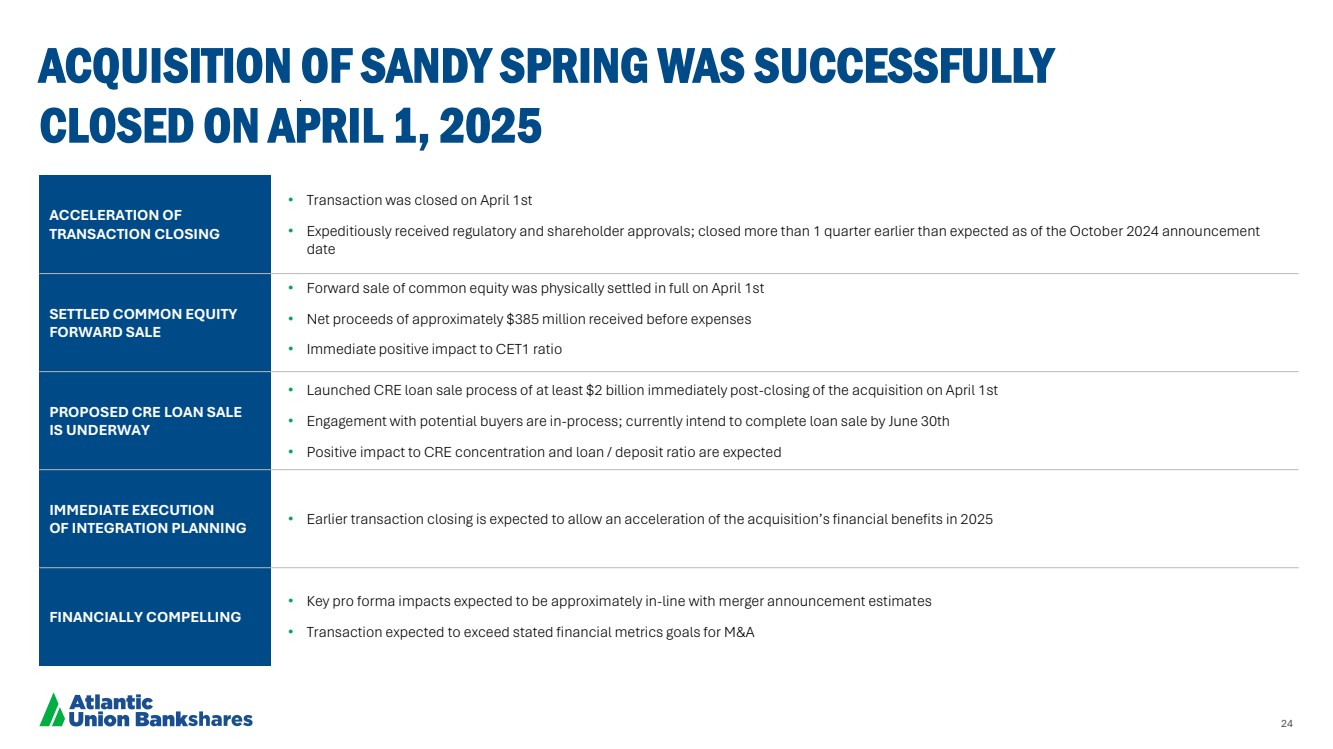
| 24 ACQUISITION OF SANDY SPRING WAS SUCCESSFULLY CLOSED ON APRIL 1, 2025 ACCELERATION OF TRANSACTION CLOSING • Transaction was closed on April 1st • Expeditiously received regulatory and shareholder approvals; closed more than 1 quarter earlier than expected as of the October 2024 announcement date SETTLED COMMON EQUITY FORWARD SALE • Forward sale of common equity was physically settled in full on April 1st • Net proceeds of approximately $385 million received before expenses • Immediate positive impact to CET1 ratio PROPOSED CRE LOAN SALE IS UNDERWAY • Launched CRE loan sale process of at least $2 billion immediately post-closing of the acquisition on April 1st • Engagement with potential buyers are in-process; currently intend to complete loan sale by June 30th • Positive impact to CRE concentration and loan / deposit ratio are expected IMMEDIATE EXECUTION OF INTEGRATION PLANNING • Earlier transaction closing is expected to allow an acceleration of the acquisition’s financial benefits in 2025 FINANCIALLY COMPELLING • Key pro forma impacts expected to be approximately in-line with merger announcement estimates • Transaction expected to exceed stated financial metrics goals for M&A |
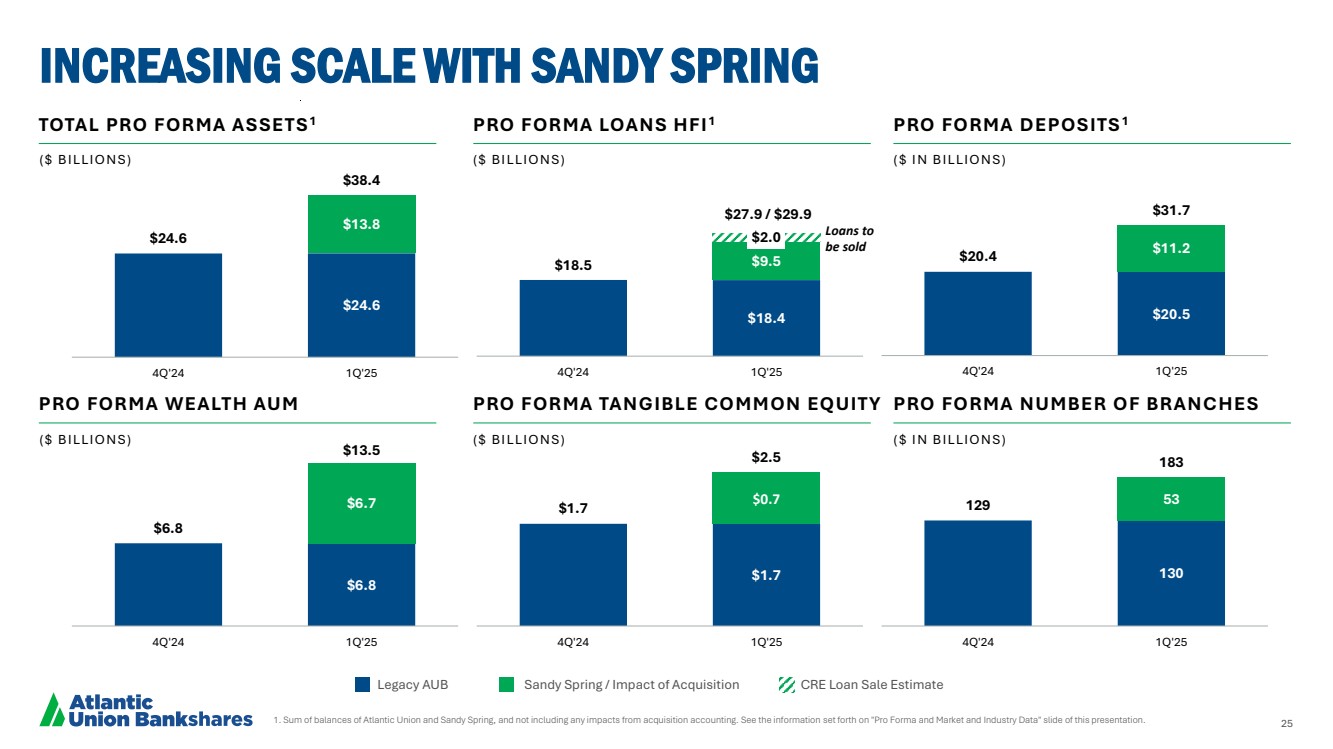
| 25 $18.4 $9.5 $2.0 $18.5 4Q'24 1Q'25 130 53 129 183 4Q'24 1Q'25 $1.7 $0.7 $1.7 $2.5 4Q'24 1Q'25 $6.8 $6.7 $6.8 $13.5 4Q'24 1Q'25 $20.5 $11.2 $20.4 $31.7 4Q'24 1Q'25 $24.6 $13.8 $24.6 $38.4 4Q'24 1Q'25 ( $ B I LLI O N S ) $27.9 / $29.9 Loans to be sold Legacy AUB Sandy Spring / Impact of Acquisition CRE Loan Sale Estimate INCREASING SCALE WITH SANDY SPRING 1. Sum of balances of Atlantic Union and Sandy Spring, and not including any impacts from acquisition accounting. See the information set forth on "Pro Forma and Market and Industry Data" slide of this presentation. TOTAL PRO FORMA ASSETS1 PRO FORMA LOANS HFI 1 PRO FORMA DEPOSITS1 ( $ B I LLI O N S ) ( $ I N B I LLI O N S ) ( $ B I LLI O N S ) PRO FORMA WEALTH AUM PRO FORMA TANGIBLE COMMON EQUITY PRO FORMA NUMBER OF BRANCHES ( $ B I LLI O N S ) ( $ I N B I LLI O N S ) |
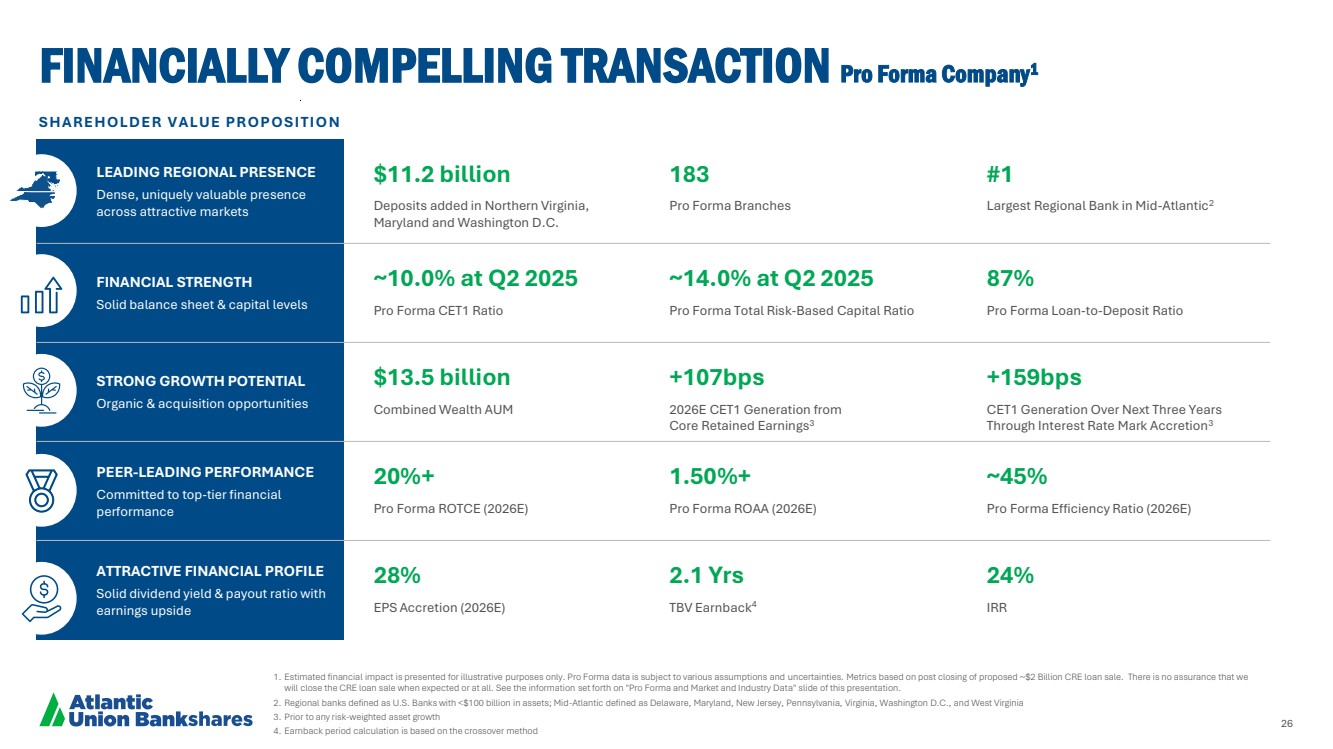
| 26 FINANCIALLY COMPELLING TRANSACTION Pro Forma Company1 1. Estimated financial impact is presented for illustrative purposes only. Pro Forma data is subject to various assumptions and uncertainties. Metrics based on post closing of proposed ~$2 Billion CRE loan sale. There is no assurance that we will close the CRE loan sale when expected or at all. See the information set forth on "Pro Forma and Market and Industry Data" slide of this presentation. 2. Regional banks defined as U.S. Banks with <$100 billion in assets; Mid-Atlantic defined as Delaware, Maryland, New Jersey, Pennsylvania, Virginia, Washington D.C., and West Virginia 3. Prior to any risk-weighted asset growth 4. Earnback period calculation is based on the crossover method LEADING REGIONAL PRESENCE Dense, uniquely valuable presence across attractive markets $11.2 billion Deposits added in Northern Virginia, Maryland and Washington D.C. 183 Pro Forma Branches #1 Largest Regional Bank in Mid-Atlantic2 FINANCIAL STRENGTH Solid balance sheet & capital levels ~10.0% at Q2 2025 Pro Forma CET1 Ratio ~14.0% at Q2 2025 Pro Forma Total Risk-Based Capital Ratio 87% Pro Forma Loan-to-Deposit Ratio STRONG GROWTH POTENTIAL Organic & acquisition opportunities $13.5 billion Combined Wealth AUM +107bps 2026E CET1 Generation from Core Retained Earnings3 +159bps CET1 Generation Over Next Three Years Through Interest Rate Mark Accretion3 PEER-LEADING PERFORMANCE Committed to top-tier financial performance 20%+ Pro Forma ROTCE (2026E) 1.50%+ Pro Forma ROAA (2026E) ~45% Pro Forma Efficiency Ratio (2026E) ATTRACTIVE FINANCIAL PROFILE Solid dividend yield & payout ratio with earnings upside 28% EPS Accretion (2026E) 2.1 Yrs TBV Earnback4 24% IRR SHAREHOLDER VALUE PROPOSITION |
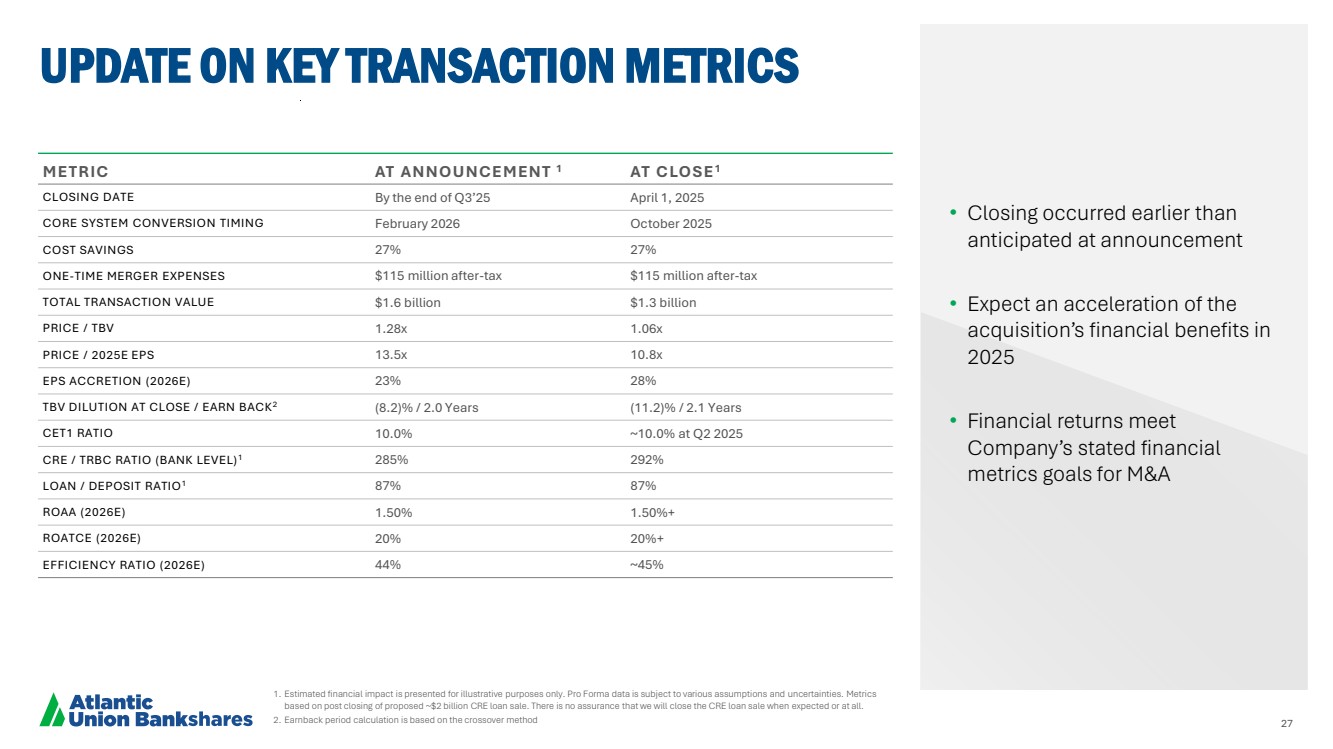
| 27 1. Estimated financial impact is presented for illustrative purposes only. Pro Forma data is subject to various assumptions and uncertainties. Metrics based on post closing of proposed ~$2 billion CRE loan sale. There is no assurance that we will close the CRE loan sale when expected or at all. 2. Earnback period calculation is based on the crossover method UPDATE ON KEY TRANSACTION METRICS METRIC AT ANNOUNCEMENT 1 AT CLOSE1 CLOSING DATE By the end of Q3’25 April 1, 2025 CORE SYSTEM CONVERSION TIMING February 2026 October 2025 COST SAVINGS 27% 27% ONE-TIME MERGER EXPENSES $115 million after-tax $115 million after-tax TOTAL TRANSACTION VALUE $1.6 billion $1.3 billion PRICE / TBV 1.28x 1.06x PRICE / 2025E EPS 13.5x 10.8x EPS ACCRETION (2026E) 23% 28% TBV DILUTION AT CLOSE / EARN BACK2 (8.2)% / 2.0 Years (11.2)% / 2.1 Years CET1 RATIO 10.0% ~10.0% at Q2 2025 CRE / TRBC RATIO (BANK LEVEL)1 285% 292% LOAN / DEPOSIT RATIO1 87% 87% ROAA (2026E) 1.50% 1.50%+ ROATCE (2026E) 20% 20%+ EFFICIENCY RATIO (2026E) 44% ~45% • Closing occurred earlier than anticipated at announcement • Expect an acceleration of the acquisition’s financial benefits in 2025 • Financial returns meet Company’s stated financial metrics goals for M&A |
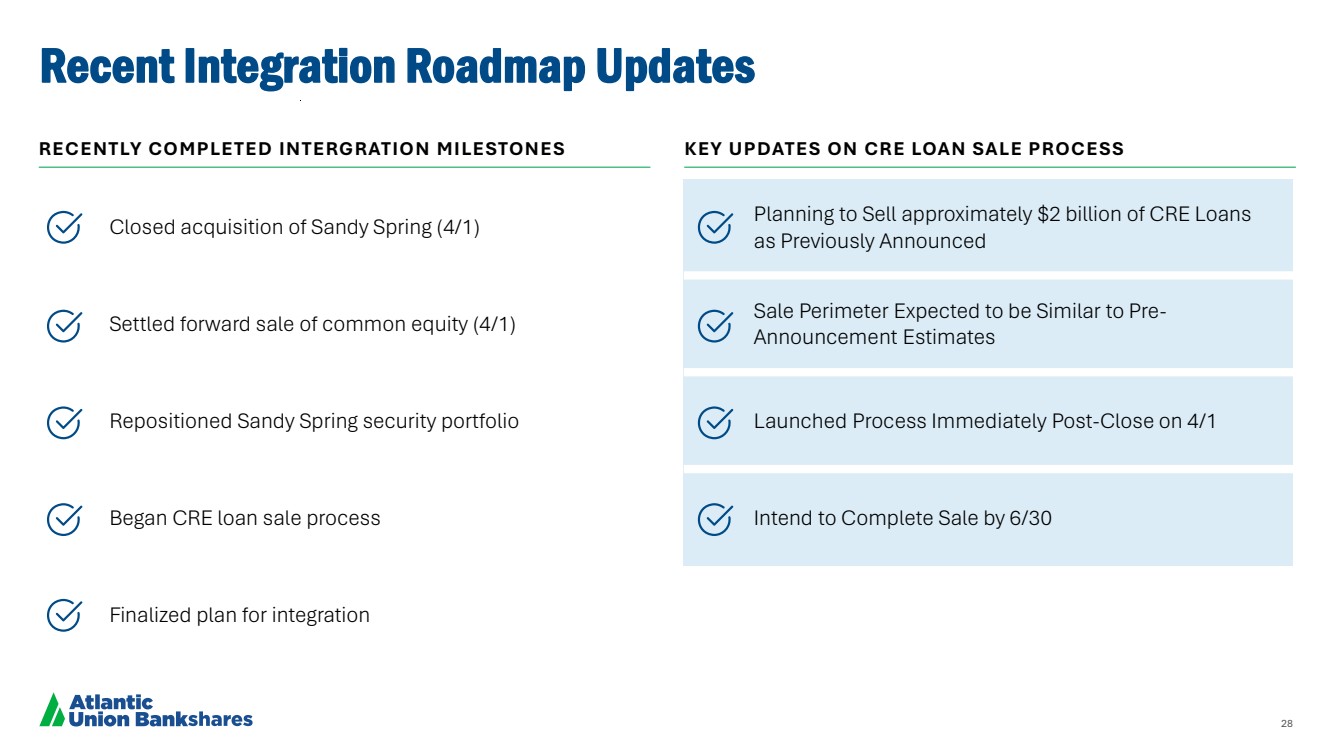
| 28 Closed acquisition of Sandy Spring (4/1) Planning to Sell approximately $2 billion of CRE Loans as Previously Announced Settled forward sale of common equity (4/1) Sale Perimeter Expected to be Similar to Pre-Announcement Estimates Repositioned Sandy Spring security portfolio Launched Process Immediately Post-Close on 4/1 Began CRE loan sale process Intend to Complete Sale by 6/30 Finalized plan for integration Recent Integration Roadmap Updates RECENTLY COMPLETED INTERGRATION MILESTONES KEY UPDATES ON CRE LOAN SALE PROCESS |
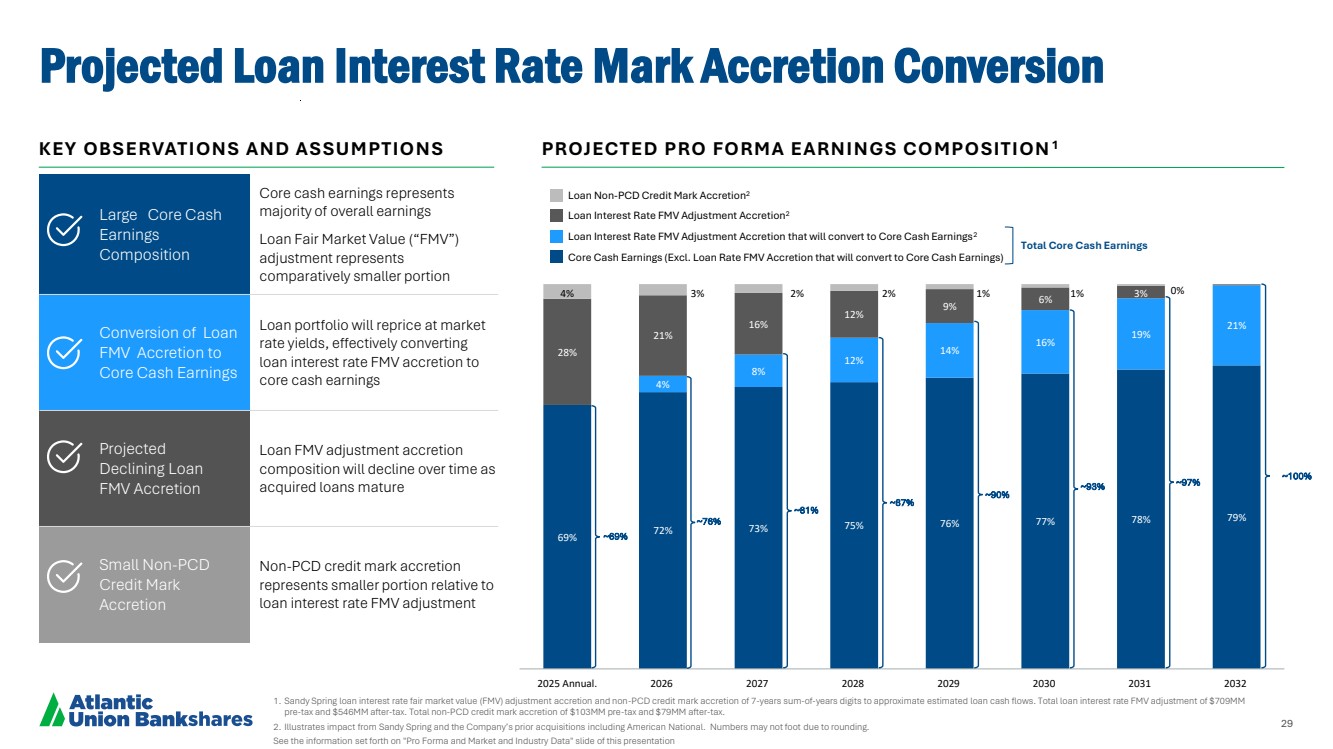
| 29 Core Cash Earnings (Excl. Loan Rate FMV Accretion that will convert to Core Cash Earnings) Loan Interest Rate FMV Adjustment Accretion that will convert to Core Cash Earnings2 Loan Interest Rate FMV Adjustment Accretion2 Total Core Cash Earnings Loan Non-PCD Credit Mark Accretion2 Projected Loan Interest Rate Mark Accretion Conversion 1. Sandy Spring loan interest rate fair market value (FMV) adjustment accretion and non-PCD credit mark accretion of 7-years sum-of-years digits to approximate estimated loan cash flows. Total loan interest rate FMV adjustment of $709MM pre-tax and $546MM after-tax. Total non-PCD credit mark accretion of $103MM pre-tax and $79MM after-tax. 2. Illustrates impact from Sandy Spring and the Company’s prior acquisitions including American National. Numbers may not foot due to rounding. See the information set forth on "Pro Forma and Market and Industry Data" slide of this presentation KEY OBSERVATIONS AND ASSUMPTIONS PROJECTED PRO FORMA EARNINGS COMPOSITION1 Large Core Cash Earnings Composition Core cash earnings represents majority of overall earnings Loan Fair Market Value (“FMV”) adjustment represents comparatively smaller portion Conversion of Loan FMV Accretion to Core Cash Earnings Loan portfolio will reprice at market rate yields, effectively converting loan interest rate FMV accretion to core cash earnings Projected Declining Loan FMV Accretion Loan FMV adjustment accretion composition will decline over time as acquired loans mature Small Non-PCD Credit Mark Accretion Non-PCD credit mark accretion represents smaller portion relative to loan interest rate FMV adjustment 69% 72% 73% 75% 76% 77% 78% 79% 4% 8% 12% 14% 16% 19% 21% 28% 21% 16% 12% 9% 6% 4% 3% 2% 2% 1% 1% 3% 0% 2025 Annual. 2026 2027 2028 2029 2030 2031 2032 ~69% ~76% ~81% ~87% ~90% ~93% ~97% ~100% |
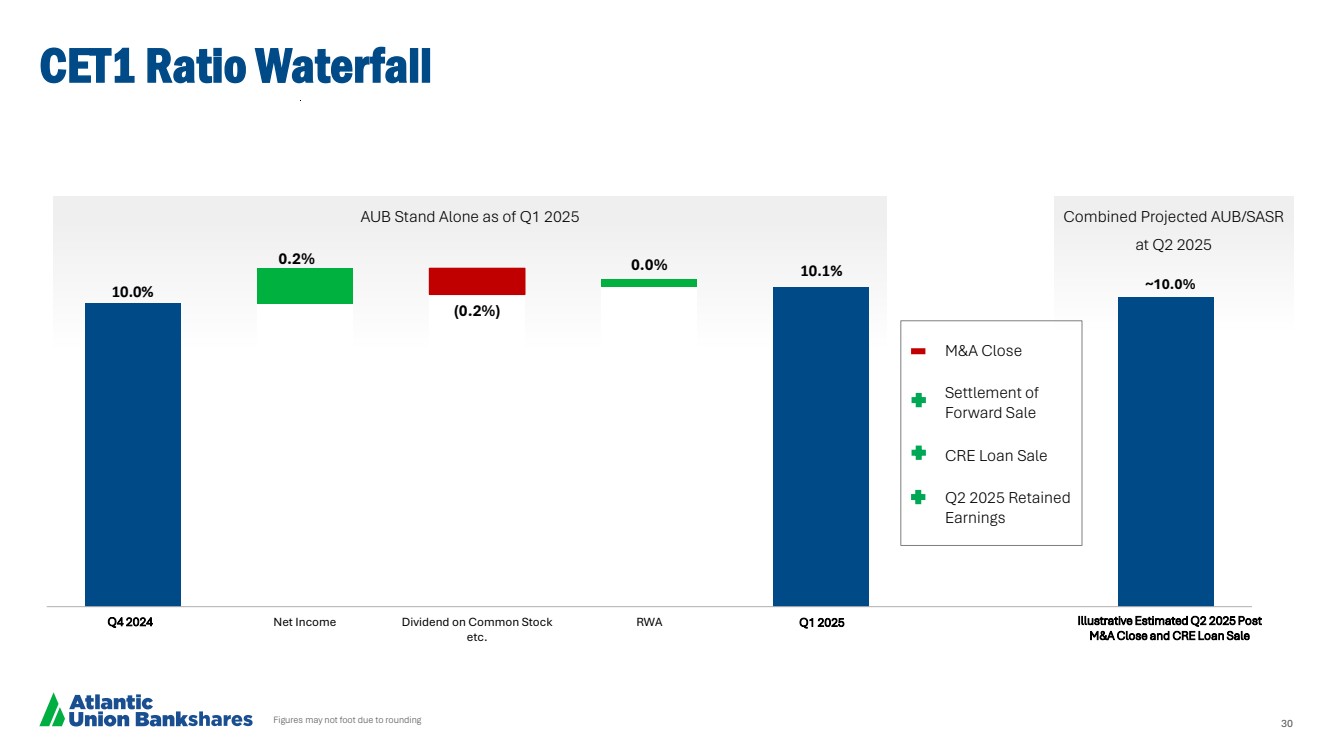
| 30 Combined Projected AUB/SASR at Q2 2025 AUB Stand Alone as of Q1 2025 10.0% 10.1% 0.2% (0.2%) 0.0% Q4'24 Net Income Dividend on Common Stock etc. RWA 1Q'25 Illustrative Post M&A Close and CRE Loan Sale ~10.0% M&A Close Settlement of Forward Sale CRE Loan Sale Q2 2025 Retained Earnings CET1 Ratio Waterfall Figures may not foot due to rounding Q4 2024 Q1 2025 Illustrative Estimated Q2 2025 Post M&A Close and CRE Loan Sale |
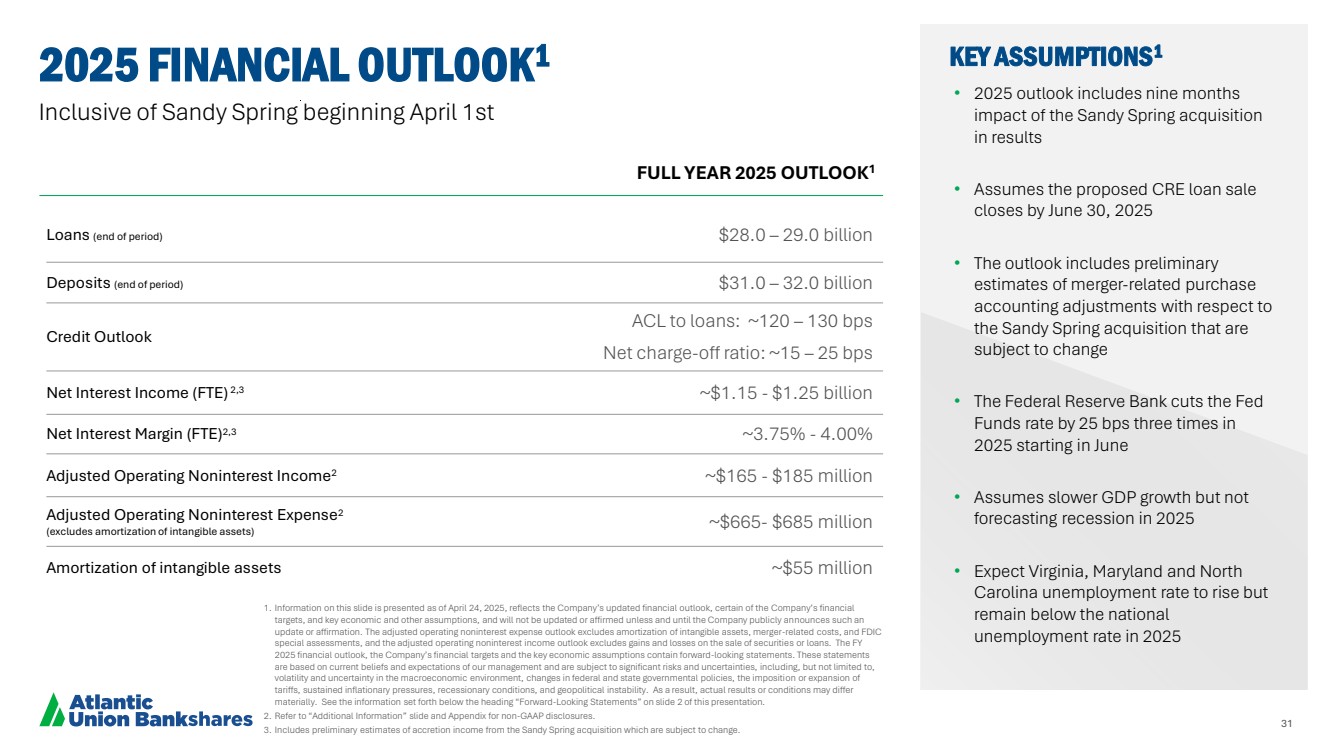
| 31 1. Information on this slide is presented as of April 24, 2025, reflects the Company’s updated financial outlook, certain of the Company’s financial targets, and key economic and other assumptions, and will not be updated or affirmed unless and until the Company publicly announces such an update or affirmation. The adjusted operating noninterest expense outlook excludes amortization of intangible assets, merger-related costs, and FDIC special assessments, and the adjusted operating noninterest income outlook excludes gains and losses on the sale of securities or loans. The FY 2025 financial outlook, the Company’s financial targets and the key economic assumptions contain forward-looking statements. These statements are based on current beliefs and expectations of our management and are subject to significant risks and uncertainties, including, but not limited to, volatility and uncertainty in the macroeconomic environment, changes in federal and state governmental policies, the imposition or expansion of tariffs, sustained inflationary pressures, recessionary conditions, and geopolitical instability. As a result, actual results or conditions may differ materially. See the information set forth below the heading “Forward-Looking Statements” on slide 2 of this presentation. 2. Refer to “Additional Information” slide and Appendix for non-GAAP disclosures. 3. Includes preliminary estimates of accretion income from the Sandy Spring acquisition which are subject to change. 2025 FINANCIAL OUTLOOK1 • 2025 outlook includes nine months impact of the Sandy Spring acquisition in results • Assumes the proposed CRE loan sale closes by June 30, 2025 • The outlook includes preliminary estimates of merger-related purchase accounting adjustments with respect to the Sandy Spring acquisition that are subject to change • The Federal Reserve Bank cuts the Fed Funds rate by 25 bps three times in 2025 starting in June • Assumes slower GDP growth but not forecasting recession in 2025 • Expect Virginia, Maryland and North Carolina unemployment rate to rise but remain below the national unemployment rate in 2025 Loans (end of period) $28.0 – 29.0 billion Deposits (end of period) $31.0 – 32.0 billion Credit Outlook ACL to loans: ~120 – 130 bps Net charge-off ratio: ~15 – 25 bps Net Interest Income (FTE) 2,3 ~$1.15 - $1.25 billion Net Interest Margin (FTE)2,3 ~3.75% - 4.00% Adjusted Operating Noninterest Income2 ~$165 - $185 million Adjusted Operating Noninterest Expense2 (excludes amortization of intangible assets) ~$665- $685 million Amortization of intangible assets ~$55 million KEY ASSUMPTIONS1 FULL YEAR 2025 OUTLOOK1 Inclusive of Sandy Spring beginning April 1st |
| Q1 2025 APPENDIX |

| 33 FEDERAL RESERVE BANK OF RICHMOND TARIFF ANALYSIS OF 5th DISTRICT • As of April 9, tariffs are not expected to have a disproportionate impact on AUB’s markets. • Industries directly impacted by higher tariffs include: textile manufacturing, furniture production, fabricated metals, wood products, miscellaneous manufacturing and agricultural support activities. − AUB has limited exposure to these industries and markets • https://www.richmondfed.org/publicat ions/research/economic_brief/2025/ Sources: Census Bureau International Trade Data and authors’ calculations. FIGURE 4C: AVERAGE EFFECTIVE TARIFF RATE BY COUNTY S C E N A R I O 2 , F I F T H F E D E R A L R E S E R V E D I S T R I C T AVERAGE TARIFF LEVEL |

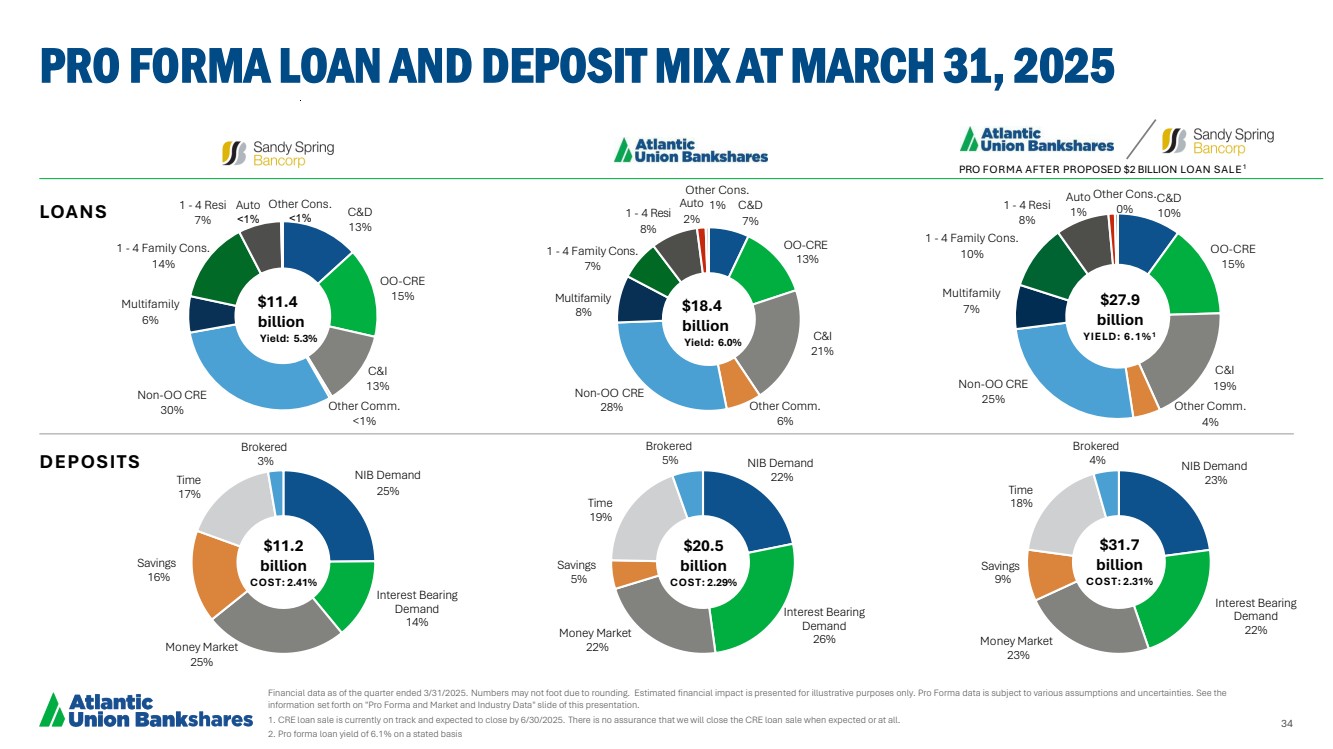
| 34 NIB Demand 23% Interest Bearing Demand 22% Money Market 23% Savings 9% Time 18% Brokered NIB Demand 4% 22% Interest Bearing Demand 26% Money Market 22% Savings 5% Time 19% Brokered 5% NIB Demand 25% Interest Bearing Demand 14% Money Market 25% Savings 16% Time 17% Brokered 3% PRO FORMA AFTER PROPOSED $2 BILLION LOAN SALE1 $11.2 billion COST: 2.41% $20.5 billion COST: 2.29% $31.7 billion COST: 2.31% LOANS DEPOSITS PRO FORMA LOAN AND DEPOSIT MIX AT MARCH 31, 2025 Financial data as of the quarter ended 3/31/2025. Numbers may not foot due to rounding. Estimated financial impact is presented for illustrative purposes only. Pro Forma data is subject to various assumptions and uncertainties. See the information set forth on "Pro Forma and Market and Industry Data" slide of this presentation. 1. CRE loan sale is currently on track and expected to close by 6/30/2025. There is no assurance that we will close the CRE loan sale when expected or at all. 2. Pro forma loan yield of 6.1% on a stated basis C&D 10% OO-CRE 15% C&I 19% Other Comm. 4% Non-OO CRE 25% Multifamily 7% 1 - 4 Family Cons. 10% 1 - 4 Resi 8% Auto 1% Other Cons. 0% $27.9 billion YIELD: 6.1%1 C&D 13% OO-CRE 15% C&I 13% Other Comm. <1% Non-OO CRE 30% Multifamily 6% 1 - 4 Family Cons. 14% 1 - 4 Resi 7% Auto <1% Other Cons. <1% C&D 7% OO-CRE 13% C&I 21% Other Comm. 6% Non-OO CRE 28% 1 - 4 Family Cons. 7% Auto 2% Other Cons. 1% $18.4 billion Yield: 6.0% Multifamily 8% 1 - 4 Resi 8% $11.4 billion Yield: 5.3% |
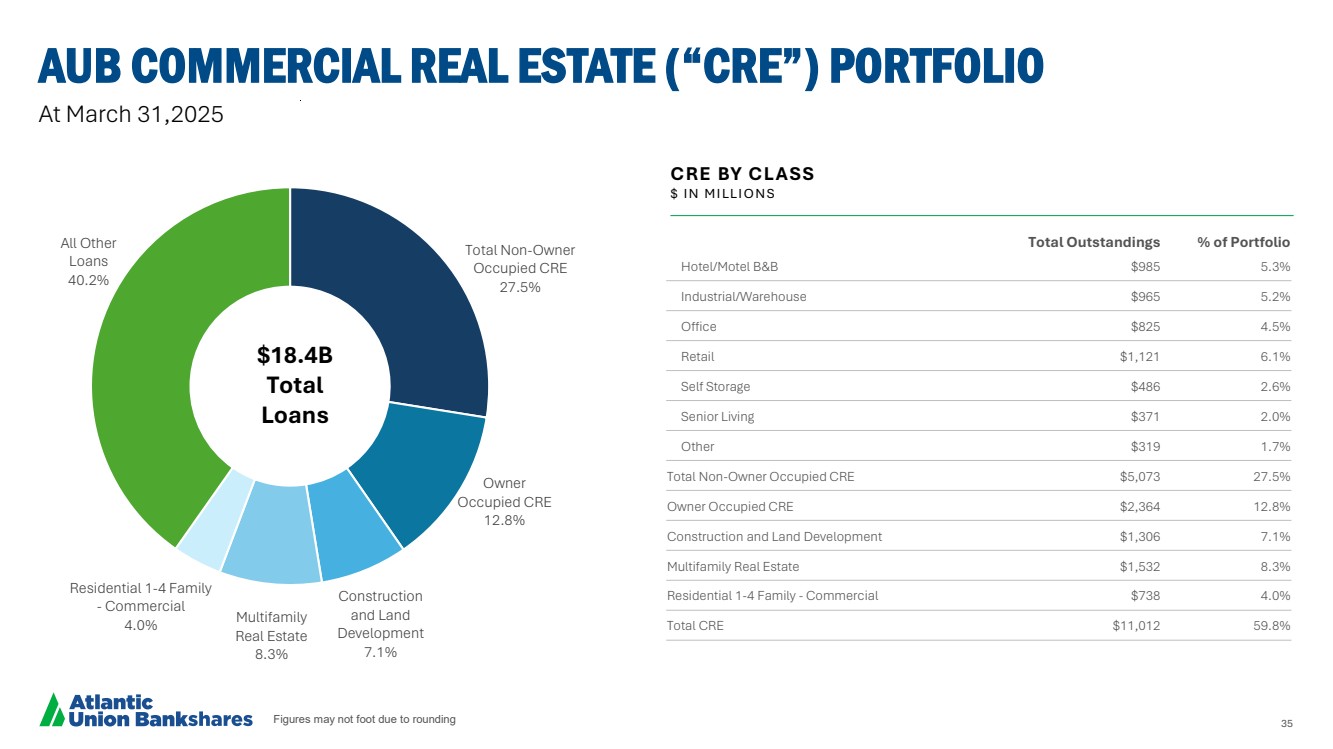
| Figures may not foot due to rounding 35 AUB COMMERCIAL REAL ESTATE (“CRE”) PORTFOLIO At March 31,2025 Total Non-Owner Occupied CRE 27.5% Owner Occupied CRE 12.8% Construction and Land Development 7.1% Multifamily Real Estate 8.3% Residential 1-4 Family - Commercial 4.0% All Other Loans 40.2% $18.4B Total Loans Total Outstandings % of Portfolio Hotel/Motel B&B $985 5.3% Industrial/Warehouse $965 5.2% Office $825 4.5% Retail $1,121 6.1% Self Storage $486 2.6% Senior Living $371 2.0% Other $319 1.7% Total Non-Owner Occupied CRE $5,073 27.5% Owner Occupied CRE $2,364 12.8% Construction and Land Development $1,306 7.1% Multifamily Real Estate $1,532 8.3% Residential 1-4 Family - Commercial $738 4.0% Total CRE $11,012 59.8% CRE BY CLASS $ I N M I LLI O N S |
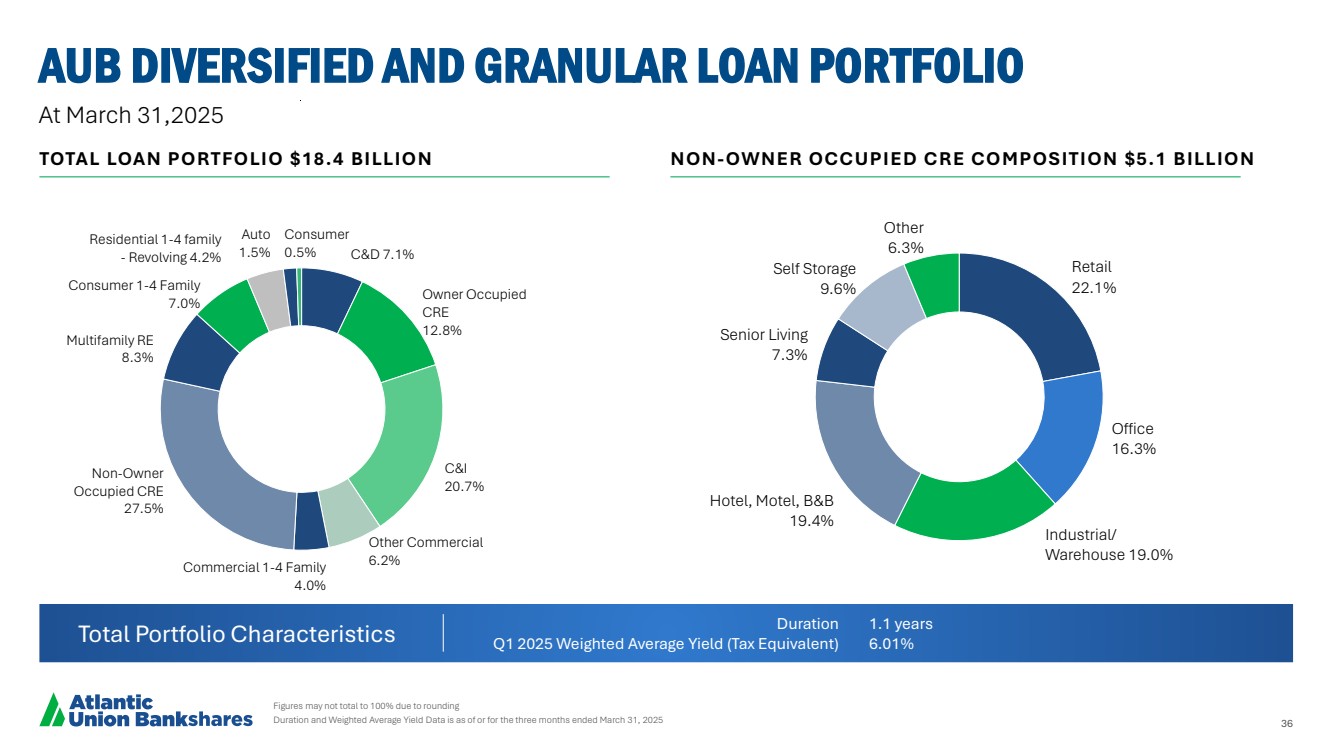
| 36 AUB DIVERSIFIED AND GRANULAR LOAN PORTFOLIO Figures may not total to 100% due to rounding Duration and Weighted Average Yield Data is as of or for the three months ended March 31, 2025 Duration Q1 2025 Weighted Average Yield (Tax Equivalent) 1.1 years 6.01% C&D 7.1% Owner Occupied CRE 12.8% C&I 20.7% Other Commercial 6.2% Commercial 1-4 Family 4.0% Non-Owner Occupied CRE 27.5% Multifamily RE 8.3% Consumer 1-4 Family 7.0% Residential 1-4 family - Revolving 4.2% Auto 1.5% Consumer 0.5% Retail 22.1% Office 16.3% Industrial/ Warehouse 19.0% Hotel, Motel, B&B 19.4% Senior Living 7.3% Self Storage 9.6% Other 6.3% TOTAL LOAN PORTFOLIO $18.4 BILLION NON-OWNER OCCUPIED CRE COMPOSITION $5.1 BILLION Total Portfolio Characteristics At March 31,2025 |
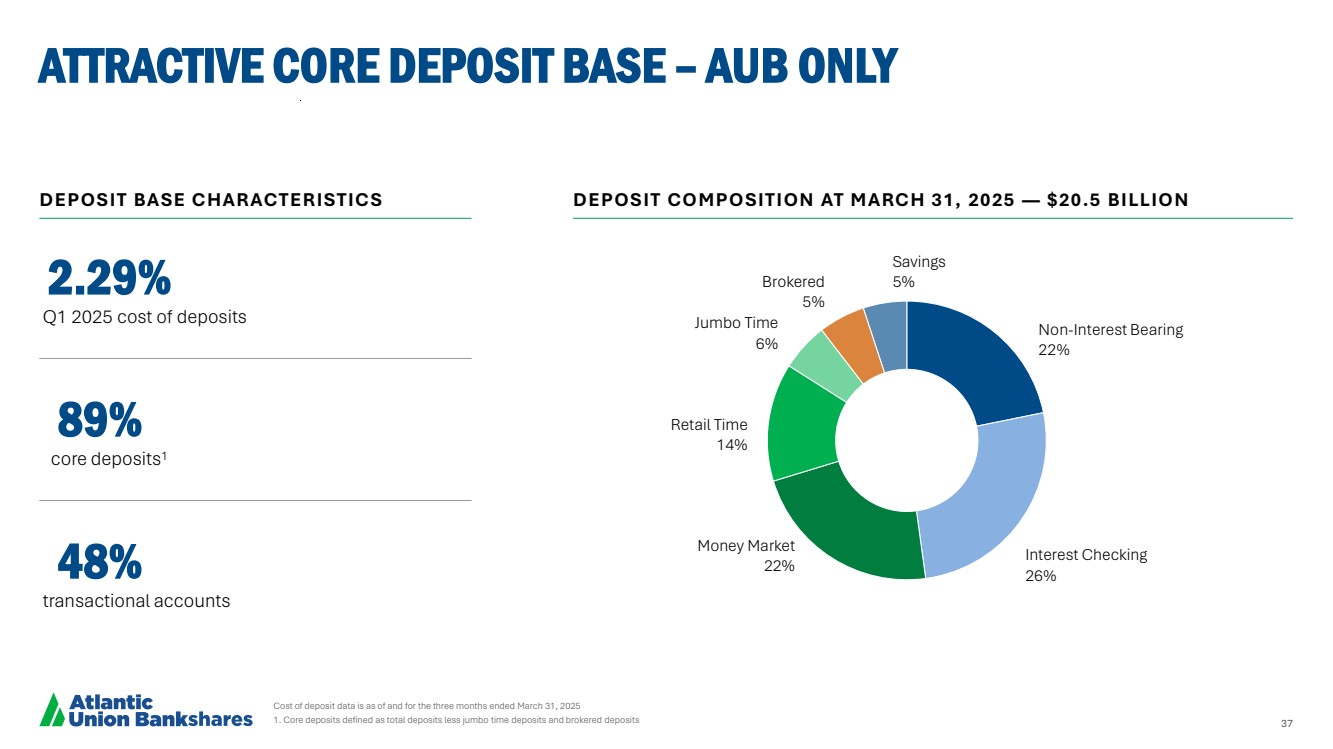
| 37 ATTRACTIVE CORE DEPOSIT BASE – AUB ONLY Cost of deposit data is as of and for the three months ended March 31, 2025 1. Core deposits defined as total deposits less jumbo time deposits and brokered deposits Non-Interest Bearing 22% Interest Checking 26% Money Market 22% Retail Time 14% Jumbo Time 6% Brokered 5% Savings 5% DEPOSIT BASE CHARACTERISTICS DEPOSIT COMPOSITION AT MARCH 31, 2025 — $20.5 BILLION 89% core deposits1 48% transactional accounts 2.29% Q1 2025 cost of deposits |
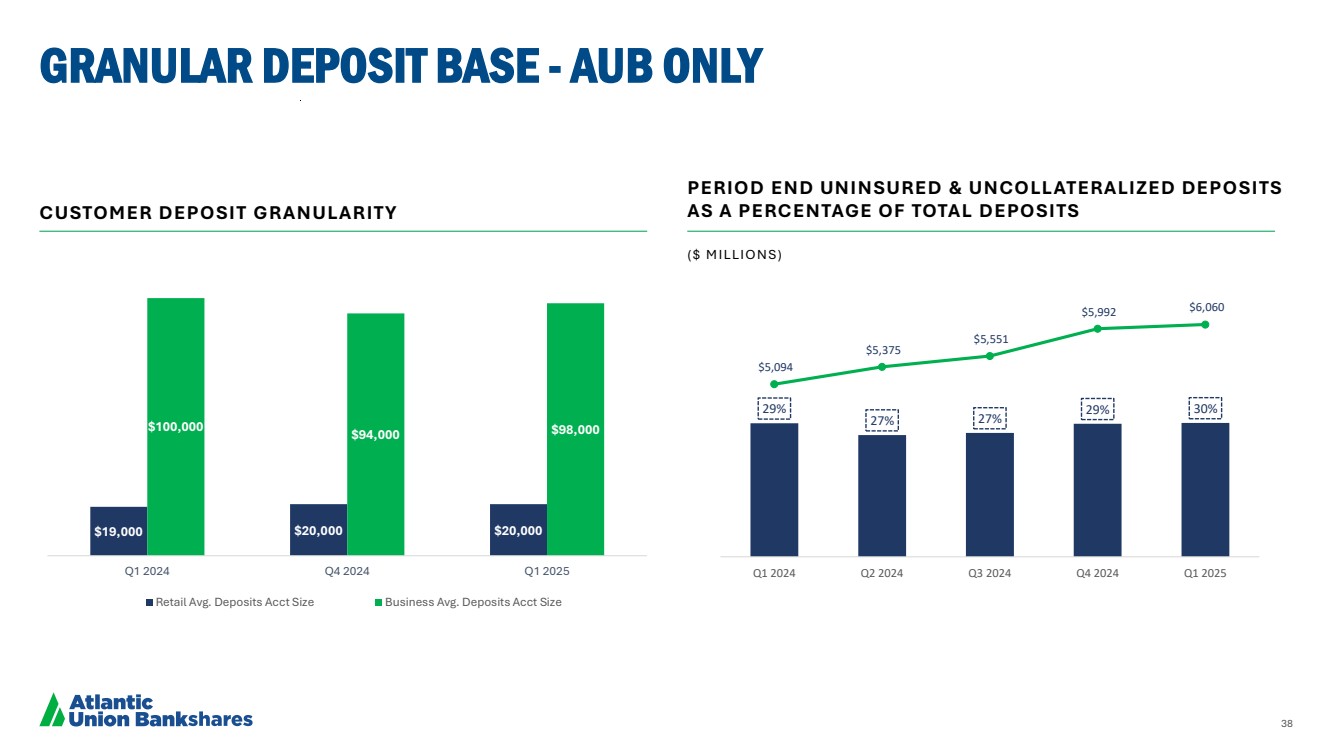
| 38 GRANULAR DEPOSIT BASE - AUB ONLY CUSTOMER DEPOSIT GRANULARITY PERIOD END UNINSURED & UNCOLLATERALIZED DEPOSITS AS A PERCENTAGE OF TOTAL DEPOSITS $19,000 $20,000 $20,000 $100,000 $94,000 $98,000 Q1 2024 Q4 2024 Q1 2025 Retail Avg. Deposits Acct Size Business Avg. Deposits Acct Size ( $ M I LLI O N S ) 29% 27% 27% 29% 30% $5,094 $5,375 $5,551 $5,992 $6,060 Q1 2024 Q2 2024 Q3 2024 Q4 2024 Q1 2025 |
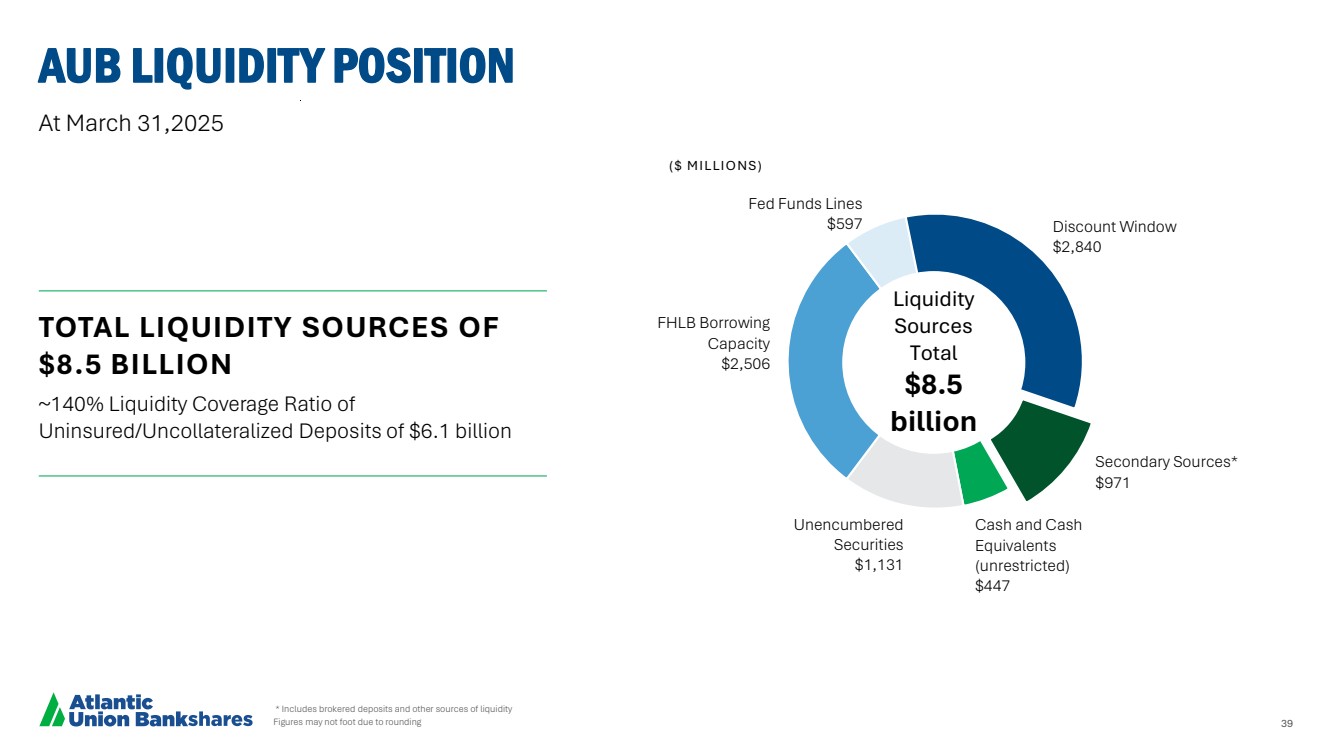
| 39 Cash and Cash Equivalents (unrestricted) $447 Unencumbered Securities $1,131 FHLB Borrowing Capacity $2,506 Fed Funds Lines $597 Discount Window $2,840 Secondary Sources* $971 AUB LIQUIDITY POSITION * Includes brokered deposits and other sources of liquidity Figures may not foot due to rounding Liquidity Sources Total $8.5 billion At March 31,2025 TOTAL LIQUIDITY SOURCES OF $8.5 BILLION ~140% Liquidity Coverage Ratio of Uninsured/Uncollateralized Deposits of $6.1 billion ($ MILLIONS) |
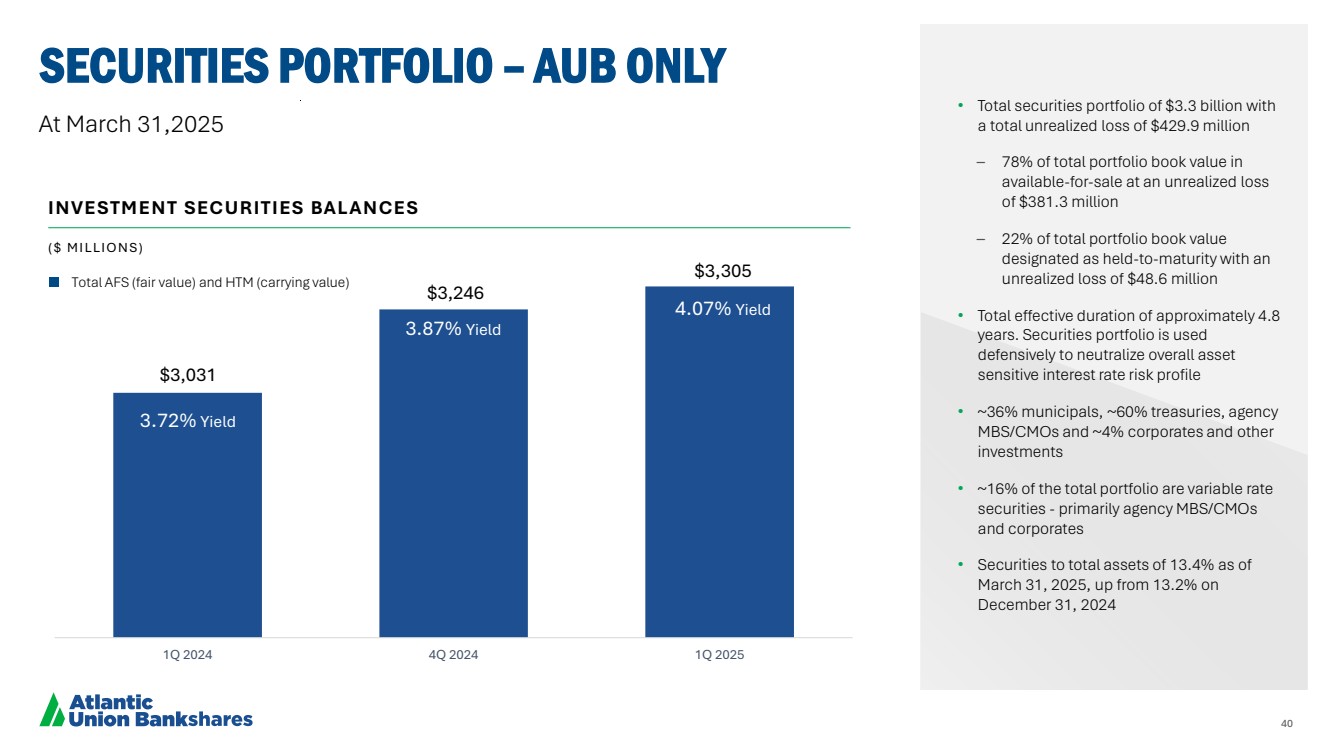
| 40 SECURITIES PORTFOLIO – AUB ONLY • Total securities portfolio of $3.3 billion with a total unrealized loss of $429.9 million – 78% of total portfolio book value in available-for-sale at an unrealized loss of $381.3 million – 22% of total portfolio book value designated as held-to-maturity with an unrealized loss of $48.6 million • Total effective duration of approximately 4.8 years. Securities portfolio is used defensively to neutralize overall asset sensitive interest rate risk profile • ~36% municipals, ~60% treasuries, agency MBS/CMOs and ~4% corporates and other investments • ~16% of the total portfolio are variable rate securities - primarily agency MBS/CMOs and corporates • Securities to total assets of 13.4% as of March 31, 2025, up from 13.2% on December 31, 2024 $3,031 $3,246 $3,305 1Q 2024 4Q 2024 1Q 2025 3.72% Yield 3.87% Yield 4.07% Yield INVESTMENT SECURITIES BALANCES Total AFS (fair value) and HTM (carrying value) At March 31,2025 ( $ M I LLI O N S ) |
| 41 RECONCILIATION OF NON-GAAP DISCLOSURES We have provided supplemental performance measures determined by methods other than in accordance with GAAP. These non-GAAP financial measures are a supplement to GAAP, which we use to prepare our financial statements, and should not be considered in isolation or as a substitute for comparable measures calculated in accordance with GAAP. In addition, our non-GAAP financial measures may not be comparable to non-GAAP financial measures of other companies. We use the non-GAAP financial measures discussed herein in our analysis of our performance. Management believes that these non-GAAP financial measures provide additional understanding of ongoing operations, enhance comparability of results of operations with prior periods and show the effects of significant gains and charges in the periods presented without the impact of items or events that may obscure trends in our underlying performance or show the potential effects of accumulated other comprehensive income or unrealized losses on held to maturity securities on our capital. |
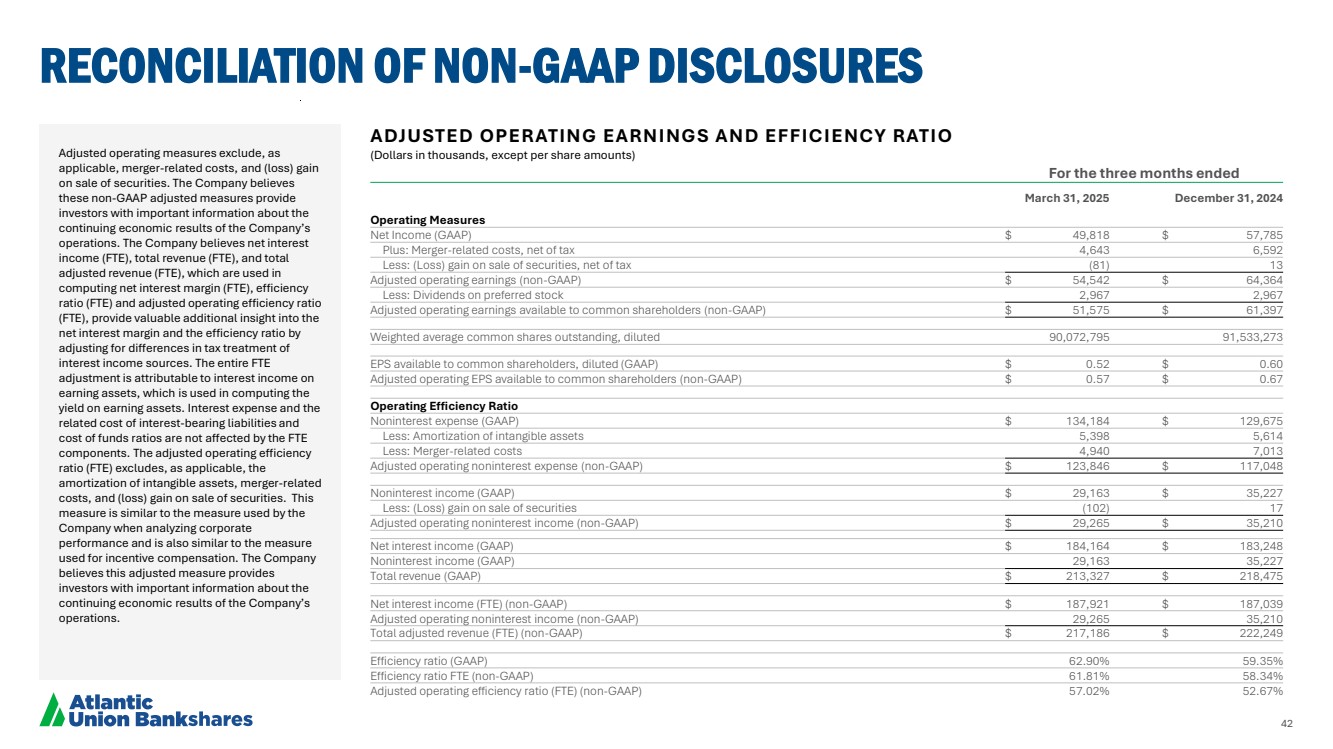
| 42 RECONCILIATION OF NON-GAAP DISCLOSURES Adjusted operating measures exclude, as applicable, merger-related costs, and (loss) gain on sale of securities. The Company believes these non-GAAP adjusted measures provide investors with important information about the continuing economic results of the Company’s operations. The Company believes net interest income (FTE), total revenue (FTE), and total adjusted revenue (FTE), which are used in computing net interest margin (FTE), efficiency ratio (FTE) and adjusted operating efficiency ratio (FTE), provide valuable additional insight into the net interest margin and the efficiency ratio by adjusting for differences in tax treatment of interest income sources. The entire FTE adjustment is attributable to interest income on earning assets, which is used in computing the yield on earning assets. Interest expense and the related cost of interest-bearing liabilities and cost of funds ratios are not affected by the FTE components. The adjusted operating efficiency ratio (FTE) excludes, as applicable, the amortization of intangible assets, merger-related costs, and (loss) gain on sale of securities. This measure is similar to the measure used by the Company when analyzing corporate performance and is also similar to the measure used for incentive compensation. The Company believes this adjusted measure provides investors with important information about the continuing economic results of the Company’s operations. ADJUSTED OPERATING EARNINGS AND EFFICIENCY RATIO (Dollars in thousands, except per share amounts) For the three months ended March 31, 2025 December 31, 2024 Operating Measures Net Income (GAAP) $ 49,818 $ 57,785 Plus: Merger-related costs, net of tax 4,643 6,592 Less: (Loss) gain on sale of securities, net of tax (81) 13 Adjusted operating earnings (non-GAAP) $ 54,542 $ 64,364 Less: Dividends on preferred stock 2,967 2,967 Adjusted operating earnings available to common shareholders (non-GAAP) $ 51,575 $ 61,397 Weighted average common shares outstanding, diluted 90,072,795 91,533,273 EPS available to common shareholders, diluted (GAAP) $ 0.52 $ 0.60 Adjusted operating EPS available to common shareholders (non-GAAP) $ 0.57 $ 0.67 Operating Efficiency Ratio Noninterest expense (GAAP) $ 134,184 $ 129,675 Less: Amortization of intangible assets 5,398 5,614 Less: Merger-related costs 4,940 7,013 Adjusted operating noninterest expense (non-GAAP) $ 123,846 $ 117,048 Noninterest income (GAAP) $ 29,163 $ 35,227 Less: (Loss) gain on sale of securities (102) 17 Adjusted operating noninterest income (non-GAAP) $ 29,265 $ 35,210 Net interest income (GAAP) $ 184,164 $ 183,248 Noninterest income (GAAP) 29,163 35,227 Total revenue (GAAP) $ 213,327 $ 218,475 Net interest income (FTE) (non-GAAP) $ 187,921 $ 187,039 Adjusted operating noninterest income (non-GAAP) 29,265 35,210 Total adjusted revenue (FTE) (non-GAAP) $ 217,186 $ 222,249 Efficiency ratio (GAAP) 62.90% 59.35% Efficiency ratio FTE (non-GAAP) 61.81% 58.34% Adjusted operating efficiency ratio (FTE) (non-GAAP) 57.02% 52.67% |
| 43 RECONCILIATION OF NON-GAAP DISCLOSURES The Company believes net interest income (FTE), total revenue (FTE), and total adjusted revenue (FTE), which are used in computing net interest margin (FTE), efficiency ratio (FTE) and adjusted operating efficiency ratio (FTE), provide valuable additional insight into the net interest margin and the efficiency ratio by adjusting for differences in tax treatment of interest income sources. The entire FTE adjustment is attributable to interest income on earning assets, which is used in computing the yield on earning assets. Interest expense and the related cost of interest-bearing liabilities and cost of funds ratios are not affected by the FTE components. NET INTEREST MARGIN (Dollars in thousands) For the three months ended March 31, 2025 December 31, 2024 Net interest income (GAAP) $ 184,164 $ 183,248 FTE adjustment 3,757 3,791 Net interest income (FTE) (non-GAAP) $ 187,921 $ 187,039 Noninterest income (GAAP) 29,163 35,227 Total revenue (FTE) (non-GAAP) $ 217,084 $ 222,266 Average earning assets $ 22,101,074 $ 22,373,970 Net interest margin (GAAP) 3.38% 3.26% Net interest margin (FTE) (non-GAAP) 3.45% 3.33% |

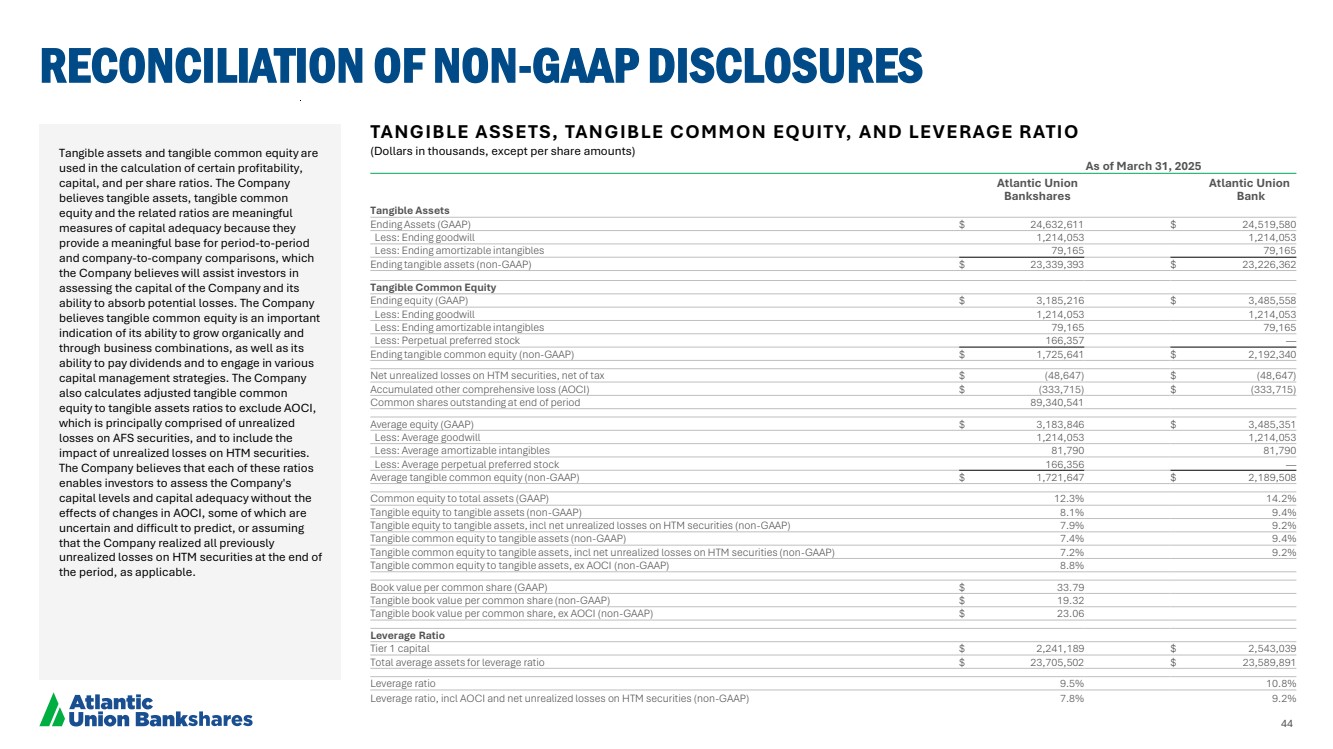
| 44 RECONCILIATION OF NON-GAAP DISCLOSURES TANGIBLE ASSETS, TANGIBLE COMMON EQUITY, AND LEVERAGE RATIO (Dollars in thousands, except per share amounts) As of March 31, 2025 Atlantic Union Bankshares Atlantic Union Bank Tangible Assets Ending Assets (GAAP) $ 24,632,611 $ 24,519,580 Less: Ending goodwill 1,214,053 1,214,053 Less: Ending amortizable intangibles 79,165 79,165 Ending tangible assets (non-GAAP) $ 23,339,393 $ 23,226,362 Tangible Common Equity Ending equity (GAAP) $ 3,185,216 $ 3,485,558 Less: Ending goodwill 1,214,053 1,214,053 Less: Ending amortizable intangibles 79,165 79,165 Less: Perpetual preferred stock 166,357 — Ending tangible common equity (non-GAAP) $ 1,725,641 $ 2,192,340 Net unrealized losses on HTM securities, net of tax $ (48,647) $ (48,647) Accumulated other comprehensive loss (AOCI) $ (333,715) $ (333,715) Common shares outstanding at end of period 89,340,541 Average equity (GAAP) $ 3,183,846 $ 3,485,351 Less: Average goodwill 1,214,053 1,214,053 Less: Average amortizable intangibles 81,790 81,790 Less: Average perpetual preferred stock 166,356 — Average tangible common equity (non-GAAP) $ 1,721,647 $ 2,189,508 Common equity to total assets (GAAP) 12.3% 14.2% Tangible equity to tangible assets (non-GAAP) 8.1% 9.4% Tangible equity to tangible assets, incl net unrealized losses on HTM securities (non-GAAP) 7.9% 9.2% Tangible common equity to tangible assets (non-GAAP) 7.4% 9.4% Tangible common equity to tangible assets, incl net unrealized losses on HTM securities (non-GAAP) 7.2% 9.2% Tangible common equity to tangible assets, ex AOCI (non-GAAP) 8.8% Book value per common share (GAAP) $ 33.79 Tangible book value per common share (non-GAAP) $ 19.32 Tangible book value per common share, ex AOCI (non-GAAP) $ 23.06 Leverage Ratio Tier 1 capital $ 2,241,189 $ 2,543,039 Total average assets for leverage ratio $ 23,705,502 $ 23,589,891 Leverage ratio 9.5% 10.8% Leverage ratio, incl AOCI and net unrealized losses on HTM securities (non-GAAP) 7.8% 9.2% Tangible assets and tangible common equity are used in the calculation of certain profitability, capital, and per share ratios. The Company believes tangible assets, tangible common equity and the related ratios are meaningful measures of capital adequacy because they provide a meaningful base for period-to-period and company-to-company comparisons, which the Company believes will assist investors in assessing the capital of the Company and its ability to absorb potential losses. The Company believes tangible common equity is an important indication of its ability to grow organically and through business combinations, as well as its ability to pay dividends and to engage in various capital management strategies. The Company also calculates adjusted tangible common equity to tangible assets ratios to exclude AOCI, which is principally comprised of unrealized losses on AFS securities, and to include the impact of unrealized losses on HTM securities. The Company believes that each of these ratios enables investors to assess the Company's capital levels and capital adequacy without the effects of changes in AOCI, some of which are uncertain and difficult to predict, or assuming that the Company realized all previously unrealized losses on HTM securities at the end of the period, as applicable. |
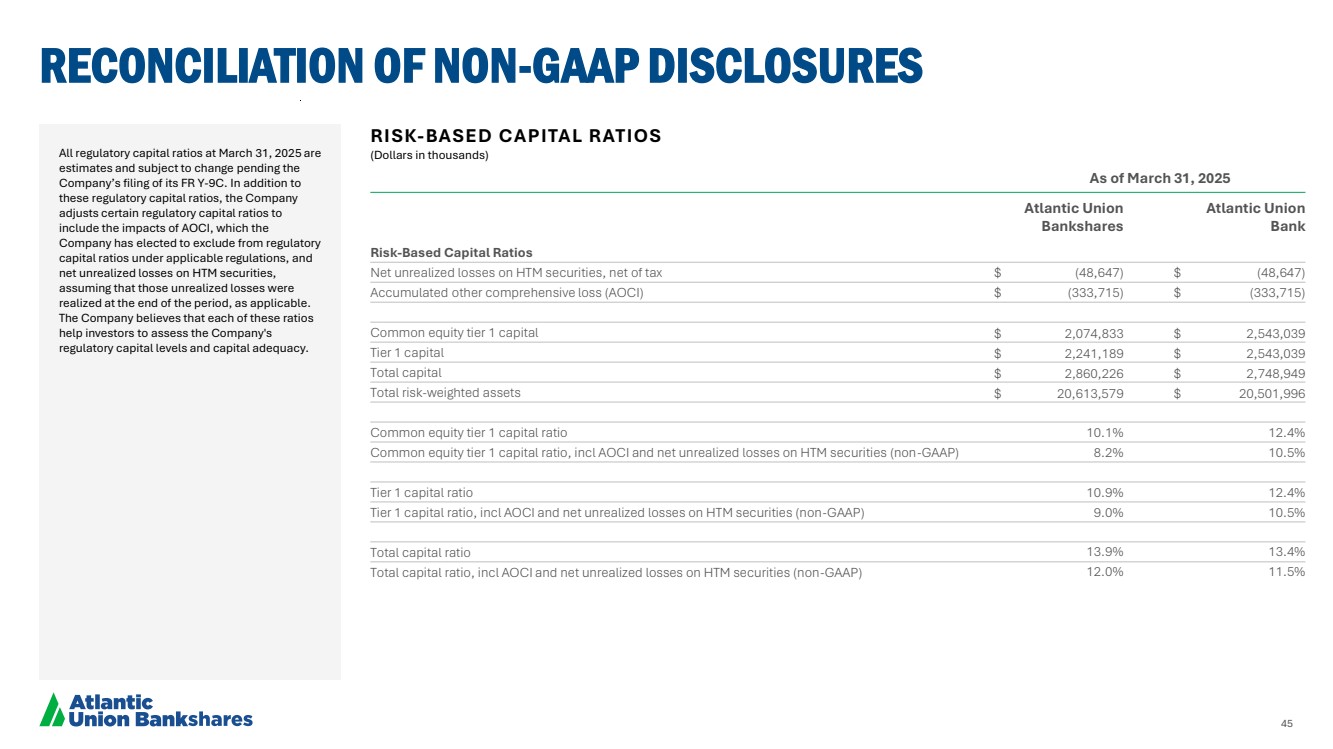
| 45 RECONCILIATION OF NON-GAAP DISCLOSURES RISK-BASED CAPITAL RATIOS (Dollars in thousands) As of March 31, 2025 Atlantic Union Bankshares Atlantic Union Bank Risk-Based Capital Ratios Net unrealized losses on HTM securities, net of tax $ (48,647) $ (48,647) Accumulated other comprehensive loss (AOCI) $ (333,715) $ (333,715) Common equity tier 1 capital $ 2,074,833 $ 2,543,039 Tier 1 capital $ 2,241,189 $ 2,543,039 Total capital $ 2,860,226 $ 2,748,949 Total risk-weighted assets $ 20,613,579 $ 20,501,996 Common equity tier 1 capital ratio 10.1% 12.4% Common equity tier 1 capital ratio, incl AOCI and net unrealized losses on HTM securities (non-GAAP) 8.2% 10.5% Tier 1 capital ratio 10.9% 12.4% Tier 1 capital ratio, incl AOCI and net unrealized losses on HTM securities (non-GAAP) 9.0% 10.5% Total capital ratio 13.9% 13.4% Total capital ratio, incl AOCI and net unrealized losses on HTM securities (non-GAAP) 12.0% 11.5% All regulatory capital ratios at March 31, 2025 are estimates and subject to change pending the Company’s filing of its FR Y-9C. In addition to these regulatory capital ratios, the Company adjusts certain regulatory capital ratios to include the impacts of AOCI, which the Company has elected to exclude from regulatory capital ratios under applicable regulations, and net unrealized losses on HTM securities, assuming that those unrealized losses were realized at the end of the period, as applicable. The Company believes that each of these ratios help investors to assess the Company's regulatory capital levels and capital adequacy. |
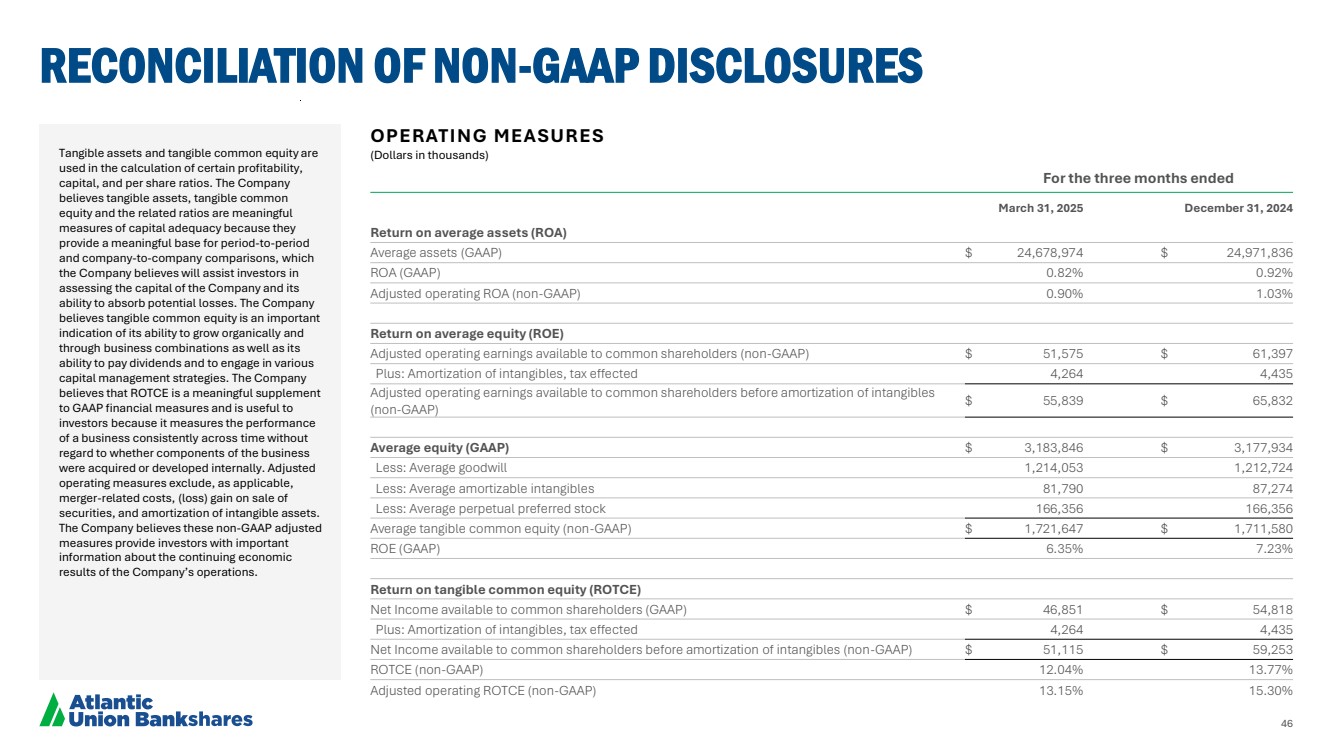
| 46 RECONCILIATION OF NON-GAAP DISCLOSURES OPERATING MEASURES (Dollars in thousands) For the three months ended March 31, 2025 December 31, 2024 Return on average assets (ROA) Average assets (GAAP) $ 24,678,974 $ 24,971,836 ROA (GAAP) 0.82% 0.92% Adjusted operating ROA (non-GAAP) 0.90% 1.03% Return on average equity (ROE) Adjusted operating earnings available to common shareholders (non-GAAP) $ 51,575 $ 61,397 Plus: Amortization of intangibles, tax effected 4,264 4,435 Adjusted operating earnings available to common shareholders before amortization of intangibles (non-GAAP) $ 55,839 $ 65,832 Average equity (GAAP) $ 3,183,846 $ 3,177,934 Less: Average goodwill 1,214,053 1,212,724 Less: Average amortizable intangibles 81,790 87,274 Less: Average perpetual preferred stock 166,356 166,356 Average tangible common equity (non-GAAP) $ 1,721,647 $ 1,711,580 ROE (GAAP) 6.35% 7.23% Return on tangible common equity (ROTCE) Net Income available to common shareholders (GAAP) $ 46,851 $ 54,818 Plus: Amortization of intangibles, tax effected 4,264 4,435 Net Income available to common shareholders before amortization of intangibles (non-GAAP) $ 51,115 $ 59,253 ROTCE (non-GAAP) 12.04% 13.77% Adjusted operating ROTCE (non-GAAP) 13.15% 15.30% Tangible assets and tangible common equity are used in the calculation of certain profitability, capital, and per share ratios. The Company believes tangible assets, tangible common equity and the related ratios are meaningful measures of capital adequacy because they provide a meaningful base for period-to-period and company-to-company comparisons, which the Company believes will assist investors in assessing the capital of the Company and its ability to absorb potential losses. The Company believes tangible common equity is an important indication of its ability to grow organically and through business combinations as well as its ability to pay dividends and to engage in various capital management strategies. The Company believes that ROTCE is a meaningful supplement to GAAP financial measures and is useful to investors because it measures the performance of a business consistently across time without regard to whether components of the business were acquired or developed internally. Adjusted operating measures exclude, as applicable, merger-related costs, (loss) gain on sale of securities, and amortization of intangible assets. The Company believes these non-GAAP adjusted measures provide investors with important information about the continuing economic results of the Company’s operations. |
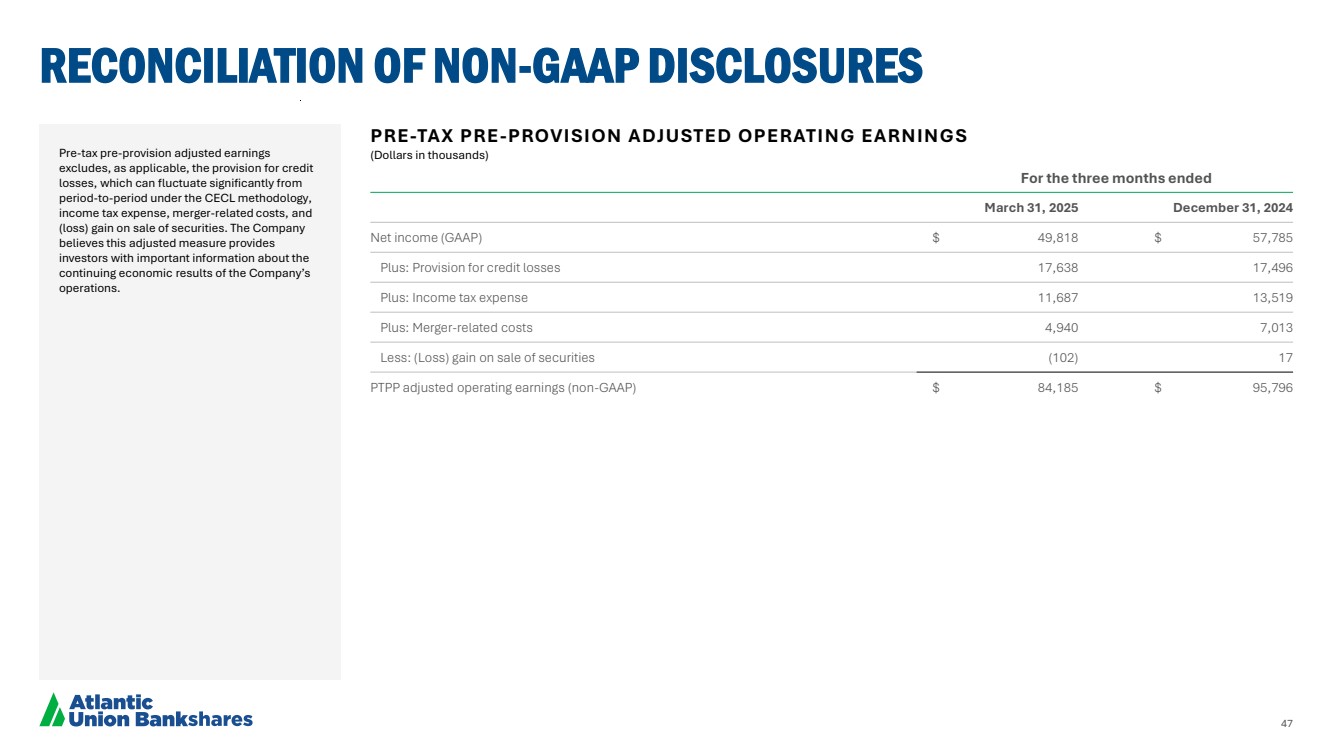
| 47 RECONCILIATION OF NON-GAAP DISCLOSURES Pre-tax pre-provision adjusted earnings excludes, as applicable, the provision for credit losses, which can fluctuate significantly from period-to-period under the CECL methodology, income tax expense, merger-related costs, and (loss) gain on sale of securities. The Company believes this adjusted measure provides investors with important information about the continuing economic results of the Company’s operations. PRE-TAX PRE-PROVISION ADJUSTED OPERATING EARNINGS (Dollars in thousands) For the three months ended March 31, 2025 December 31, 2024 Net income (GAAP) $ 49,818 $ 57,785 Plus: Provision for credit losses 17,638 17,496 Plus: Income tax expense 11,687 13,519 Plus: Merger-related costs 4,940 7,013 Less: (Loss) gain on sale of securities (102) 17 PTPP adjusted operating earnings (non-GAAP) $ 84,185 $ 95,796 |