| 4th Quarter and Full Year 2024 Earnings Presentation NYSE: AUB January 23, 2025 |

| 2 Forward Looking Statements This presentation and statements by our management may constitute “forward-looking statements” within the meaning of the Private Securities Litigation Reform Act of 1995. Forward-looking statements are statements that include, without limitation, statements on the slides entitled “Q4 2024 and Full Year 2024 Highlights“ and “2025 AUB Standalone Financial Outlook,” statements regarding the pending merger with Sandy Spring Bancorp, Inc. (“Sandy Spring”), our business, financial and operating results, including our deposit base and funding, the impact of changes in economic conditions, management’s belief regarding our liquidity, capital resources, asset quality, customer relationships, and statements that include other projections, predictions, expectations, or beliefs about future events or results or otherwise are not statements of historical fact. Such forward-looking statements are based on certain assumptions as of the time they are made, and are inherently subject to known and unknown risks, uncertainties, and other factors, some of which cannot be predicted or quantified, that may cause actual results, performance, or achievements to be materially different from those expressed or implied by such forward-looking statements. Forward-looking statements are often characterized by the use of qualified words (and their derivatives) such as “expect,” “believe,” “estimate,” “plan,” “project,” “anticipate,” “intend,” “will,” “may,” “view,” “opportunity,” “seek to,” “potential,” “continue,” “confidence,” or words of similar meaning or other statements concerning opinions or judgment of Atlantic Union Bankshares Corporation (the “Company”) and our management about future events. Although we believe that our expectations with respect to forward-looking statements are based on reasonable assumptions within the bounds of our existing knowledge of our business and operations, there can be no assurance that actual future results, performance, or achievements of, or trends affecting, us will not differ materially from any projected future results, performance, achievements or trends expressed or implied by such forward-looking statements. Actual future results, performance, achievements or trends may differ materially from historical results or those anticipated depending on a variety of factors, including, but not limited to, the effects of or changes in: • market interest rates and their related impacts on macroeconomic conditions, customer and client behavior, our funding costs and our loan and securities portfolios; • inflation and its impacts on economic growth and customer and client behavior; • adverse developments in the financial industry generally, such as bank failures, responsive measures to mitigate and manage such developments, related supervisory/regulatory actions and costs, and related impacts on customer behavior; • the sufficiency of liquidity and changes in our capital position; • general economic and financial market conditions in the United States generally and particularly in the markets in which we operate and which our loans are concentrated, including the effects of declines in real estate values, an increase in unemployment levels and slowdowns in economic growth; • the failure to close our proposed merger with Sandy Spring when expected or at all because remaining required regulatory approvals, Company shareholder or Sandy Spring stockholder or other approvals or conditions to closing are not received or satisfied on a timely basis or at all, and the risk that any regulatory approvals may result in the imposition of conditions that could adversely affect the combined company or the expected benefits of the proposed merger; • the occurrence of any event, change or other circumstances that could give rise to the right of the Company or Sandy Spring to terminate the merger agreement; • risks related to Sandy Spring’s business that we will be subject to after closing, including its commercial real estate portfolio; • any change in the purchase accounting assumptions regarding the Sandy Spring assets to be acquired and liabilities to be assumed used to determine the fair value of credit marks; • the proposed merger with Sandy Spring may be more expensive or take longer to complete than anticipated; • the diversion of management’s attention from ongoing business operations and opportunities due to the proposed merger with Sandy Spring; • the dilutive effect of shares of our common stock to be issued in connection with the proposed merger with Sandy Spring or pursuant to the previously disclosed forward sale agreements with Morgan Stanley & Co. LLC; • changes in the Company’s or Sandy Spring’s share price before closing; • the impact of purchase accounting with respect to the American National acquisition, or change in the assumptions used regarding the assets acquired and liabilities assumed to determine the fair value and credit marks; • the possibility that the anticipated benefits of the proposed merger with Sandy Spring or the American National acquisition, including anticipated cost savings and strategic gains, are not realized when expected or at all, including because of the impact of, or problems arising from, the integration of the companies or because of the strength of the economy, competitive factors in the areas where we do business, or other unexpected factors or events; • potential adverse reactions or changes to business or employee relationships, including those resulting from the announcement or completion of the proposed merger with Sandy Spring or the American National acquisition; • monetary and fiscal policies of the U.S. government, including the U.S. Department of the Treasury and the Federal Reserve; • the quality or composition of our loan or investment portfolios and changes therein; • demand for loan products and financial services in our market areas; • our ability to manage our growth or implement our growth strategy; • the effectiveness of expense reduction plans; • the introduction of new lines of business or new products and services; • our ability to identify, recruit and retain key employees; • real estate values in our lending area; • changes in accounting principles, standards, rules, and interpretations, and the related impact on our financial statements; • an insufficient ACL or volatility in the ACL resulting from the CECL methodology, either alone or as that may be affected by changing economic conditions, credit concentrations, inflation, changing interest rates, or other factors; • concentrations of loans secured by real estate, particularly commercial real estate; • the effectiveness of our credit processes and management of our credit risk; • our ability to compete in the market for financial services and increased competition from fintech companies; • technological risks and developments, and cyber threats, attacks, or events; • operational, technological, cultural, regulatory, legal, credit, and other risks associated with the exploration, consummation and integration of potential future acquisitions, whether involving stock or cash consideration; • the potential adverse effects of unusual and infrequently occurring events, such as weather-related disasters, terrorist acts, geopolitical conflicts or public health events (such as pandemics), and of governmental and societal responses thereto; these potential adverse effects may include, without limitation, adverse effects on the ability of our borrowers to satisfy their obligations to us, on the value of collateral securing loans, on the demand for our loans or our other products and services, on supply chains and methods used to distribute products and services, on incidents of cyberattack and fraud, on our liquidity or capital positions, on risks posed by reliance on third-party service providers, on other aspects of our business operations and on financial markets and economic growth; • performance by our counterparties or vendors; • deposit flows; • the availability of financing and the terms thereof; • the level of prepayments on loans and mortgage-backed securities; • the effects of legislative or regulatory changes and requirements, including changes in federal, state or local tax laws; • actual or potential claims, damages, and fines related to litigation or government actions, which may result in, among other things, additional costs, fines, penalties, restrictions on our business activities, reputational harm, or other adverse consequences; • any event or development that would cause us to conclude that there was an impairment of any asset, including intangible assets, such as goodwill; and • other factors, many of which are beyond our control. Please also refer to such other factors as discussed throughout Part I, Item 1A. “Risk Factors” and Part II, Item 7. “Management’s Discussion and Analysis of Financial Condition and Results of Operations” of our Annual Report on Form 10-K for the year ended December 31, 2023, and related disclosures in other filings, which have been filed with the U.S. Securities and Exchange Commission (“SEC”) and are available on the SEC’s website at www.sec.gov. All risk factors and uncertainties described herein and therein should be considered in evaluating forward-looking statements, and all of the forward-looking statements are expressly qualified by the cautionary statements contained or referred to herein and therein. The actual results or developments anticipated may not be realized or, even if substantially realized, they may not have the expected consequences to or effects on the Company or our businesses or operations. Readers are cautioned not to rely too heavily on the forward-looking statements. Forward-looking statements speak only as of the date they are made. We do not intend or assume any obligation to update, revise or clarify any forward-looking statements that may be made from time to time by or on behalf of the Company, whether because of new information, future events or otherwise, except as required by law. |
| 3 Additional Information Non-GAAP Financial Measures This presentation contains certain financial information determined by methods other than in accordance with generally accepted accounting principles in the United States (“GAAP”). These non-GAAP financial measures are a supplement to GAAP, which is used to prepare our financial statements, and should not be considered in isolation or as a substitute for comparable measures calculated in accordance with GAAP. In addition, our non-GAAP financial measures may not be comparable to non-GAAP financial measures of other companies. We use the non-GAAP financial measures discussed herein in our analysis of our performance. Our management believes that these non-GAAP financial measures provide additional understanding of ongoing operations, enhance comparability of results of operations with prior periods, show the effects of significant gains and charges in the periods presented without the impact of items or events that may obscure trends in our underlying performance, or show the potential effects of accumulated other comprehensive income (or AOCI) or unrealized losses on securities on our capital. This presentation also includes certain projections of non-GAAP financial measures. Due to the inherent variability and difficulty associated with making accurate forecasts and projections of information that is excluded from these projected non-GAAP measures, and the fact that some of the excluded information is not currently ascertainable or accessible, we are unable to quantify certain amounts that would be required to be included in the most directly comparable projected GAAP financial measures without unreasonable effort. Consequently, no disclosure of projected comparable GAAP measures is included, and no reconciliation of forward-looking non-GAAP financial information is included. Please see “Reconciliation of Non-GAAP Disclosures” at the end of this presentation for a reconciliation to the nearest GAAP financial measure. No Offer or Solicitation This presentation does not constitute an offer to sell or a solicitation of an offer to buy any securities. No offer of securities shall be made except by means of a prospectus meeting the requirements of the Securities Act of 1933, as amended, and no offer to sell or solicitation of an offer to buy shall be made in any jurisdiction in which such offer, solicitation or sale would be unlawful. About Atlantic Union Bankshares Corporation Headquartered in Richmond, Virginia, Atlantic Union Bankshares Corporation (NYSE: AUB) is the holding company for Atlantic Union Bank. Atlantic Union Bank had 129 branches located throughout Virginia and in portions of Maryland and North Carolina as of December 31, 2024. Certain non-bank financial services affiliates of Atlantic Union Bank include: Atlantic Union Equipment Finance, Inc., which provides equipment financing; Atlantic Union Financial Consultants, LLC, which provides brokerage services; and Union Insurance Group, LLC, which offers various lines of insurance products. |
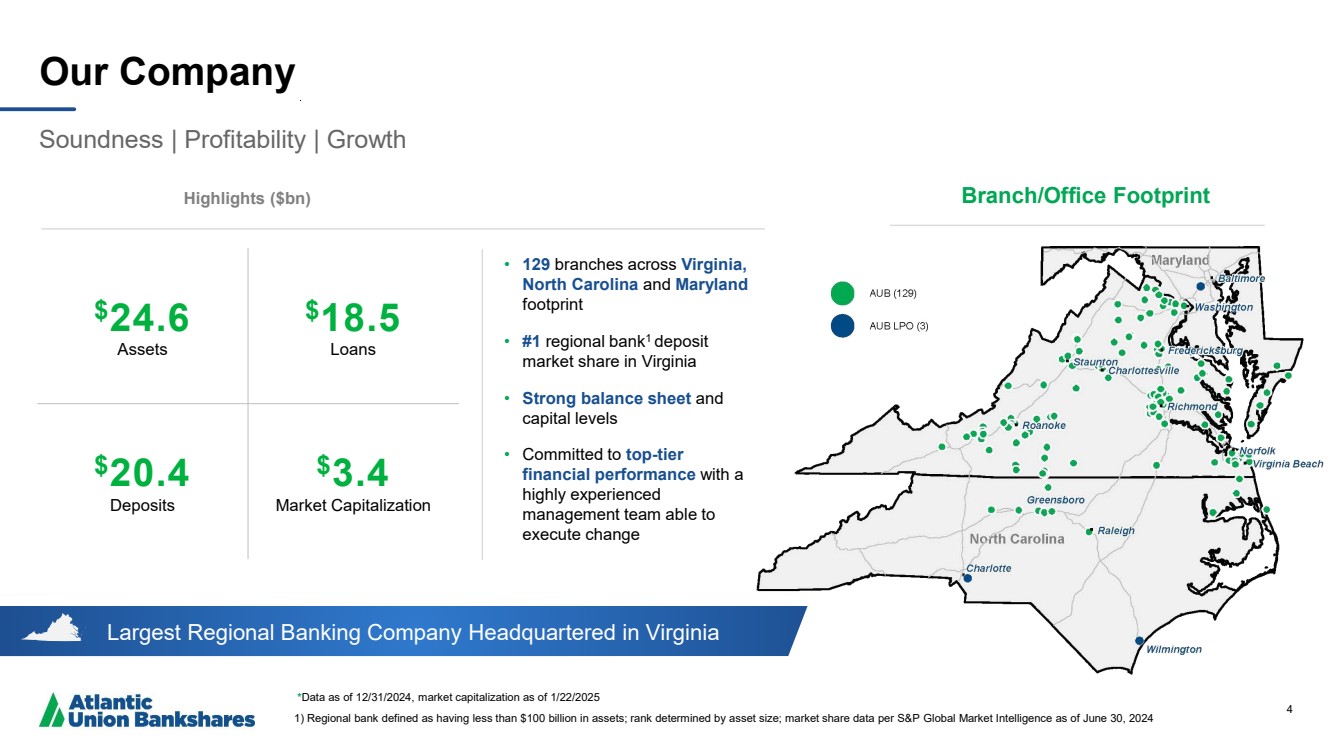
| 4 Largest Regional Banking Company Headquartered in Virginia Our Company Soundness | Profitability | Growth *Data as of 12/31/2024, market capitalization as of 1/22/2025 1) Regional bank defined as having less than $100 billion in assets; rank determined by asset size; market share data per S&P Global Market Intelligence as of June 30, 2024 Highlights ($bn) • 129 branches across Virginia, North Carolina and Maryland footprint • #1 regional bank1 deposit market share in Virginia • Strong balance sheet and capital levels • Committed to top-tier financial performance with a highly experienced management team able to execute change 4 $24.6 Assets $18.5 Loans $20.4 Deposits $3.4 Market Capitalization Branch/Office Footprint |
| 5 Our Shareholder Value Proposition Leading Regional Presence Dense, uniquely valuable presence across attractive markets Financial Strength Solid balance sheet & capital levels Attractive Financial Profile Solid dividend yield & payout ratio with earnings upside Strong Growth Potential Organic & acquisition opportunities Peer-Leading Performance Committed to top-tier financial performance |
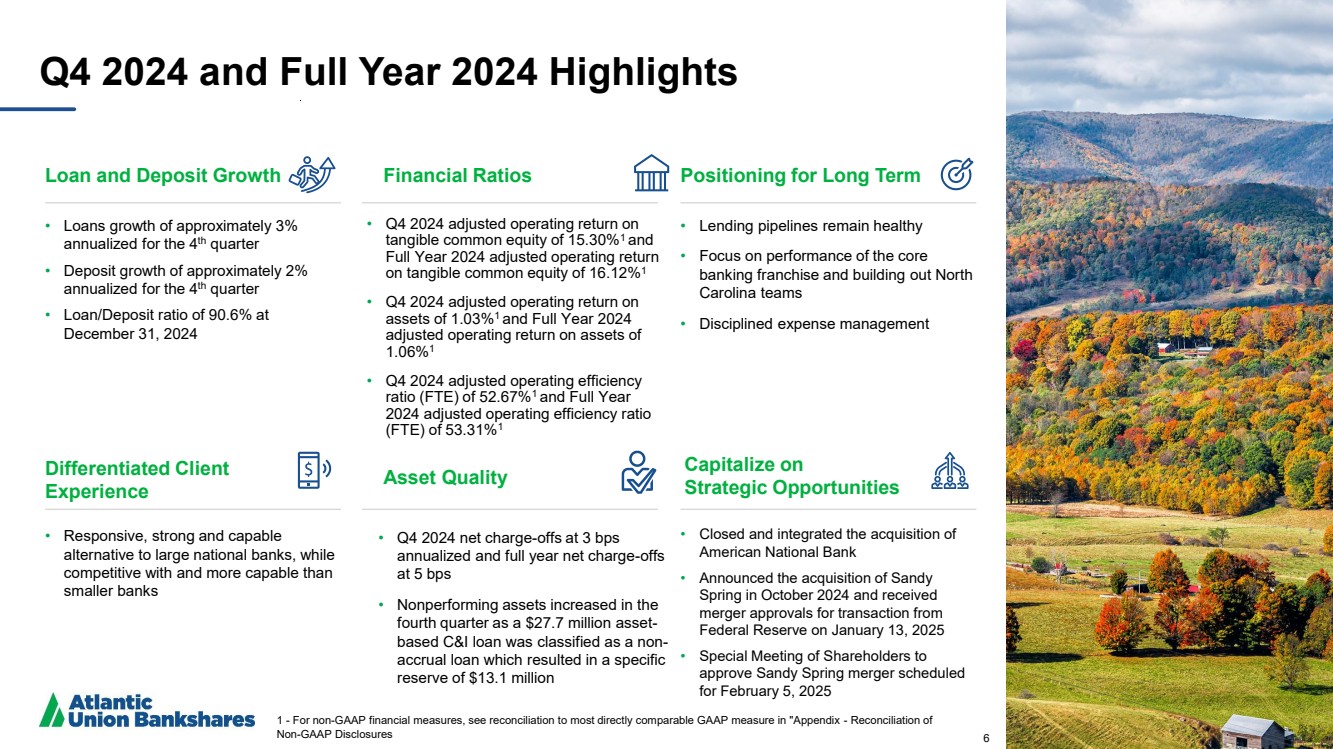
| 6 Q4 2024 and Full Year 2024 Highlights Loan and Deposit Growth • Loans growth of approximately 3% annualized for the 4th quarter • Deposit growth of approximately 2% annualized for the 4th quarter • Loan/Deposit ratio of 90.6% at December 31, 2024 Asset Quality • Q4 2024 net charge-offs at 3 bps annualized and full year net charge-offs at 5 bps • Nonperforming assets increased in the fourth quarter as a $27.7 million asset-based C&I loan was classified as a non-accrual loan which resulted in a specific reserve of $13.1 million Positioning for Long Term • Lending pipelines remain healthy • Focus on performance of the core banking franchise and building out North Carolina teams • Disciplined expense management Differentiated Client Experience • Responsive, strong and capable alternative to large national banks, while competitive with and more capable than smaller banks Financial Ratios • Q4 2024 adjusted operating return on tangible common equity of 15.30%1 and Full Year 2024 adjusted operating return on tangible common equity of 16.12%1 • Q4 2024 adjusted operating return on assets of 1.03%1 and Full Year 2024 adjusted operating return on assets of 1.06%1 • Q4 2024 adjusted operating efficiency ratio (FTE) of 52.67%1 and Full Year 2024 adjusted operating efficiency ratio (FTE) of 53.31%1 Capitalize on Strategic Opportunities • Closed and integrated the acquisition of American National Bank • Announced the acquisition of Sandy Spring in October 2024 and received merger approvals for transaction from Federal Reserve on January 13, 2025 • Special Meeting of Shareholders to approve Sandy Spring merger scheduled for February 5, 2025 6 1 - For non-GAAP financial measures, see reconciliation to most directly comparable GAAP measure in "Appendix - Reconciliation of Non-GAAP Disclosures |
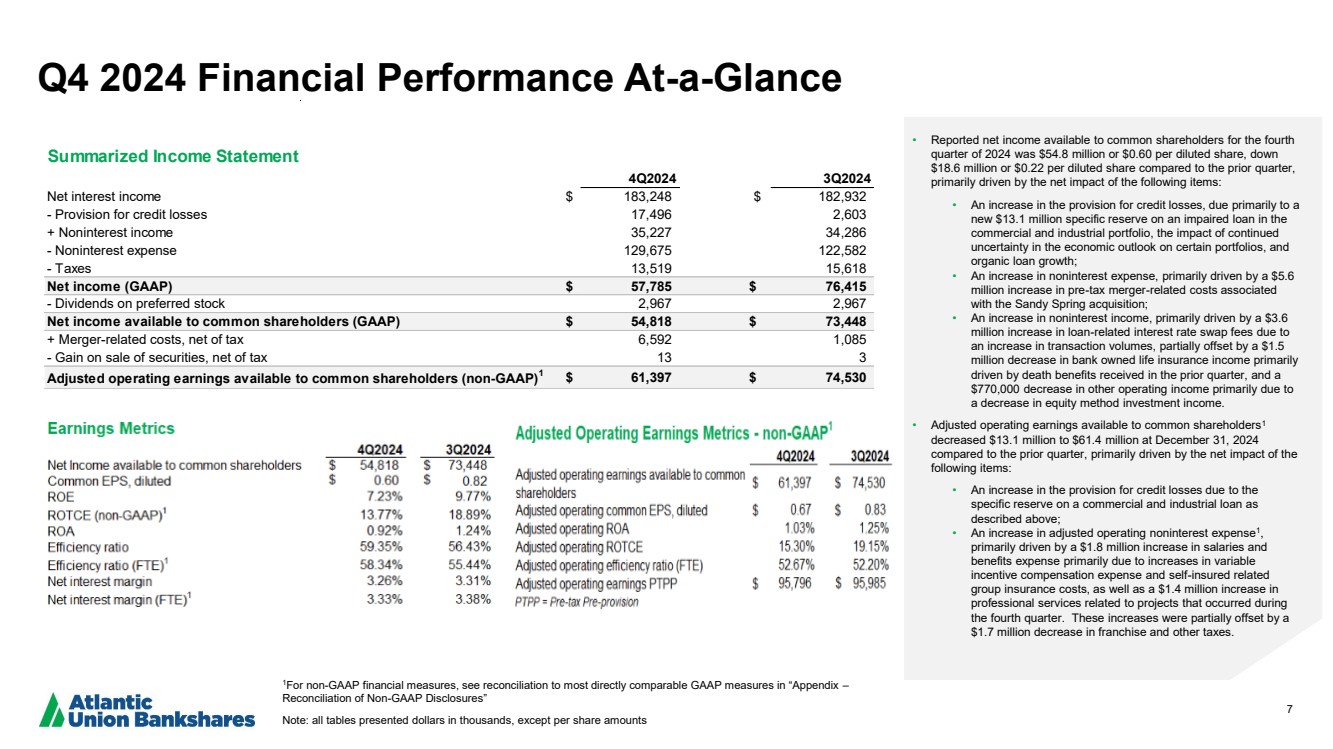
| 7 Q4 2024 Financial Performance At-a-Glance 1For non-GAAP financial measures, see reconciliation to most directly comparable GAAP measures in “Appendix – Reconciliation of Non-GAAP Disclosures” Note: all tables presented dollars in thousands, except per share amounts • Reported net income available to common shareholders for the fourth quarter of 2024 was $54.8 million or $0.60 per diluted share, down $18.6 million or $0.22 per diluted share compared to the prior quarter, primarily driven by the net impact of the following items: • An increase in the provision for credit losses, due primarily to a new $13.1 million specific reserve on an impaired loan in the commercial and industrial portfolio, the impact of continued uncertainty in the economic outlook on certain portfolios, and organic loan growth; • An increase in noninterest expense, primarily driven by a $5.6 million increase in pre-tax merger-related costs associated with the Sandy Spring acquisition; • An increase in noninterest income, primarily driven by a $3.6 million increase in loan-related interest rate swap fees due to an increase in transaction volumes, partially offset by a $1.5 million decrease in bank owned life insurance income primarily driven by death benefits received in the prior quarter, and a $770,000 decrease in other operating income primarily due to a decrease in equity method investment income. • Adjusted operating earnings available to common shareholders1 decreased $13.1 million to $61.4 million at December 31, 2024 compared to the prior quarter, primarily driven by the net impact of the following items: • An increase in the provision for credit losses due to the specific reserve on a commercial and industrial loan as described above; • An increase in adjusted operating noninterest expense1 , primarily driven by a $1.8 million increase in salaries and benefits expense primarily due to increases in variable incentive compensation expense and self-insured related group insurance costs, as well as a $1.4 million increase in professional services related to projects that occurred during the fourth quarter. These increases were partially offset by a $1.7 million decrease in franchise and other taxes. 4Q2024 3Q2024 Net interest income $ 183,248 $ 182,932 - Provision for credit losses 17,496 2,603 + Noninterest income 35,227 34,286 - Noninterest expense 129,675 122,582 - Taxes 13,519 15,618 Net income (GAAP) $ 57,785 $ 76,415 - Dividends on preferred stock 2,967 2,967 Net income available to common shareholders (GAAP) $ 54,818 $ 73,448 + Merger-related costs, net of tax 6,592 1,085 - Gain on sale of securities, net of tax 13 3 Adjusted operating earnings available to common shareholders (non-GAAP)1 $ 61,397 $ 74,530 Summarized Income Statement |
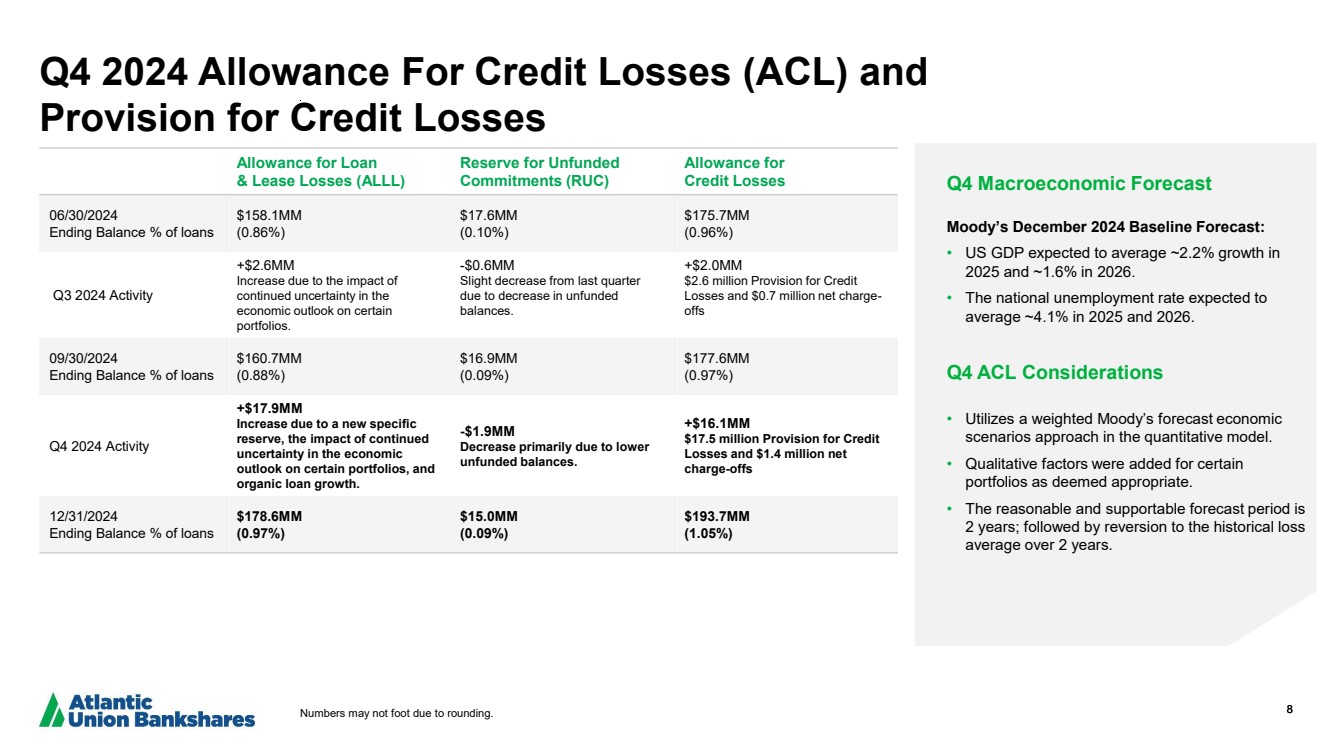
| 8 Q4 2024 Allowance For Credit Losses (ACL) and Provision for Credit Losses Q4 Macroeconomic Forecast Q4 ACL Considerations Numbers may not foot due to rounding. Moody’s December 2024 Baseline Forecast: • US GDP expected to average ~2.2% growth in 2025 and ~1.6% in 2026. • The national unemployment rate expected to average ~4.1% in 2025 and 2026. • Utilizes a weighted Moody’s forecast economic scenarios approach in the quantitative model. • Qualitative factors were added for certain portfolios as deemed appropriate. • The reasonable and supportable forecast period is 2 years; followed by reversion to the historical loss average over 2 years. Allowance for Loan & Lease Losses (ALLL) Reserve for Unfunded Commitments (RUC) Allowance for Credit Losses 06/30/2024 Ending Balance % of loans $158.1MM (0.86%) $17.6MM (0.10%) $175.7MM (0.96%) Q3 2024 Activity +$2.6MM Increase due to the impact of continued uncertainty in the economic outlook on certain portfolios. -$0.6MM Slight decrease from last quarter due to decrease in unfunded balances. +$2.0MM $2.6 million Provision for Credit Losses and $0.7 million net charge-offs 09/30/2024 Ending Balance % of loans $160.7MM (0.88%) $16.9MM (0.09%) $177.6MM (0.97%) Q4 2024 Activity +$17.9MM Increase due to a new specific reserve, the impact of continued uncertainty in the economic outlook on certain portfolios, and organic loan growth. -$1.9MM Decrease primarily due to lower unfunded balances. +$16.1MM $17.5 million Provision for Credit Losses and $1.4 million net charge-offs 12/31/2024 Ending Balance % of loans $178.6MM (0.97%) $15.0MM (0.09%) $193.7MM (1.05%) |
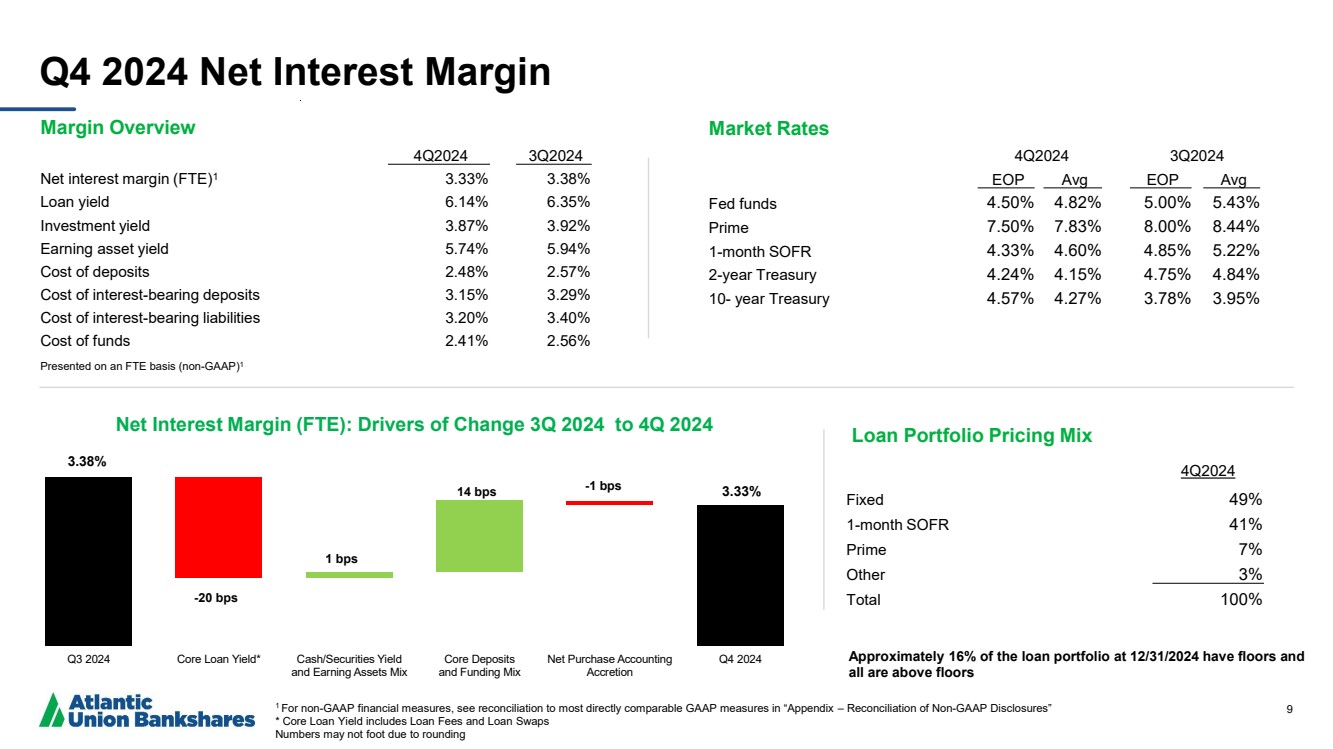
| 9 Q 2024 Core oan Yield Cash Securities Yield and Earning Assets Mix Core Deposits and Funding Mix Net Purchase Accounting Accretion Q4 2024 Net Interest Margin (FTE): Drivers of Change 3Q 2024 to 4Q 2024 Q4 2024 Net Interest Margin Market Rates 4Q2024 3Q2024 EOP Avg EOP Avg Fed funds 4.50% 4.82% 5.00% 5.43% Prime 7.50% 7.83% 8.00% 8.44% 1-month SOFR 4.33% 4.60% 4.85% 5.22% 2-year Treasury 4.24% 4.15% 4.75% 4.84% 10- year Treasury 4.57% 4.27% 3.78% 3.95% Margin Overview 4Q2024 3Q2024 Net interest margin (FTE)1 3.33% 3.38% Loan yield 6.14% 6.35% Investment yield 3.87% 3.92% Earning asset yield 5.74% 5.94% Cost of deposits 2.48% 2.57% Cost of interest-bearing deposits 3.15% 3.29% Cost of interest-bearing liabilities 3.20% 3.40% Cost of funds 2.41% 2.56% Presented on an FTE basis (non-GAAP)1 Approximately 16% of the loan portfolio at 12/31/2024 have floors and all are above floors Loan Portfolio Pricing Mix 4Q2024 Fixed 49% 1-month SOFR 41% Prime 7% Other 3% Total 100% 1 For non-GAAP financial measures, see reconciliation to most directly comparable GAAP measures in “Appendix – Reconciliation of Non-GAAP Disclosures” * Core Loan Yield includes Loan Fees and Loan Swaps Numbers may not foot due to rounding -20 bps 1 bps -1 bps 3.38% 14 bps 3.33% |
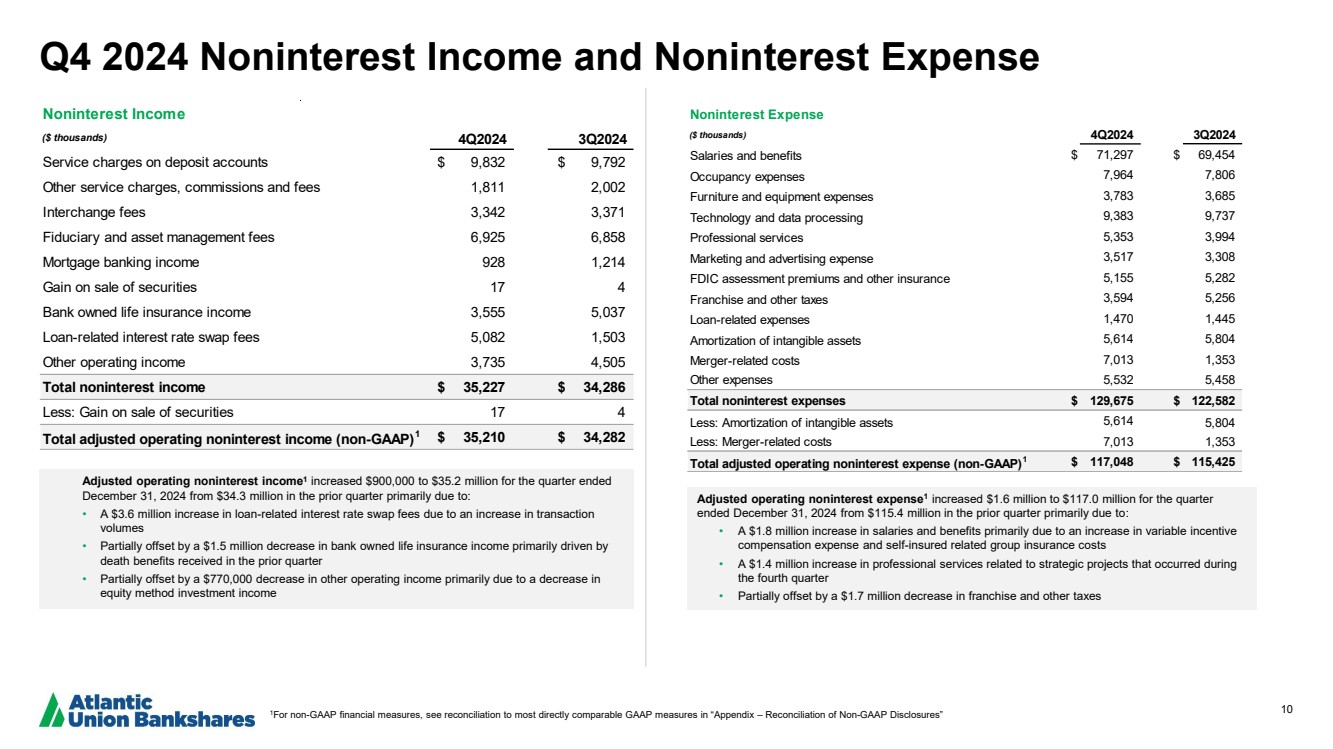
| 10 Adjusted operating noninterest expense1 increased $1.6 million to $117.0 million for the quarter ended December 31, 2024 from $115.4 million in the prior quarter primarily due to: • A $1.8 million increase in salaries and benefits primarily due to an increase in variable incentive compensation expense and self-insured related group insurance costs • A $1.4 million increase in professional services related to strategic projects that occurred during the fourth quarter • Partially offset by a $1.7 million decrease in franchise and other taxes Adjusted operating noninterest income1 increased $900,000 to $35.2 million for the quarter ended December 31, 2024 from $34.3 million in the prior quarter primarily due to: • A $3.6 million increase in loan-related interest rate swap fees due to an increase in transaction volumes • Partially offset by a $1.5 million decrease in bank owned life insurance income primarily driven by death benefits received in the prior quarter • Partially offset by a $770,000 decrease in other operating income primarily due to a decrease in equity method investment income Q4 2024 Noninterest Income and Noninterest Expense 1For non-GAAP financial measures, see reconciliation to most directly comparable GAAP measures in “Appendix – Reconciliation of Non-GAAP Disclosures” Noninterest Income ($ thousands) 4Q2024 3Q2024 Service charges on deposit accounts $ 9,832 $ 9,792 Other service charges, commissions and fees 1,811 2,002 Interchange fees 3,342 3,371 Fiduciary and asset management fees 6,925 6,858 Mortgage banking income 928 1,214 Gain on sale of securities 17 4 Bank owned life insurance income 3,555 5,037 Loan-related interest rate swap fees 5,082 1,503 Other operating income 3,735 4,505 Total noninterest income $ 35,227 $ 34,286 Less: Gain on sale of securities 17 4 Total adjusted operating noninterest income (non-GAAP)1 $ 35,210 $ 34,282 Noninterest Expense ($ thousands) 4Q2024 3Q2024 Salaries and benefits $ 71,297 $ 69,454 Occupancy expenses 7,964 7,806 Furniture and equipment expenses 3,783 3,685 Technology and data processing 9,383 9,737 Professional services 5,353 3,994 Marketing and advertising expense 3,517 3,308 FDIC assessment premiums and other insurance 5,155 5,282 Franchise and other taxes 3,594 5,256 Loan-related expenses 1,470 1,445 Amortization of intangible assets 5,614 5,804 Merger-related costs 7,013 1,353 Other expenses 5,532 5,458 Total noninterest expenses $ 129,675 $ 122,582 Less: Amortization of intangible assets 5,614 5,804 Less: Merger-related costs 7,013 1,353 Total adjusted operating noninterest expense (non-GAAP)1 $ 117,048 $ 115,425 |
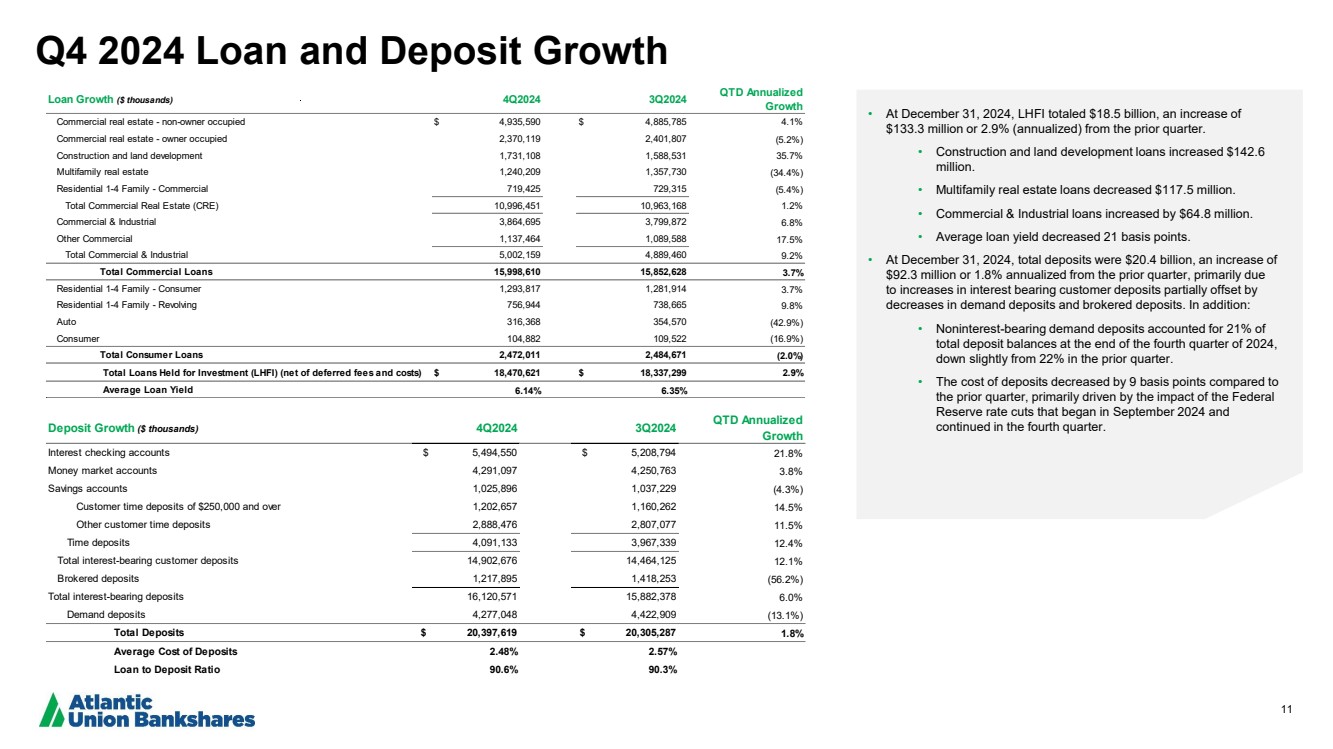
| 11 Q4 2024 Loan and Deposit Growth • At December 31, 2024, LHFI totaled $18.5 billion, an increase of $133.3 million or 2.9% (annualized) from the prior quarter. • Construction and land development loans increased $142.6 million. • Multifamily real estate loans decreased $117.5 million. • Commercial & Industrial loans increased by $64.8 million. • Average loan yield decreased 21 basis points. • At December 31, 2024, total deposits were $20.4 billion, an increase of $92.3 million or 1.8% annualized from the prior quarter, primarily due to increases in interest bearing customer deposits partially offset by decreases in demand deposits and brokered deposits. In addition: • Noninterest-bearing demand deposits accounted for 21% of total deposit balances at the end of the fourth quarter of 2024, down slightly from 22% in the prior quarter. • The cost of deposits decreased by 9 basis points compared to the prior quarter, primarily driven by the impact of the Federal Reserve rate cuts that began in September 2024 and Deposit Growth ($ thousands) 4Q2024 3Q2024 continued in the fourth quarter. QTD Annualized Growth Interest checking accounts $ 5,494,550 $ 5,208,794 21.8% Money market accounts 4,291,097 4,250,763 3.8% Savings accounts 1,025,896 1,037,229 (4.3%) Customer time deposits of $250,000 and over 1,202,657 1,160,262 14.5% Other customer time deposits 2,888,476 2,807,077 11.5% Time deposits 4,091,133 3,967,339 12.4% Total interest-bearing customer deposits 14,902,676 14,464,125 12.1% Brokered deposits 1,217,895 1,418,253 (56.2%) Total interest-bearing deposits 16,120,571 15,882,378 6.0% Demand deposits 4,277,048 4,422,909 (13.1%) Total Deposits $ 20,397,619 $ 20,305,287 1.8% Average Cost of Deposits 2.48% 2.57% Loan to Deposit Ratio 90.6% 90.3% Loan Growth ($ thousands) 4Q2024 3Q2024 QTD Annualized Growth Commercial real estate - non-owner occupied $ 4,935,590 $ 4,885,785 4.1% Commercial real estate - owner occupied 2,370,119 2,401,807 (5.2%) Construction and land development 1,731,108 1,588,531 35.7% Multifamily real estate 1,240,209 1,357,730 (34.4%) Residential 1-4 Family - Commercial 719,425 729,315 (5.4%) Total Commercial Real Estate (CRE) 10,996,451 10,963,168 1.2% Commercial & Industrial 3,864,695 3,799,872 6.8% Other Commercial 1,137,464 1,089,588 17.5% Total Commercial & Industrial 5,002,159 4,889,460 9.2% Total Commercial Loans 15,998,610 15,852,628 3.7% Residential 1-4 Family - Consumer 1,293,817 1,281,914 3.7% Residential 1-4 Family - Revolving 756,944 738,665 9.8% Auto 316,368 354,570 (42.9%) Consumer 104,882 109,522 (16.9%) Total Consumer Loans 2,472,011 2,484,671 (2.0%) Total Loans Held for Investment (LHFI) (net of deferred fees and costs) $ 18,470,621 $ 18,337,299 2.9% Average Loan Yield 6.14% 6.35% |
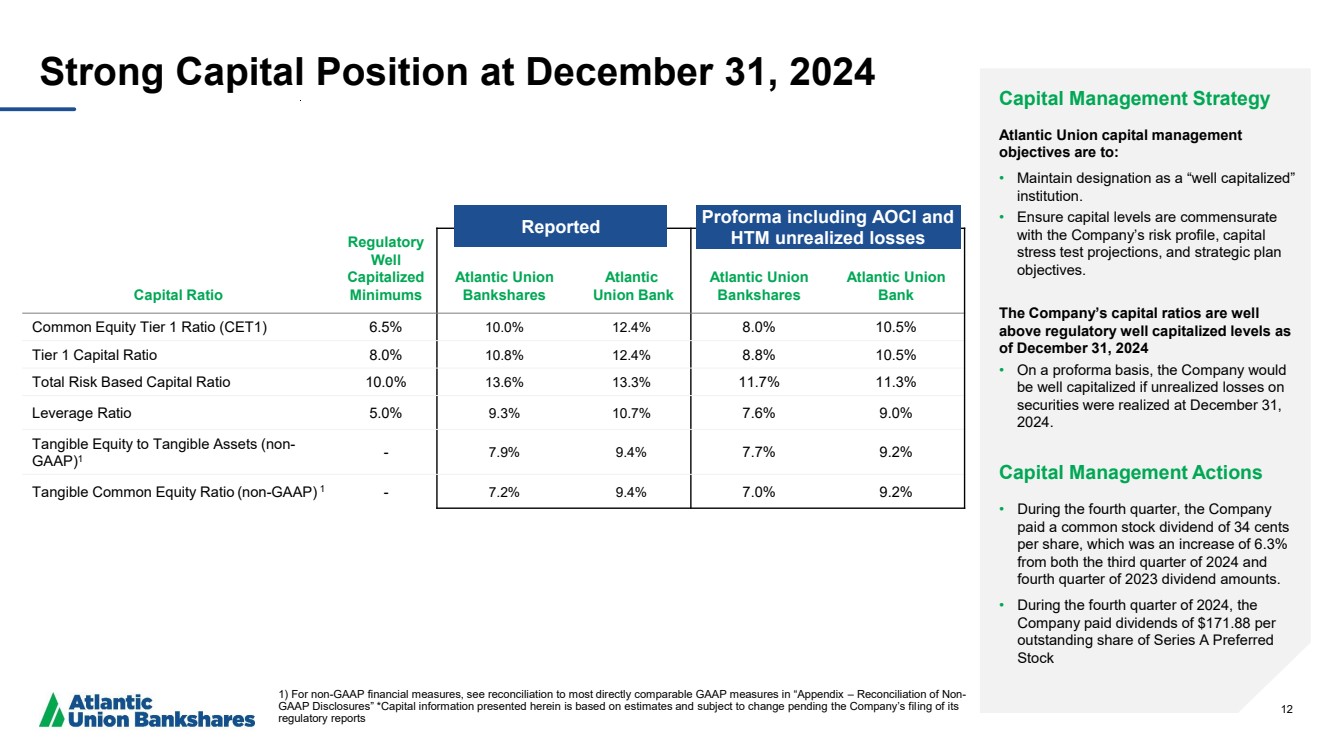
| 12 Capital Ratio Regulatory Well Capitalized Minimums Atlantic Union Bankshares Atlantic Union Bank Atlantic Union Bankshares Atlantic Union Bank Common Equity Tier 1 Ratio (CET1) 6.5% 10.0% 12.4% 8.0% 10.5% Tier 1 Capital Ratio 8.0% 10.8% 12.4% 8.8% 10.5% Total Risk Based Capital Ratio 10.0% 13.6% 13.3% 11.7% 11.3% Leverage Ratio 5.0% 9.3% 10.7% 7.6% 9.0% Tangible Equity to Tangible Assets (non-GAAP)1 - 7.9% 9.4% 7.7% 9.2% Tangible Common Equity Ratio (non-GAAP) 1 - 7.2% 9.4% 7.0% 9.2% Strong Capital Position at December 31, 2024 1) For non-GAAP financial measures, see reconciliation to most directly comparable GAAP measures in “Appendix – Reconciliation of Non-GAAP Disclosures” Capital information presented herein is based on estimates and subject to change pending the Company’s filing of its regulatory reports Capital Management Strategy Atlantic Union capital management objectives are to: • Maintain designation as a “well capitalized” institution. • Ensure capital levels are commensurate with the Company’s risk profile, capital stress test projections, and strategic plan objectives. The Company’s capital ratios are well above regulatory well capitalized levels as of December 31, 2024 • On a proforma basis, the Company would be well capitalized if unrealized losses on securities were realized at December 31, 2024. Capital Management Actions • During the fourth quarter, the Company paid a common stock dividend of 34 cents per share, which was an increase of 6.3% from both the third quarter of 2024 and fourth quarter of 2023 dividend amounts. • During the fourth quarter of 2024, the Company paid dividends of $171.88 per outstanding share of Series A Preferred Stock Reported Proforma including AOCI and HTM unrealized losses |
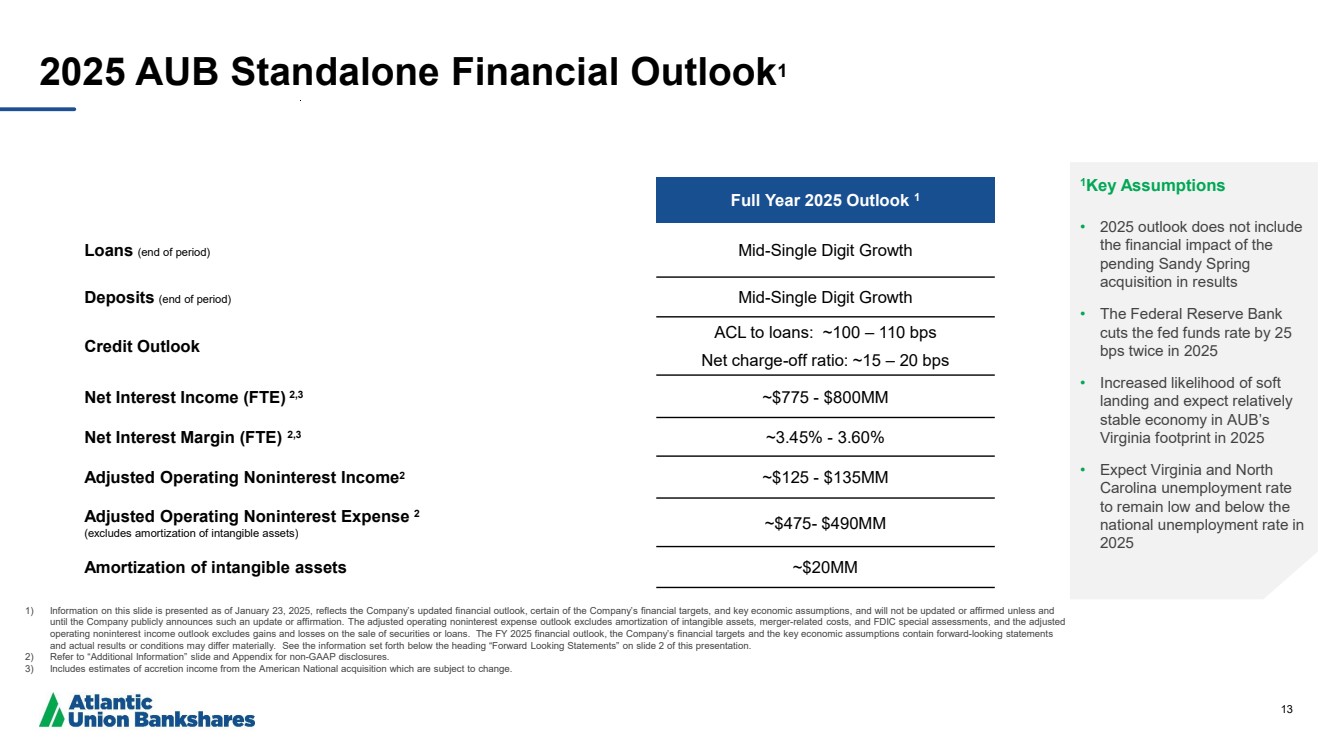
| 13 2025 AUB Standalone Financial Outlook1 1Key Assumptions • 2025 outlook does not include the financial impact of the pending Sandy Spring acquisition in results • The Federal Reserve Bank cuts the fed funds rate by 25 bps twice in 2025 • Increased likelihood of soft landing and expect relatively stable economy in AUB’s Virginia footprint in 2025 • Expect Virginia and North Carolina unemployment rate to remain low and below the national unemployment rate in 2025 Full Year 2025 Outlook 1 Loans (end of period) Mid-Single Digit Growth Deposits (end of period) Mid-Single Digit Growth Credit Outlook ACL to loans: ~100 – 110 bps Net charge-off ratio: ~15 – 20 bps Net Interest Income (FTE) 2,3 ~$775 - $800MM Net Interest Margin (FTE) 2,3 ~3.45% - 3.60% Adjusted Operating Noninterest Income2 ~$125 - $135MM Adjusted Operating Noninterest Expense 2 (excludes amortization of intangible assets) ~$475- $490MM Amortization of intangible assets ~$20MM 1) Information on this slide is presented as of January 23, 2025, reflects the Company’s updated financial outlook, certain of the Company’s financial targets, and key economic assumptions, and will not be updated or affirmed unless and until the Company publicly announces such an update or affirmation. The adjusted operating noninterest expense outlook excludes amortization of intangible assets, merger-related costs, and FDIC special assessments, and the adjusted operating noninterest income outlook excludes gains and losses on the sale of securities or loans. The FY 2025 financial outlook, the Company’s financial targets and the key economic assumptions contain forward-looking statements and actual results or conditions may differ materially. See the information set forth below the heading “Forward ooking Statements” on slide 2 of this presentation. 2) Refer to “Additional Information” slide and Appendix for non-GAAP disclosures. 3) Includes estimates of accretion income from the American National acquisition which are subject to change. |
| 14 Appendix |

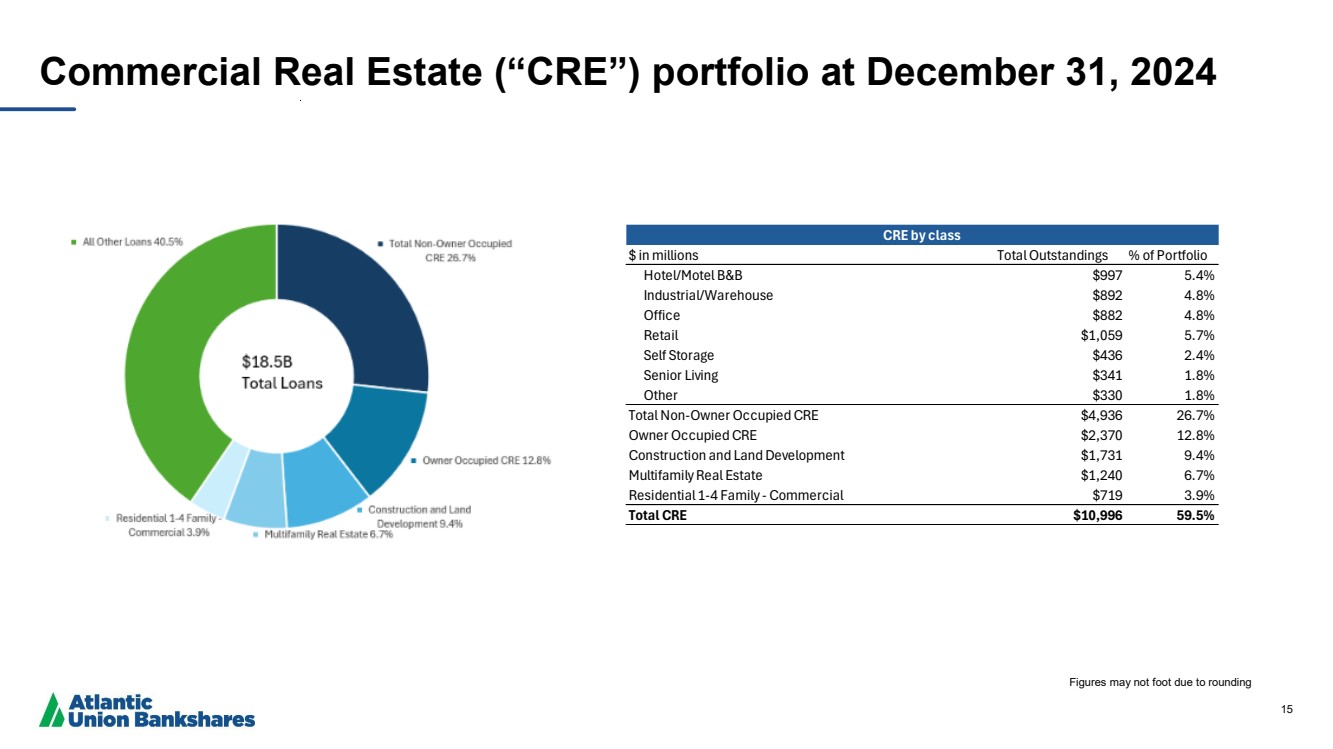
| 15 Commercial Real Estate (“CRE”) portfolio at December 31, 2024 Figures may not foot due to rounding CRE by class $ in millions Total Outstandings % of Portfolio Hotel/Motel B&B $997 5.4% Industrial/Warehouse $892 4.8% Office $882 4.8% Retail $1,059 5.7% Self Storage $436 2.4% Senior Living $341 1.8% Other $330 1.8% Total Non-Owner Occupied CRE $4,936 26.7% Owner Occupied CRE $2,370 12.8% Construction and Land Development $1,731 9.4% Multifamily Real Estate $1,240 6.7% Residential 1-4 Family - Commercial $719 3.9% Total CRE $10,996 59.5% |
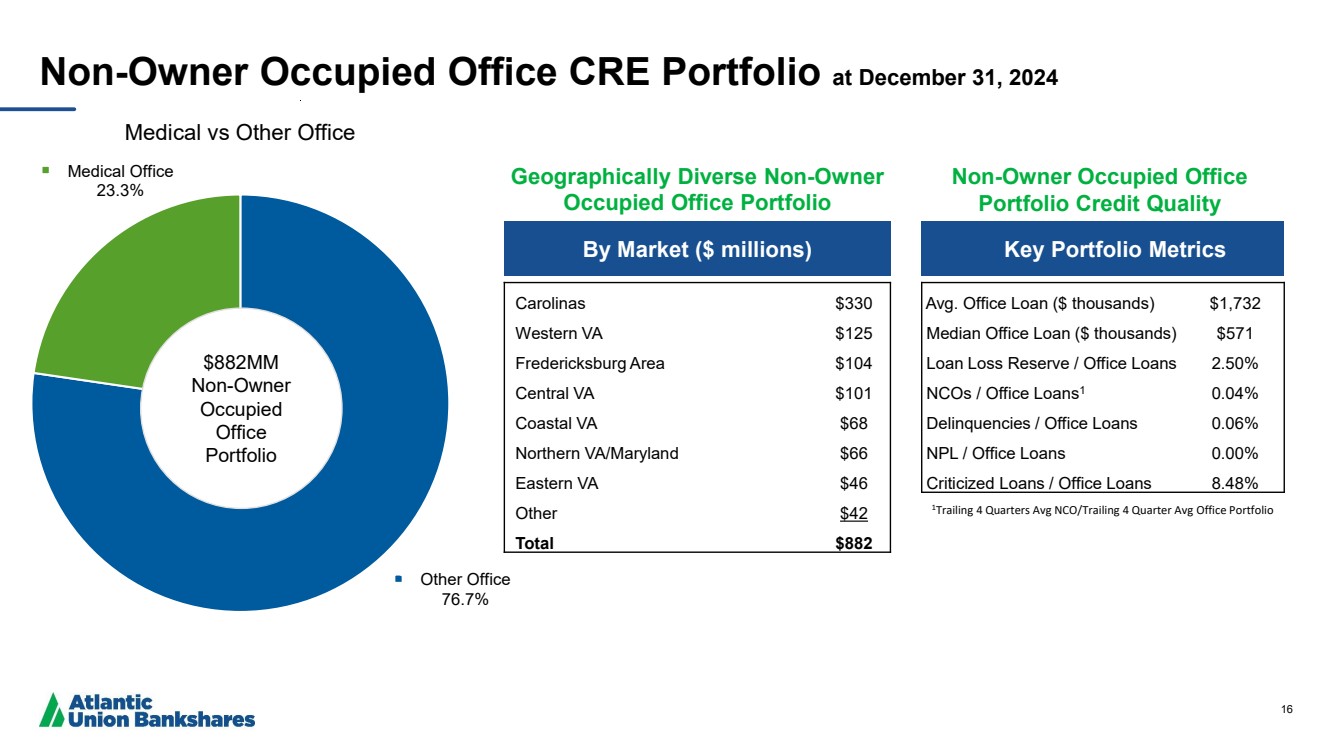
| 16 Other Office 76.7% Medical Office 23.3% Medical vs Other Office By Market ($ millions) Key Portfolio Metrics Carolinas $330 Western VA $125 Fredericksburg Area $104 Central VA $101 Coastal VA $68 Northern VA/Maryland $66 Eastern VA $46 Other $42 Total $882 Avg. Office Loan ($ thousands) $1,732 Median Office Loan ($ thousands) $571 Loan Loss Reserve / Office Loans 2.50% NCOs / Office Loans1 0.04% Delinquencies / Office Loans 0.06% NPL / Office Loans 0.00% Criticized Loans / Office Loans 8.48% Non-Owner Occupied Office CRE Portfolio at December 31, 2024 $882MM Non-Owner Occupied Office Portfolio Non-Owner Occupied Office Portfolio Credit Quality Geographically Diverse Non-Owner Occupied Office Portfolio 1Trailing 4 Quarters Avg NCO/Trailing 4 Quarter Avg Office Portfolio |
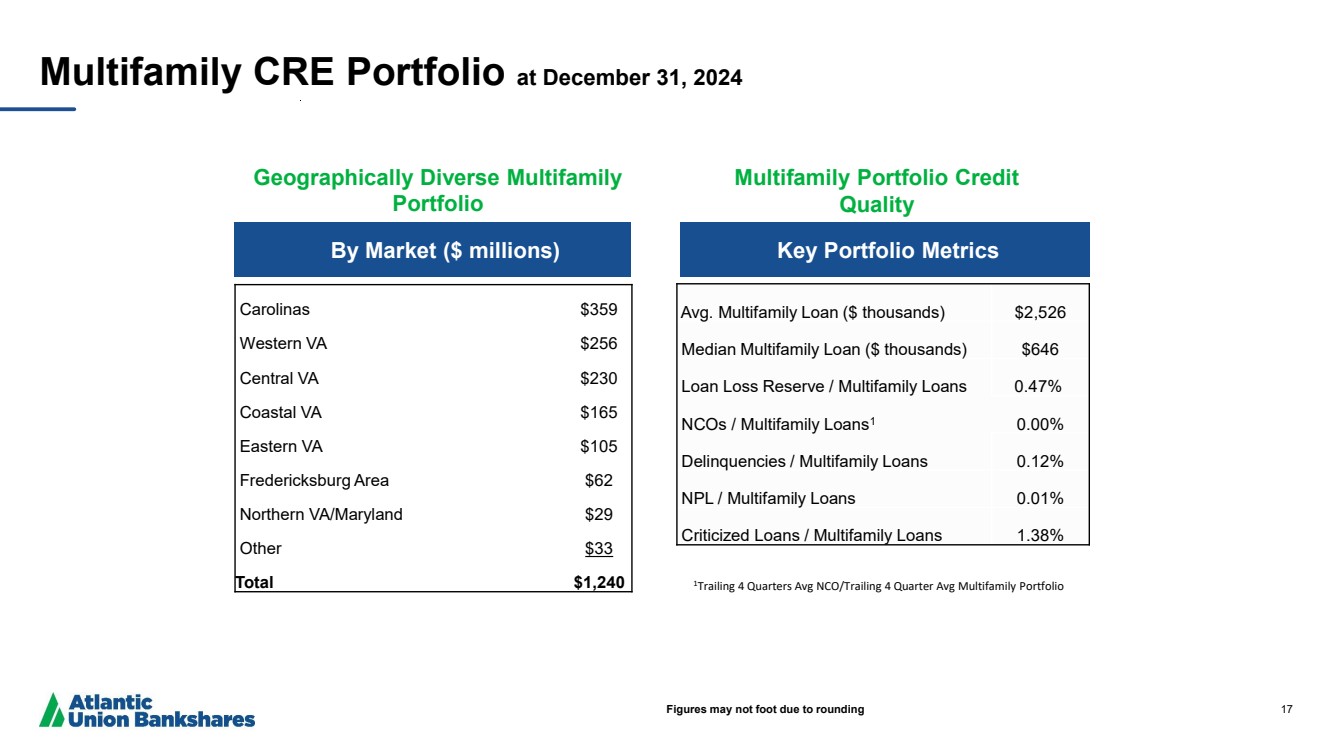
| 17 By Market ($ millions) Key Portfolio Metrics Multifamily CRE Portfolio at December 31, 2024 Multifamily Portfolio Credit Quality Geographically Diverse Multifamily Portfolio 1Trailing 4 Quarters Avg NCO/Trailing 4 Quarter Avg Multifamily Portfolio Figures may not foot due to rounding Avg. Multifamily Loan ($ thousands) $2,526 Median Multifamily Loan ($ thousands) $646 Loan Loss Reserve / Multifamily Loans 0.47% NCOs / Multifamily Loans1 0.00% Delinquencies / Multifamily Loans 0.12% NPL / Multifamily Loans 0.01% Criticized Loans / Multifamily Loans 1.38% Carolinas $359 Western VA $256 Central VA $230 Coastal VA $165 Eastern VA $105 Fredericksburg Area $62 Northern VA/Maryland $29 Other $33 Total $1,240 |
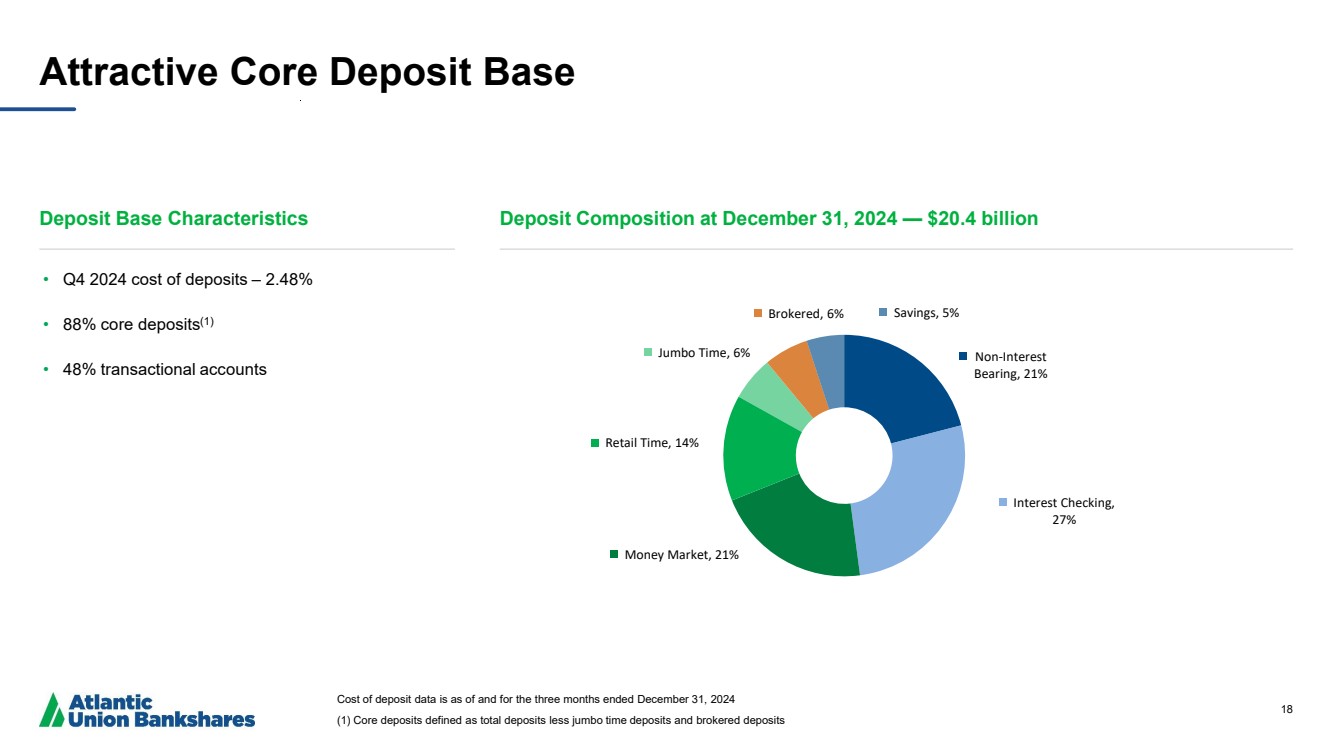
| 18 Attractive Core Deposit Base Deposit Base Characteristics Deposit Composition at December 31, 2024 — $20.4 billion Cost of deposit data is as of and for the three months ended December 31, 2024 (1) Core deposits defined as total deposits less jumbo time deposits and brokered deposits • Q4 2024 cost of deposits – 2.48% • 88% core deposits(1) • 48% transactional accounts Non-Interest Bearing, 21% Interest Checking, 27% Money Market, 21% Retail Time, 14% Jumbo Time, 6% Brokered, 6% Savings, 5% |
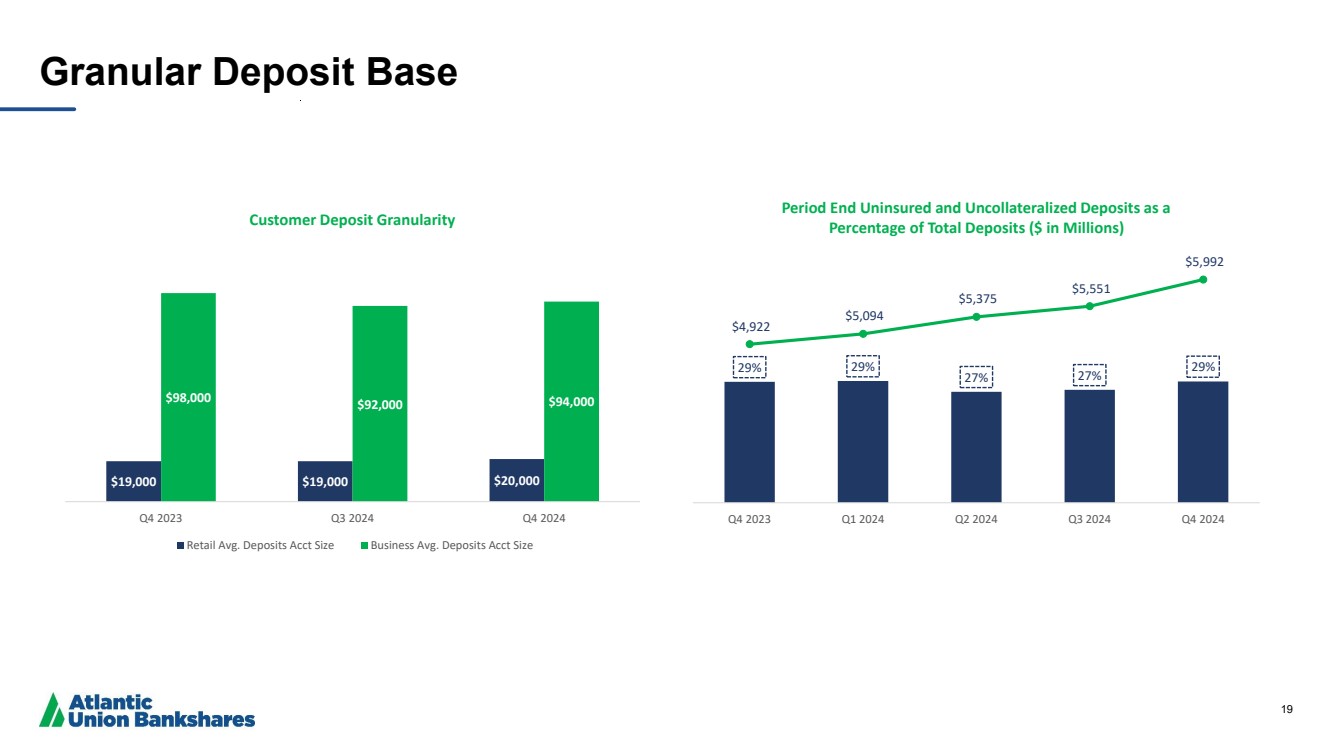
| 19 Granular Deposit Base $19,000 $19,000 $20,000 $98,000 $92,000 $94,000 Q4 2023 Q3 2024 Q4 2024 Customer Deposit Granularity Retail Avg. Deposits Acct Size Business Avg. Deposits Acct Size 29% 29% 27% 27% 29% $4,922 $5,094 $5,375 $5,551 $5,992 Q4 2023 Q1 2024 Q2 2024 Q3 2024 Q4 2024 Period End Uninsured and Uncollateralized Deposits as a Percentage of Total Deposits ($ in Millions) |
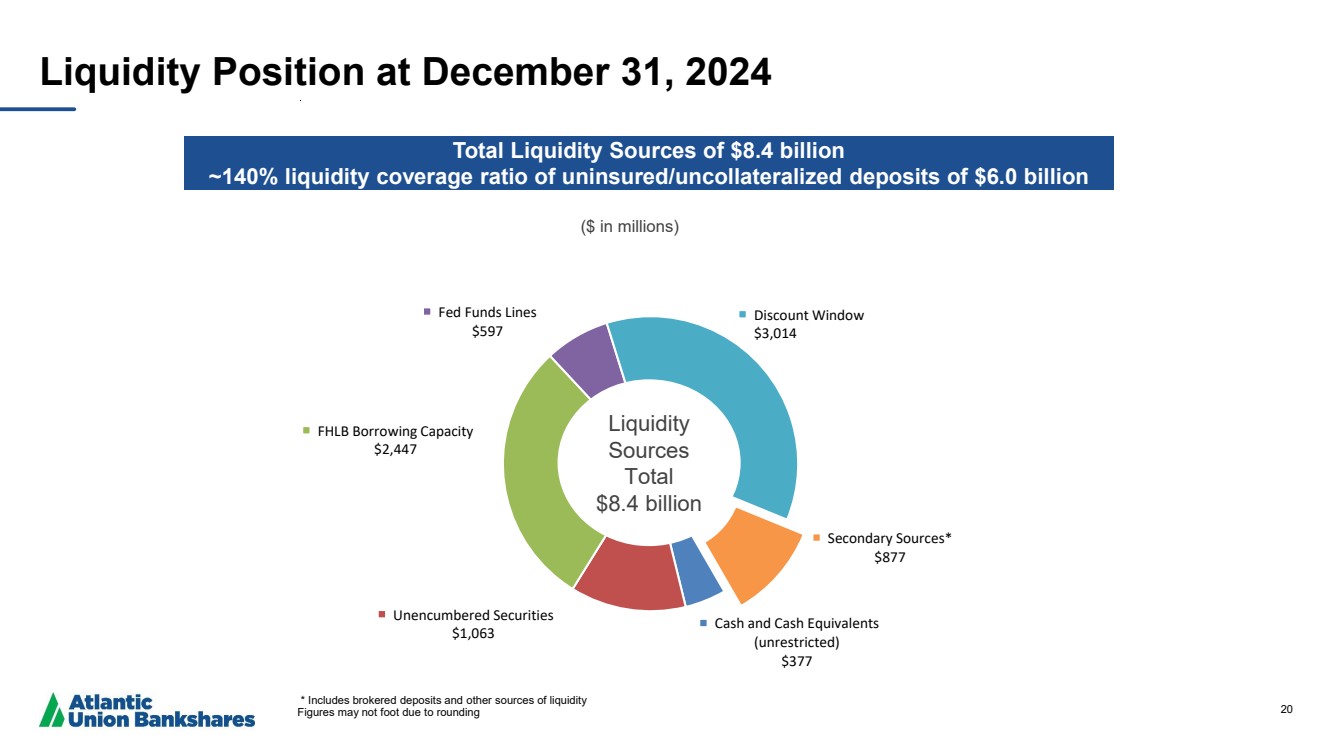
| 20 Cash and Cash Equivalents (unrestricted) $377 Unencumbered Securities $1,063 FHLB Borrowing Capacity $2,447 Fed Funds Lines $597 Discount Window $3,014 Secondary Sources* $877 ($ in millions) Liquidity Position at December 31, 2024 Total Liquidity Sources of $8.4 billion ~140% liquidity coverage ratio of uninsured/uncollateralized deposits of $6.0 billion * Includes brokered deposits and other sources of liquidity Figures may not foot due to rounding Liquidity Sources Total $8.4 billion |
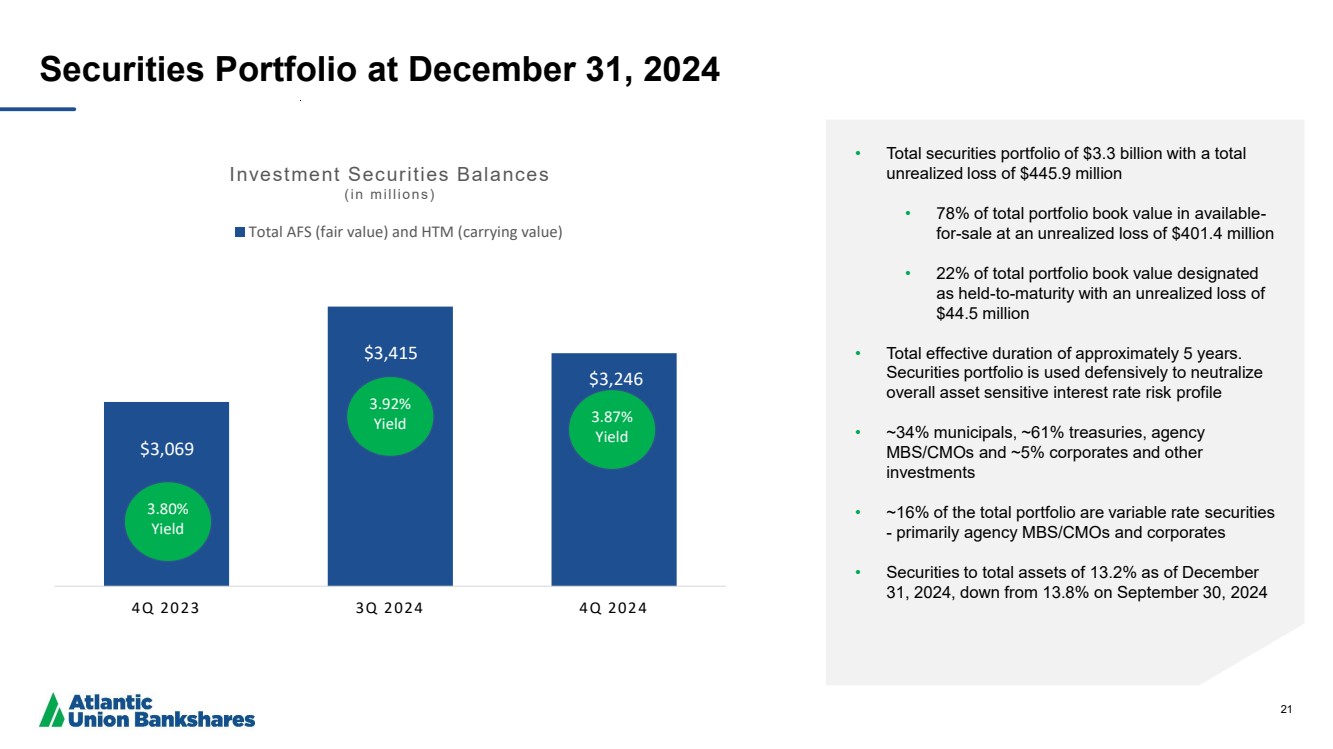
| 21 Securities Portfolio at December 31, 2024 • Total securities portfolio of $3.3 billion with a total unrealized loss of $445.9 million • 78% of total portfolio book value in available-for-sale at an unrealized loss of $401.4 million • 22% of total portfolio book value designated as held-to-maturity with an unrealized loss of $44.5 million • Total effective duration of approximately 5 years. Securities portfolio is used defensively to neutralize overall asset sensitive interest rate risk profile • ~34% municipals, ~61% treasuries, agency MBS/CMOs and ~5% corporates and other investments • ~16% of the total portfolio are variable rate securities - primarily agency MBS/CMOs and corporates • Securities to total assets of 13.2% as of December 31, 2024, down from 13.8% on September 30, 2024 $3,069 $3,415 $3,246 4Q 2023 3Q 2024 4Q 2024 Investment Securities Balances (in m illions) Total AFS (fair value) and HTM (carrying value) 3.80% Yield 3.87% Yield 3.92% Yield |
| 22 Reconciliation of Non-GAAP Disclosures We have provided supplemental performance measures determined by methods other than in accordance with GAAP. These non-GAAP financial measures are a supplement to GAAP, which we use to prepare our financial statements, and should not be considered in isolation or as a substitute for comparable measures calculated in accordance with GAAP. In addition, our non-GAAP financial measures may not be comparable to non-GAAP financial measures of other companies. We use the non-GAAP financial measures discussed herein in our analysis of our performance. Management believes that these non-GAAP financial measures provide additional understanding of ongoing operations, enhance comparability of results of operations with prior periods and show the effects of significant gains and charges in the periods presented without the impact of items or events that may obscure trends in our underlying performance or show the potential effects of accumulated other comprehensive income or unrealized losses on held to maturity securities on our capital. |
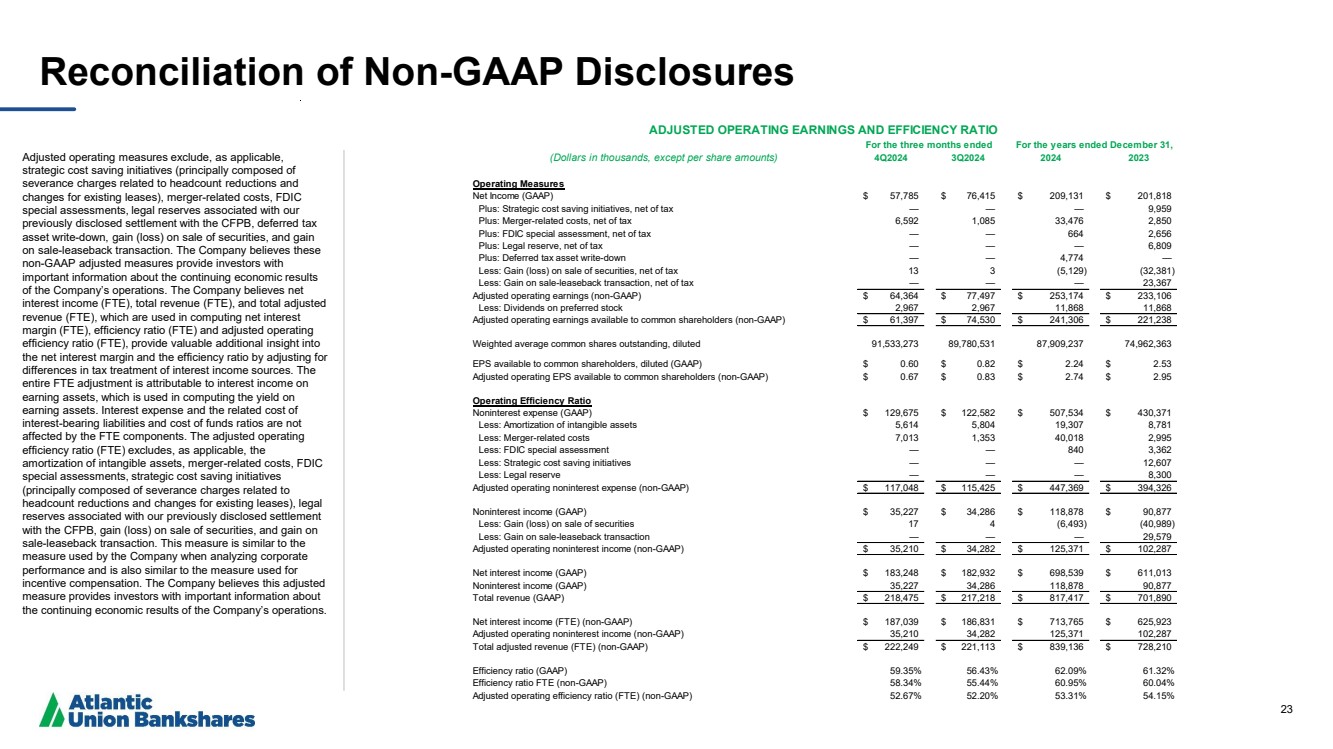
| 23 Reconciliation of Non-GAAP Disclosures Adjusted operating measures exclude, as applicable, strategic cost saving initiatives (principally composed of severance charges related to headcount reductions and changes for existing leases), merger-related costs, FDIC special assessments, legal reserves associated with our previously disclosed settlement with the CFPB, deferred tax asset write-down, gain (loss) on sale of securities, and gain on sale-leaseback transaction. The Company believes these non-GAAP adjusted measures provide investors with important information about the continuing economic results of the Company’s operations. The Company believes net interest income (FTE), total revenue (FTE), and total adjusted revenue (FTE), which are used in computing net interest margin (FTE), efficiency ratio (FTE) and adjusted operating efficiency ratio (FTE), provide valuable additional insight into the net interest margin and the efficiency ratio by adjusting for differences in tax treatment of interest income sources. The entire FTE adjustment is attributable to interest income on earning assets, which is used in computing the yield on earning assets. Interest expense and the related cost of interest-bearing liabilities and cost of funds ratios are not affected by the FTE components. The adjusted operating efficiency ratio (FTE) excludes, as applicable, the amortization of intangible assets, merger-related costs, FDIC special assessments, strategic cost saving initiatives (principally composed of severance charges related to headcount reductions and changes for existing leases), legal reserves associated with our previously disclosed settlement with the CFPB, gain (loss) on sale of securities, and gain on sale-leaseback transaction. This measure is similar to the measure used by the Company when analyzing corporate performance and is also similar to the measure used for incentive compensation. The Company believes this adjusted measure provides investors with important information about the continuing economic results of the Company’s operations. (Dollars in thousands, except per share amounts) 4Q2024 3Q2024 2024 2023 Operating Measures Net Income (GAAP) $ 57,785 $ 76,415 $ 209,131 $ 201,818 Plus: Strategic cost saving initiatives, net of tax — — — 9,959 Plus: Merger-related costs, net of tax 6,592 1,085 33,476 2,850 Plus: FDIC special assessment, net of tax — — 664 2,656 Plus: Legal reserve, net of tax — — — 6,809 Plus: Deferred tax asset write-down — — 4,774 — Less: Gain (loss) on sale of securities, net of tax 13 3 (5,129) (32,381) Less: Gain on sale-leaseback transaction, net of tax — — — 23,367 Adjusted operating earnings (non-GAAP) $ 64,364 $ 77,497 $ 253,174 $ 233,106 Less: Dividends on preferred stock 2,967 2,967 11,868 11,868 Adjusted operating earnings available to common shareholders (non-GAAP) $ 61,397 $ 74,530 $ 241,306 $ 221,238 Weighted average common shares outstanding, diluted 91,533,273 89,780,531 87,909,237 74,962,363 EPS available to common shareholders, diluted (GAAP) $ 0.60 $ 0.82 $ 2.24 $ 2.53 Adjusted operating EPS available to common shareholders (non-GAAP) $ 0.67 $ 0.83 $ 2.74 $ 2.95 Operating Efficiency Ratio Noninterest expense (GAAP) $ 129,675 $ 122,582 $ 507,534 $ 430,371 Less: Amortization of intangible assets 5,614 5,804 19,307 8,781 Less: Merger-related costs 7,013 1,353 40,018 2,995 Less: FDIC special assessment — — 840 3,362 Less: Strategic cost saving initiatives — — — 12,607 Less: Legal reserve — — — 8,300 Adjusted operating noninterest expense (non-GAAP) $ 117,048 $ 115,425 $ 447,369 $ 394,326 Noninterest income (GAAP) $ 35,227 $ 34,286 $ 118,878 $ 90,877 Less: Gain (loss) on sale of securities 17 4 (6,493) (40,989) Less: Gain on sale-leaseback transaction — — — 29,579 Adjusted operating noninterest income (non-GAAP) $ 35,210 $ 34,282 $ 125,371 $ 102,287 Net interest income (GAAP) $ 183,248 $ 182,932 $ 698,539 $ 611,013 Noninterest income (GAAP) 35,227 34,286 118,878 90,877 Total revenue (GAAP) $ 218,475 $ 217,218 $ 817,417 $ 701,890 Net interest income (FTE) (non-GAAP) $ 187,039 $ 186,831 $ 713,765 $ 625,923 Adjusted operating noninterest income (non-GAAP) 35,210 34,282 125,371 102,287 Total adjusted revenue (FTE) (non-GAAP) $ 222,249 $ 221,113 $ 839,136 $ 728,210 Efficiency ratio (GAAP) 59.35% 56.43% 62.09% 61.32% Efficiency ratio FTE (non-GAAP) 58.34% 55.44% 60.95% 60.04% Adjusted operating efficiency ratio (FTE) (non-GAAP) 52.67% 52.20% 53.31% 54.15% ADJUSTED OPERATING EARNINGS AND EFFICIENCY RATIO For the three months ended For the years ended December 31, |
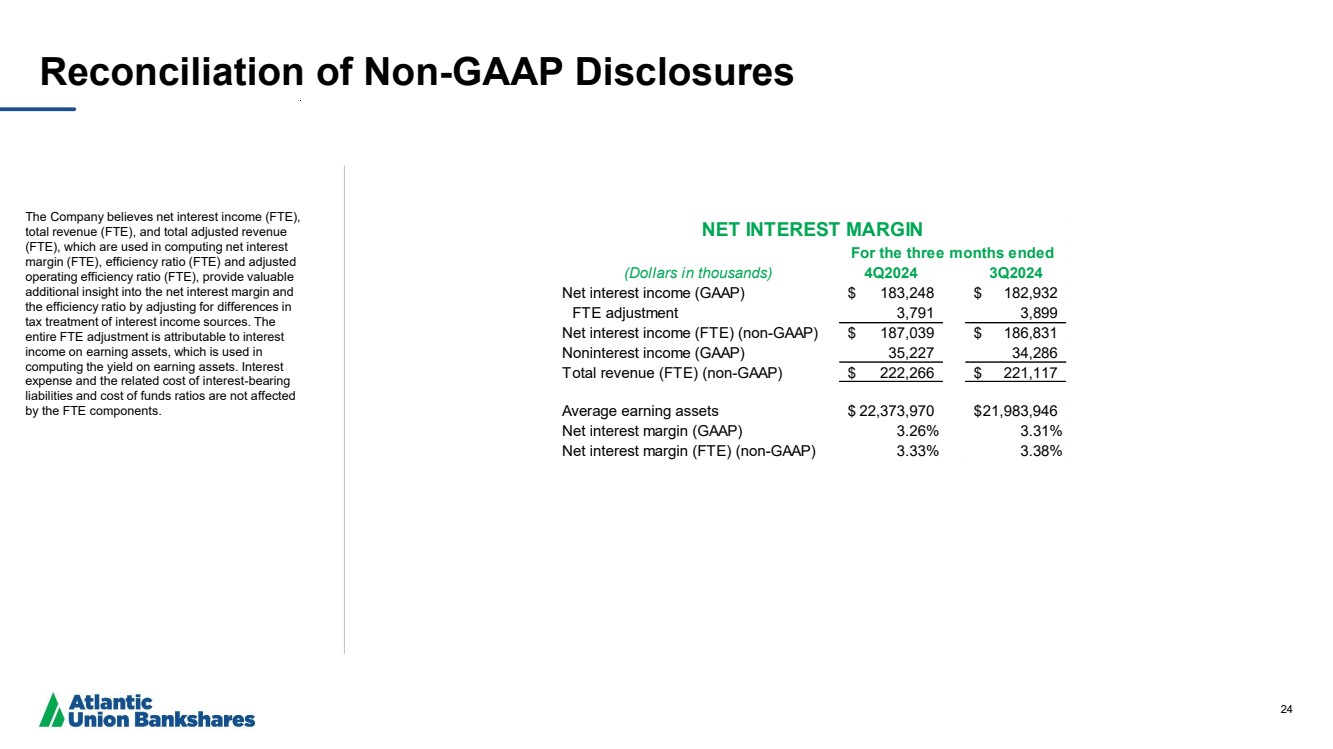
| 24 Reconciliation of Non-GAAP Disclosures The Company believes net interest income (FTE), total revenue (FTE), and total adjusted revenue (FTE), which are used in computing net interest margin (FTE), efficiency ratio (FTE) and adjusted operating efficiency ratio (FTE), provide valuable additional insight into the net interest margin and the efficiency ratio by adjusting for differences in tax treatment of interest income sources. The entire FTE adjustment is attributable to interest income on earning assets, which is used in computing the yield on earning assets. Interest expense and the related cost of interest-bearing liabilities and cost of funds ratios are not affected by the FTE components. (Dollars in thousands) 4Q2024 3Q2024 Net interest income (GAAP) $ 183,248 $ 182,932 FTE adjustment 3,791 3,899 Net interest income (FTE) (non-GAAP) $ 187,039 $ 186,831 Noninterest income (GAAP) 35,227 34,286 Total revenue (FTE) (non-GAAP) $ 222,266 $ 221,117 Average earning assets $ 22,373,970 $21,983,946 Net interest margin (GAAP) 3.26% 3.31% Net interest margin (FTE) (non-GAAP) 3.33% 3.38% NET INTEREST MARGIN For the three months ended |
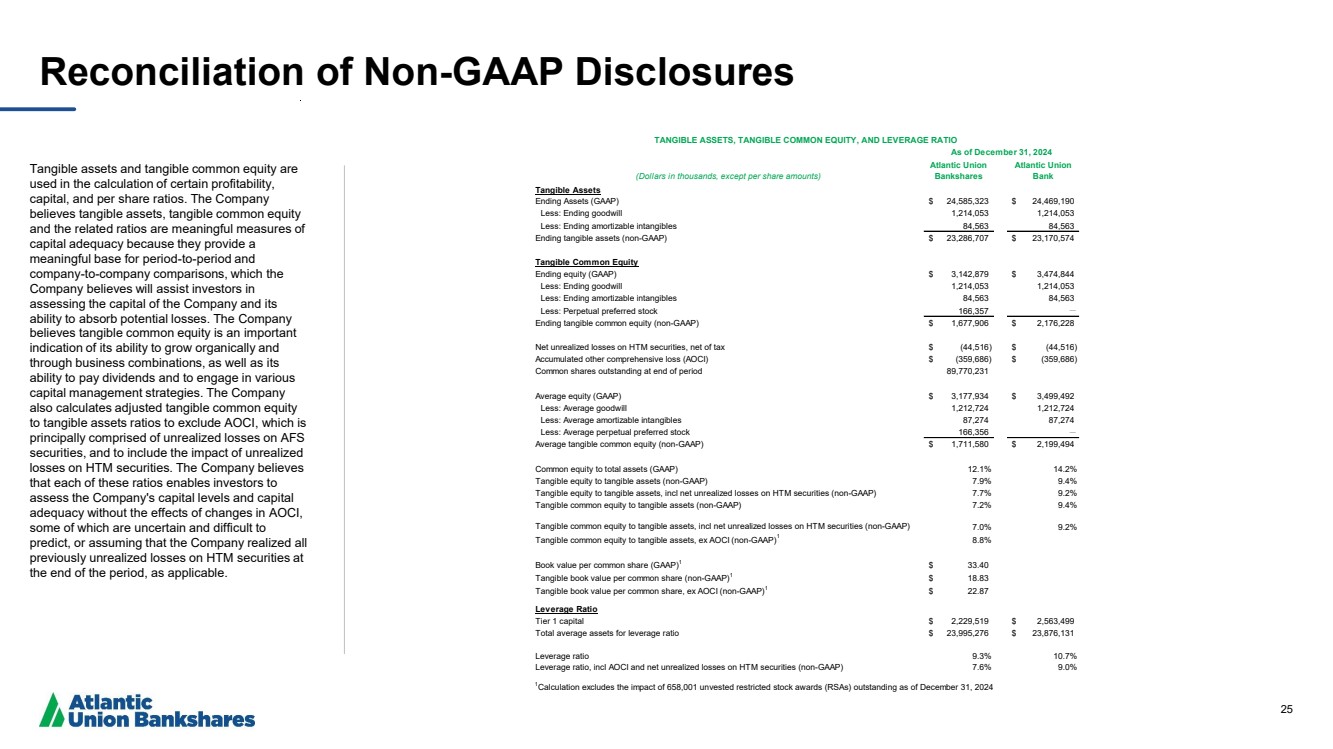
| 25 Reconciliation of Non-GAAP Disclosures Tangible assets and tangible common equity are used in the calculation of certain profitability, capital, and per share ratios. The Company believes tangible assets, tangible common equity and the related ratios are meaningful measures of capital adequacy because they provide a meaningful base for period-to-period and company-to-company comparisons, which the Company believes will assist investors in assessing the capital of the Company and its ability to absorb potential losses. The Company believes tangible common equity is an important indication of its ability to grow organically and through business combinations, as well as its ability to pay dividends and to engage in various capital management strategies. The Company also calculates adjusted tangible common equity to tangible assets ratios to exclude AOCI, which is principally comprised of unrealized losses on AFS securities, and to include the impact of unrealized losses on HTM securities. The Company believes that each of these ratios enables investors to assess the Company's capital levels and capital adequacy without the effects of changes in AOCI, some of which are uncertain and difficult to predict, or assuming that the Company realized all previously unrealized losses on HTM securities at the end of the period, as applicable. (Dollars in thousands, except per share amounts) Atlantic Union Bankshares Atlantic Union Bank Tangible Assets Ending Assets (GAAP) $ 24,585,323 $ 24,469,190 Less: Ending goodwill 1,214,053 1,214,053 Less: Ending amortizable intangibles 84,563 84,563 Ending tangible assets (non-GAAP) $ 23,286,707 $ 23,170,574 Tangible Common Equity Ending equity (GAAP) $ 3,142,879 $ 3,474,844 Less: Ending goodwill 1,214,053 1,214,053 Less: Ending amortizable intangibles 84,563 84,563 Less: Perpetual preferred stock 166,357 — Ending tangible common equity (non-GAAP) $ 1,677,906 $ 2,176,228 Net unrealized losses on HTM securities, net of tax $ (44,516) $ (44,516) Accumulated other comprehensive loss (AOCI) $ (359,686) $ (359,686) Common shares outstanding at end of period 89,770,231 Average equity (GAAP) $ 3,177,934 $ 3,499,492 Less: Average goodwill 1,212,724 1,212,724 Less: Average amortizable intangibles 87,274 87,274 Less: Average perpetual preferred stock 166,356 — Average tangible common equity (non-GAAP) $ 1,711,580 $ 2,199,494 Less: Perpetual preferred stock Common equity to total assets (GAAP) 12.1% 14.2% Tangible equity to tangible assets (non-GAAP) 7.9% 9.4% Tangible equity to tangible assets, incl net unrealized losses on HTM securities (non-GAAP) 7.7% 9.2% Tangible common equity to tangible assets (non-GAAP) 7.2% 9.4% Tangible common equity to tangible assets, incl net unrealized losses on HTM securities (non-GAAP) 7.0% 9.2% Tangible common equity to tangible assets, ex AOCI (non-GAAP)1 8.8% Book value per common share (GAAP)1 $ 33.40 Tangible book value per common share (non-GAAP)1 $ 18.83 Tangible book value per common share, ex AOCI (non-GAAP)1 $ 22.87 Leverage Ratio Tier 1 capital $ 2,229,519 $ 2,563,499 Total average assets for leverage ratio $ 23,995,276 $ 23,876,131 Leverage ratio 9.3% 10.7% Leverage ratio, incl AOCI and net unrealized losses on HTM securities (non-GAAP) 7.6% 9.0% TANGIBLE ASSETS, TANGIBLE COMMON EQUITY, AND LEVERAGE RATIO As of December 31, 2024 1Calculation excludes the impact of 658,001 unvested restricted stock awards (RSAs) outstanding as of December 31, 2024 |
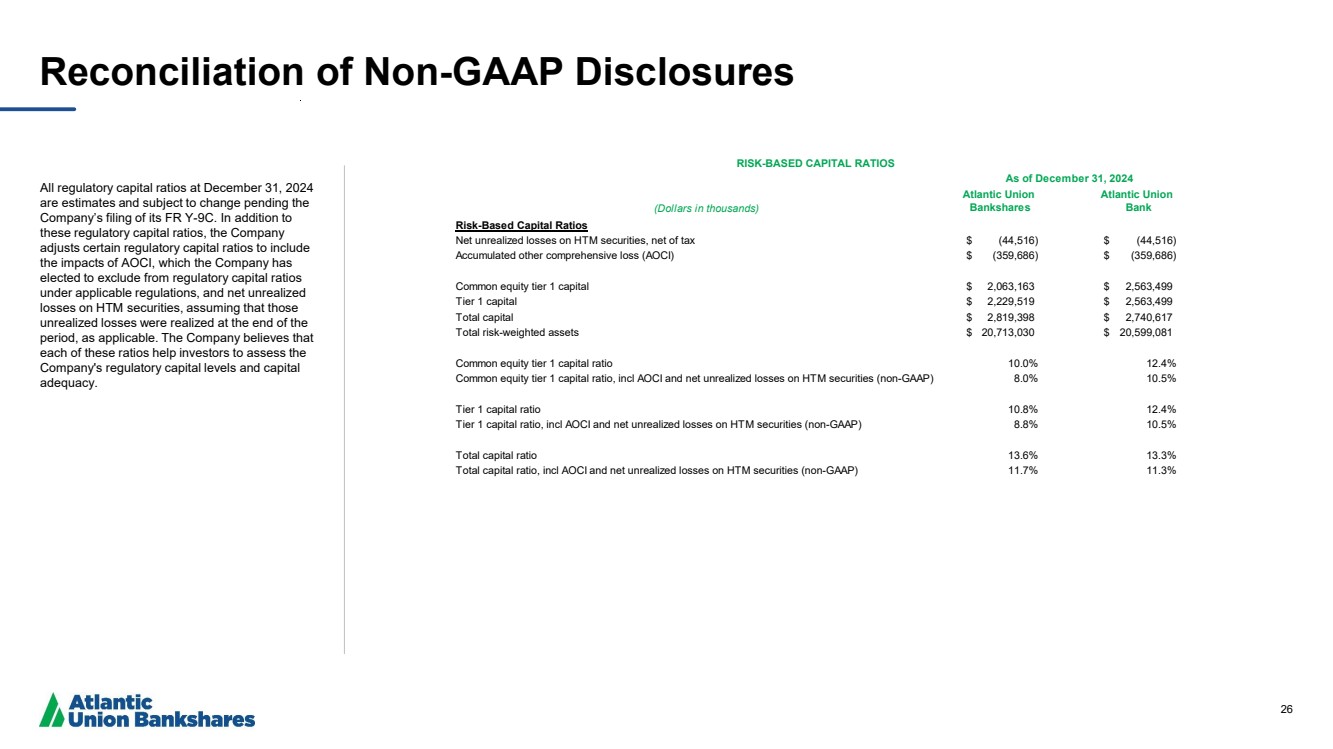
| 26 Reconciliation of Non-GAAP Disclosures All regulatory capital ratios at December 31, 2024 are estimates and subject to change pending the Company’s filing of its FR Y-9C. In addition to these regulatory capital ratios, the Company adjusts certain regulatory capital ratios to include the impacts of AOCI, which the Company has elected to exclude from regulatory capital ratios under applicable regulations, and net unrealized losses on HTM securities, assuming that those unrealized losses were realized at the end of the period, as applicable. The Company believes that each of these ratios help investors to assess the Company's regulatory capital levels and capital adequacy. (Dollars in thousands) Atlantic Union Bankshares Atlantic Union Bank Risk-Based Capital Ratios Net unrealized losses on HTM securities, net of tax $ (44,516) $ (44,516) Accumulated other comprehensive loss (AOCI) $ (359,686) $ (359,686) Common equity tier 1 capital $ 2,063,163 $ 2,563,499 Tier 1 capital $ 2,229,519 $ 2,563,499 Total capital $ 2,819,398 $ 2,740,617 Total risk-weighted assets $ 20,713,030 $ 20,599,081 Common equity tier 1 capital ratio 10.0% 12.4% Common equity tier 1 capital ratio, incl AOCI and net unrealized losses on HTM securities (non-GAAP) 8.0% 10.5% Tier 1 capital ratio 10.8% 12.4% Tier 1 capital ratio, incl AOCI and net unrealized losses on HTM securities (non-GAAP) 8.8% 10.5% Total capital ratio 13.6% 13.3% Total capital ratio, incl AOCI and net unrealized losses on HTM securities (non-GAAP) 11.7% 11.3% RISK-BASED CAPITAL RATIOS As of December 31, 2024 |
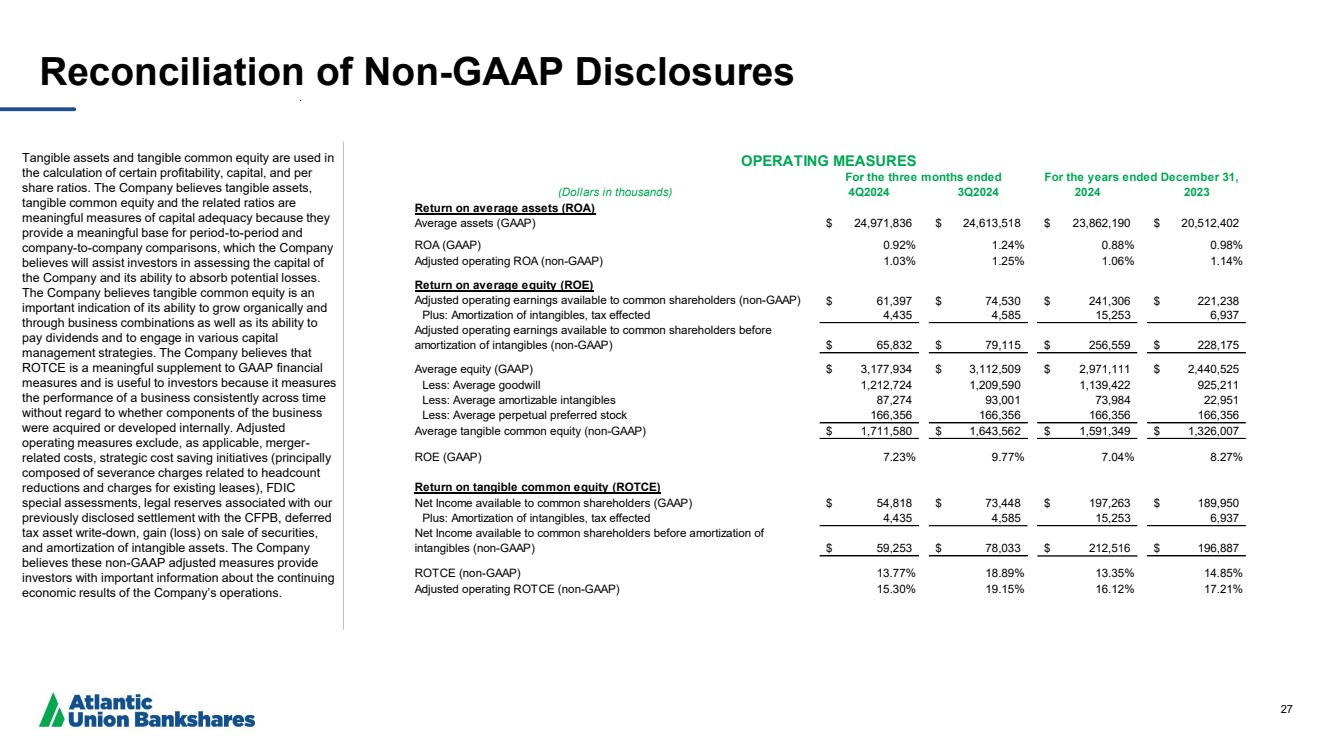
| 27 Reconciliation of Non-GAAP Disclosures Tangible assets and tangible common equity are used in the calculation of certain profitability, capital, and per share ratios. The Company believes tangible assets, tangible common equity and the related ratios are meaningful measures of capital adequacy because they provide a meaningful base for period-to-period and company-to-company comparisons, which the Company believes will assist investors in assessing the capital of the Company and its ability to absorb potential losses. The Company believes tangible common equity is an important indication of its ability to grow organically and through business combinations as well as its ability to pay dividends and to engage in various capital management strategies. The Company believes that ROTCE is a meaningful supplement to GAAP financial measures and is useful to investors because it measures the performance of a business consistently across time without regard to whether components of the business were acquired or developed internally. Adjusted operating measures exclude, as applicable, merger-related costs, strategic cost saving initiatives (principally composed of severance charges related to headcount reductions and charges for existing leases), FDIC special assessments, legal reserves associated with our previously disclosed settlement with the CFPB, deferred tax asset write-down, gain (loss) on sale of securities, and amortization of intangible assets. The Company believes these non-GAAP adjusted measures provide investors with important information about the continuing economic results of the Company’s operations. (Dollars in thousands) 4Q2024 3Q2024 2024 2023 Return on average assets (ROA) Average assets (GAAP) $ 24,971,836 $ 24,613,518 $ 23,862,190 $ 20,512,402 ROA (GAAP) 0.92% 1.24% 0.88% 0.98% Adjusted operating ROA (non-GAAP) 1.03% 1.25% 1.06% 1.14% Return on average equity (ROE) Adjusted operating earnings available to common shareholders (non-GAAP) $ 61,397 $ 74,530 $ 241,306 $ 221,238 Plus: Amortization of intangibles, tax effected 4,435 4,585 15,253 6,937 Adjusted operating earnings available to common shareholders before amortization of intangibles (non-GAAP) $ 65,832 $ 79,115 $ 256,559 $ 228,175 Average equity (GAAP) $ 3,177,934 $ 3,112,509 $ 2,971,111 $ 2,440,525 Less: Average goodwill 1,212,724 1,209,590 1,139,422 925,211 Less: Average amortizable intangibles 87,274 93,001 73,984 22,951 Less: Average perpetual preferred stock 166,356 166,356 166,356 166,356 Average tangible common equity (non-GAAP) $ 1,711,580 $ 1,643,562 $ 1,591,349 $ 1,326,007 ROE (GAAP) 7.23% 9.77% 7.04% 8.27% Return on tangible common equity (ROTCE) Net Income available to common shareholders (GAAP) $ 54,818 $ 73,448 $ 197,263 $ 189,950 Plus: Amortization of intangibles, tax effected 4,435 4,585 15,253 6,937 Net Income available to common shareholders before amortization of intangibles (non-GAAP) $ 59,253 $ 78,033 $ 212,516 $ 196,887 ROTCE (non-GAAP) 13.77% 18.89% 13.35% 14.85% Adjusted operating ROTCE (non-GAAP) 15.30% 19.15% 16.12% 17.21% For the years ended December 31, OPERATING MEASURES For the three months ended |
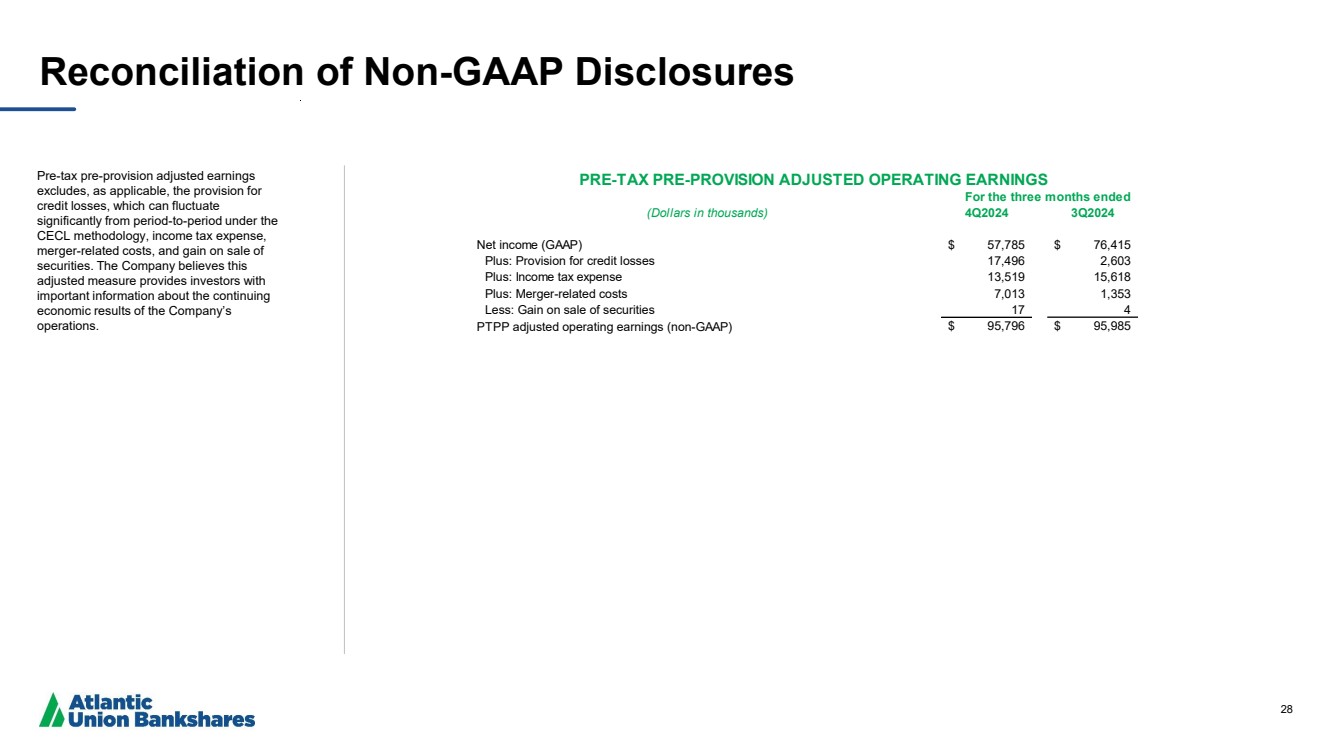
| 28 Reconciliation of Non-GAAP Disclosures Pre-tax pre-provision adjusted earnings excludes, as applicable, the provision for credit losses, which can fluctuate significantly from period-to-period under the CECL methodology, income tax expense, merger-related costs, and gain on sale of securities. The Company believes this adjusted measure provides investors with important information about the continuing economic results of the Company’s operations. (Dollars in thousands) 4Q2024 3Q2024 Net income (GAAP) $ 57,785 $ 76,415 Plus: Provision for credit losses 17,496 2,603 Plus: Income tax expense 13,519 15,618 Plus: Merger-related costs 7,013 1,353 Less: Gain on sale of securities 17 4 PTPP adjusted operating earnings (non-GAAP) $ 95,796 $ 95,985 For the three months ended PRE-TAX PRE-PROVISION ADJUSTED OPERATING EARNINGS |