| 1 st Quarter 2024 Earnings Presentation NYSE: AUB April 23, 2024 |

| 2 Forward Looking Statements This presentation and statements by our management may constitute “forward-looking statements” within the meaning of the Private Securities Litigation Reform Act of 1995. Forward-looking statements are statements that include, without limitation, statements on slides entitled “Q1 2024 Highlights,“ “Loan and Deposit Trends,” and “2024 Financial Outlook,” statements regarding our expectations with regard to our business, financial and operating results, including our deposit base and funding, the impact of future economic conditions, changes in economic conditions, our asset quality, our customer relationships, and statements that include other projections, predictions, expectations, or beliefs about future events or results or otherwise are not statements of historical fact. Such forward-looking statements are based on certain assumptions as of the time they are made, and are inherently subject to known and unknown risks, uncertainties, and other factors, some of which cannot be predicted or quantified, that may cause actual results, performance, or achievements to be materially different from those expressed or implied by such forward-looking statements. Forward-looking statements are often characterized by the use of qualified words (and their derivatives) such as “expect,” “believe,” “estimate,” “plan,” “project,” “anticipate,” “intend,” “will,” “may,” “view,” “opportunity,” “potential,” “continue,” “confidence,” or words of similar meaning or other statements concerning opinions or judgment of the Company and our management about future events. Although we believe that our expectations with respect to forward-looking statements are based upon reasonable assumptions within the bounds of our existing knowledge of our business and operations, there can be no assurance that actual future results, performance, or achievements of, or trends affecting, us will not differ materially from any projected future results, performance, achievements or trends expressed or implied by such forward-looking statements. Actual future results, performance, achievements or trends may differ materially from historical results or those anticipated depending on a variety of factors, including, but not limited to, the effects of or changes in: • market interest rates and their related impacts on macroeconomic conditions, customer and client behavior, our funding costs and our loan and securities portfolios; • inflation and its impacts on economic growth and customer and client behavior; • adverse developments in the financial industry generally, such as bank failures, responsive measures to mitigate and manage such developments, related supervisory and regulatory actions and costs, and related impacts on customer and client behavior; • the sufficiency of liquidity; • general economic and financial market conditions, in the United States generally and particularly in the markets in which we operate and which our loans are concentrated, including the effects of declines in real estate values, an increase in unemployment levels and slowdowns in economic growth; • the impact of purchase accounting with respect to our merger with American National Bankshares, Inc. (“American National”), or any change in the assumptions used regarding the assets acquired and liabilities assumed to determine the fair value and credit marks; • the possibility that the anticipated benefits of our merger with American National, including anticipated cost savings and strategic gains, are not realized when expected or at all, including as a result of the impact of, or problems arising from, the integration of the two companies or as a result of the strength of the economy, competitive factors in the areas where we do business, or as a result of other unexpected factors or events; • potential adverse reactions or changes to business or employee relationships, including those resulting from our merger with American National; • the integration of the business and operations of American National may take longer or be more costly than anticipated; • monetary and fiscal policies of the U.S. government, including policies of the U.S. Department of the Treasury and the Federal Reserve; • the quality or composition of our loan or investment portfolios and changes therein; • demand for loan products and financial services in our market areas; • our ability to manage our growth or implement our growth strategy; • the effectiveness of expense reduction plans; • the introduction of new lines of business or new products and services; • our ability to recruit and retain key employees; • real estate values in our lending area; • changes in accounting principles, standards, rules, and interpretations, and the related impact on our financial statements; • an insufficient ACL or volatility in the ACL resulting from the CECL methodology, either alone or as that may be affected by changing economic conditions, credit concentrations, inflation, changing interest rates, or other factors; • our liquidity and capital positions; • concentrations of loans secured by real estate, particularly commercial real estate; • the effectiveness of our credit processes and management of our credit risk; • our ability to compete in the market for financial services and increased competition from fintech companies; • technological risks and developments, and cyber threats, attacks, or events; • operational, technological, cultural, regulatory, legal, credit, and other risks associated with the exploration, consummation and integration of potential future acquisitions, whether involving stock or cash considerations; • the potential adverse effects of unusual and infrequently occurring events, such as weather-related disasters, terrorist acts, geopolitical conflicts or public health events (such as pandemics), and of governmental and societal responses thereto; these potential adverse effects may include, without limitation, adverse effects on the ability of our borrowers to satisfy their obligations to us, on the value of collateral securing loans, on the demand for our loans or our other products and services, on supply chains and methods used to distribute products and services, on incidents of cyberattack and fraud, on our liquidity or capital positions, on risks posed by reliance on third-party service providers, on other aspects of our business operations and on financial markets and economic growth; • performance by our counterparties or vendors; • deposit flows; • the availability of financing and the terms thereof; • the level of prepayments on loans and mortgage-backed securities; • legislative or regulatory changes and requirements; • actual or potential claims, damages, and fines related to litigation or government actions, which may result in, among other things, additional costs, fines, penalties, restrictions on our business activities, reputational harm, or other adverse consequences; • the effects of changes in federal, state or local tax laws and regulations; • any event or development that would cause us to conclude that there was an impairment of any asset, including intangible assets, such as goodwill; and • other factors, many of which are beyond our control. Please also refer to such other factors as discussed throughout Part I, Item 1A. “Risk Factors” and Part II, Item 7. “Management’s Discussion and Analysis of Financial Condition and Results of Operations” of our Annual Report on Form 10-K for the year ended December 31, 2023, and related disclosures in other filings, which have been filed with the U.S. Securities and Exchange Commission (“SEC”) and are available on the SEC’s website at www.sec.gov. All risk factors and uncertainties described herein and therein should be considered in evaluating forward-looking statements, and all of the forward-looking statements are expressly qualified by the cautionary statements contained or referred to herein and therein. The actual results or developments anticipated may not be realized or, even if substantially realized, they may not have the expected consequences to or effects on the Company or our businesses or operations. Readers are cautioned not to rely too heavily on the forward-looking statements. Forward-looking statements speak only as of the date they are made. We do not intend or assume any obligation to update, revise or clarify any forward-looking statements that may be made from time to time by or on behalf of the Company, whether as a result of new information, future events or otherwise, except as required by law. |
| 3 Additional Information Non-GAAP Financial Measures This presentation contains certain financial information determined by methods other than in accordance with generally accepted accounting principles in the United States (“GAAP”). These non-GAAP financial measures are a supplement to GAAP, which is used to prepare the Company’s financial statements, and should not be considered in isolation or as a substitute for comparable measures calculated in accordance with GAAP. In addition, the Company’s non-GAAP financial measures may not be comparable to non-GAAP financial measures of other companies. The Company uses the non-GAAP financial measures discussed herein in its analysis of the Company’s performance. The Company’s management believes that these non-GAAP financial measures provide additional understanding of ongoing operations, enhance comparability of results of operations with prior periods, show the effects of significant gains and charges in the periods presented without the impact of items or events that may obscure trends in the Company’s underlying performance, or show the potential effects of accumulated other comprehensive income (or AOCI) or unrealized losses on securities on the Company's capital. This presentation also includes certain projections of non-GAAP financial measures. Due to the inherent variability and difficulty associated with making accurate forecasts and projections of information that is excluded from these projected non-GAAP measures, and the fact that some of the excluded information is not currently ascertainable or accessible, the Company is unable to quantify certain amounts that would be required to be included in the most directly comparable projected GAAP financial measures without unreasonable effort. Consequently, no disclosure of projected comparable GAAP measures is included, and no reconciliation of forward-looking non-GAAP financial information is included. Please see “Reconciliation of Non-GAAP Disclosures” at the end of this presentation for a reconciliation to the nearest GAAP financial measure. No Offer or Solicitation This presentation does not constitute an offer to sell or a solicitation of an offer to buy any securities. No offer of securities shall be made except by means of a prospectus meeting the requirements of the Securities Act of 1933, as amended, and no offer to sell or solicitation of an offer to buy shall be made in any jurisdiction in which such offer, solicitation or sale would be unlawful. About Atlantic Union Bankshares Corporation Headquartered in Richmond, Virginia, Atlantic Union Bankshares Corporation (NYSE: AUB) is the holding company for Atlantic Union Bank. Atlantic Union Bank has 135 branches and 150 ATMs located throughout Virginia and in portions of Maryland and North Carolina as of April 1, 2024. Certain non-bank financial services affiliates of Atlantic Union Bank include: Atlantic Union Equipment Finance, Inc., which provides equipment financing; Atlantic Union Financial Consultants, LLC, which provides brokerage services; and Union Insurance Group, LLC, which offers various lines of insurance products. |
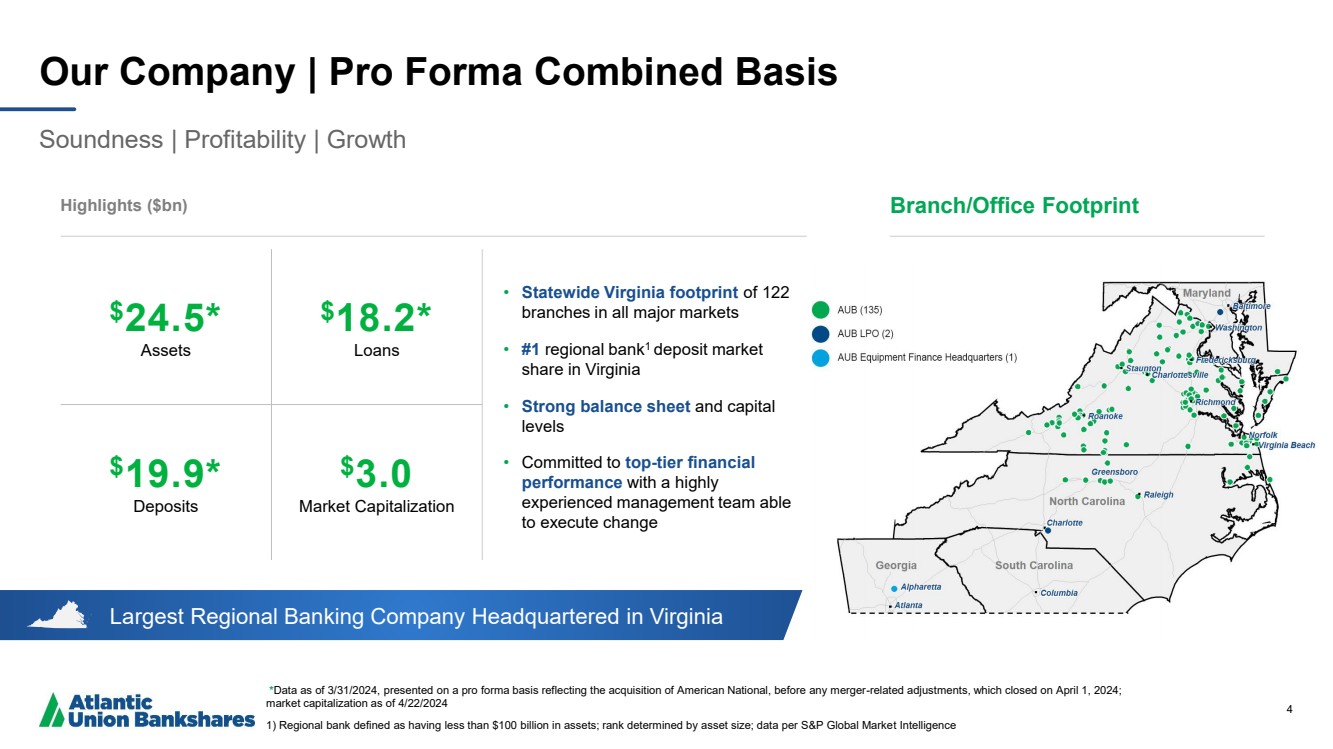
| 4 Largest Regional Banking Company Headquartered in Virginia Our Company | Pro Forma Combined Basis Soundness | Profitability | Growth *Data as of 3/31/2024, presented on a pro forma basis reflecting the acquisition of American National, before any merger-related adjustments, which closed on April 1, 2024; market capitalization as of 4/22/2024 1) Regional bank defined as having less than $100 billion in assets; rank determined by asset size; data per S&P Global Market Intelligence Highlights ($bn) • Statewide Virginia footprint of 122 branches in all major markets • #1 regional bank1 deposit market share in Virginia • Strong balance sheet and capital levels • Committed to top-tier financial performance with a highly experienced management team able to execute change 4 $24.5* Assets $18.2* Loans $19.9* Deposits $3.0 Market Capitalization Branch/Office Footprint |
| 5 Our Shareholder Value Proposition Leading Regional Presence Dense, uniquely valuable presence across attractive markets Financial Strength Solid balance sheet & capital levels Attractive Financial Profile Solid dividend yield & payout ratio with earnings upside Strong Growth Potential Organic & acquisition opportunities Peer-Leading Performance Committed to top-tier financial performance |
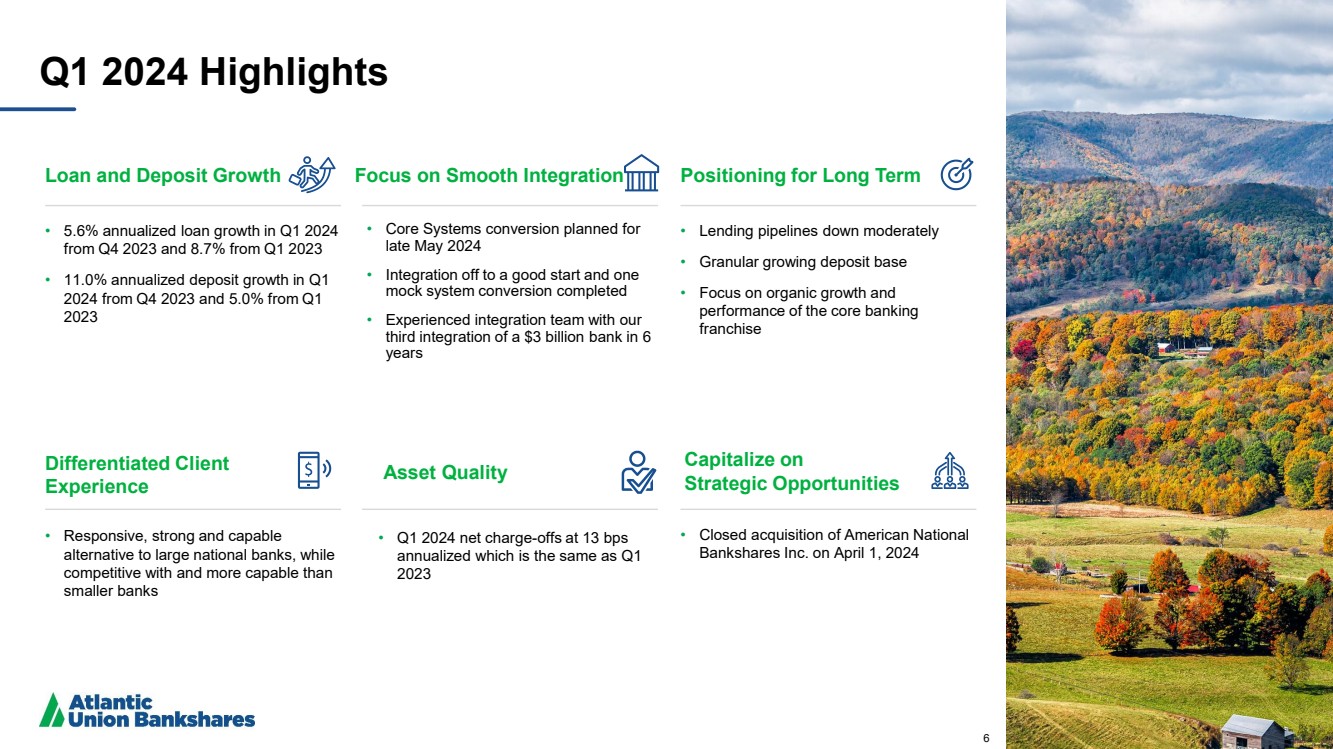
| 6 Q1 2024 Highlights Loan and Deposit Growth • 5.6% annualized loan growth in Q1 2024 from Q4 2023 and 8.7% from Q1 2023 • 11.0% annualized deposit growth in Q1 2024 from Q4 2023 and 5.0% from Q1 2023 Asset Quality • Q1 2024 net charge-offs at 13 bps annualized which is the same as Q1 2023 Positioning for Long Term • Lending pipelines down moderately • Granular growing deposit base • Focus on organic growth and performance of the core banking franchise Differentiated Client Experience • Responsive, strong and capable alternative to large national banks, while competitive with and more capable than smaller banks Focus on Smooth Integration • Core Systems conversion planned for late May 2024 • Integration off to a good start and one mock system conversion completed • Experienced integration team with our third integration of a $3 billion bank in 6 years Capitalize on Strategic Opportunities • Closed acquisition of American National Bankshares Inc. on April 1, 2024 6 |
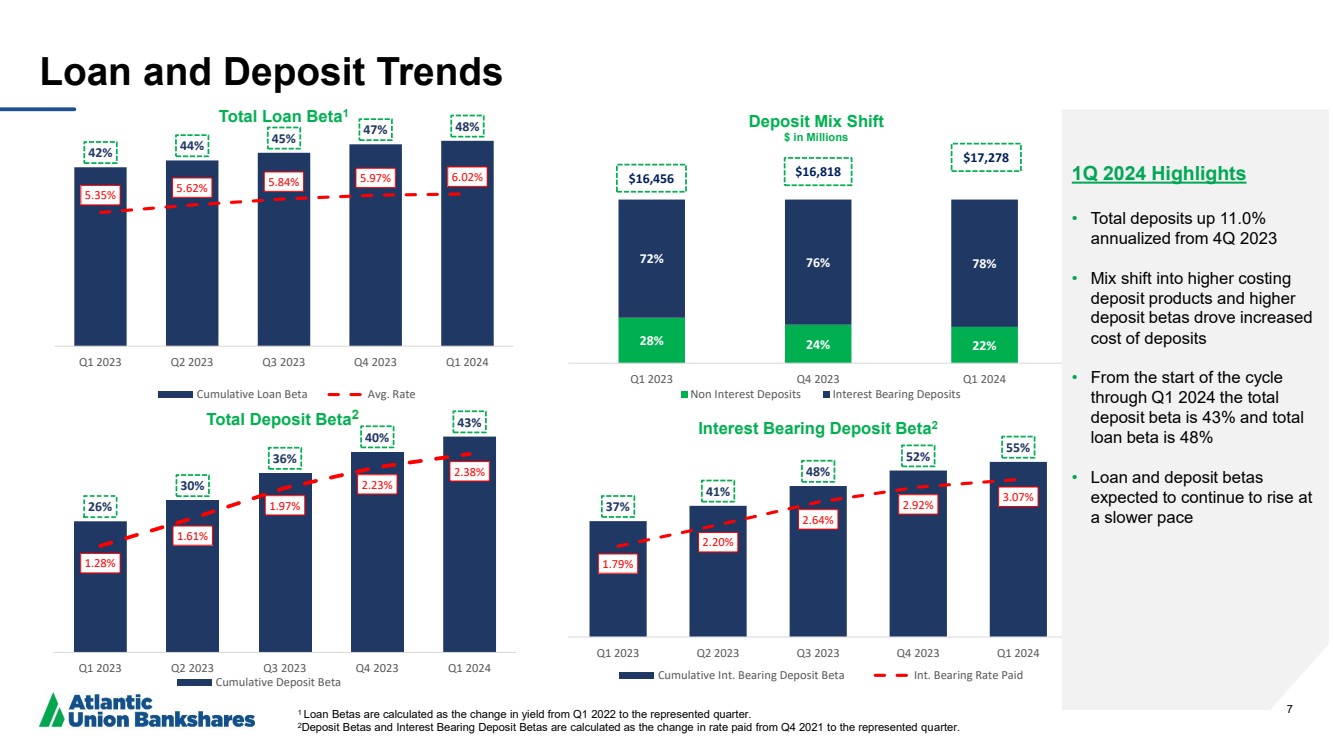
| 7 Loan and Deposit Trends 42% 44% 45% 47% 48% 5.35% 5.62% 5.84% 5.97% 6.02% Q1 2023 Q2 2023 Q3 2023 Q4 2023 Q1 2024 Total Loan Beta1 Cumulative Loan Beta Avg. Rate 28% 24% 22% 72% 76% 78% Q1 2023 Q4 2023 Q1 2024 Deposit Mix Shift $ in Millions Non Interest Deposits Interest Bearing Deposits $16,456 $16,818 $17,278 37% 41% 48% 52% 55% 1.79% 2.20% 2.64% 2.92% 3.07% Q1 2023 Q2 2023 Q3 2023 Q4 2023 Q1 2024 Interest Bearing Deposit Beta2 Cumulative Int. Bearing Deposit Beta Int. Bearing Rate Paid 26% 30% 36% 40% 43% 1.28% 1.61% 1.97% 2.23% 2.38% Q1 2023 Q2 2023 Q3 2023 Q4 2023 Q1 2024 Total Deposit Beta2 Cumulative Deposit Beta 1 Loan Betas are calculated as the change in yield from Q1 2022 to the represented quarter. 2Deposit Betas and Interest Bearing Deposit Betas are calculated as the change in rate paid from Q4 2021 to the represented quarter. 1Q 2024 Highlights • Total deposits up 11.0% annualized from 4Q 2023 • Mix shift into higher costing deposit products and higher deposit betas drove increased cost of deposits • From the start of the cycle through Q1 2024 the total deposit beta is 43% and total loan beta is 48% • Loan and deposit betas expected to continue to rise at a slower pace |
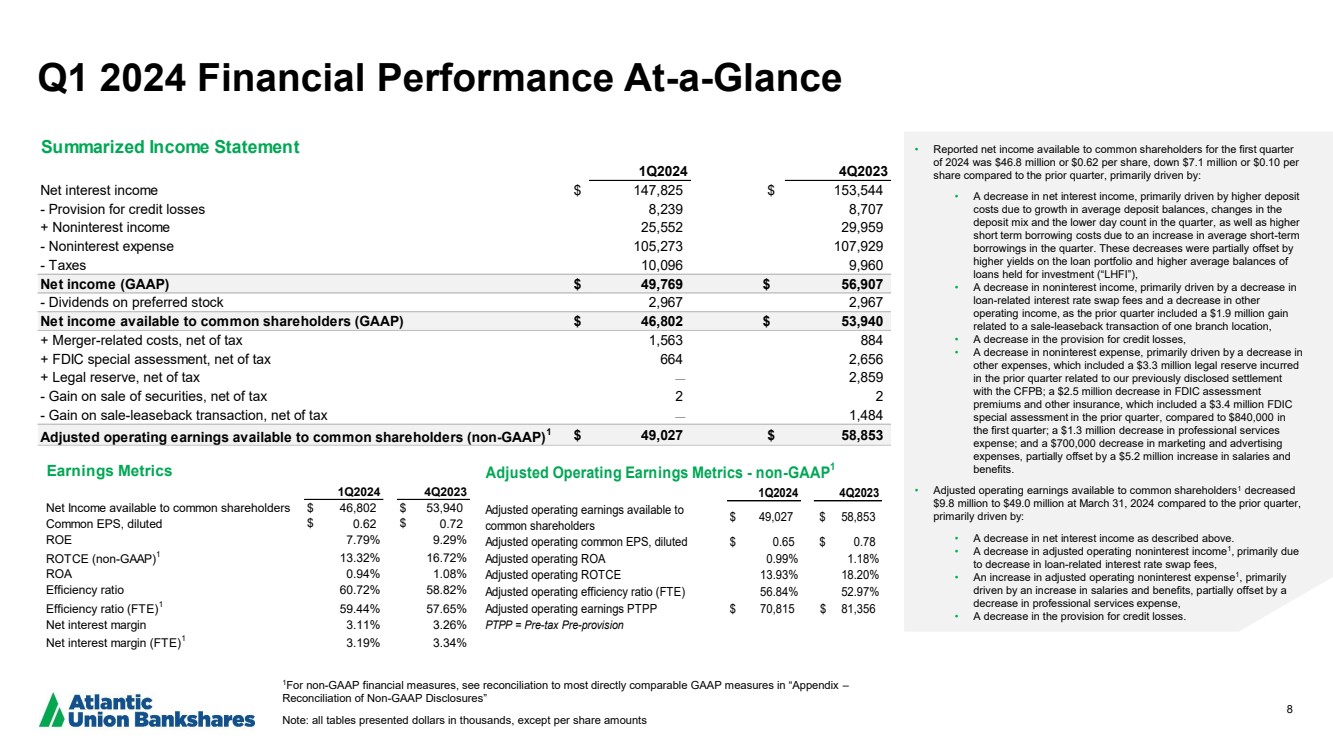
| 8 Q1 2024 Financial Performance At-a-Glance 1For non-GAAP financial measures, see reconciliation to most directly comparable GAAP measures in “Appendix – Reconciliation of Non-GAAP Disclosures” Note: all tables presented dollars in thousands, except per share amounts • Reported net income available to common shareholders for the first quarter of 2024 was $46.8 million or $0.62 per share, down $7.1 million or $0.10 per share compared to the prior quarter, primarily driven by: • A decrease in net interest income, primarily driven by higher deposit costs due to growth in average deposit balances, changes in the deposit mix and the lower day count in the quarter, as well as higher short term borrowing costs due to an increase in average short-term borrowings in the quarter. These decreases were partially offset by higher yields on the loan portfolio and higher average balances of loans held for investment (“LHFI”), • A decrease in noninterest income, primarily driven by a decrease in loan-related interest rate swap fees and a decrease in other operating income, as the prior quarter included a $1.9 million gain related to a sale-leaseback transaction of one branch location, • A decrease in the provision for credit losses, • A decrease in noninterest expense, primarily driven by a decrease in other expenses, which included a $3.3 million legal reserve incurred in the prior quarter related to our previously disclosed settlement with the CFPB; a $2.5 million decrease in FDIC assessment premiums and other insurance, which included a $3.4 million FDIC special assessment in the prior quarter, compared to $840,000 in the first quarter; a $1.3 million decrease in professional services expense; and a $700,000 decrease in marketing and advertising expenses, partially offset by a $5.2 million increase in salaries and benefits. • Adjusted operating earnings available to common shareholders1 decreased $9.8 million to $49.0 million at March 31, 2024 compared to the prior quarter, primarily driven by: • A decrease in net interest income as described above. • A decrease in adjusted operating noninterest income1 , primarily due to decrease in loan-related interest rate swap fees, • An increase in adjusted operating noninterest expense1 , primarily driven by an increase in salaries and benefits, partially offset by a decrease in professional services expense, • A decrease in the provision for credit losses. 1Q2024 4Q2023 Adjusted operating earnings available to common shareholders $ 49,027 $ 58,853 Adjusted operating common EPS, diluted $ 0.65 $ 0.78 Adjusted operating ROA 0.99% 1.18% Adjusted operating ROTCE 13.93% 18.20% Adjusted operating efficiency ratio (FTE) 56.84% 52.97% Adjusted operating earnings PTPP $ 70,815 $ 81,356 PTPP = Pre-tax Pre-provision Adjusted Operating Earnings Metrics - non-GAAP1 1Q2024 4Q2023 Net interest income $ 147,825 $ 153,544 - Provision for credit losses 8,239 8,707 + Noninterest income 25,552 29,959 - Noninterest expense 105,273 107,929 - Taxes 10,096 9,960 Net income (GAAP) $ 49,769 $ 56,907 - Dividends on preferred stock 2,967 2,967 Net income available to common shareholders (GAAP) $ 46,802 $ 53,940 + Merger-related costs, net of tax 1,563 884 + FDIC special assessment, net of tax 664 2,656 + Legal reserve, net of tax — 2,859 - Gain on sale of securities, net of tax 2 2 - Gain on sale-leaseback transaction, net of tax — 1,484 Adjusted operating earnings available to common shareholders (non-GAAP)1 $ 49,027 $ 58,853 Summarized Income Statement 1Q2024 4Q2023 Net Income available to common shareholders $ 46,802 $ 53,940 Common EPS, diluted $ 0.62 $ 0.72 ROE 7.79% 9.29% ROTCE (non-GAAP)1 13.32% 16.72% ROA 0.94% 1.08% Efficiency ratio 60.72% 58.82% Efficiency ratio (FTE)1 59.44% 57.65% Net interest margin 3.11% 3.26% Net interest margin (FTE)1 3.19% 3.34% Earnings Metrics |
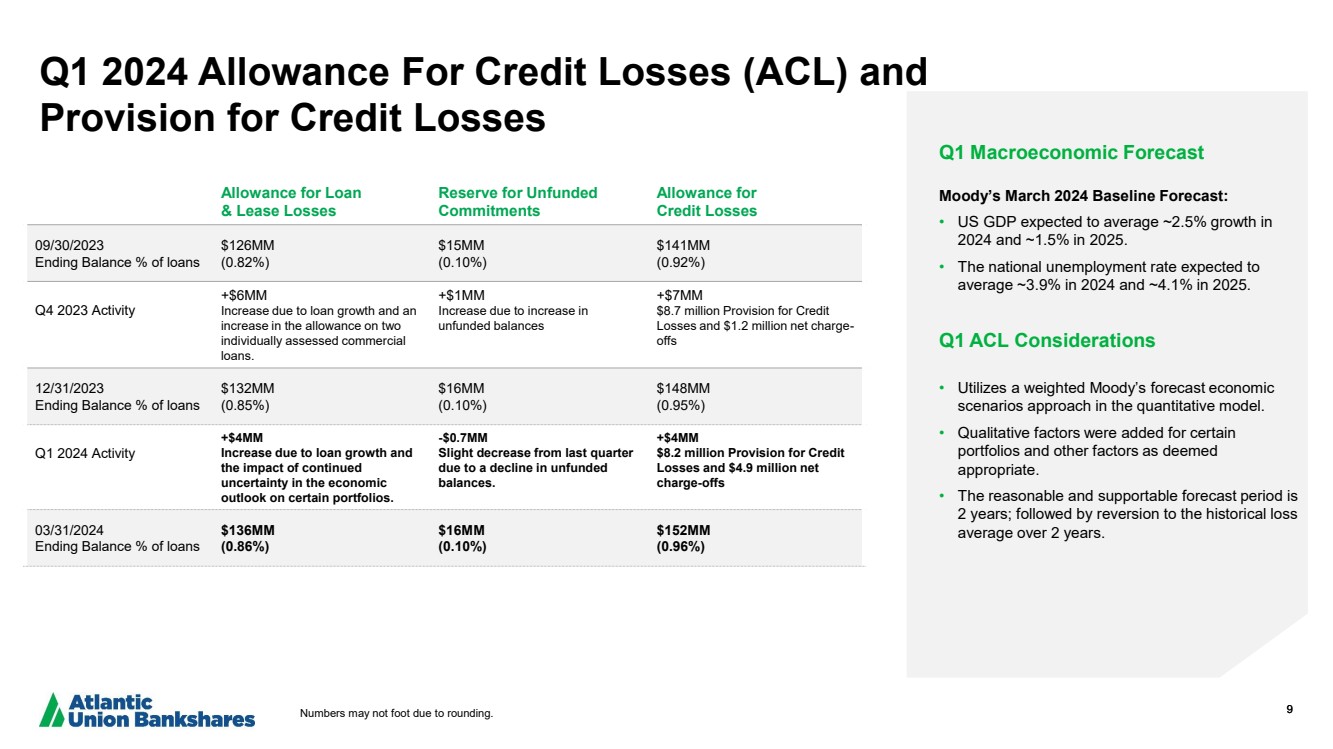
| 9 Q1 2024 Allowance For Credit Losses (ACL) and Provision for Credit Losses Q1 Macroeconomic Forecast Moody’s March 2024 Baseline Forecast: • US GDP expected to average ~2.5% growth in 2024 and ~1.5% in 2025. • The national unemployment rate expected to average ~3.9% in 2024 and ~4.1% in 2025. Q1 ACL Considerations • Utilizes a weighted Moody’s forecast economic scenarios approach in the quantitative model. • Qualitative factors were added for certain portfolios and other factors as deemed appropriate. • The reasonable and supportable forecast period is 2 years; followed by reversion to the historical loss average over 2 years. Allowance for Loan & Lease Losses Reserve for Unfunded Commitments Allowance for Credit Losses 09/30/2023 Ending Balance % of loans $126MM (0.82%) $15MM (0.10%) $141MM (0.92%) Q4 2023 Activity +$6MM Increase due to loan growth and an increase in the allowance on two individually assessed commercial loans. +$1MM Increase due to increase in unfunded balances +$7MM $8.7 million Provision for Credit Losses and $1.2 million net charge-offs 12/31/2023 Ending Balance % of loans $132MM (0.85%) $16MM (0.10%) $148MM (0.95%) Q1 2024 Activity +$4MM Increase due to loan growth and the impact of continued uncertainty in the economic outlook on certain portfolios. -$0.7MM Slight decrease from last quarter due to a decline in unfunded balances. +$4MM $8.2 million Provision for Credit Losses and $4.9 million net charge-offs 03/31/2024 Ending Balance % of loans $136MM (0.86%) $16MM (0.10%) $152MM (0.96%) Numbers may not foot due to rounding. |
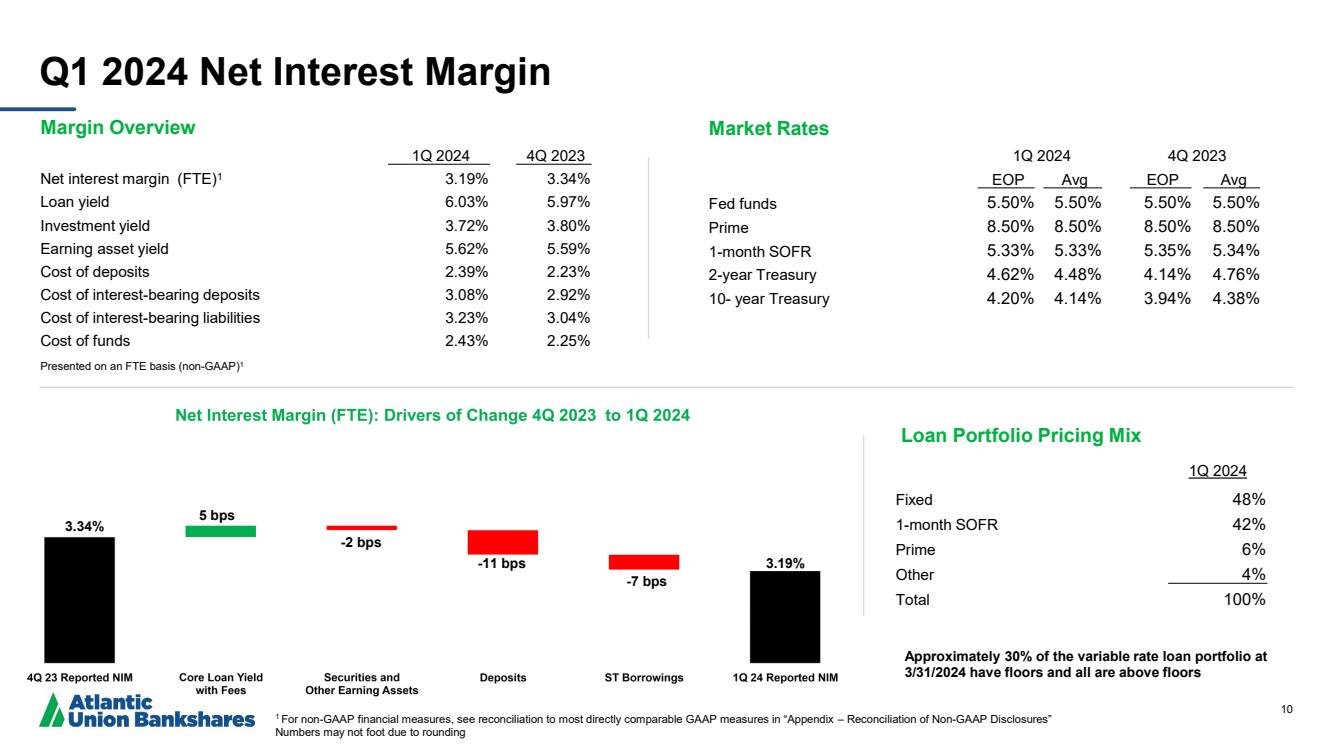
| 10 Q1 2024 Net Interest Margin Market Rates 1Q 2024 4Q 2023 EOP Avg EOP Avg Fed funds 5.50% 5.50% 5.50% 5.50% Prime 8.50% 8.50% 8.50% 8.50% 1-month SOFR 5.33% 5.33% 5.35% 5.34% 2-year Treasury 4.62% 4.48% 4.14% 4.76% 10- year Treasury 4.20% 4.14% 3.94% 4.38% Margin Overview 1Q 2024 4Q 2023 Net interest margin (FTE)1 3.19% 3.34% Loan yield 6.03% 5.97% Investment yield 3.72% 3.80% Earning asset yield 5.62% 5.59% Cost of deposits 2.39% 2.23% Cost of interest-bearing deposits 3.08% 2.92% Cost of interest-bearing liabilities 3.23% 3.04% Cost of funds 2.43% 2.25% Presented on an FTE basis (non-GAAP)1 Approximately 30% of the variable rate loan portfolio at 3/31/2024 have floors and all are above floors Loan Portfolio Pricing Mix 1Q 2024 Fixed 48% 1-month SOFR 42% Prime 6% Other 4% Total 100% 1 For non-GAAP financial measures, see reconciliation to most directly comparable GAAP measures in “Appendix – Reconciliation of Non-GAAP Disclosures” Numbers may not foot due to rounding 3.34% 5 bps -11 bps -7 bps -2 bps 3.19% |
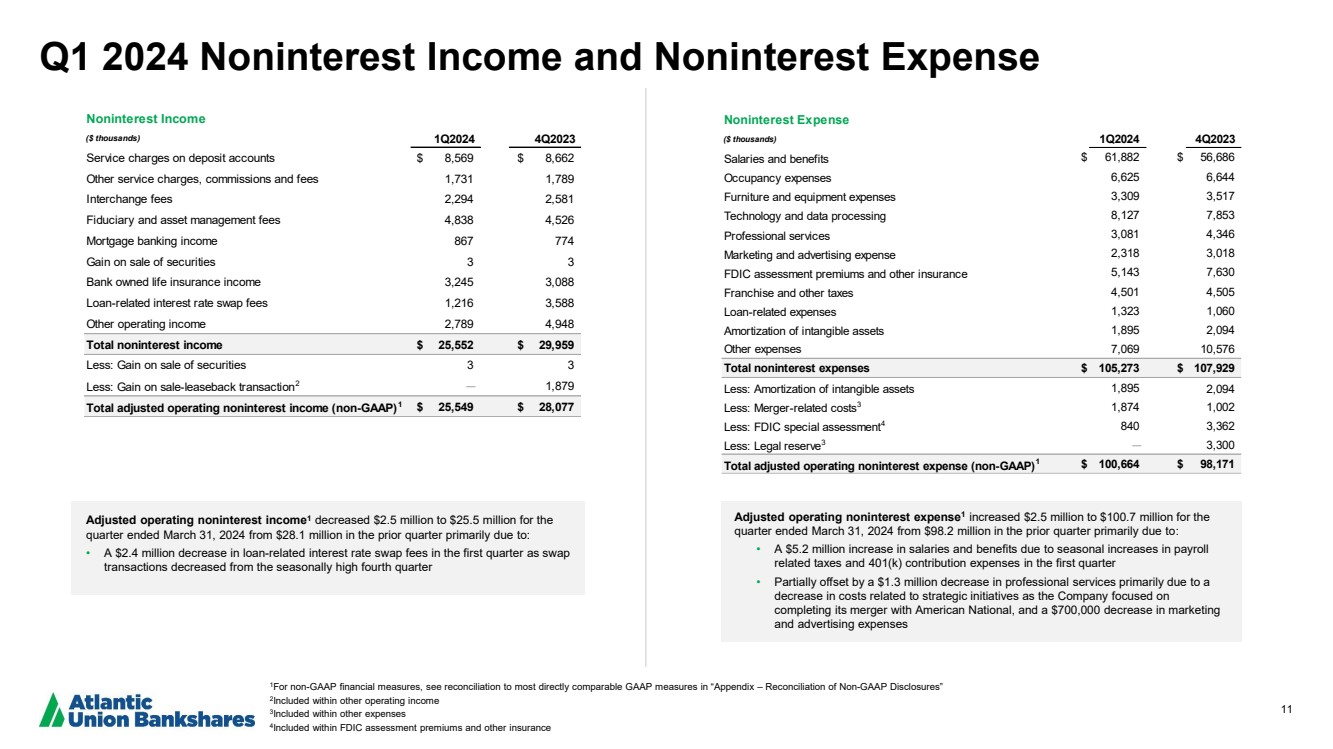
| 11 Adjusted operating noninterest expense1 increased $2.5 million to $100.7 million for the quarter ended March 31, 2024 from $98.2 million in the prior quarter primarily due to: • A $5.2 million increase in salaries and benefits due to seasonal increases in payroll related taxes and 401(k) contribution expenses in the first quarter • Partially offset by a $1.3 million decrease in professional services primarily due to a decrease in costs related to strategic initiatives as the Company focused on completing its merger with American National, and a $700,000 decrease in marketing and advertising expenses Adjusted operating noninterest income1 decreased $2.5 million to $25.5 million for the quarter ended March 31, 2024 from $28.1 million in the prior quarter primarily due to: • A $2.4 million decrease in loan-related interest rate swap fees in the first quarter as swap transactions decreased from the seasonally high fourth quarter Q1 2024 Noninterest Income and Noninterest Expense 1For non-GAAP financial measures, see reconciliation to most directly comparable GAAP measures in “Appendix – Reconciliation of Non-GAAP Disclosures” 2 Included within other operating income 3 Included within other expenses 4 Included within FDIC assessment premiums and other insurance Noninterest Income ($ thousands) 1Q2024 4Q2023 Service charges on deposit accounts $ 8,569 $ 8,662 Other service charges, commissions and fees 1,731 1,789 Interchange fees 2,294 2,581 Fiduciary and asset management fees 4,838 4,526 Mortgage banking income 867 774 Gain on sale of securities 3 3 Bank owned life insurance income 3,245 3,088 Loan-related interest rate swap fees 1,216 3,588 Other operating income 2,789 4,948 Total noninterest income $ 25,552 $ 29,959 Less: Gain on sale of securities 3 3 Less: Gain on sale-leaseback transaction2 — 1,879 Total adjusted operating noninterest income (non-GAAP)1 $ 25,549 $ 28,077 Noninterest Expense ($ thousands) 1Q2024 4Q2023 Salaries and benefits $ 61,882 $ 56,686 Occupancy expenses 6,625 6,644 Furniture and equipment expenses 3,309 3,517 Technology and data processing 8,127 7,853 Professional services 3,081 4,346 Marketing and advertising expense 2,318 3,018 FDIC assessment premiums and other insurance 5,143 7,630 Franchise and other taxes 4,501 4,505 Loan-related expenses 1,323 1,060 Amortization of intangible assets 1,895 2,094 Other expenses 7,069 10,576 Total noninterest expenses $ 105,273 $ 107,929 Less: Amortization of intangible assets 1,895 2,094 Less: Merger-related costs3 1,874 1,002 Less: FDIC special assessment4 840 3,362 Less: Legal reserve3 — 3,300 Total adjusted operating noninterest expense (non-GAAP)1 $ 100,664 $ 98,171 |
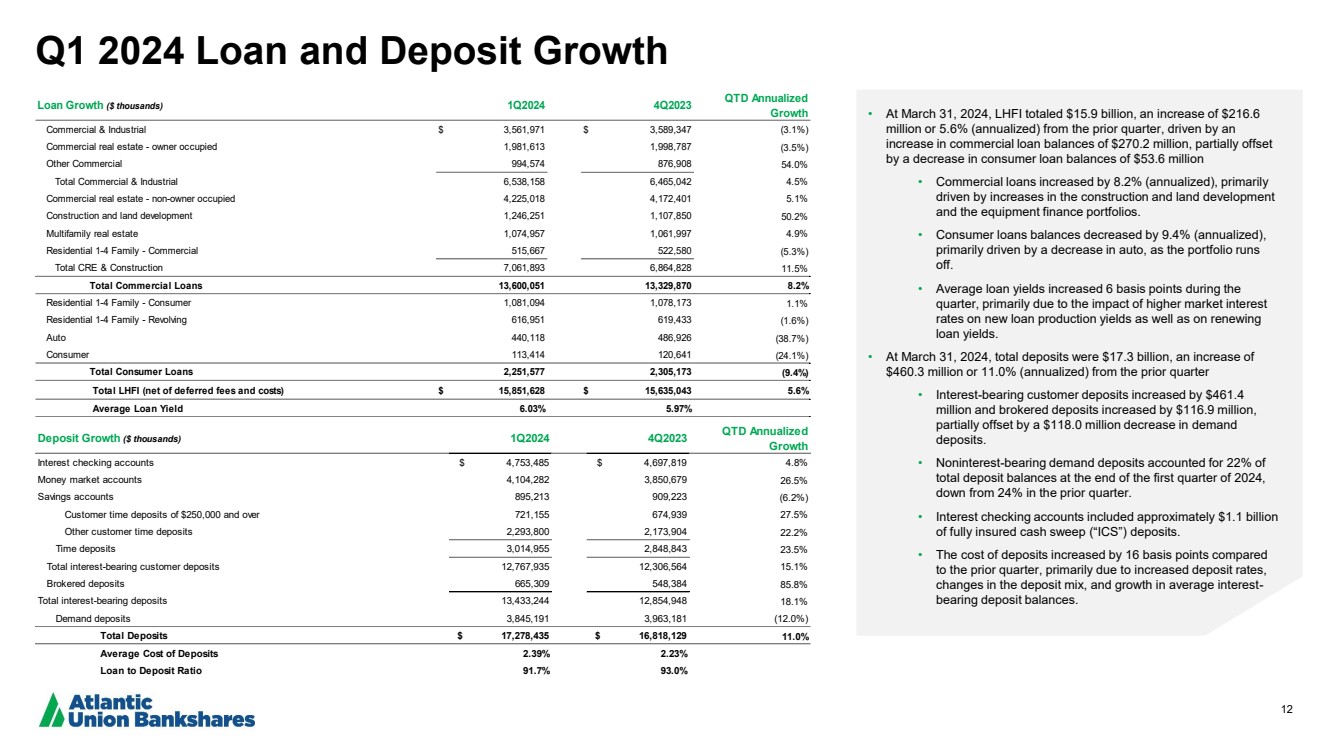
| 12 Q1 2024 Loan and Deposit Growth • At March 31, 2024, LHFI totaled $15.9 billion, an increase of $216.6 million or 5.6% (annualized) from the prior quarter, driven by an increase in commercial loan balances of $270.2 million, partially offset by a decrease in consumer loan balances of $53.6 million • Commercial loans increased by 8.2% (annualized), primarily driven by increases in the construction and land development and the equipment finance portfolios. • Consumer loans balances decreased by 9.4% (annualized), primarily driven by a decrease in auto, as the portfolio runs off. • Average loan yields increased 6 basis points during the quarter, primarily due to the impact of higher market interest rates on new loan production yields as well as on renewing loan yields. • At March 31, 2024, total deposits were $17.3 billion, an increase of $460.3 million or 11.0% (annualized) from the prior quarter • Interest-bearing customer deposits increased by $461.4 million and brokered deposits increased by $116.9 million, partially offset by a $118.0 million decrease in demand deposits. • Noninterest-bearing demand deposits accounted for 22% of total deposit balances at the end of the first quarter of 2024, down from 24% in the prior quarter. • Interest checking accounts included approximately $1.1 billion of fully insured cash sweep (“ICS”) deposits. • The cost of deposits increased by 16 basis points compared to the prior quarter, primarily due to increased deposit rates, changes in the deposit mix, and growth in average interest-bearing deposit balances. Loan Growth ($ thousands) 1Q2024 4Q2023 QTD Annualized Growth Commercial & Industrial $ 3,561,971 $ 3,589,347 (3.1%) Commercial real estate - owner occupied 1,981,613 1,998,787 (3.5%) Other Commercial 994,574 876,908 54.0% Total Commercial & Industrial 6,538,158 6,465,042 4.5% Commercial real estate - non-owner occupied 4,225,018 4,172,401 5.1% Construction and land development 1,246,251 1,107,850 50.2% Multifamily real estate 1,074,957 1,061,997 4.9% Residential 1-4 Family - Commercial 515,667 522,580 (5.3%) Total CRE & Construction 7,061,893 6,864,828 11.5% Total Commercial Loans 13,600,051 13,329,870 8.2% Residential 1-4 Family - Consumer 1,081,094 1,078,173 1.1% Residential 1-4 Family - Revolving 616,951 619,433 (1.6%) Auto 440,118 486,926 (38.7%) Consumer 113,414 120,641 (24.1%) Total Consumer Loans 2,251,577 2,305,173 (9.4%) Total LHFI (net of deferred fees and costs) $ 15,851,628 $ 15,635,043 5.6% Average Loan Yield 6.03% 5.97% Deposit Growth ($ thousands) 1Q2024 4Q2023 QTD Annualized Growth Interest checking accounts $ 4,753,485 $ 4,697,819 4.8% Money market accounts 4,104,282 3,850,679 26.5% Savings accounts 895,213 909,223 (6.2%) Customer time deposits of $250,000 and over 721,155 674,939 27.5% Other customer time deposits 2,293,800 2,173,904 22.2% Time deposits 3,014,955 2,848,843 23.5% Total interest-bearing customer deposits 12,767,935 12,306,564 15.1% Brokered deposits 665,309 548,384 85.8% Total interest-bearing deposits 13,433,244 12,854,948 18.1% Demand deposits 3,845,191 3,963,181 (12.0%) Total Deposits $ 17,278,435 $ 16,818,129 11.0% Average Cost of Deposits 2.39% 2.23% Loan to Deposit Ratio 91.7% 93.0% |
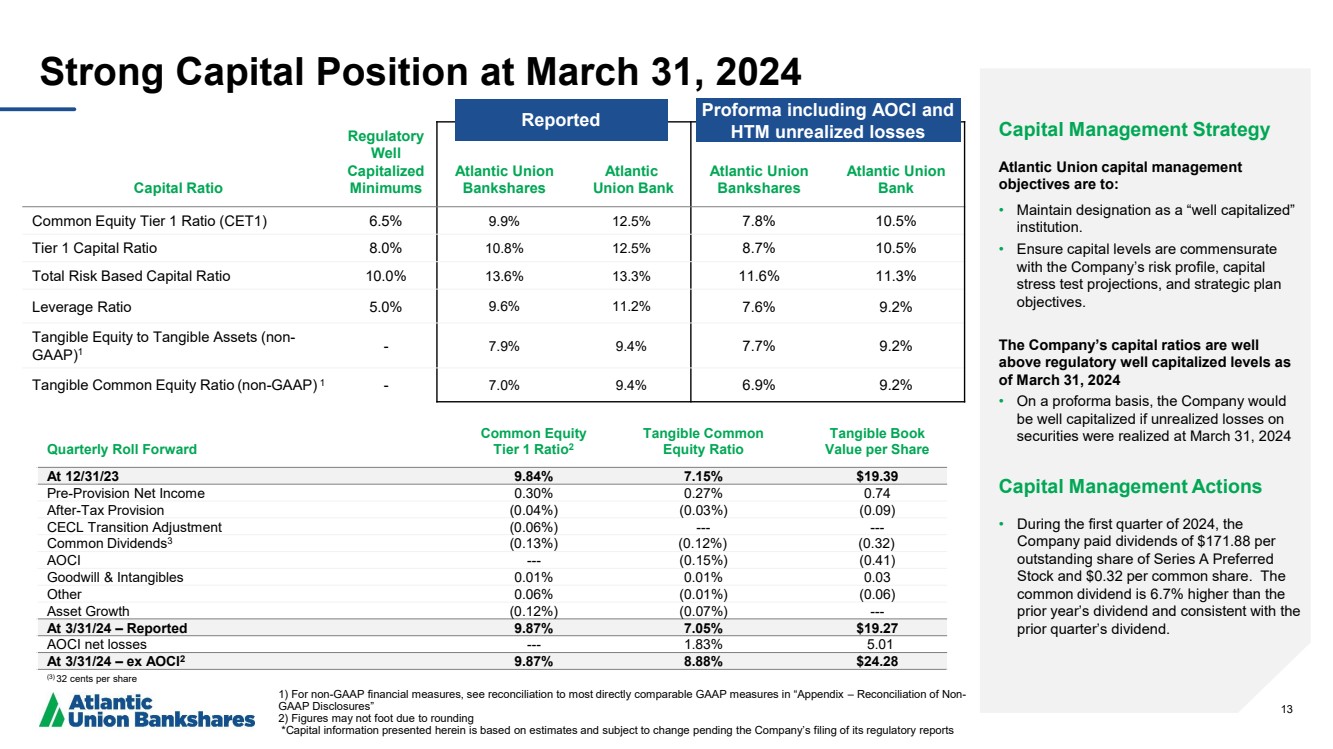
| 13 Capital Ratio Regulatory Well Capitalized Minimums Atlantic Union Bankshares Atlantic Union Bank Atlantic Union Bankshares Atlantic Union Bank Common Equity Tier 1 Ratio (CET1) 6.5% 9.9% 12.5% 7.8% 10.5% Tier 1 Capital Ratio 8.0% 10.8% 12.5% 8.7% 10.5% Total Risk Based Capital Ratio 10.0% 13.6% 13.3% 11.6% 11.3% Leverage Ratio 5.0% 9.6% 11.2% 7.6% 9.2% Tangible Equity to Tangible Assets (non-GAAP)1 - 7.9% 9.4% 7.7% 9.2% Tangible Common Equity Ratio (non-GAAP) 1 - 7.0% 9.4% 6.9% 9.2% Strong Capital Position at March 31, 2024 1) For non-GAAP financial measures, see reconciliation to most directly comparable GAAP measures in “Appendix – Reconciliation of Non-GAAP Disclosures” 2) Figures may not foot due to rounding *Capital information presented herein is based on estimates and subject to change pending the Company’s filing of its regulatory reports Capital Management Strategy Atlantic Union capital management objectives are to: • Maintain designation as a “well capitalized” institution. • Ensure capital levels are commensurate with the Company’s risk profile, capital stress test projections, and strategic plan objectives. The Company’s capital ratios are well above regulatory well capitalized levels as of March 31, 2024 • On a proforma basis, the Company would be well capitalized if unrealized losses on securities were realized at March 31, 2024 Capital Management Actions • During the first quarter of 2024, the Company paid dividends of $171.88 per outstanding share of Series A Preferred Stock and $0.32 per common share. The common dividend is 6.7% higher than the prior year’s dividend and consistent with the prior quarter’s dividend. Quarterly Roll Forward Common Equity Tier 1 Ratio2 Tangible Common Equity Ratio Tangible Book Value per Share At 12/31/23 9.84% 7.15% $19.39 Pre-Provision Net Income 0.30% 0.27% 0.74 After-Tax Provision (0.04%) (0.03%) (0.09) CECL Transition Adjustment (0.06%) --- --- Common Dividends3 (0.13%) (0.12%) (0.32) AOCI --- (0.15%) (0.41) Goodwill & Intangibles 0.01% 0.01% 0.03 Other 0.06% (0.01%) (0.06) Asset Growth (0.12%) (0.07%) --- At 3/31/24 – Reported 9.87% 7.05% $19.27 AOCI net losses --- 1.83% 5.01 At 3/31/24 – ex AOCI2 9.87% 8.88% $24.28 (3) 32 cents per share Reported Proforma including AOCI and HTM unrealized losses |
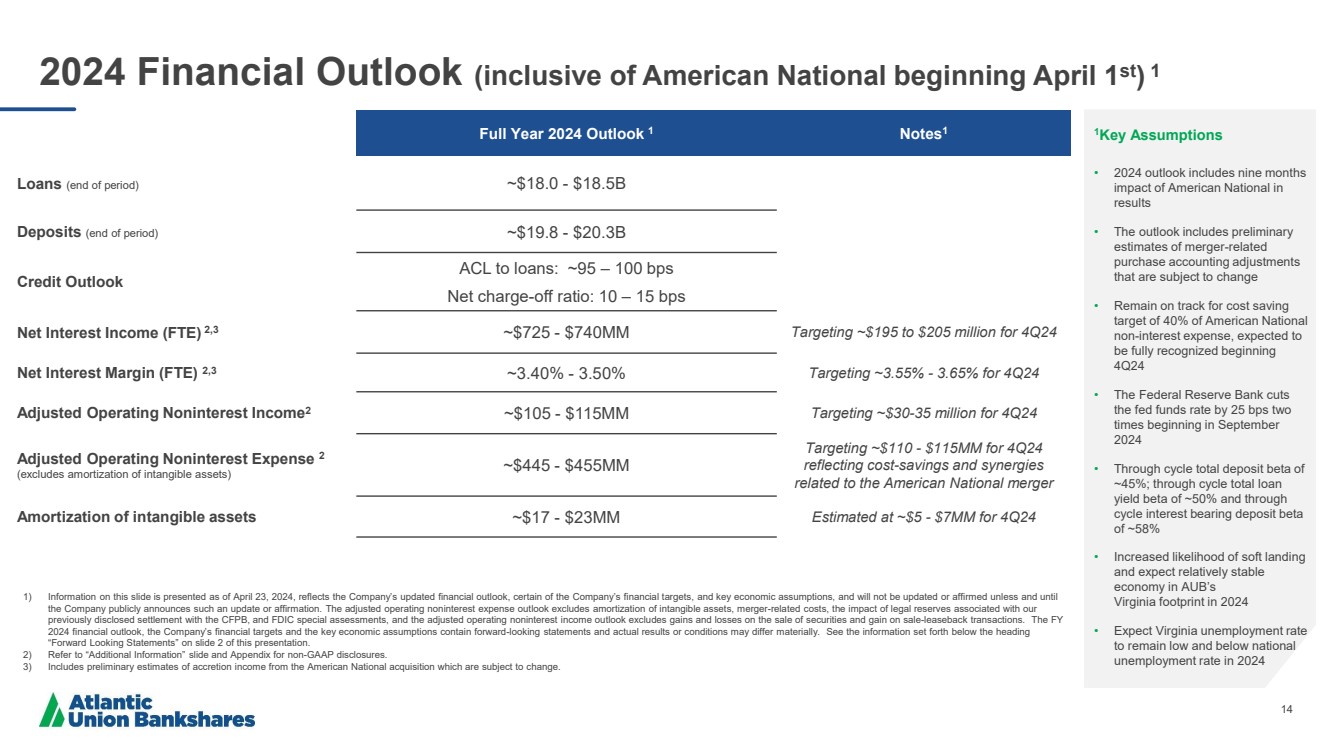
| 14 2024 Financial Outlook (inclusive of American National beginning April 1st) 1 1Key Assumptions • 2024 outlook includes nine months impact of American National in results • The outlook includes preliminary estimates of merger-related purchase accounting adjustments that are subject to change • Remain on track for cost saving target of 40% of American National non-interest expense, expected to be fully recognized beginning 4Q24 • The Federal Reserve Bank cuts the fed funds rate by 25 bps two times beginning in September 2024 • Through cycle total deposit beta of ~45%; through cycle total loan yield beta of ~50% and through cycle interest bearing deposit beta of ~58% • Increased likelihood of soft landing and expect relatively stable economy in AUB’s Virginia footprint in 2024 • Expect Virginia unemployment rate to remain low and below national unemployment rate in 2024 Full Year 2024 Outlook 1 Notes1 Loans (end of period) ~$18.0 - $18.5B Deposits (end of period) ~$19.8 - $20.3B Credit Outlook ACL to loans: ~95 – 100 bps Net charge-off ratio: 10 – 15 bps Net Interest Income (FTE) 2,3 ~$725 - $740MM Targeting ~$195 to $205 million for 4Q24 Net Interest Margin (FTE) 2,3 ~3.40% - 3.50% Targeting ~3.55% - 3.65% for 4Q24 Adjusted Operating Noninterest Income2 ~$105 - $115MM Targeting ~$30-35 million for 4Q24 Adjusted Operating Noninterest Expense 2 (excludes amortization of intangible assets) ~$445 - $455MM Targeting ~$110 - $115MM for 4Q24 reflecting cost-savings and synergies related to the American National merger Amortization of intangible assets ~$17 - $23MM Estimated at ~$5 - $7MM for 4Q24 1) Information on this slide is presented as of April 23, 2024, reflects the Company’s updated financial outlook, certain of the Company’s financial targets, and key economic assumptions, and will not be updated or affirmed unless and until the Company publicly announces such an update or affirmation. The adjusted operating noninterest expense outlook excludes amortization of intangible assets, merger-related costs, the impact of legal reserves associated with our previously disclosed settlement with the CFPB, and FDIC special assessments, and the adjusted operating noninterest income outlook excludes gains and losses on the sale of securities and gain on sale-leaseback transactions. The FY 2024 financial outlook, the Company’s financial targets and the key economic assumptions contain forward-looking statements and actual results or conditions may differ materially. See the information set forth below the heading “Forward Looking Statements” on slide 2 of this presentation. 2) Refer to “Additional Information” slide and Appendix for non-GAAP disclosures. 3) Includes preliminary estimates of accretion income from the American National acquisition which are subject to change. |
| 15 Appendix |

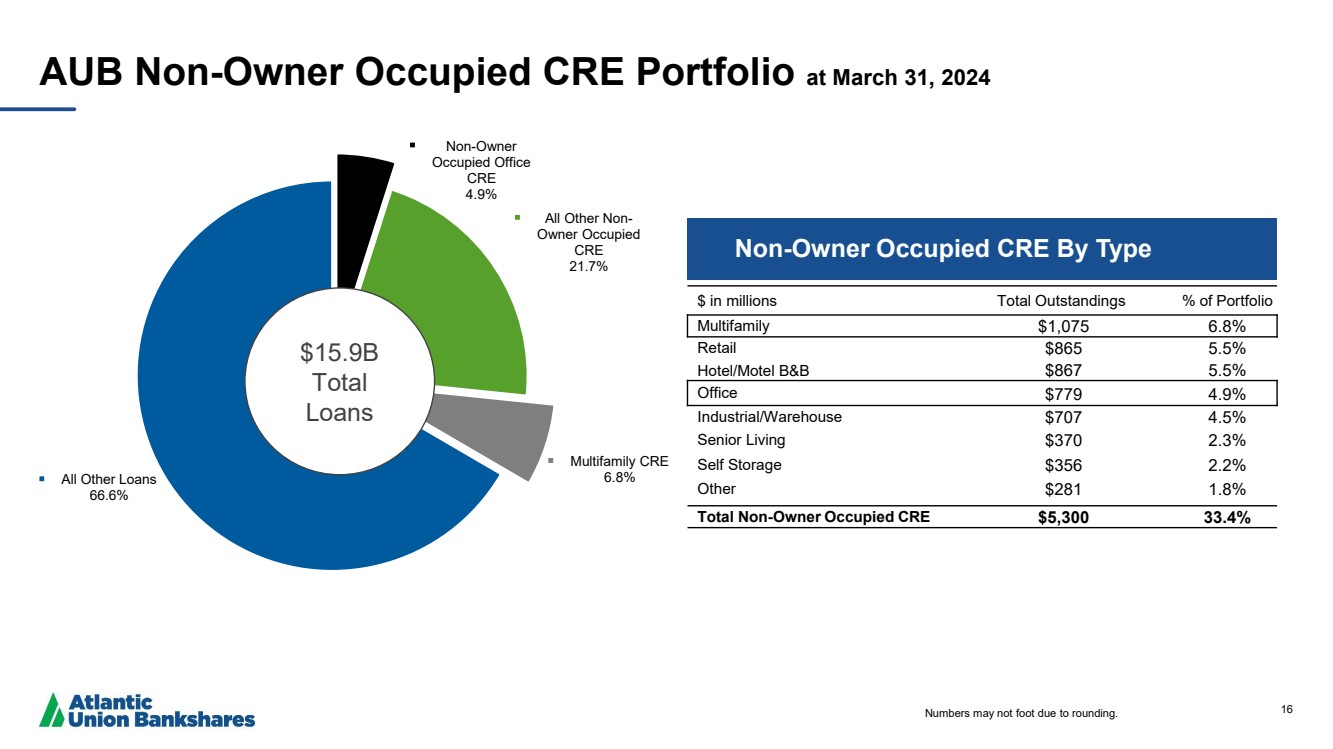
| 16 Non-Owner Occupied Office CRE 4.9% All Other Non-Owner Occupied CRE 21.7% Multifamily CRE All Other Loans 6.8% 66.6% AUB Non-Owner Occupied CRE Portfolio at March 31, 2024 $ in millions Total Outstandings % of Portfolio Multifamily $1,075 6.8% Retail $865 5.5% Hotel/Motel B&B $867 5.5% Office $779 4.9% Industrial/Warehouse $707 4.5% Senior Living $370 2.3% Self Storage $356 2.2% Other $281 1.8% Total Non-Owner Occupied CRE $5,300 33.4% Non-Owner Occupied CRE By Type Numbers may not foot due to rounding. $15.9B Total Loans |
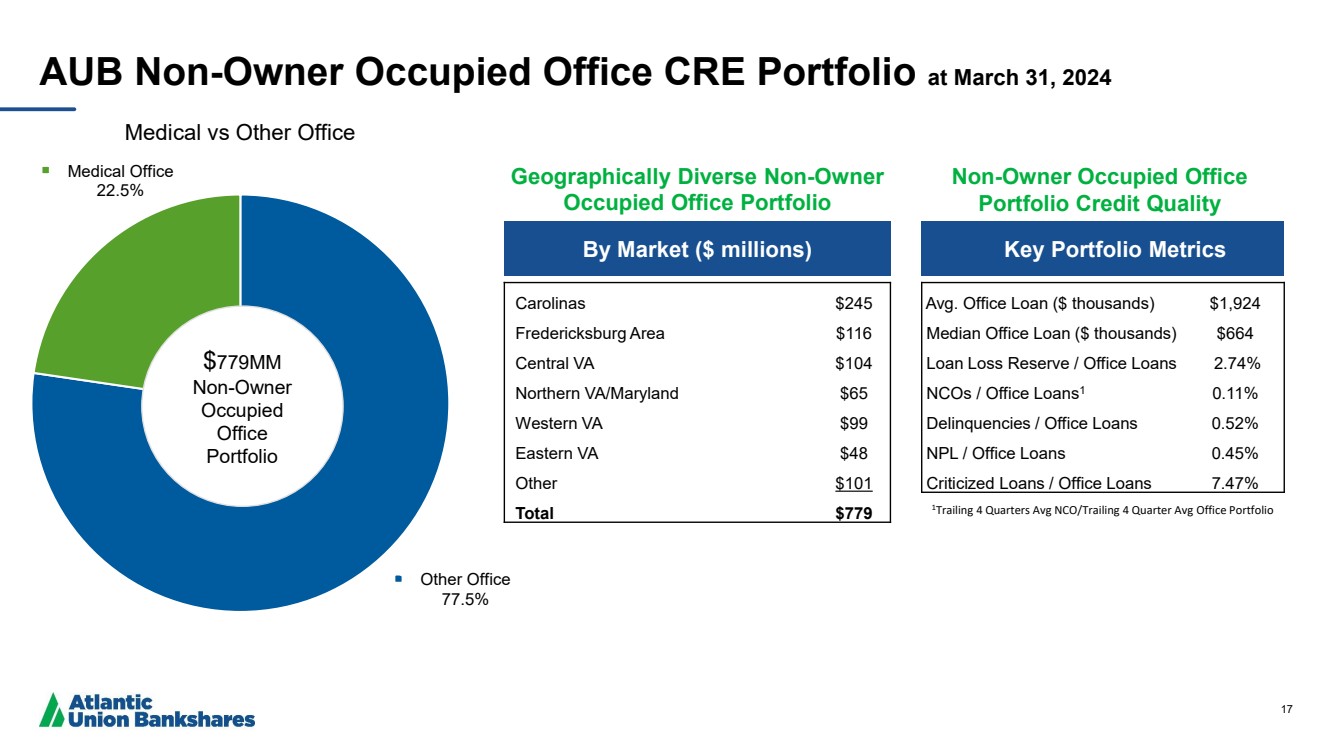
| 17 Other Office 77.5% Medical Office 22.5% Medical vs Other Office By Market ($ millions) Key Portfolio Metrics Carolinas $245 Fredericksburg Area $116 Central VA $104 Northern VA/Maryland $65 Western VA $99 Eastern VA $48 Other $101 Total $779 Avg. Office Loan ($ thousands) $1,924 Median Office Loan ($ thousands) $664 Loan Loss Reserve / Office Loans 2.74% NCOs / Office Loans1 0.11% Delinquencies / Office Loans 0.52% NPL / Office Loans 0.45% Criticized Loans / Office Loans 7.47% AUB Non-Owner Occupied Office CRE Portfolio at March 31, 2024 $779MM Non-Owner Occupied Office Portfolio Non-Owner Occupied Office Portfolio Credit Quality Geographically Diverse Non-Owner Occupied Office Portfolio 1Trailing 4 Quarters Avg NCO/Trailing 4 Quarter Avg Office Portfolio |
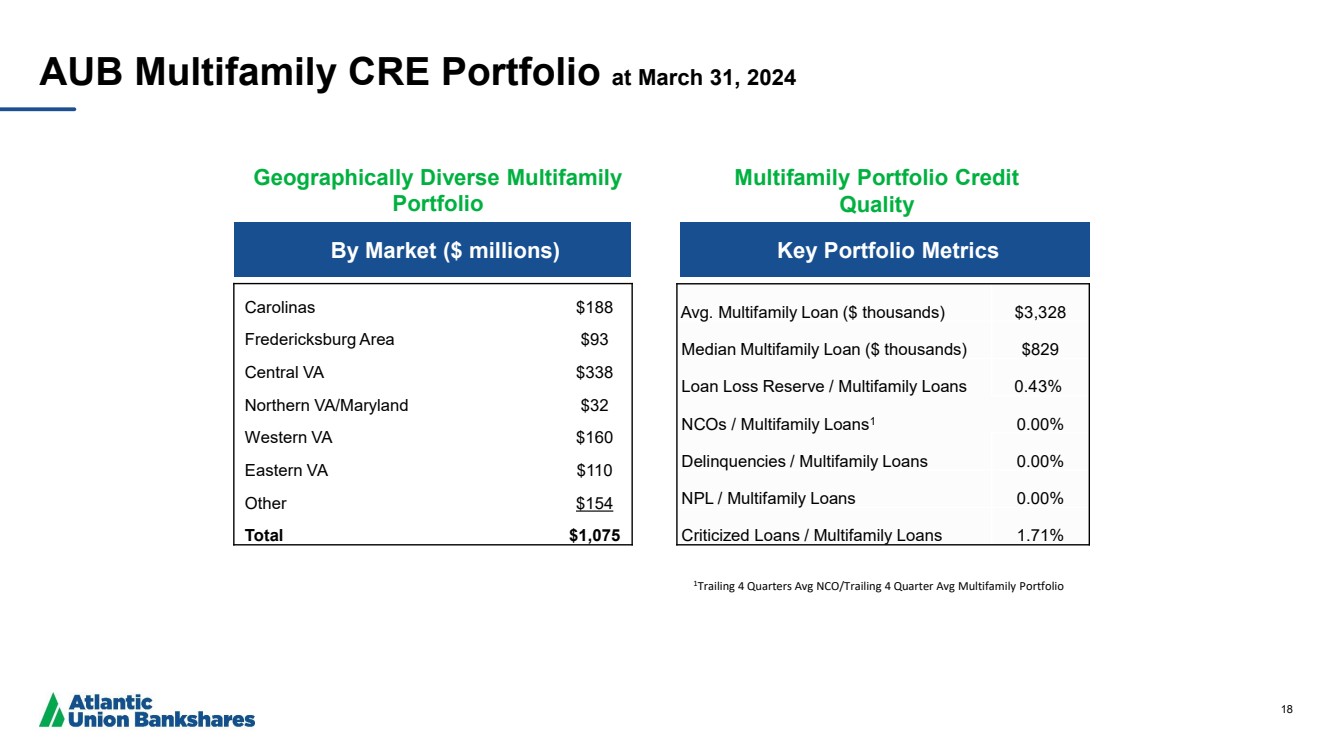
| 18 By Market ($ millions) Key Portfolio Metrics Carolinas $188 Fredericksburg Area $93 Central VA $338 Northern VA/Maryland $32 Western VA $160 Eastern VA $110 Other $154 Total $1,075 AUB Multifamily CRE Portfolio at March 31, 2024 Multifamily Portfolio Credit Quality Geographically Diverse Multifamily Portfolio 1Trailing 4 Quarters Avg NCO/Trailing 4 Quarter Avg Multifamily Portfolio Avg. Multifamily Loan ($ thousands) $3,328 Median Multifamily Loan ($ thousands) $829 Loan Loss Reserve / Multifamily Loans 0.43% NCOs / Multifamily Loans1 0.00% Delinquencies / Multifamily Loans 0.00% NPL / Multifamily Loans 0.00% Criticized Loans / Multifamily Loans 1.71% |
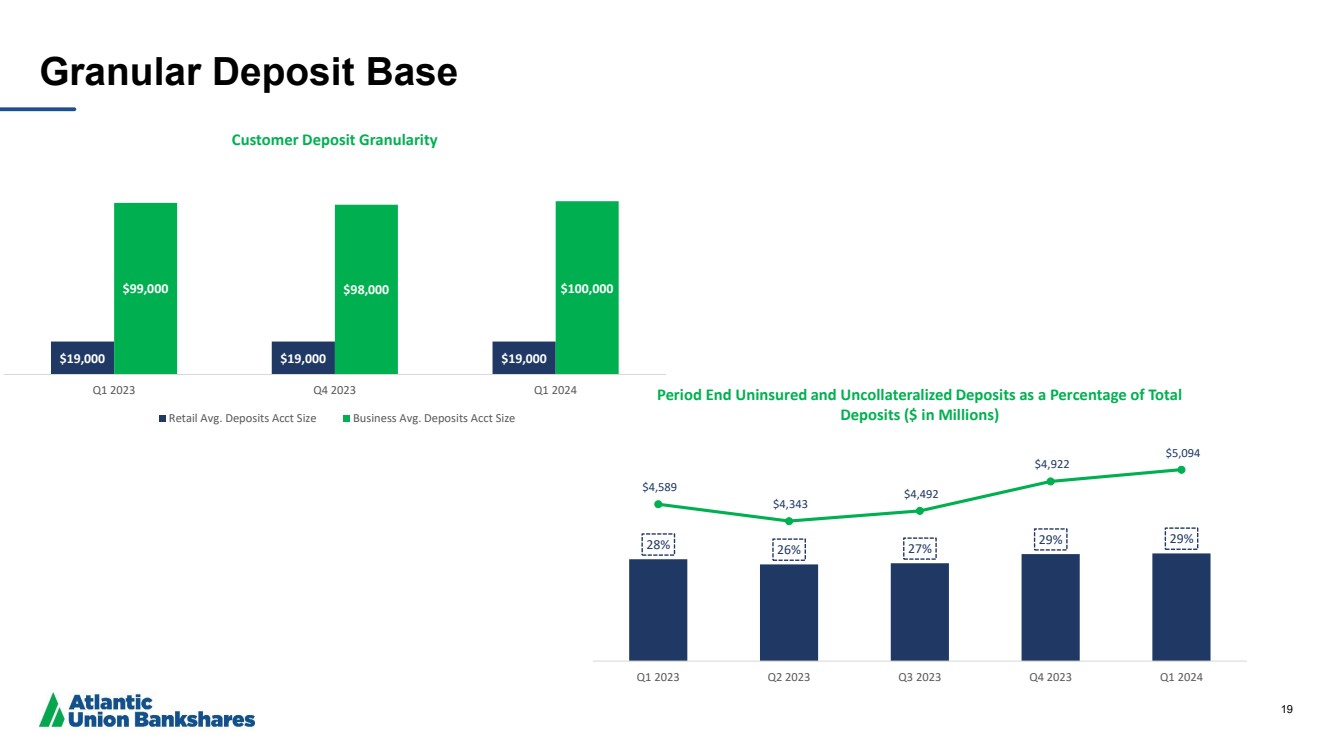
| 19 Granular Deposit Base $19,000 $19,000 $19,000 $99,000 $98,000 $100,000 Q1 2023 Q4 2023 Q1 2024 Customer Deposit Granularity Retail Avg. Deposits Acct Size Business Avg. Deposits Acct Size 28% 26% 27% 29% 29% $4,589 $4,343 $4,492 $4,922 $5,094 Q1 2023 Q2 2023 Q3 2023 Q4 2023 Q1 2024 Period End Uninsured and Uncollateralized Deposits as a Percentage of Total Deposits ($ in Millions) |
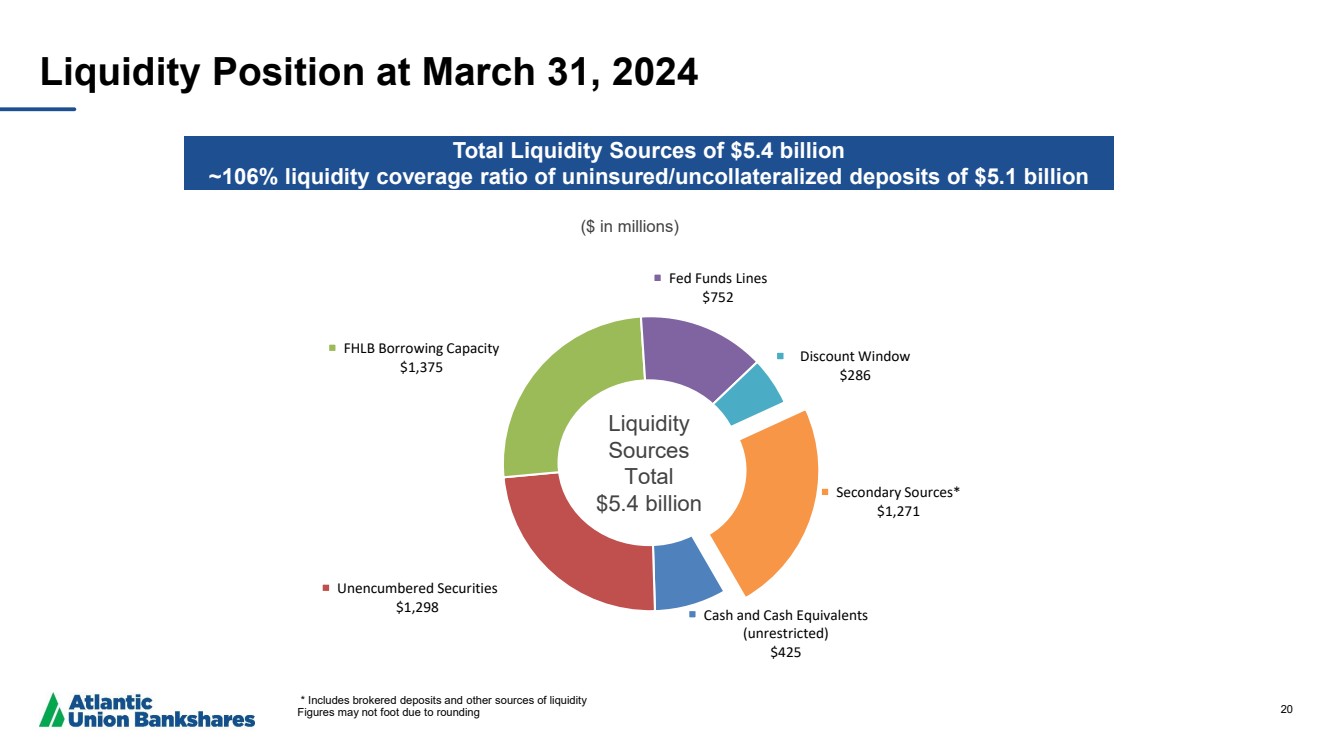
| 20 Cash and Cash Equivalents (unrestricted) $425 Unencumbered Securities $1,298 FHLB Borrowing Capacity $1,375 Fed Funds Lines $752 Discount Window $286 Secondary Sources* $1,271 ($ in millions) Liquidity Position at March 31, 2024 Total Liquidity Sources of $5.4 billion ~106% liquidity coverage ratio of uninsured/uncollateralized deposits of $5.1 billion * Includes brokered deposits and other sources of liquidity Figures may not foot due to rounding Liquidity Sources Total $5.4 billion |
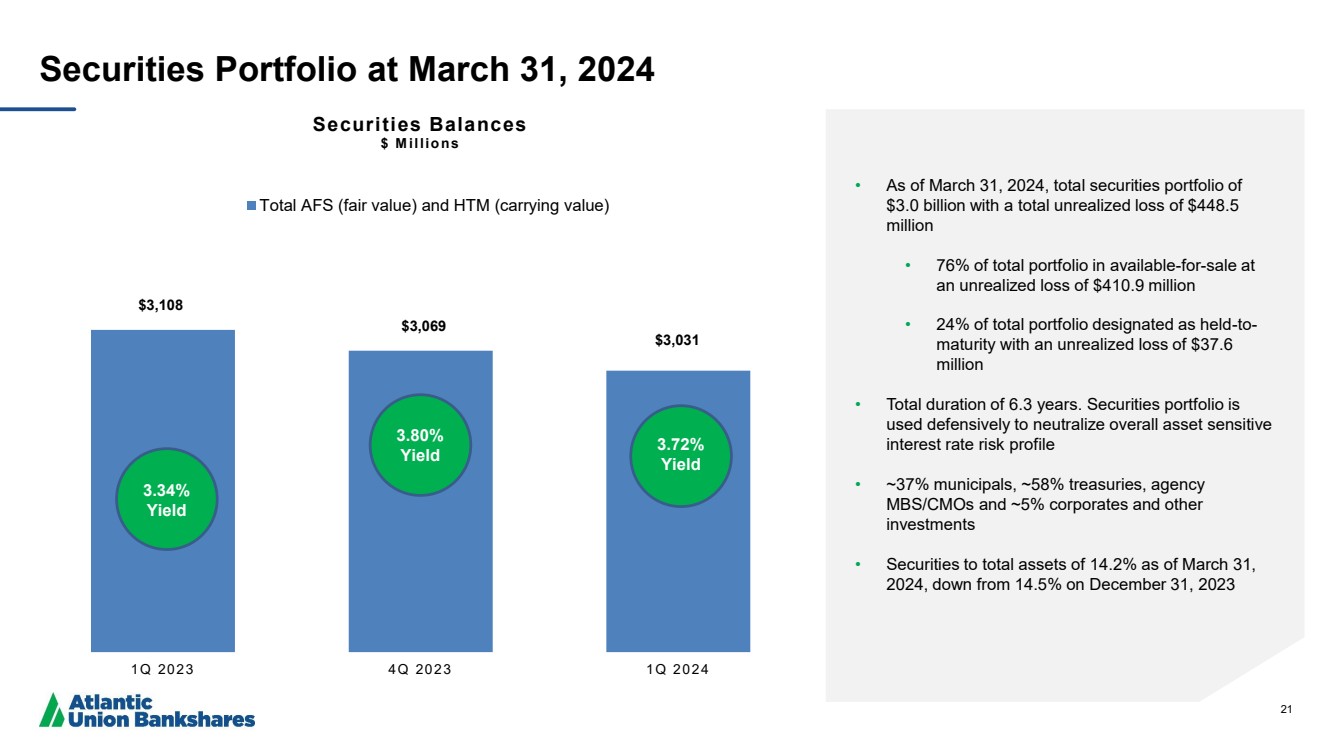
| 21 Securities Portfolio at March 31, 2024 • As of March 31, 2024, total securities portfolio of $3.0 billion with a total unrealized loss of $448.5 million • 76% of total portfolio in available-for-sale at an unrealized loss of $410.9 million • 24% of total portfolio designated as held-to-maturity with an unrealized loss of $37.6 million • Total duration of 6.3 years. Securities portfolio is used defensively to neutralize overall asset sensitive interest rate risk profile • ~37% municipals, ~58% treasuries, agency MBS/CMOs and ~5% corporates and other investments • Securities to total assets of 14.2% as of March 31, 2024, down from 14.5% on December 31, 2023 $3,032 $3,108 $3,069 $3,031 1Q 2023 4Q 2023 1Q 2024 Securities Balances $ M illions Total AFS (fair value) and HTM (carrying value) 3.34% Yield 3.72% Yield 3.80% Yield |
| 22 Reconciliation of Non-GAAP Disclosures The Company has provided supplemental performance measures on a tax-equivalent, tangible, operating, adjusted, or pre-tax pre-provision basis. These non-GAAP financial measures are a supplement to GAAP, which is used to prepare the Company’s financial statements, and should not be considered in isolation or as a substitute for comparable measures calculated in accordance with GAAP. In addition, the Company’s non-GAAP financial measures may not be comparable to non-GAAP financial measures of other companies. The Company uses the non-GAAP financial measures discussed herein in its analysis of the Company’s performance. The Company’s management believes that these non-GAAP financial measures provide additional understanding of ongoing operations, enhance comparability of results of operations with prior periods and show the effects of significant gains and charges in the periods presented without the impact of items or events that may obscure trends in the Company’s underlying performance. |
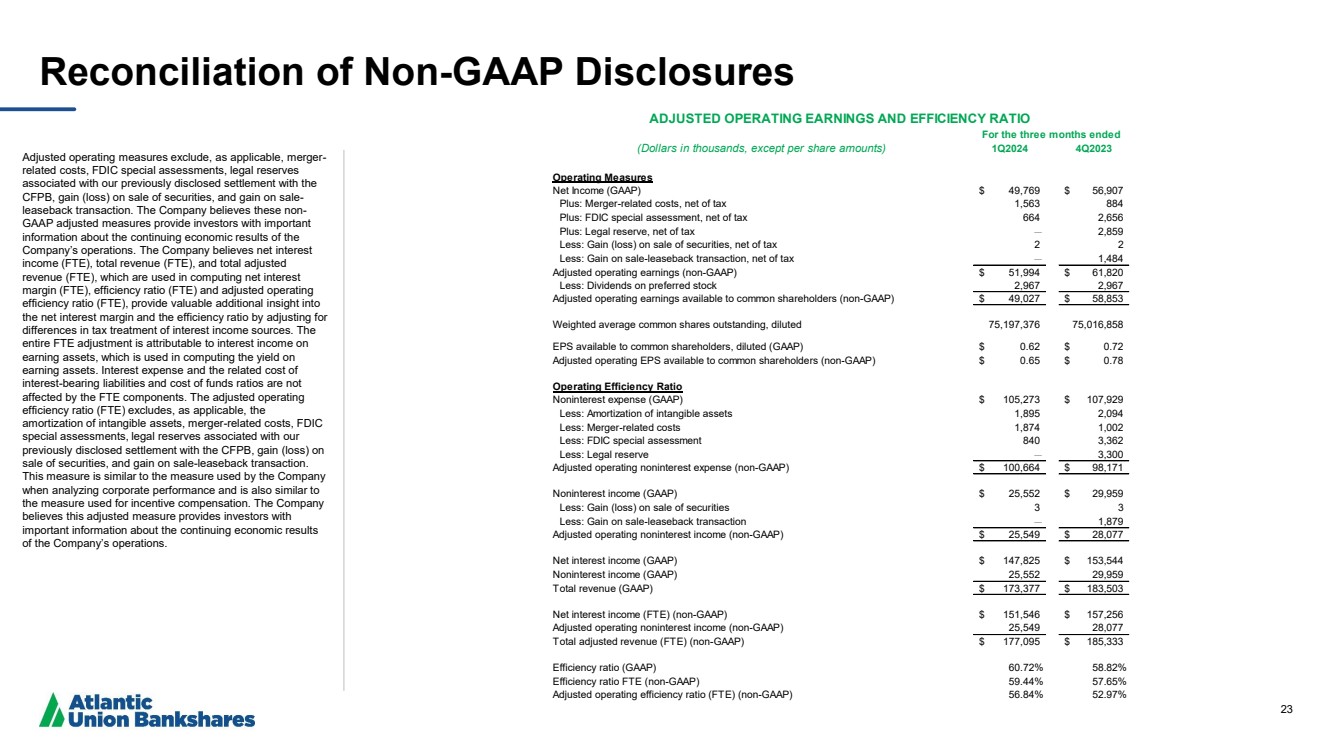
| 23 Reconciliation of Non-GAAP Disclosures Adjusted operating measures exclude, as applicable, merger-related costs, FDIC special assessments, legal reserves associated with our previously disclosed settlement with the CFPB, gain (loss) on sale of securities, and gain on sale-leaseback transaction. The Company believes these non-GAAP adjusted measures provide investors with important information about the continuing economic results of the Company’s operations. The Company believes net interest income (FTE), total revenue (FTE), and total adjusted revenue (FTE), which are used in computing net interest margin (FTE), efficiency ratio (FTE) and adjusted operating efficiency ratio (FTE), provide valuable additional insight into the net interest margin and the efficiency ratio by adjusting for differences in tax treatment of interest income sources. The entire FTE adjustment is attributable to interest income on earning assets, which is used in computing the yield on earning assets. Interest expense and the related cost of interest-bearing liabilities and cost of funds ratios are not affected by the FTE components. The adjusted operating efficiency ratio (FTE) excludes, as applicable, the amortization of intangible assets, merger-related costs, FDIC special assessments, legal reserves associated with our previously disclosed settlement with the CFPB, gain (loss) on sale of securities, and gain on sale-leaseback transaction. This measure is similar to the measure used by the Company when analyzing corporate performance and is also similar to the measure used for incentive compensation. The Company believes this adjusted measure provides investors with important information about the continuing economic results of the Company’s operations. (Dollars in thousands, except per share amounts) 1Q2024 4Q2023 Operating Measures Net Income (GAAP) $ 49,769 $ 56,907 Plus: Merger-related costs, net of tax 1,563 884 Plus: FDIC special assessment, net of tax 664 2,656 Plus: Legal reserve, net of tax — 2,859 Less: Gain (loss) on sale of securities, net of tax 2 2 Less: Gain on sale-leaseback transaction, net of tax — 1,484 Adjusted operating earnings (non-GAAP) $ 51,994 $ 61,820 Less: Dividends on preferred stock 2,967 2,967 Adjusted operating earnings available to common shareholders (non-GAAP) $ 49,027 $ 58,853 Weighted average common shares outstanding, diluted 75,197,376 75,016,858 EPS available to common shareholders, diluted (GAAP) $ 0.62 $ 0.72 Adjusted operating EPS available to common shareholders (non-GAAP) $ 0.65 $ 0.78 Operating Efficiency Ratio Noninterest expense (GAAP) $ 105,273 $ 107,929 Less: Amortization of intangible assets 1,895 2,094 Less: Merger-related costs 1,874 1,002 Less: FDIC special assessment 840 3,362 Less: Legal reserve — 3,300 Adjusted operating noninterest expense (non-GAAP) $ 100,664 $ 98,171 Noninterest income (GAAP) $ 25,552 $ 29,959 Less: Gain (loss) on sale of securities 3 3 Less: Gain on sale-leaseback transaction — 1,879 Adjusted operating noninterest income (non-GAAP) $ 25,549 $ 28,077 Net interest income (GAAP) $ 147,825 $ 153,544 Noninterest income (GAAP) 25,552 29,959 Total revenue (GAAP) $ 173,377 $ 183,503 Net interest income (FTE) (non-GAAP) $ 151,546 $ 157,256 Adjusted operating noninterest income (non-GAAP) 25,549 28,077 Total adjusted revenue (FTE) (non-GAAP) $ 177,095 $ 185,333 Efficiency ratio (GAAP) 60.72% 58.82% Efficiency ratio FTE (non-GAAP) 59.44% 57.65% Adjusted operating efficiency ratio (FTE) (non-GAAP) 56.84% 52.97% ADJUSTED OPERATING EARNINGS AND EFFICIENCY RATIO For the three months ended |
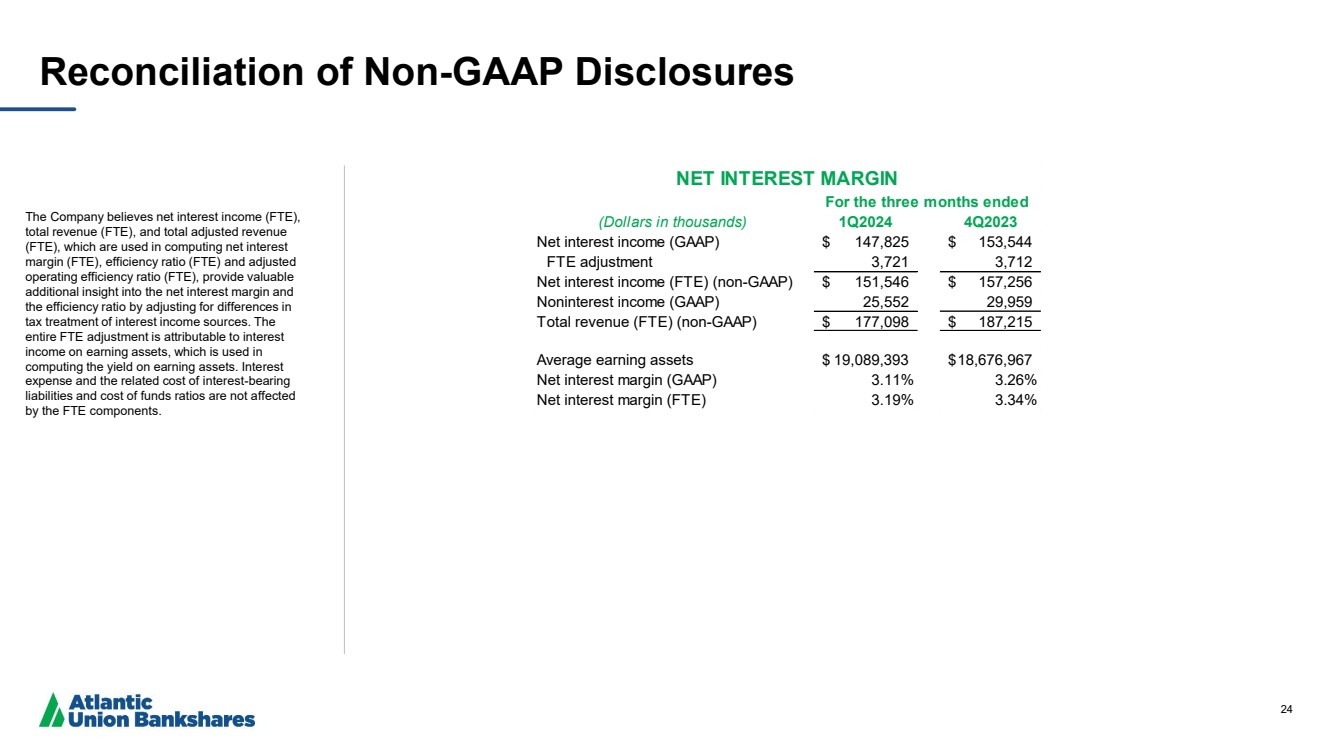
| 24 Reconciliation of Non-GAAP Disclosures The Company believes net interest income (FTE), total revenue (FTE), and total adjusted revenue (FTE), which are used in computing net interest margin (FTE), efficiency ratio (FTE) and adjusted operating efficiency ratio (FTE), provide valuable additional insight into the net interest margin and the efficiency ratio by adjusting for differences in tax treatment of interest income sources. The entire FTE adjustment is attributable to interest income on earning assets, which is used in computing the yield on earning assets. Interest expense and the related cost of interest-bearing liabilities and cost of funds ratios are not affected by the FTE components. (Dollars in thousands) 1Q2024 4Q2023 Net interest income (GAAP) $ 147,825 $ 153,544 FTE adjustment 3,721 3,712 Net interest income (FTE) (non-GAAP) $ 151,546 $ 157,256 Noninterest income (GAAP) 25,552 29,959 Total revenue (FTE) (non-GAAP) $ 177,098 $ 187,215 Average earning assets $ 19,089,393 $18,676,967 Net interest margin (GAAP) 3.11% 3.26% Net interest margin (FTE) 3.19% 3.34% NET INTEREST MARGIN For the three months ended |
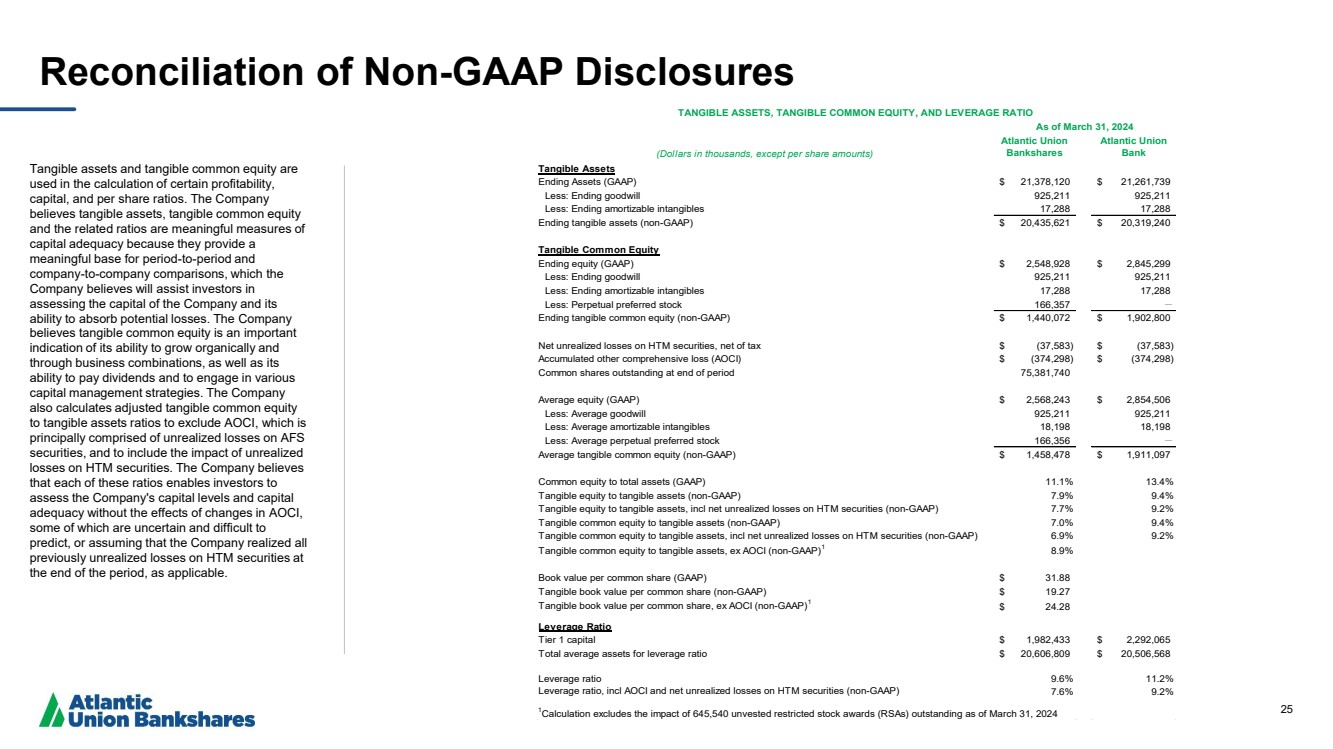
| 25 Reconciliation of Non-GAAP Disclosures Tangible assets and tangible common equity are used in the calculation of certain profitability, capital, and per share ratios. The Company believes tangible assets, tangible common equity and the related ratios are meaningful measures of capital adequacy because they provide a meaningful base for period-to-period and company-to-company comparisons, which the Company believes will assist investors in assessing the capital of the Company and its ability to absorb potential losses. The Company believes tangible common equity is an important indication of its ability to grow organically and through business combinations, as well as its ability to pay dividends and to engage in various capital management strategies. The Company also calculates adjusted tangible common equity to tangible assets ratios to exclude AOCI, which is principally comprised of unrealized losses on AFS securities, and to include the impact of unrealized losses on HTM securities. The Company believes that each of these ratios enables investors to assess the Company's capital levels and capital adequacy without the effects of changes in AOCI, some of which are uncertain and difficult to predict, or assuming that the Company realized all previously unrealized losses on HTM securities at the end of the period, as applicable. (Dollars in thousands, except per share amounts) Atlantic Union Bankshares Atlantic Union Bank Tangible Assets Ending Assets (GAAP) $ 21,378,120 $ 21,261,739 Less: Ending goodwill 925,211 925,211 Less: Ending amortizable intangibles 17,288 17,288 Ending tangible assets (non-GAAP) $ 20,435,621 $ 20,319,240 Tangible Common Equity Ending equity (GAAP) $ 2,548,928 $ 2,845,299 Less: Ending goodwill 925,211 925,211 Less: Ending amortizable intangibles 17,288 17,288 Less: Perpetual preferred stock 166,357 — Ending tangible common equity (non-GAAP) $ 1,440,072 $ 1,902,800 Net unrealized losses on HTM securities, net of tax $ (37,583) $ (37,583) Accumulated other comprehensive loss (AOCI) $ (374,298) $ (374,298) Common shares outstanding at end of period 75,381,740 Average equity (GAAP) $ 2,568,243 $ 2,854,506 Less: Average goodwill 925,211 925,211 Less: Average amortizable intangibles 18,198 18,198 Less: Average perpetual preferred stock 166,356 — Average tangible common equity (non-GAAP) $ 1,458,478 $ 1,911,097 Less: Perpetual preferred stock Common equity to total assets (GAAP) 11.1% 13.4% Tangible equity to tangible assets (non-GAAP) 7.9% 9.4% Tangible equity to tangible assets, incl net unrealized losses on HTM securities (non-GAAP) 7.7% 9.2% Tangible common equity to tangible assets (non-GAAP) 7.0% 9.4% Tangible common equity to tangible assets, incl net unrealized losses on HTM securities (non-GAAP) 6.9% 9.2% Tangible common equity to tangible assets, ex AOCI (non-GAAP)1 8.9% Book value per common share (GAAP) $ 31.88 Tangible book value per common share (non-GAAP) $ 19.27 Tangible book value per common share, ex AOCI (non-GAAP)1 $ 24.28 Leverage Ratio Tier 1 capital $ 1,982,433 $ 2,292,065 Total average assets for leverage ratio $ 20,606,809 $ 20,506,568 Leverage ratio 9.6% 11.2% Leverage ratio, incl AOCI and net unrealized losses on HTM securities (non-GAAP) 7.6% 9.2% TANGIBLE ASSETS, TANGIBLE COMMON EQUITY, AND LEVERAGE RATIO As of March 31, 2024 1Calculation excludes the impact of 645,540 unvested restricted stock awards (RSAs) outstanding as of March 31, 2024 |
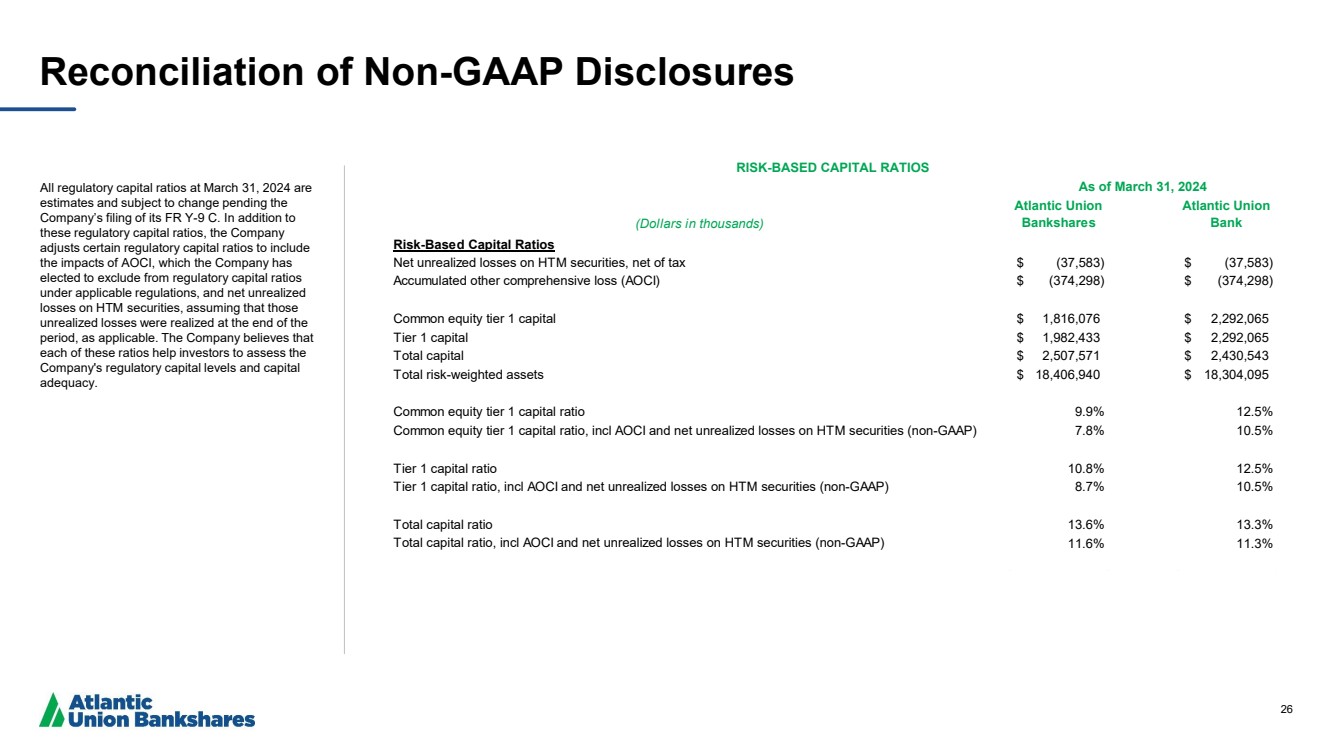
| 26 Reconciliation of Non-GAAP Disclosures All regulatory capital ratios at March 31, 2024 are estimates and subject to change pending the Company’s filing of its FR Y-9 C. In addition to these regulatory capital ratios, the Company adjusts certain regulatory capital ratios to include the impacts of AOCI, which the Company has elected to exclude from regulatory capital ratios under applicable regulations, and net unrealized losses on HTM securities, assuming that those unrealized losses were realized at the end of the period, as applicable. The Company believes that each of these ratios help investors to assess the Company's regulatory capital levels and capital adequacy. (Dollars in thousands) Atlantic Union Bankshares Atlantic Union Bank Risk-Based Capital Ratios Net unrealized losses on HTM securities, net of tax $ (37,583) $ (37,583) Accumulated other comprehensive loss (AOCI) $ (374,298) $ (374,298) Common equity tier 1 capital $ 1,816,076 $ 2,292,065 Tier 1 capital $ 1,982,433 $ 2,292,065 Total capital $ 2,507,571 $ 2,430,543 Total risk-weighted assets $ 18,406,940 $ 18,304,095 Common equity tier 1 capital ratio 9.9% 12.5% Common equity tier 1 capital ratio, incl AOCI and net unrealized losses on HTM securities (non-GAAP) 7.8% 10.5% Tier 1 capital ratio 10.8% 12.5% Tier 1 capital ratio, incl AOCI and net unrealized losses on HTM securities (non-GAAP) 8.7% 10.5% Total capital ratio 13.6% 13.3% Total capital ratio, incl AOCI and net unrealized losses on HTM securities (non-GAAP) 11.6% 11.3% RISK-BASED CAPITAL RATIOS As of March 31, 2024 |
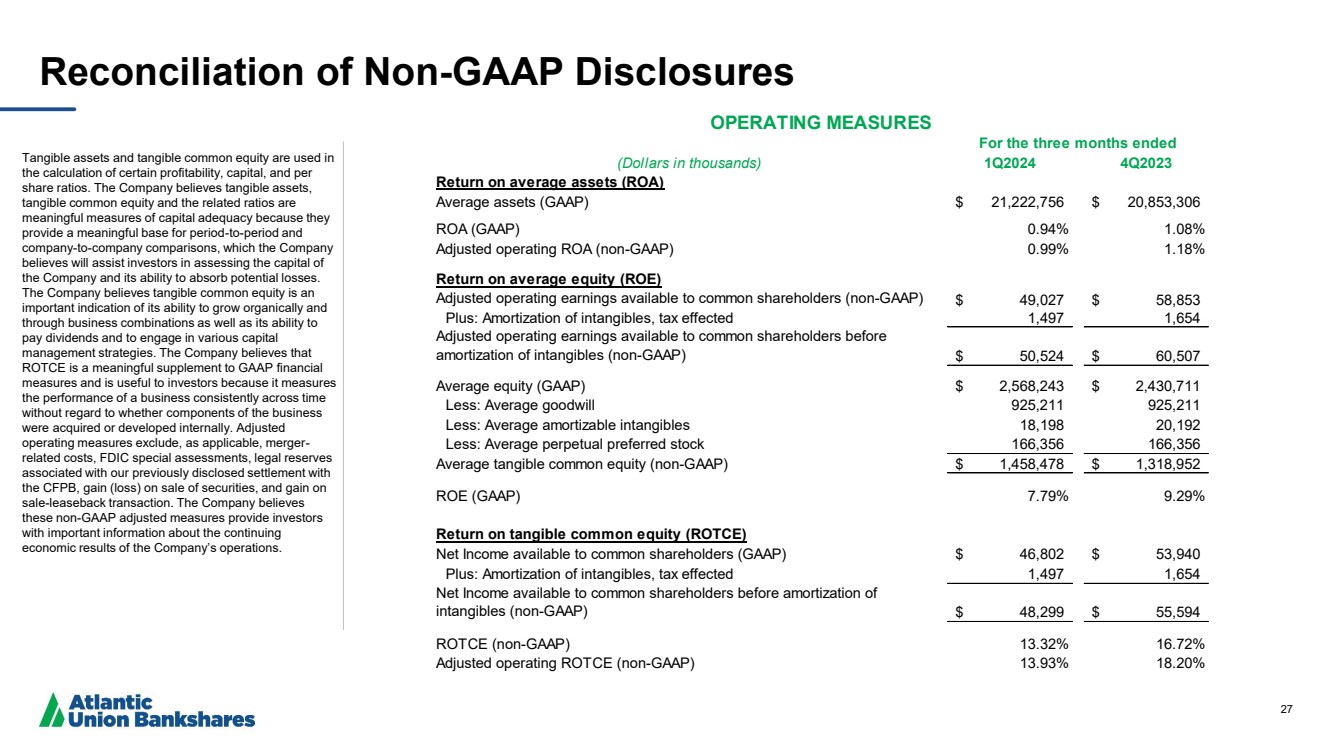
| 27 Reconciliation of Non-GAAP Disclosures Tangible assets and tangible common equity are used in the calculation of certain profitability, capital, and per share ratios. The Company believes tangible assets, tangible common equity and the related ratios are meaningful measures of capital adequacy because they provide a meaningful base for period-to-period and company-to-company comparisons, which the Company believes will assist investors in assessing the capital of the Company and its ability to absorb potential losses. The Company believes tangible common equity is an important indication of its ability to grow organically and through business combinations as well as its ability to pay dividends and to engage in various capital management strategies. The Company believes that ROTCE is a meaningful supplement to GAAP financial measures and is useful to investors because it measures the performance of a business consistently across time without regard to whether components of the business were acquired or developed internally. Adjusted operating measures exclude, as applicable, merger-related costs, FDIC special assessments, legal reserves associated with our previously disclosed settlement with the CFPB, gain (loss) on sale of securities, and gain on sale-leaseback transaction. The Company believes these non-GAAP adjusted measures provide investors with important information about the continuing economic results of the Company’s operations. (Dollars in thousands) 1Q2024 4Q2023 Return on average assets (ROA) Average assets (GAAP) $ 21,222,756 $ 20,853,306 ROA (GAAP) 0.94% 1.08% Adjusted operating ROA (non-GAAP) 0.99% 1.18% Return on average equity (ROE) Adjusted operating earnings available to common shareholders (non-GAAP) $ 49,027 $ 58,853 Plus: Amortization of intangibles, tax effected 1,497 1,654 Adjusted operating earnings available to common shareholders before amortization of intangibles (non-GAAP) $ 50,524 $ 60,507 Average equity (GAAP) $ 2,568,243 $ 2,430,711 Less: Average goodwill 925,211 925,211 Less: Average amortizable intangibles 18,198 20,192 Less: Average perpetual preferred stock 166,356 166,356 Average tangible common equity (non-GAAP) $ 1,458,478 $ 1,318,952 ROE (GAAP) 7.79% 9.29% Return on tangible common equity (ROTCE) Net Income available to common shareholders (GAAP) $ 46,802 $ 53,940 Plus: Amortization of intangibles, tax effected 1,497 1,654 Net Income available to common shareholders before amortization of intangibles (non-GAAP) $ 48,299 $ 55,594 ROTCE (non-GAAP) 13.32% 16.72% Adjusted operating ROTCE (non-GAAP) 13.93% 18.20% For the three months ended OPERATING MEASURES |
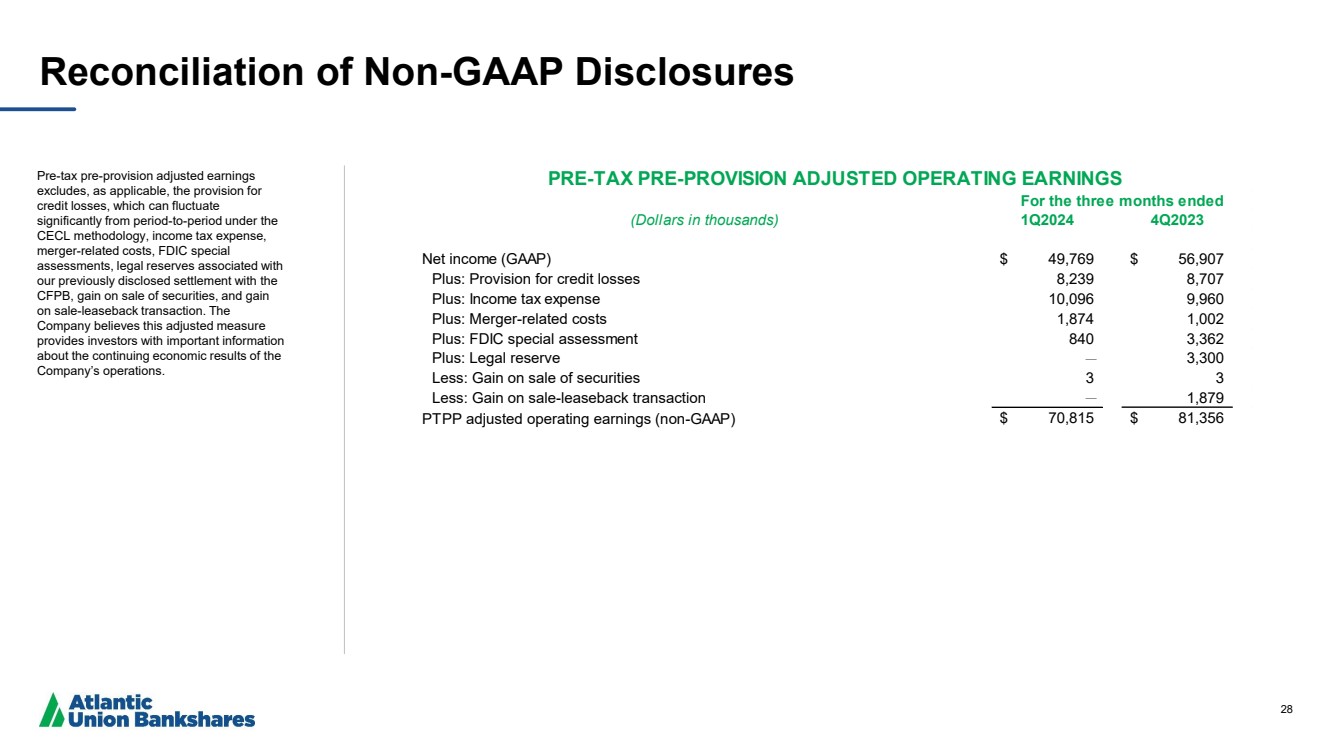
| 28 Reconciliation of Non-GAAP Disclosures Pre-tax pre-provision adjusted earnings excludes, as applicable, the provision for credit losses, which can fluctuate significantly from period-to-period under the CECL methodology, income tax expense, merger-related costs, FDIC special assessments, legal reserves associated with our previously disclosed settlement with the CFPB, gain on sale of securities, and gain on sale-leaseback transaction. The Company believes this adjusted measure provides investors with important information about the continuing economic results of the Company’s operations. (Dollars in thousands) 1Q2024 4Q2023 Net income (GAAP) $ 49,769 $ 56,907 Plus: Provision for credit losses 8,239 8,707 Plus: Income tax expense 10,096 9,960 Plus: Merger-related costs 1,874 1,002 Plus: FDIC special assessment 840 3,362 Plus: Legal reserve — 3,300 Less: Gain on sale of securities 3 3 Less: Gain on sale-leaseback transaction — 1,879 PTPP adjusted operating earnings (non-GAAP) $ 70,815 $ 81,356 For the three months ended PRE-TAX PRE-PROVISION ADJUSTED OPERATING EARNINGS |