| Annual Shareholders’ Meeting NYSE: AUB May 2, 2023 |

| 2 Forward Looking Statements This presentation and statements by our management may constitute “forward-looking statements” within the meaning of the Private Securities Litigation Reform Act of 1995. Forward-looking statements are statements that include, without limitation, expectations with respect to deposit betas, statements regarding our strategic priorities, plans, and imperatives, including statements of how we plan to achieve these priorities, plans, and imperatives, statements about our liquidity and capital management strategies, expectations with regard to our business, financial, and operating results, including our deposit base and funding, the impact of future economic conditions, and statements that include, other projections, predictions, expectations, or beliefs about future events or results, including our ability to meet our top tier financial targets, or otherwise are not statements of historical fact. Such forward-looking statements are based on certain assumptions as of the time they are made, and are inherently subject to known and unknown risks, uncertainties, and other factors, some of which cannot be predicted or quantified, that may cause actual results, performance, achievements, or trends to be materially different from those expressed or implied by such forward-looking statements. Such statements are often characterized by the use of qualified words (and their derivatives) such as “expect,” “believe,” “estimate,” “plan,” “project,” “anticipate,” “intend,” “will,” “may,” “view,” “opportunity,” “potential,” “continue,” “confidence,” or words of similar meaning or other statements concerning opinions or judgment of the Company and our management about future events. Although we believe that our expectations with respect to forward-looking statements are based upon reasonable assumptions within the bounds of our existing knowledge of our business and operations, there can be no assurance that actual future results, performance, or achievements of, or trends affecting, us will not differ materially from any projected future results, performance, achievements or trends expressed or implied by such forward-looking statements. Actual future results, performance, achievements or trends may differ materially from historical results or those anticipated depending on a variety of factors, including, but not limited to the effects of or changes in: • market interest rates and their related impacts on macroeconomic conditions, customer and client behavior, our funding costs and our loan and securities portfolios; • inflation and its impacts on economic growth and customer and client behavior; • adverse developments in the financial industry generally, such as the recent bank failures, responsive measures to mitigate and manage such developments, related supervisory and regulatory actions and costs, and related impacts on customer and client behavior; • the sufficiency of liquidity; • general economic and financial market conditions, in the United States generally and particularly in the markets in which we operate and which our loans are concentrated, including the effects of declines in real estate values, an increase in unemployment levels and slowdowns in economic growth; • monetary and fiscal policies of the U.S. government, including policies of the U.S. Department of the Treasury and the Federal Reserve; • the quality or composition of our loan or investment portfolios and changes therein; • demand for loan products and financial services in our market areas; • our ability to manage our growth or implement our growth strategy; • the effectiveness of expense reduction plans; • the introduction of new lines of business or new products and services; • our ability to recruit and retain key employees; • real estate values in our lending area; • changes in accounting principles, standards, rules, and interpretations, and the related impact on our financial statements; • an insufficient ACL or volatility in the ACL resulting from the CECL methodology, either alone or as that may be affected by inflation, changing interest rates, or other factors; • our liquidity and capital positions; • concentrations of loans secured by real estate, particularly commercial real estate; • the effectiveness of our credit processes and management of our credit risk; • our ability to compete in the market for financial services and increased competition from fintech companies; • technological risks and developments, and cyber threats, attacks, or events; • operational, technological, cultural, regulatory, legal, credit, and other risks associated with the exploration, consummation and integration of potential future acquisitions, whether involving stock or cash considerations; • the potential adverse effects of unusual and infrequently occurring events, such as weather-related disasters, terrorist acts, geopolitical conflicts or public health events, and of governmental and societal responses thereto; these potential adverse effects may include, without limitation, adverse effects on the ability of our borrowers to satisfy their obligations to us, on the value of collateral securing loans, on the demand for the our loans or our other products and services, on supply chains and methods used to distribute products and services, on incidents of cyberattack and fraud, on our liquidity or capital positions, on risks posed by reliance on third-party service providers, on other aspects of our business operations and on financial markets and economic growth; • the discontinuation of LIBOR and its impact on the financial markets, and our ability to manage operational, legal, and compliance risks related to the discontinuation of LIBOR and implementation of one or more alternate reference rates; • performance by our counterparties or vendors; • deposit flows; • the availability of financing and the terms thereof; • the level of prepayments on loans and mortgage-backed securities; • legislative or regulatory changes and requirements; • actual or potential claims, damages, and fines related to litigation or government actions, which may result in, among other things, additional costs, fines, penalties, restrictions on our business activities, reputational harm, or other adverse consequences; • the effects of changes in federal, state or local tax laws and regulations; • any event or development that would cause us to conclude that there was an impairment of any asset, including intangible assets, such as goodwill; and • other factors, many of which are beyond our control. Please also refer to such other factors as discussed throughout Part I, Item 1A. “Risk Factors” and Part II, Item 7, “Management’s Discussion and Analysis of Financial Condition and Results of Operations” of the Company’s Annual Report on Form 10 K for the year ended December 31, 2022 and related disclosures in other filings, which have been filed with the U.S. Securities and Exchange Commission (“SEC”) and are available on the SEC’s website at www.sec.gov. All risk factors and uncertainties described herein and therein should be considered in evaluating forward-looking statements, and all of the forward-looking statements are expressly qualified by the cautionary statements contained or referred to herein and therein. The actual results or developments anticipated may not be realized or, even if substantially realized, they may not have the expected consequences to or effects on the Company or its businesses or operations. Readers are cautioned not to rely too heavily on the forward-looking statements, and undue reliance should not be placed on such forward-looking statements. Forward-looking statements speak only as of the date they are made. We do not intend or assume any obligation to update, revise or clarify any forward-looking statements that may be made from time to time by or on behalf of the Company, whether as a result of new information, future events or otherwise. |
| 3 Additional Information Non-GAAP Financial Measures This presentation contains certain financial information determined by methods other than in accordance with generally accepted accounting principles in the United States (“GAAP”). These non-GAAP financial measures are a supplement to GAAP, which is used to prepare the Company’s financial statements, and should not be considered in isolation or as a substitute for comparable measures calculated in accordance with GAAP. In addition, the Company’s non-GAAP financial measures may not be comparable to non-GAAP financial measures of other companies. The Company uses the non-GAAP financial measures discussed herein in its analysis of the Company’s performance. The Company’s management believes that these non-GAAP financial measures provide additional understanding of ongoing operations, enhance comparability of results of operations with prior periods, show the effects of significant gains and charges in the periods presented without the impact of items or events that may obscure trends in the Company’s underlying performance, or show the potential effects of accumulated other comprehensive income (or AOCI) or unrealized losses on securities on the Company's capital. Please see “Reconciliation of Non-GAAP Disclosures” at the end of this presentation for a reconciliation to the nearest GAAP financial measure. No Offer or Solicitation This presentation does not constitute an offer to sell or a solicitation of an offer to buy any securities. No offer of securities shall be made except by means of a prospectus meeting the requirements of the Securities Act of 1933, as amended, and no offer to sell or solicitation of an offer to buy shall be made in any jurisdiction in which such offer, solicitation or sale would be unlawful. About Atlantic Union Bankshares Corporation Headquartered in Richmond, Virginia, Atlantic Union Bankshares Corporation (NYSE: AUB) is the holding company for Atlantic Union Bank. Atlantic Union Bank has 109 branches and approximately 125 ATMs located throughout Virginia, and in portions of Maryland and North Carolina. Certain non-bank financial services affiliates of Atlantic Union Bank include: Atlantic Union Equipment Finance, Inc., which provides equipment financing; Atlantic Union Financial Consultants, LLC, which provides brokerage services; and Union Insurance Group, LLC, which offers various lines of insurance products. |
| 4 4 John Asbury Chief Executive Officer |

| 5 Opening the New York Stock Exchange |

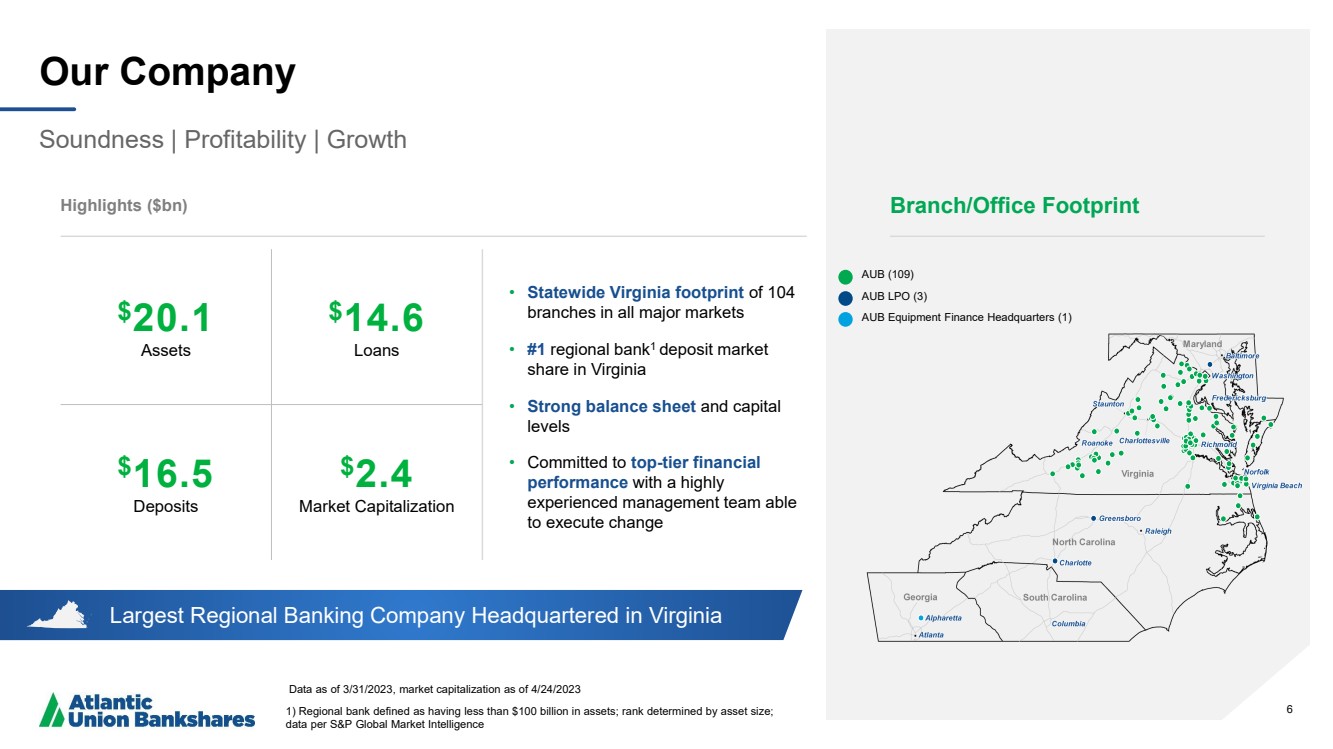
| 6 Largest Regional Banking Company Headquartered in Virginia Our Company Soundness | Profitability | Growth Data as of 3/31/2023, market capitalization as of 4/24/2023 1) Regional bank defined as having less than $100 billion in assets; rank determined by asset size; data per S&P Global Market Intelligence Highlights ($bn) • Statewide Virginia footprint of 104 branches in all major markets • #1 regional bank1 deposit market share in Virginia • Strong balance sheet and capital levels • Committed to top-tier financial performance with a highly experienced management team able to execute change 6 $20.1 Assets $14.6 Loans $16.5 Deposits $2.4 Market Capitalization Branch/Office Footprint AUB (109) AUB LPO (3) AUB Equipment Finance Headquarters (1) |
| 7 Our Shareholder Value Proposition Leading Regional Presence Dense, uniquely valuable presence across attractive markets Financial Strength Solid balance sheet & capital levels Attractive Financial Profile Solid dividend yield & payout ratio with earnings upside Strong Growth Potential Organic & acquisition opportunities Peer-Leading Performance Committed to top-tier financial performance |
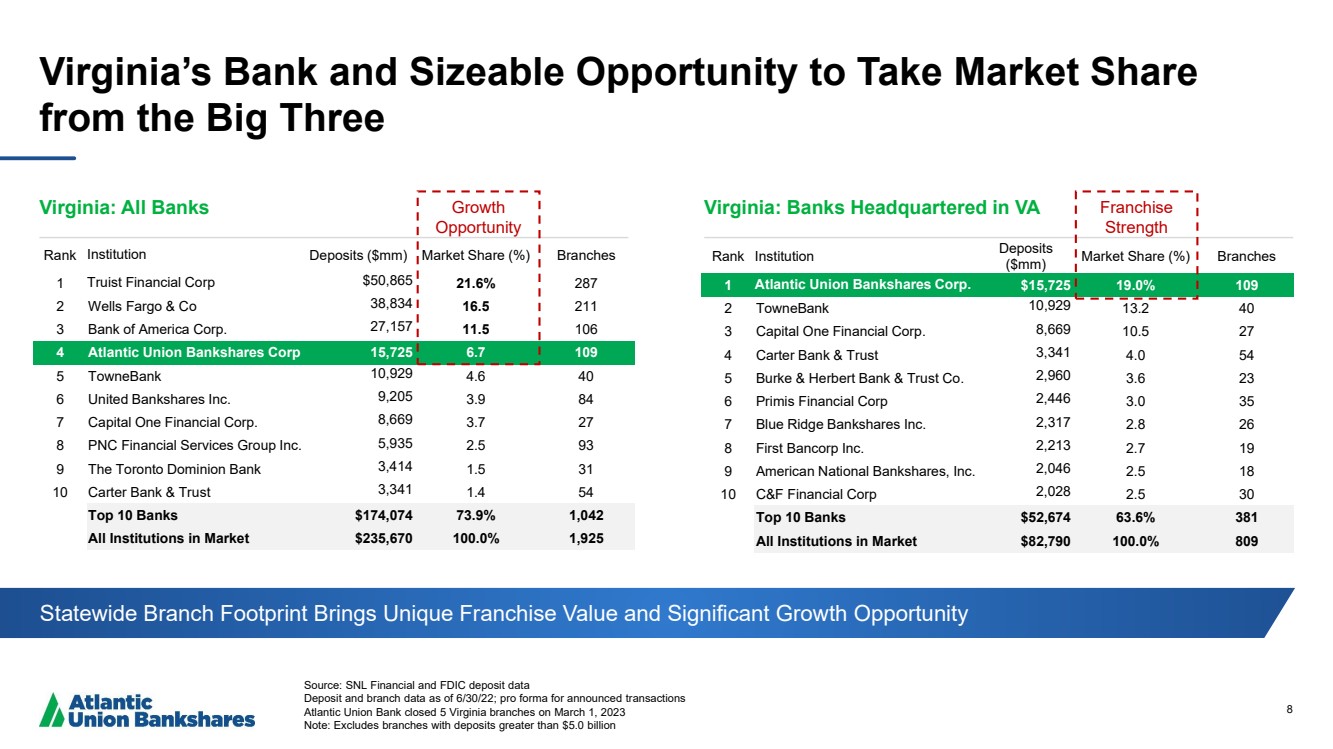
| 8 Virginia’s Bank and Sizeable Opportunity to Take Market Share from the Big Three Source: SNL Financial and FDIC deposit data Deposit and branch data as of 6/30/22; pro forma for announced transactions Atlantic Union Bank closed 5 Virginia branches on March 1, 2023 Note: Excludes branches with deposits greater than $5.0 billion Virginia: All Banks Virginia: Banks Headquartered in VA Rank Institution Deposits ($mm) Market Share (%) Branches 1 Truist Financial Corp $50,865 21.6% 287 2 Wells Fargo & Co 38,834 16.5 211 3 Bank of America Corp. 27,157 11.5 106 4 Atlantic Union Bankshares Corp 15,725 6.7 109 5 TowneBank 10,929 4.6 40 6 United Bankshares Inc. 9,205 3.9 84 7 Capital One Financial Corp. 8,669 3.7 27 8 PNC Financial Services Group Inc. 5,935 2.5 93 9 The Toronto Dominion Bank 3,414 1.5 31 10 Carter Bank & Trust 3,341 1.4 54 Top 10 Banks $174,074 73.9% 1,042 All Institutions in Market $235,670 100.0% 1,925 Rank Institution Deposits ($mm) Market Share (%) Branches 1 Atlantic Union Bankshares Corp. $15,725 19.0% 109 2 TowneBank 10,929 13.2 40 3 Capital One Financial Corp. 8,669 10.5 27 4 Carter Bank & Trust 3,341 4.0 54 5 Burke & Herbert Bank & Trust Co. 2,960 3.6 23 6 Primis Financial Corp 2,446 3.0 35 7 Blue Ridge Bankshares Inc. 2,317 2.8 26 8 First Bancorp Inc. 2,213 2.7 19 9 American National Bankshares, Inc. 2,046 2.5 18 10 C&F Financial Corp 2,028 2.5 30 Top 10 Banks $52,674 63.6% 381 All Institutions in Market $82,790 100.0% 809 Statewide Branch Footprint Brings Unique Franchise Value and Significant Growth Opportunity Growth Opportunity Franchise Strength |
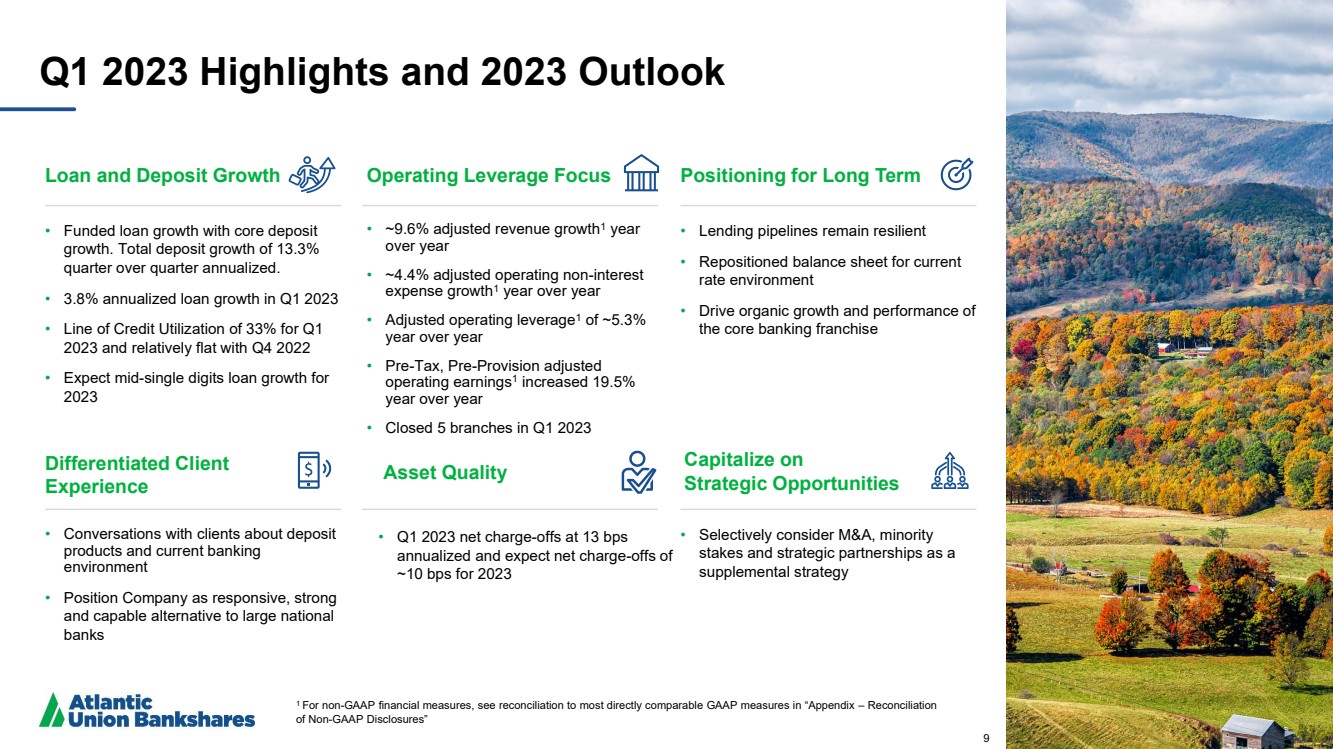
| 9 Q1 2023 Highlights and 2023 Outlook Loan and Deposit Growth • Funded loan growth with core deposit growth. Total deposit growth of 13.3% quarter over quarter annualized. • 3.8% annualized loan growth in Q1 2023 • Line of Credit Utilization of 33% for Q1 2023 and relatively flat with Q4 2022 • Expect mid-single digits loan growth for 2023 Asset Quality • Q1 2023 net charge-offs at 13 bps annualized and expect net charge-offs of ~10 bps for 2023 Positioning for Long Term • Lending pipelines remain resilient • Repositioned balance sheet for current rate environment • Drive organic growth and performance of the core banking franchise Differentiated Client Experience • Conversations with clients about deposit products and current banking environment • Position Company as responsive, strong and capable alternative to large national banks Operating Leverage Focus • ~9.6% adjusted revenue growth1 year over year • ~4.4% adjusted operating non-interest expense growth1 year over year • Adjusted operating leverage1 of ~5.3% year over year • Pre-Tax, Pre-Provision adjusted operating earnings1 increased 19.5% year over year • Closed 5 branches in Q1 2023 Capitalize on Strategic Opportunities • Selectively consider M&A, minority stakes and strategic partnerships as a supplemental strategy 9 1 For non-GAAP financial measures, see reconciliation to most directly comparable GAAP measures in “Appendix – Reconciliation of Non-GAAP Disclosures” |
| 10 5,370 5,362 5,291 4,883 4,578 4,121 3,943 4,354 4,187 4,714 4,151 3,956 3,962 3,923 3,548 1,167 1,166 1,174 1,131 1,048 1,675 1,644 1,744 1,801 2,190 0 58 21 7 378 Q1 2022 Q2 2022 Q3 2022 Q4 2022 Q1 2023 Demand Deposits Interest Checking Money Markets Savings Time Deposits Brokered Deposits Stable Deposit Balances 1Q23 Deposit Highlights • Total deposits up 13% annualized from Q4 2022 • Customer deposits up ~4% annualized from Q4 2022 • Mix shift into higher costing deposit products and higher deposit betas drove increased cost of deposits • Deposit betas expected to continue to rise throughout 2023 • From the start of the cycle through Q1 2023, deposit beta is 28% $ in millions $16,484 $16,129 $16,546 $15,932 $16,456 Numbers may not foot due to rounding. |

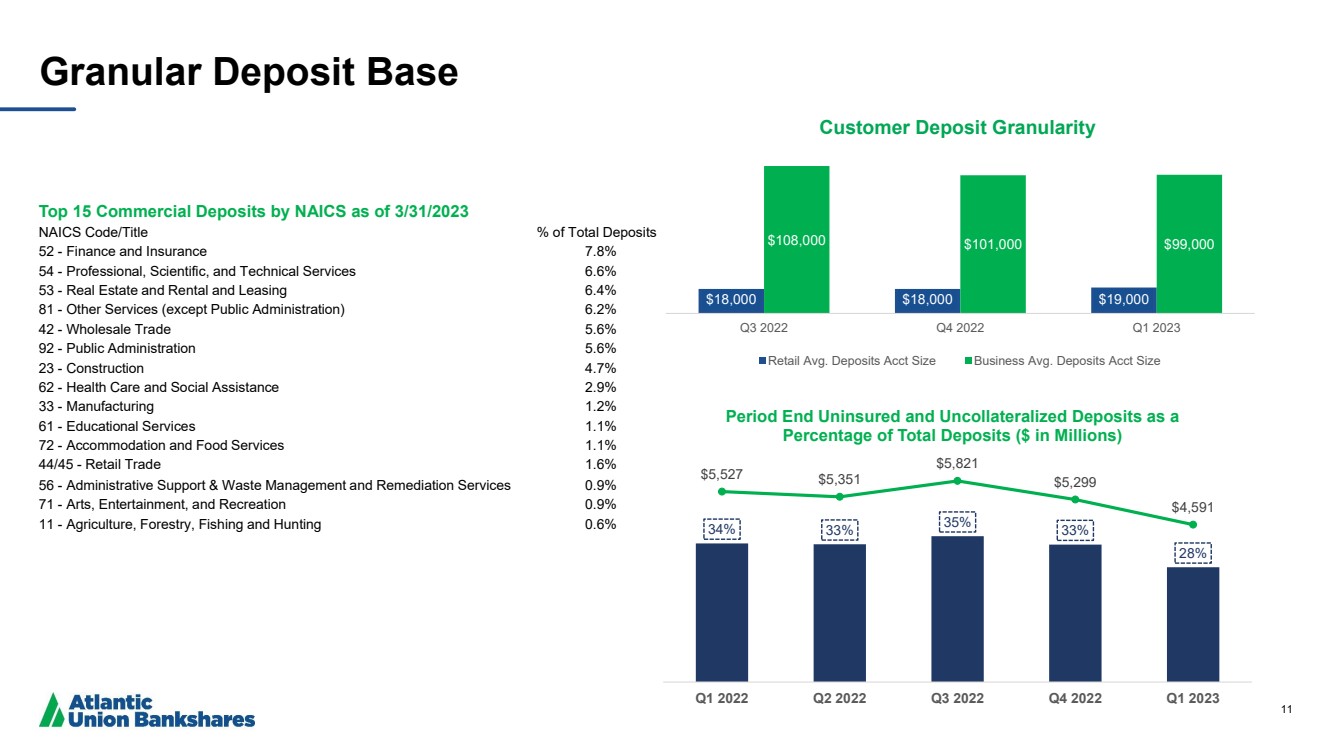
| 11 Granular Deposit Base 34% 33% 35% 33% 28% $5,527 $5,351 $5,821 $5,299 $4,591 Q1 2022 Q2 2022 Q3 2022 Q4 2022 Q1 2023 Period End Uninsured and Uncollateralized Deposits as a Percentage of Total Deposits ($ in Millions) Top 15 Commercial Deposits by NAICS as of 3/31/2023 NAICS Code/Title % of Total Deposits 52 - Finance and Insurance 7.8% 54 - Professional, Scientific, and Technical Services 6.6% 53 - Real Estate and Rental and Leasing 6.4% 81 - Other Services (except Public Administration) 6.2% 42 - Wholesale Trade 5.6% 92 - Public Administration 5.6% 23 - Construction 4.7% 62 - Health Care and Social Assistance 2.9% 33 - Manufacturing 1.2% 61 - Educational Services 1.1% 72 - Accommodation and Food Services 1.1% 44/45 - Retail Trade 1.6% 56 - Administrative Support & Waste Management and Remediation Services 0.9% 71 - Arts, Entertainment, and Recreation 0.9% 11 - Agriculture, Forestry, Fishing and Hunting 0.6% $18,000 $18,000 $19,000 $108,000 $101,000 $99,000 Q3 2022 Q4 2022 Q1 2023 Customer Deposit Granularity Retail Avg. Deposits Acct Size Business Avg. Deposits Acct Size |
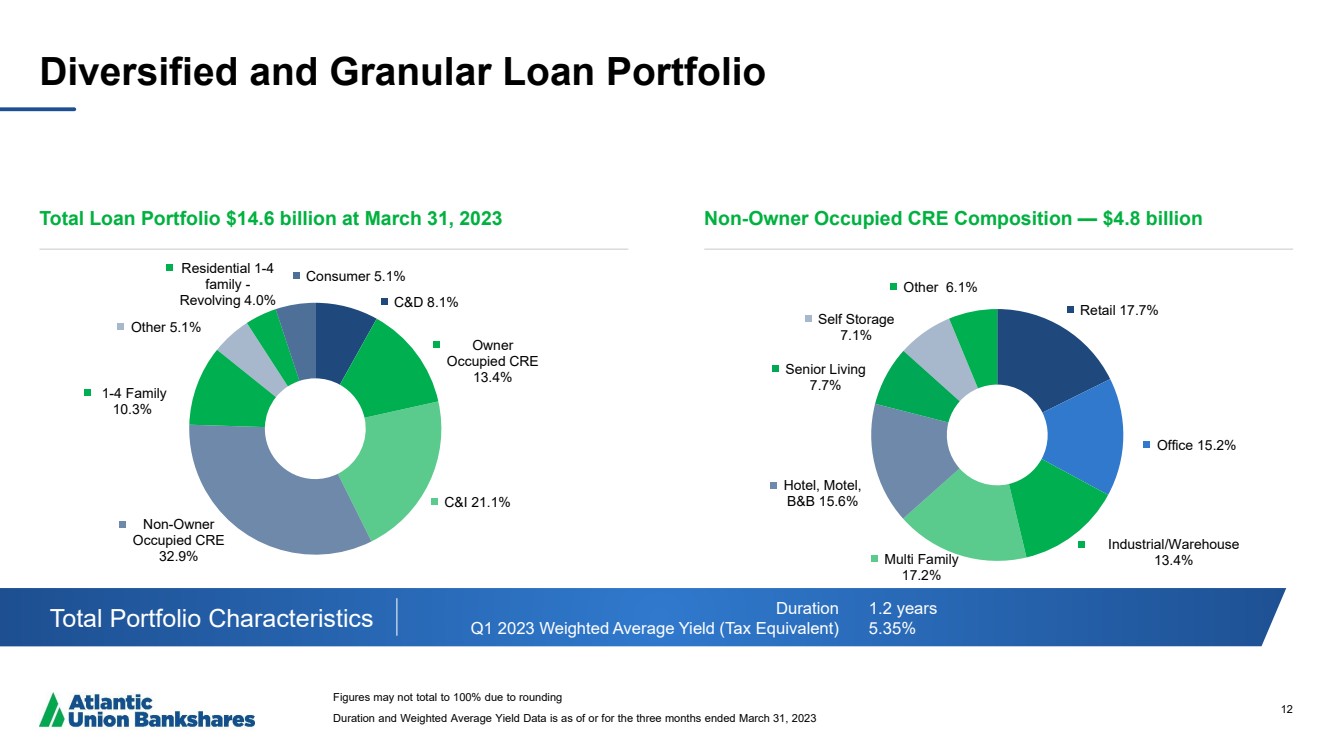
| 12 Diversified and Granular Loan Portfolio Total Loan Portfolio $14.6 billion at March 31, 2023 Non-Owner Occupied CRE Composition — $4.8 billion Total Portfolio Characteristics Duration Q1 2023 Weighted Average Yield (Tax Equivalent) 1.2 years 5.35% Figures may not total to 100% due to rounding Duration and Weighted Average Yield Data is as of or for the three months ended March 31, 2023 C&D 8.1% Owner Occupied CRE 13.4% C&I 21.1% Non-Owner Occupied CRE 32.9% 1-4 Family 10.3% Other 5.1% Residential 1-4 family - Revolving 4.0% Consumer 5.1% Retail 17.7% Office 15.2% Industrial/Warehouse Multi Family 13.4% 17.2% Hotel, Motel, B&B 15.6% Senior Living 7.7% Self Storage 7.1% Other 6.1% |
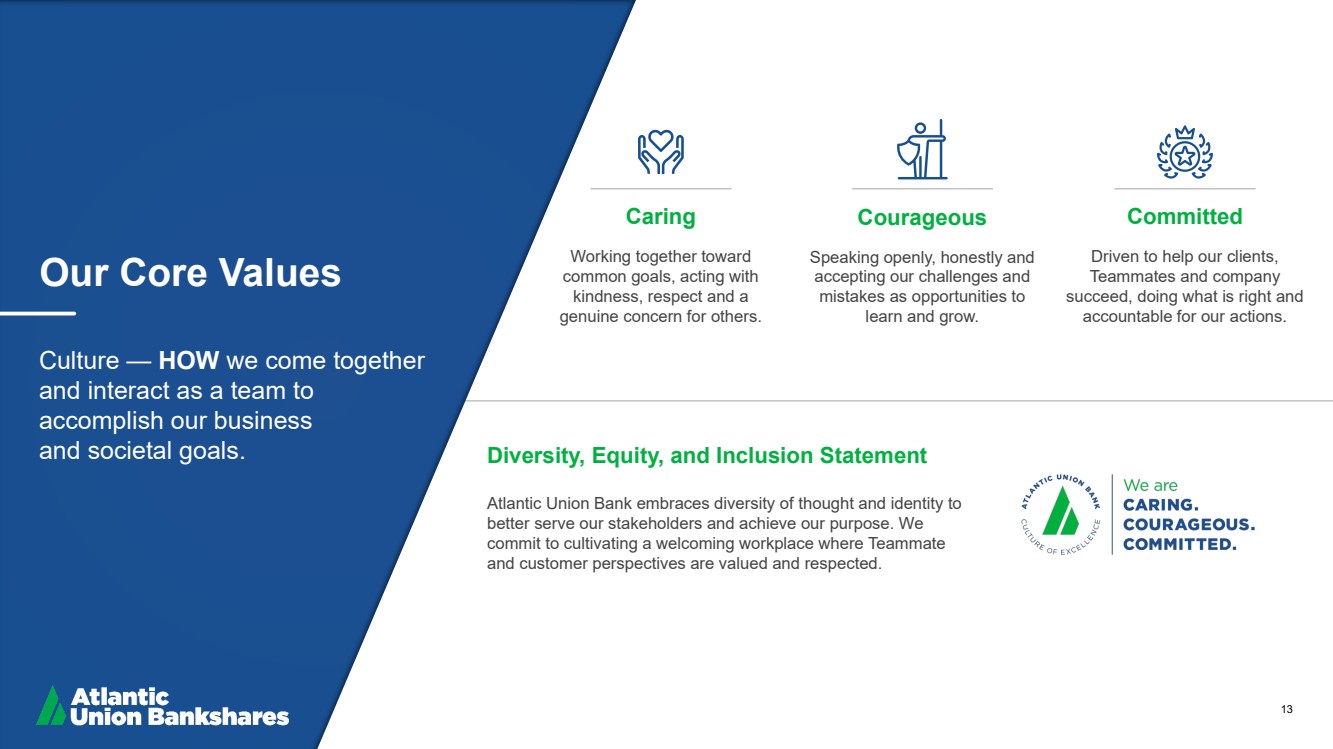
| 13 Caring Working together toward common goals, acting with kindness, respect and a genuine concern for others. Courageous Speaking openly, honestly and accepting our challenges and mistakes as opportunities to learn and grow. Committed Driven to help our clients, Teammates and company succeed, doing what is right and accountable for our actions. Our Core Values Culture — HOW we come together and interact as a team to accomplish our business and societal goals. Diversity, Equity, and Inclusion Statement Atlantic Union Bank embraces diversity of thought and identity to better serve our stakeholders and achieve our purpose. We commit to cultivating a welcoming workplace where Teammate and customer perspectives are valued and respected. |
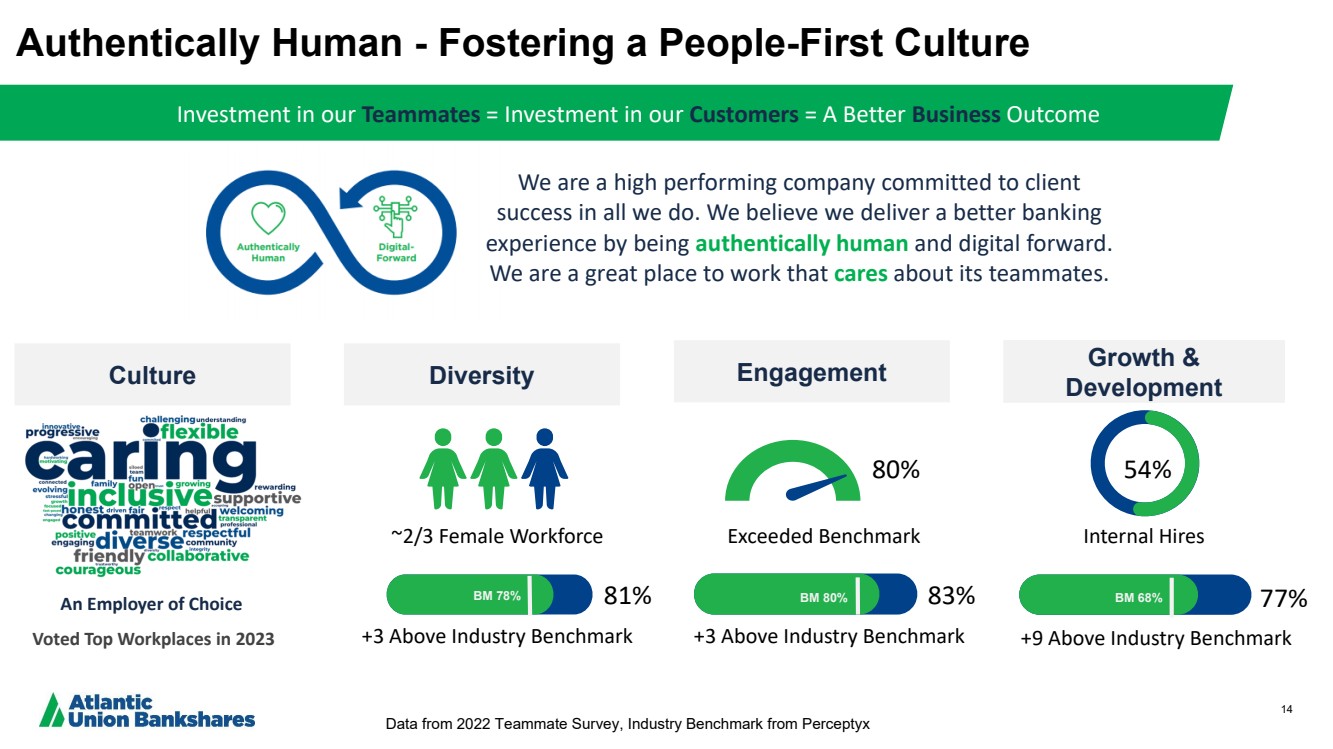
| 14 81% Authentically Human - Fostering a People-First Culture Engagement Growth & Development ~2/3 Female Workforce Exceeded Benchmark Internal Hires 80% +3 Above Industry Benchmark +3 Above Industry Benchmark +9 Above Industry Benchmark An Employer of Choice Voted Top Workplaces in 2023 Investment in our Teammates = Investment in our Customers = A Better Business Outcome Culture Diversity We are a high performing company committed to client success in all we do. We believe we deliver a better banking experience by being authentically human and digital forward. We are a great place to work that cares about its teammates. BM 78% BM 80% 83% BM 68% 77% 54% Data from 2022 Teammate Survey, Industry Benchmark from Perceptyx |
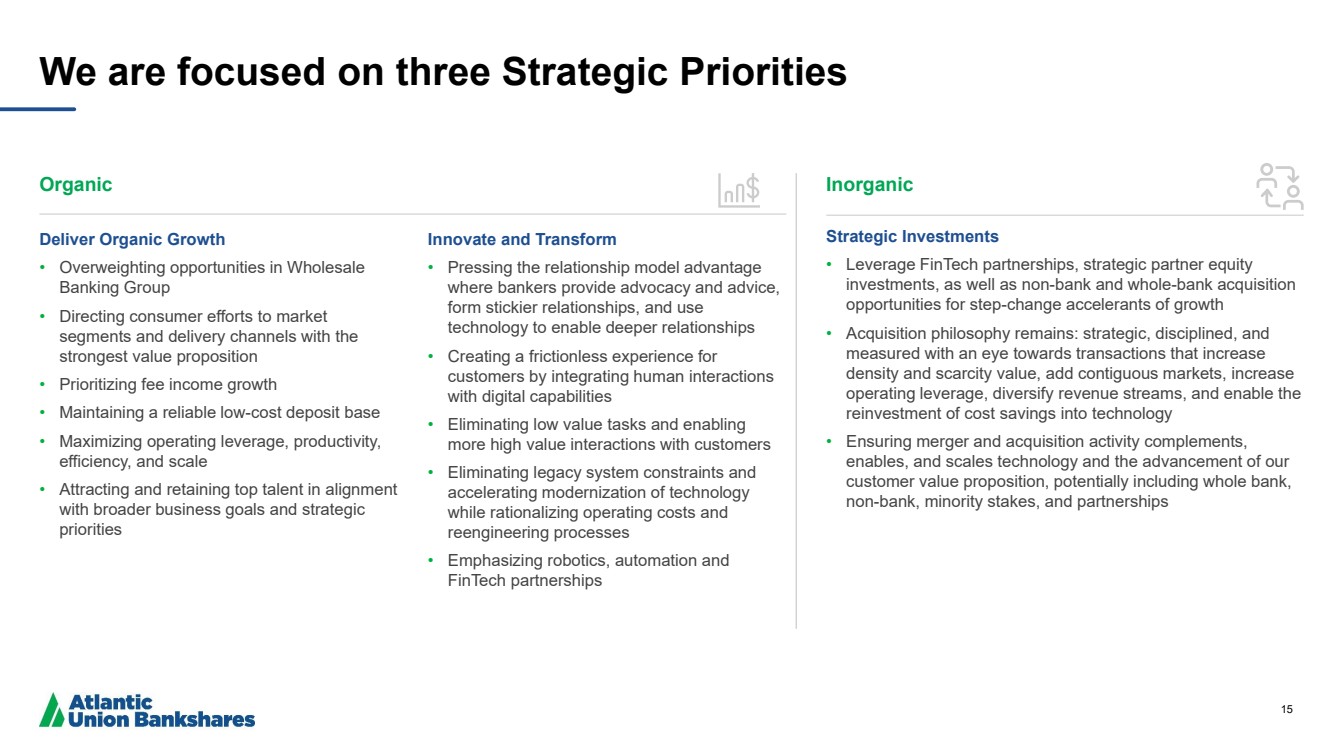
| 15 We are focused on three Strategic Priorities Organic Deliver Organic Growth • Overweighting opportunities in Wholesale Banking Group • Directing consumer efforts to market segments and delivery channels with the strongest value proposition • Prioritizing fee income growth • Maintaining a reliable low-cost deposit base • Maximizing operating leverage, productivity, efficiency, and scale • Attracting and retaining top talent in alignment with broader business goals and strategic priorities Innovate and Transform • Pressing the relationship model advantage where bankers provide advocacy and advice, form stickier relationships, and use technology to enable deeper relationships • Creating a frictionless experience for customers by integrating human interactions with digital capabilities • Eliminating low value tasks and enabling more high value interactions with customers • Eliminating legacy system constraints and accelerating modernization of technology while rationalizing operating costs and reengineering processes • Emphasizing robotics, automation and FinTech partnerships Inorganic Strategic Investments • Leverage FinTech partnerships, strategic partner equity investments, as well as non-bank and whole-bank acquisition opportunities for step-change accelerants of growth • Acquisition philosophy remains: strategic, disciplined, and measured with an eye towards transactions that increase density and scarcity value, add contiguous markets, increase operating leverage, diversify revenue streams, and enable the reinvestment of cost savings into technology • Ensuring merger and acquisition activity complements, enables, and scales technology and the advancement of our customer value proposition, potentially including whole bank, non-bank, minority stakes, and partnerships |
| 16 16 Maria Tedesco President and Chief Operating Officer |

| 17 Recent accolades |
| 18 Modernization of Atlantic Union Bank We are a union of multiple community banks that have come together over time. With that comes a level of customer-centricity and a sense of community that makes Atlantic Union Bank a very special place. However, the industry is evolving and our customers’ expectations are changing just as rapidly. We must create a modern AUB, and keep it modern as we grow and as customer expectations continue to evolve. |
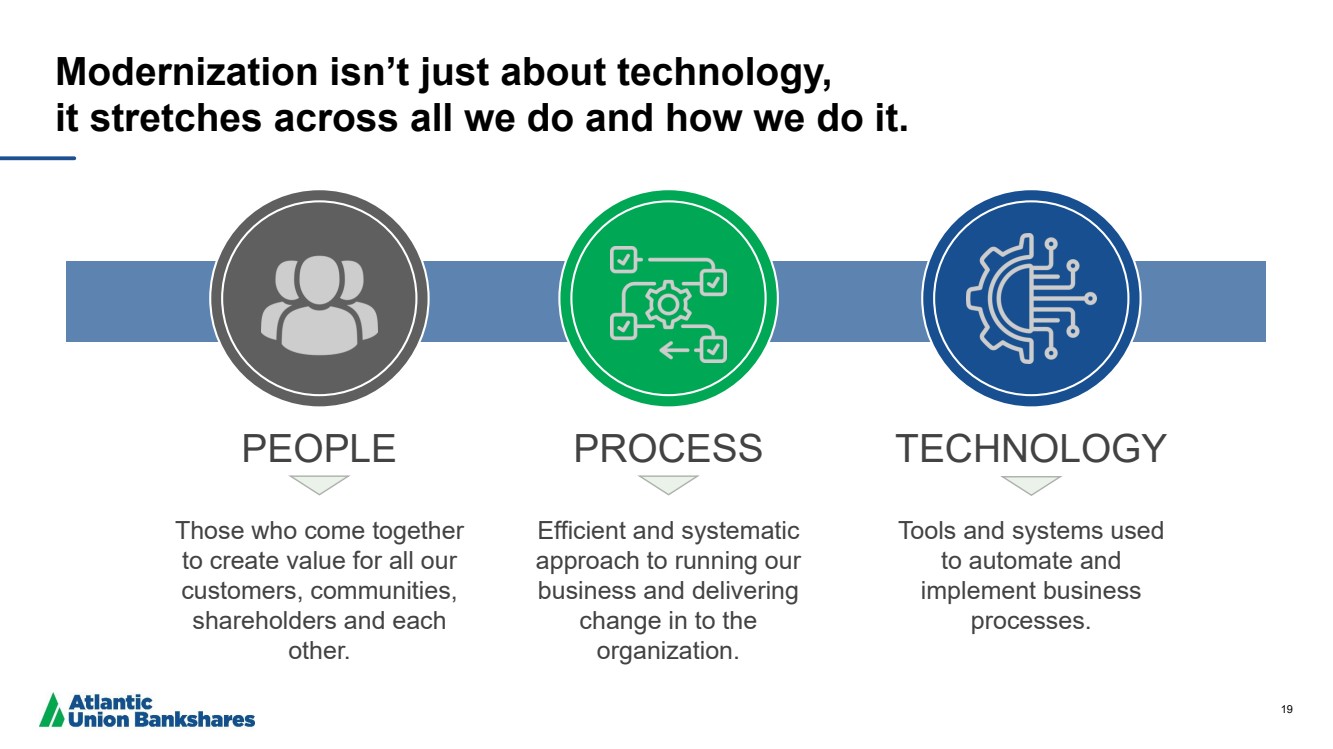
| 19 Modernization isn’t just about technology, it stretches across all we do and how we do it. PEOPLE PROCESS TECHNOLOGY Those who come together to create value for all our customers, communities, shareholders and each other. Efficient and systematic approach to running our business and delivering change in to the organization. Tools and systems used to automate and implement business processes. |
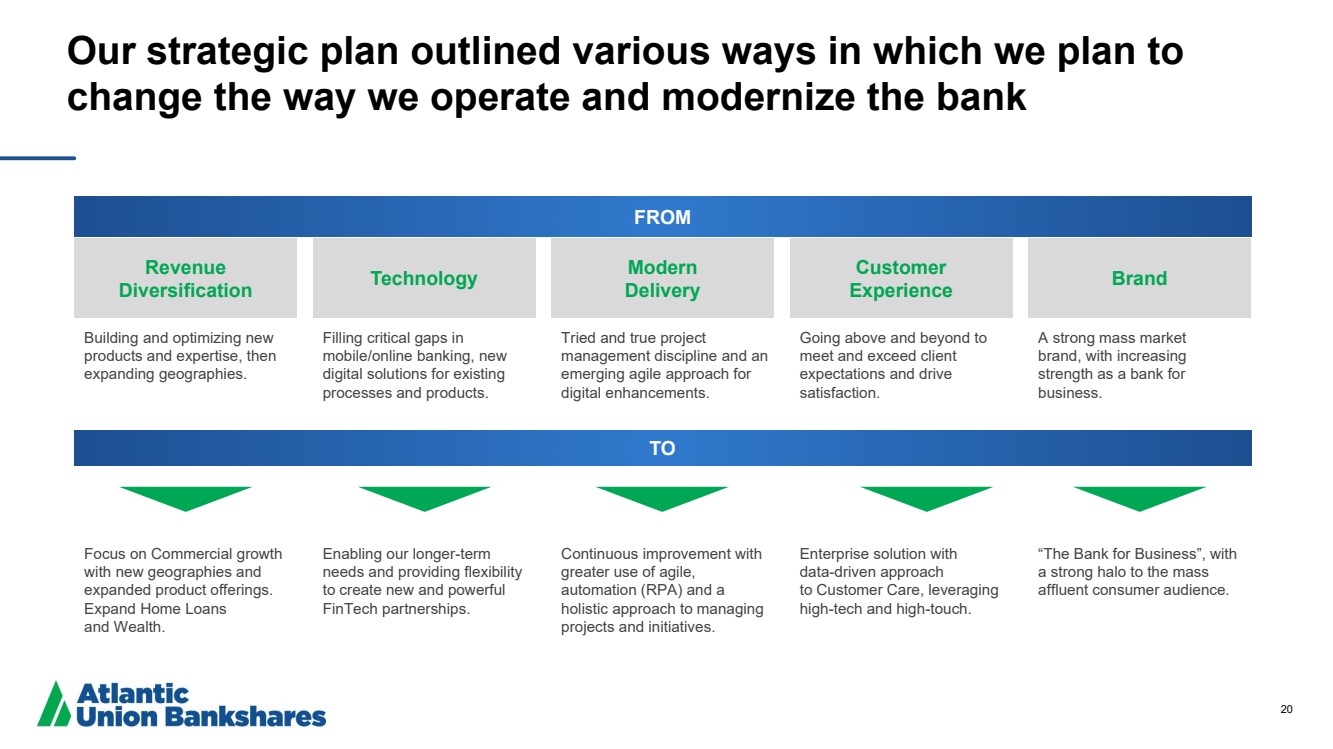
| 20 Our strategic plan outlined various ways in which we plan to change the way we operate and modernize the bank Building and optimizing new products and expertise, then expanding geographies. Going above and beyond to meet and exceed client expectations and drive satisfaction. A strong mass market brand, with increasing strength as a bank for business. Focus on Commercial growth with new geographies and expanded product offerings. Expand Home Loans and Wealth. Enterprise solution with data-driven approach to Customer Care, leveraging high-tech and high-touch. “The Bank for Business”, with a strong halo to the mass affluent consumer audience. FROM TO Revenue Diversification Technology Modern Delivery Customer Experience Brand Filling critical gaps in mobile/online banking, new digital solutions for existing processes and products. Enabling our longer-term needs and providing flexibility to create new and powerful FinTech partnerships. Tried and true project management discipline and an emerging agile approach for digital enhancements. Continuous improvement with greater use of agile, automation (RPA) and a holistic approach to managing projects and initiatives. |
| 21 21 Rob Gorman Chief Financial Officer |

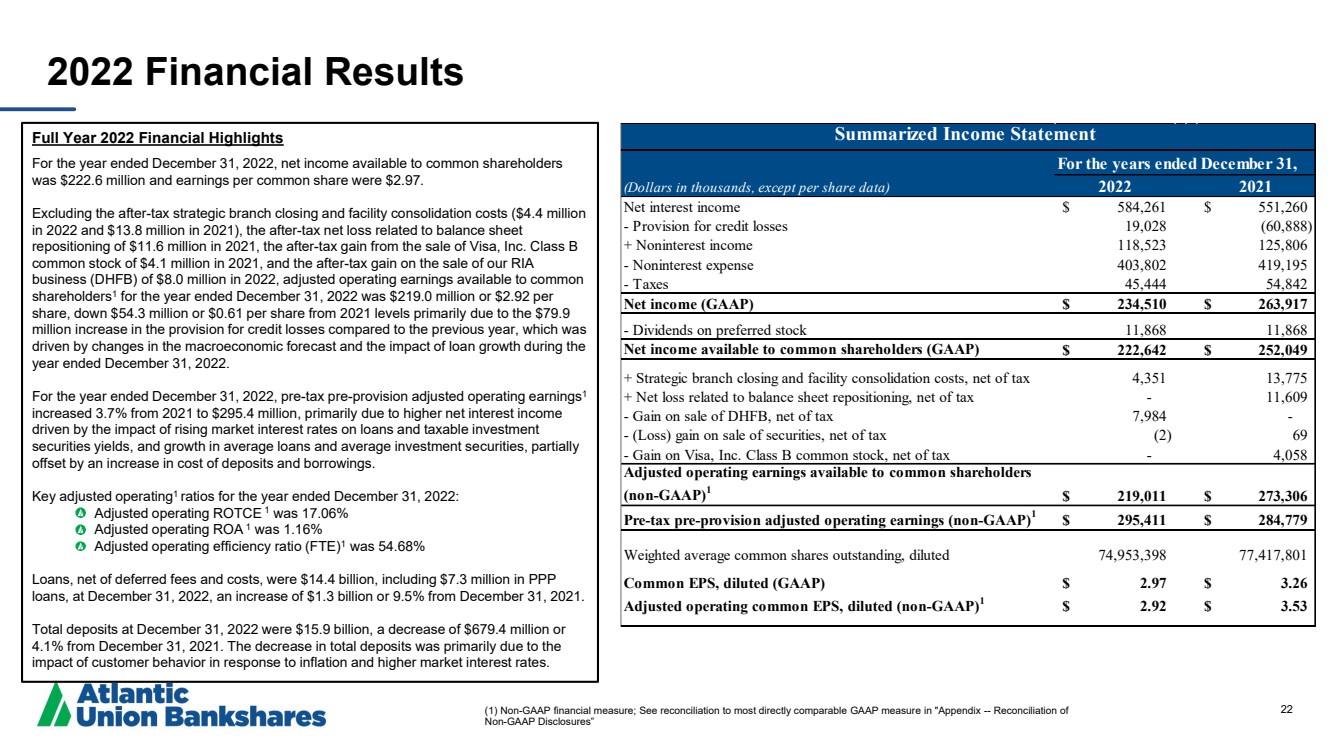
| 22 2022 Financial Results Full Year 2022 Financial Highlights For the year ended December 31, 2022, net income available to common shareholders was $222.6 million and earnings per common share were $2.97. Excluding the after-tax strategic branch closing and facility consolidation costs ($4.4 million in 2022 and $13.8 million in 2021), the after-tax net loss related to balance sheet repositioning of $11.6 million in 2021, the after-tax gain from the sale of Visa, Inc. Class B common stock of $4.1 million in 2021, and the after-tax gain on the sale of our RIA business (DHFB) of $8.0 million in 2022, adjusted operating earnings available to common shareholders1 for the year ended December 31, 2022 was $219.0 million or $2.92 per share, down $54.3 million or $0.61 per share from 2021 levels primarily due to the $79.9 million increase in the provision for credit losses compared to the previous year, which was driven by changes in the macroeconomic forecast and the impact of loan growth during the year ended December 31, 2022. For the year ended December 31, 2022, pre-tax pre-provision adjusted operating earnings1 increased 3.7% from 2021 to $295.4 million, primarily due to higher net interest income driven by the impact of rising market interest rates on loans and taxable investment securities yields, and growth in average loans and average investment securities, partially offset by an increase in cost of deposits and borrowings. Key adjusted operating1 ratios for the year ended December 31, 2022: Adjusted operating ROTCE 1 was 17.06% Adjusted operating ROA 1 was 1.16% Adjusted operating efficiency ratio (FTE)1 was 54.68% Loans, net of deferred fees and costs, were $14.4 billion, including $7.3 million in PPP loans, at December 31, 2022, an increase of $1.3 billion or 9.5% from December 31, 2021. Total deposits at December 31, 2022 were $15.9 billion, a decrease of $679.4 million or 4.1% from December 31, 2021. The decrease in total deposits was primarily due to the impact of customer behavior in response to inflation and higher market interest rates. (1) Non-GAAP financial measure; See reconciliation to most directly comparable GAAP measure in "Appendix -- Reconciliation of Non-GAAP Disclosures” For the years ended December 31, (Dollars in thousands, except per share data) 2022 2021 Net interest income $ 584,261 $ 551,260 - Provision for credit losses 19,028 (60,888) + Noninterest income 118,523 125,806 - Noninterest expense 403,802 419,195 - Taxes 45,444 54,842 Net income (GAAP) $ 234,510 $ 263,917 - Dividends on preferred stock 11,868 11,868 Net income available to common shareholders (GAAP) $ 222,642 $ 252,049 + Strategic branch closing and facility consolidation costs, net of tax 4,351 13,775 + Net loss related to balance sheet repositioning, net of tax - 11,609 - Gain on sale of DHFB, net of tax 7,984 - - (Loss) gain on sale of securities, net of tax (2) 69 - Gain on Visa, Inc. Class B common stock, net of tax - 4,058 Adjusted operating earnings available to common shareholders (non-GAAP)1 $ 219,011 $ 273,306 Pre-tax pre-provision adjusted operating earnings (non-GAAP)1 $ 295,411 $ 284,779 Weighted average common shares outstanding, diluted 74,953,398 77,417,801 Common EPS, diluted (GAAP) $ 2.97 $ 3.26 Adjusted operating common EPS, diluted (non-GAAP)1 $ 2.92 $ 3.53 Summarized Income Statement |
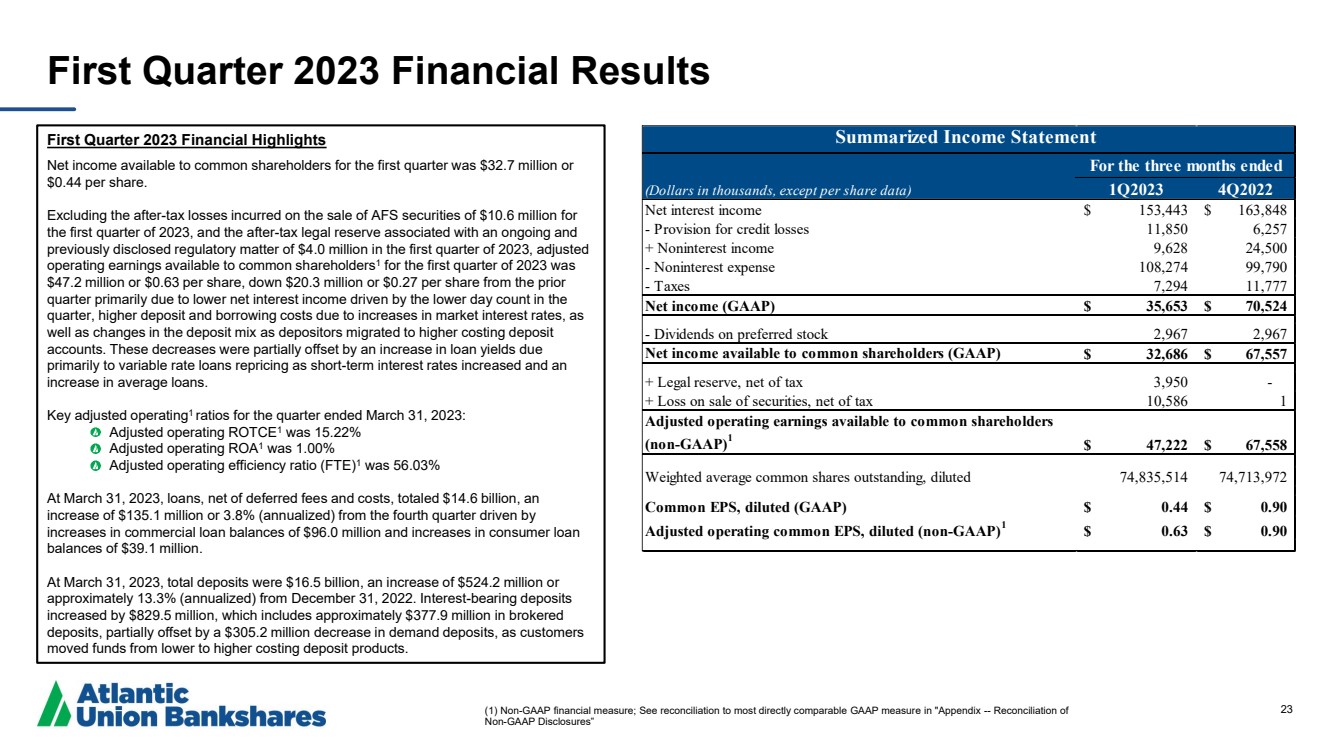
| 23 First Quarter 2023 Financial Highlights Net income available to common shareholders for the first quarter was $32.7 million or $0.44 per share. Excluding the after-tax losses incurred on the sale of AFS securities of $10.6 million for the first quarter of 2023, and the after-tax legal reserve associated with an ongoing and previously disclosed regulatory matter of $4.0 million in the first quarter of 2023, adjusted operating earnings available to common shareholders1 for the first quarter of 2023 was $47.2 million or $0.63 per share, down $20.3 million or $0.27 per share from the prior quarter primarily due to lower net interest income driven by the lower day count in the quarter, higher deposit and borrowing costs due to increases in market interest rates, as well as changes in the deposit mix as depositors migrated to higher costing deposit accounts. These decreases were partially offset by an increase in loan yields due primarily to variable rate loans repricing as short-term interest rates increased and an increase in average loans. Key adjusted operating1 ratios for the quarter ended March 31, 2023: Adjusted operating ROTCE1 was 15.22% Adjusted operating ROA1 was 1.00% Adjusted operating efficiency ratio (FTE)1 was 56.03% At March 31, 2023, loans, net of deferred fees and costs, totaled $14.6 billion, an increase of $135.1 million or 3.8% (annualized) from the fourth quarter driven by increases in commercial loan balances of $96.0 million and increases in consumer loan balances of $39.1 million. At March 31, 2023, total deposits were $16.5 billion, an increase of $524.2 million or approximately 13.3% (annualized) from December 31, 2022. Interest-bearing deposits increased by $829.5 million, which includes approximately $377.9 million in brokered deposits, partially offset by a $305.2 million decrease in demand deposits, as customers moved funds from lower to higher costing deposit products. First Quarter 2023 Financial Results (1) Non-GAAP financial measure; See reconciliation to most directly comparable GAAP measure in "Appendix -- Reconciliation of Non-GAAP Disclosures” (Dollars in thousands, except per share data) 1Q2023 4Q2022 Net interest income $ 153,443 $ 163,848 - Provision for credit losses 11,850 6,257 + Noninterest income 9,628 24,500 - Noninterest expense 108,274 99,790 - Taxes 7,294 11,777 Net income (GAAP) $ 35,653 $ 70,524 - Dividends on preferred stock 2,967 2,967 Net income available to common shareholders (GAAP) $ 32,686 $ 67,557 + Legal reserve, net of tax 3,950 - + Loss on sale of securities, net of tax 10,586 1 Adjusted operating earnings available to common shareholders (non-GAAP)1 $ 47,222 $ 67,558 Weighted average common shares outstanding, diluted 74,835,514 74,713,972 Common EPS, diluted (GAAP) $ 0.44 $ 0.90 Adjusted operating common EPS, diluted (non-GAAP)1 $ 0.63 $ 0.90 For the three months ended Summarized Income Statement |
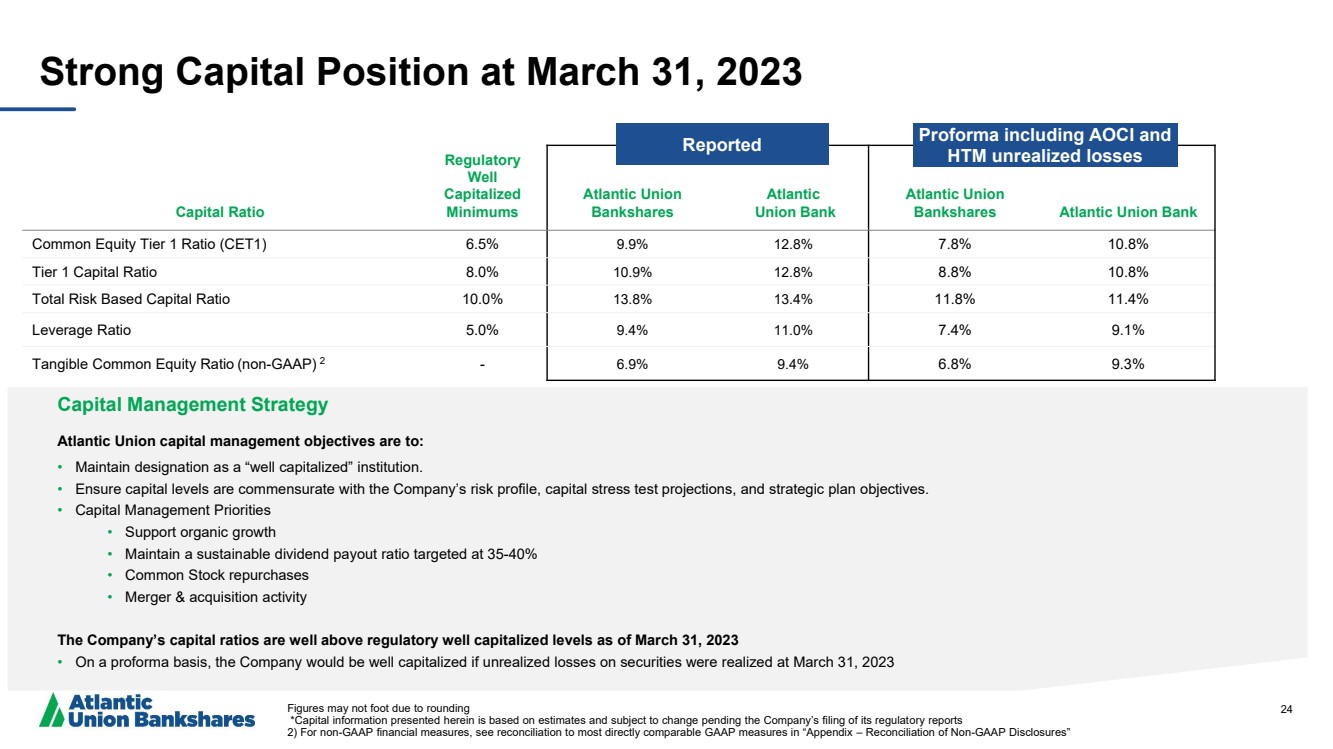
| 24 Capital Ratio Regulatory Well Capitalized Minimums Atlantic Union Bankshares Atlantic Union Bank Atlantic Union Bankshares Atlantic Union Bank Common Equity Tier 1 Ratio (CET1) 6.5% 9.9% 12.8% 7.8% 10.8% Tier 1 Capital Ratio 8.0% 10.9% 12.8% 8.8% 10.8% Total Risk Based Capital Ratio 10.0% 13.8% 13.4% 11.8% 11.4% Leverage Ratio 5.0% 9.4% 11.0% 7.4% 9.1% Tangible Common Equity Ratio (non-GAAP) 2 - 6.9% 9.4% 6.8% 9.3% Strong Capital Position at March 31, 2023 Figures may not foot due to rounding *Capital information presented herein is based on estimates and subject to change pending the Company’s filing of its regulatory reports 2) For non-GAAP financial measures, see reconciliation to most directly comparable GAAP measures in “Appendix – Reconciliation of Non-GAAP Disclosures” Capital Management Strategy Atlantic Union capital management objectives are to: • Maintain designation as a “well capitalized” institution. • Ensure capital levels are commensurate with the Company’s risk profile, capital stress test projections, and strategic plan objectives. • Capital Management Priorities • Support organic growth • Maintain a sustainable dividend payout ratio targeted at 35-40% • Common Stock repurchases • Merger & acquisition activity The Company’s capital ratios are well above regulatory well capitalized levels as of March 31, 2023 • On a proforma basis, the Company would be well capitalized if unrealized losses on securities were realized at March 31, 2023 Reported Proforma including AOCI and HTM unrealized losses |
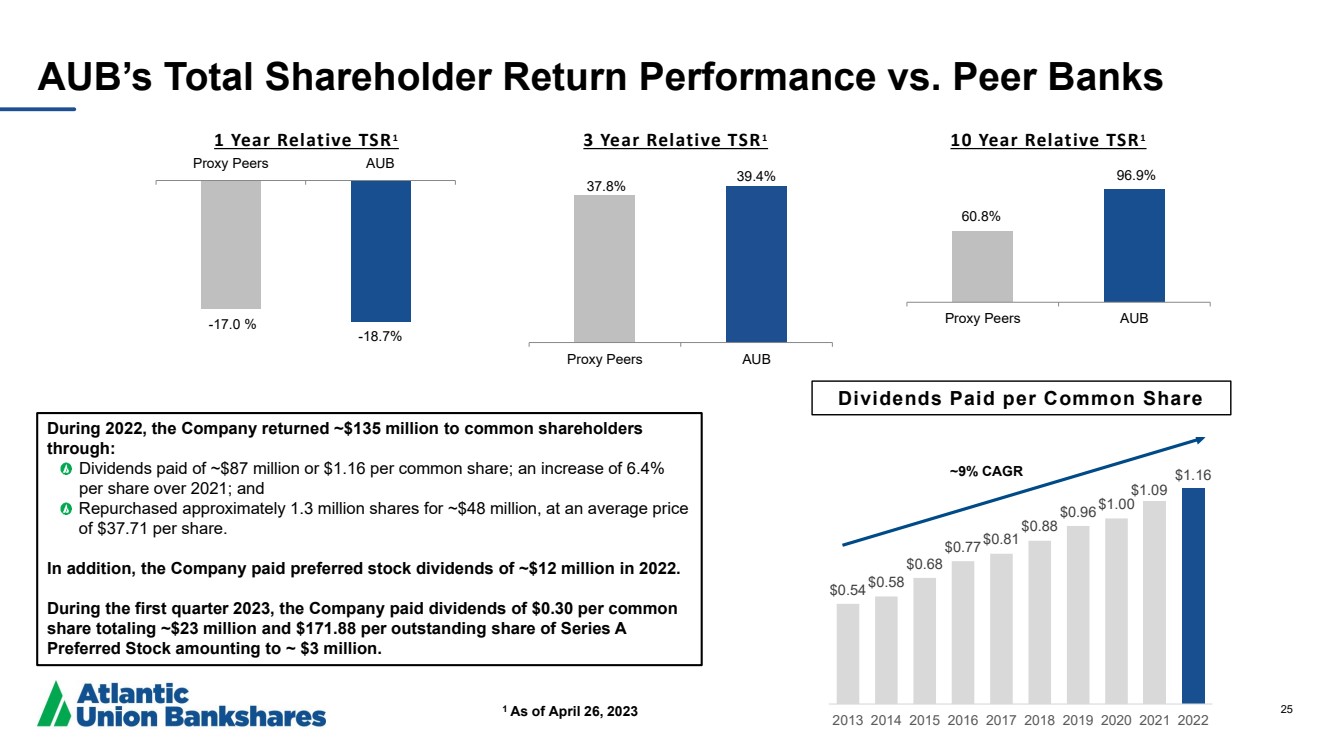
| 25 $0.54$0.58 $0.68 $0.77$0.81 $0.88 $0.96 $1.00 $1.09 $1.16 2013 2014 2015 2016 2017 2018 2019 2020 2021 2022 37.8% 39.4% Proxy Peers AUB 3 Year Relative TSR1 1 As of April 26, 2023 1 Year Relative TSR1 -17.0 % -18.7% Proxy Peers AUB 60.8% 96.9% Proxy Peers AUB 10 Year Relative TSR1 Dividends Paid per Common Share ~9% CAGR AUB’s Total Shareholder Return Performance vs. Peer Banks During 2022, the Company returned ~$135 million to common shareholders through: Dividends paid of ~$87 million or $1.16 per common share; an increase of 6.4% per share over 2021; and Repurchased approximately 1.3 million shares for ~$48 million, at an average price of $37.71 per share. In addition, the Company paid preferred stock dividends of ~$12 million in 2022. During the first quarter 2023, the Company paid dividends of $0.30 per common share totaling ~$23 million and $171.88 per outstanding share of Series A Preferred Stock amounting to ~ $3 million. |
| 26 Appendix |

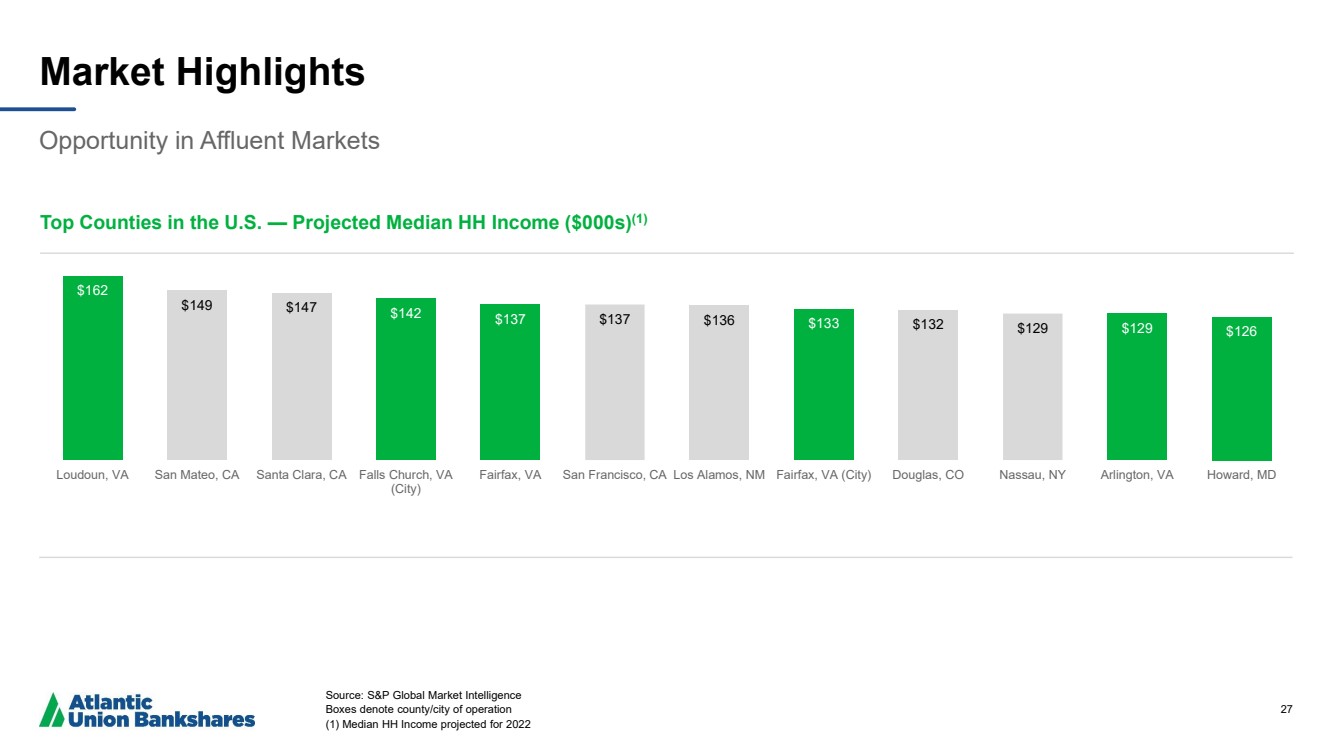
| 27 Market Highlights Opportunity in Affluent Markets Source: S&P Global Market Intelligence Boxes denote county/city of operation (1) Median HH Income projected for 2022 Top Counties in the U.S. — Projected Median HH Income ($000s)(1) $162 $149 $147 $142 $137 $137 $136 $133 $132 $129 $129 $126 Loudoun, VA San Mateo, CA Santa Clara, CA Falls Church, VA (City) Fairfax, VA San Francisco, CA Los Alamos, NM Fairfax, VA (City) Douglas, CO Nassau, NY Arlington, VA Howard, MD |
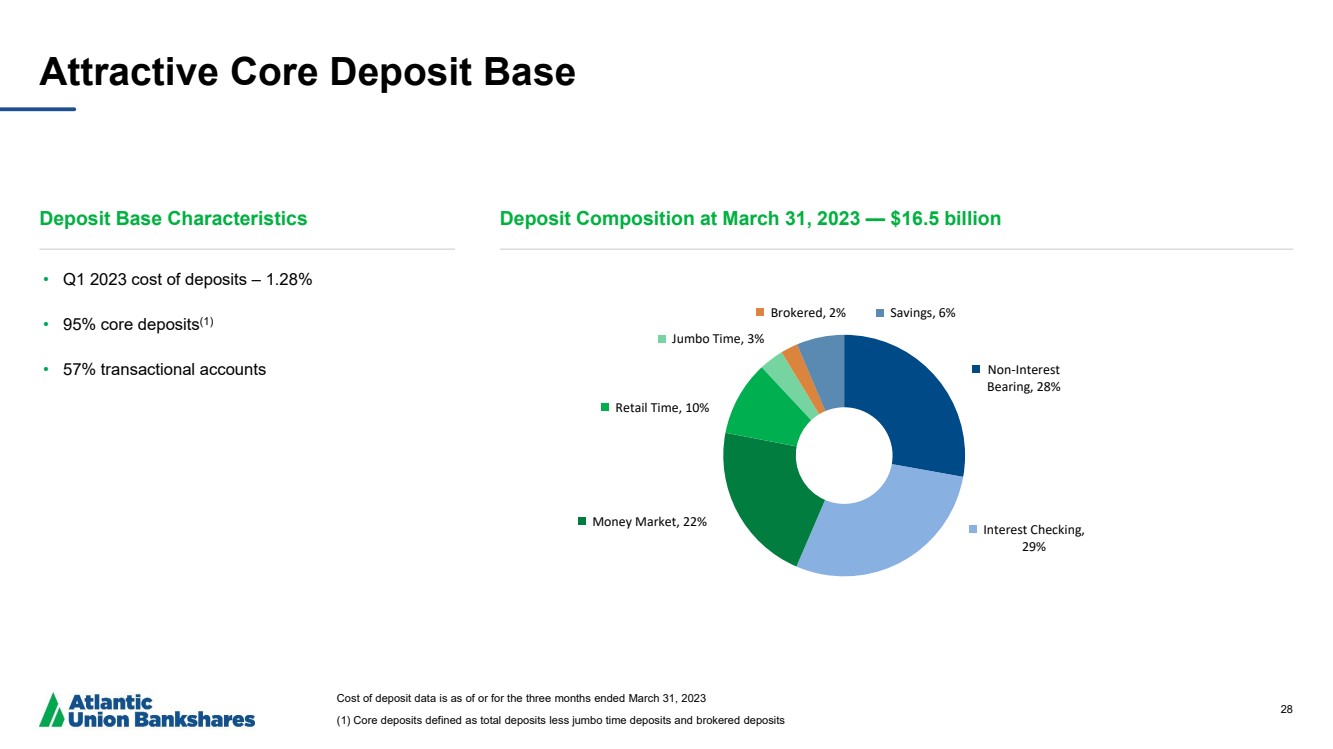
| 28 Attractive Core Deposit Base Deposit Base Characteristics Deposit Composition at March 31, 2023 — $16.5 billion Cost of deposit data is as of or for the three months ended March 31, 2023 (1) Core deposits defined as total deposits less jumbo time deposits and brokered deposits • Q1 2023 cost of deposits – 1.28% • 95% core deposits(1) • 57% transactional accounts Non-Interest Bearing, 28% Interest Checking, 29% Money Market, 22% Retail Time, 10% Jumbo Time, 3% Brokered, 2% Savings, 6% |
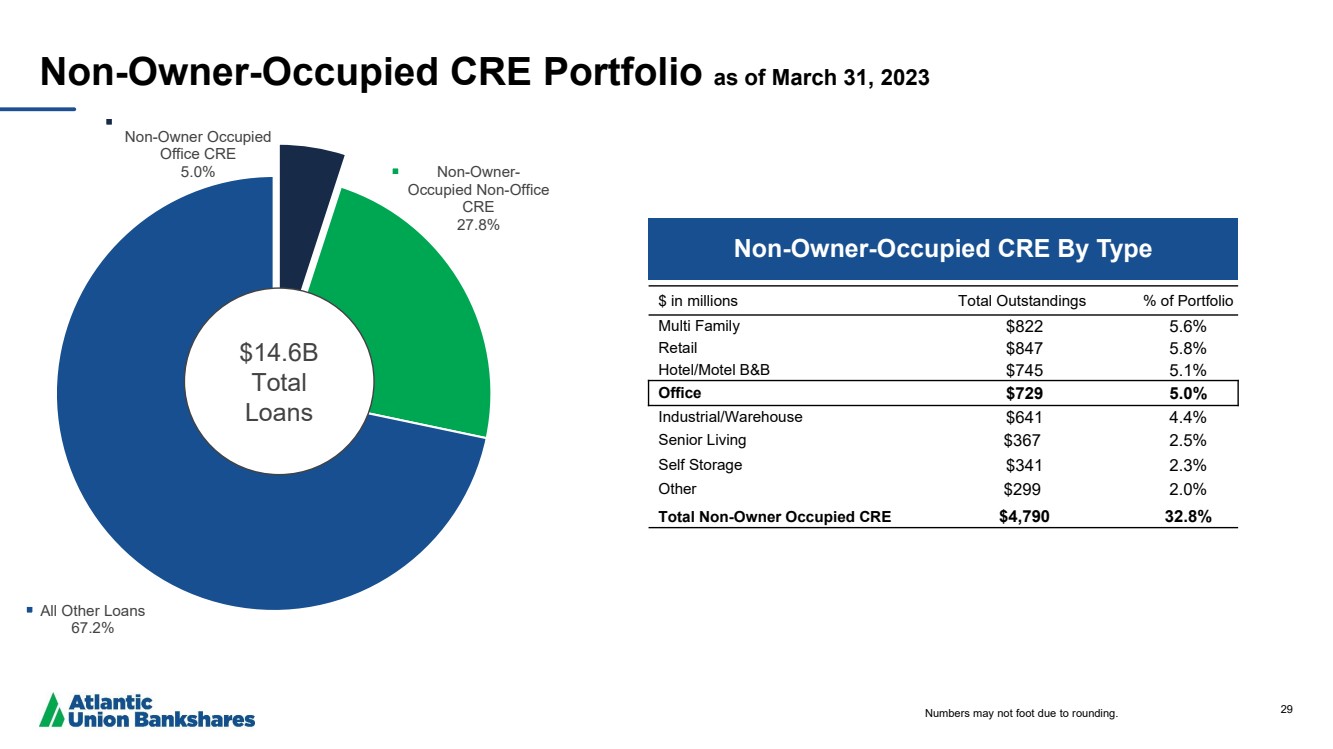
| 29 Non-Owner-Occupied CRE Portfolio as of March 31, 2023 $ in millions Total Outstandings % of Portfolio Multi Family $822 5.6% Retail $847 5.8% Hotel/Motel B&B $745 5.1% Office $729 5.0% Industrial/Warehouse $641 4.4% Senior Living $367 2.5% Self Storage $341 2.3% Other $299 2.0% Total Non-Owner Occupied CRE $4,790 32.8% Non-Owner Occupied Office CRE 5.0% Non-Owner-Occupied Non-Office CRE 27.8% All Other Loans 67.2% $14.6B Total Loans Non-Owner-Occupied CRE By Type Numbers may not foot due to rounding. |
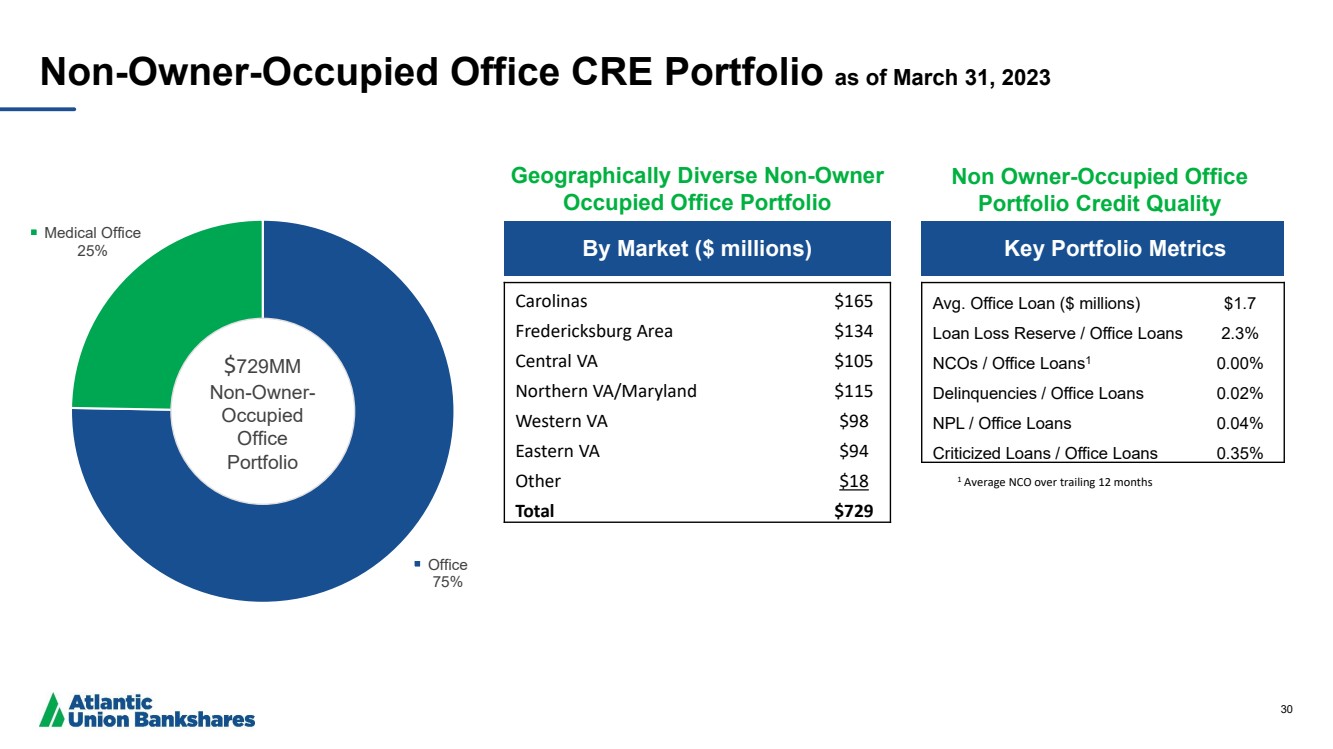
| 30 Office 75% Medical Office 25% By Market ($ millions) Key Portfolio Metrics Carolinas $165 Fredericksburg Area $134 Central VA $105 Northern VA/Maryland $115 Western VA $98 Eastern VA $94 Other $18 Total $729 Avg. Office Loan ($ millions) $1.7 Loan Loss Reserve / Office Loans 2.3% NCOs / Office Loans1 0.00% Delinquencies / Office Loans 0.02% NPL / Office Loans 0.04% Criticized Loans / Office Loans 0.35% Non-Owner-Occupied Office CRE Portfolio as of March 31, 2023 $729MM Non-Owner-Occupied Office Portfolio Non Owner-Occupied Office Portfolio Credit Quality Geographically Diverse Non-Owner Occupied Office Portfolio 1 Average NCO over trailing 12 months |
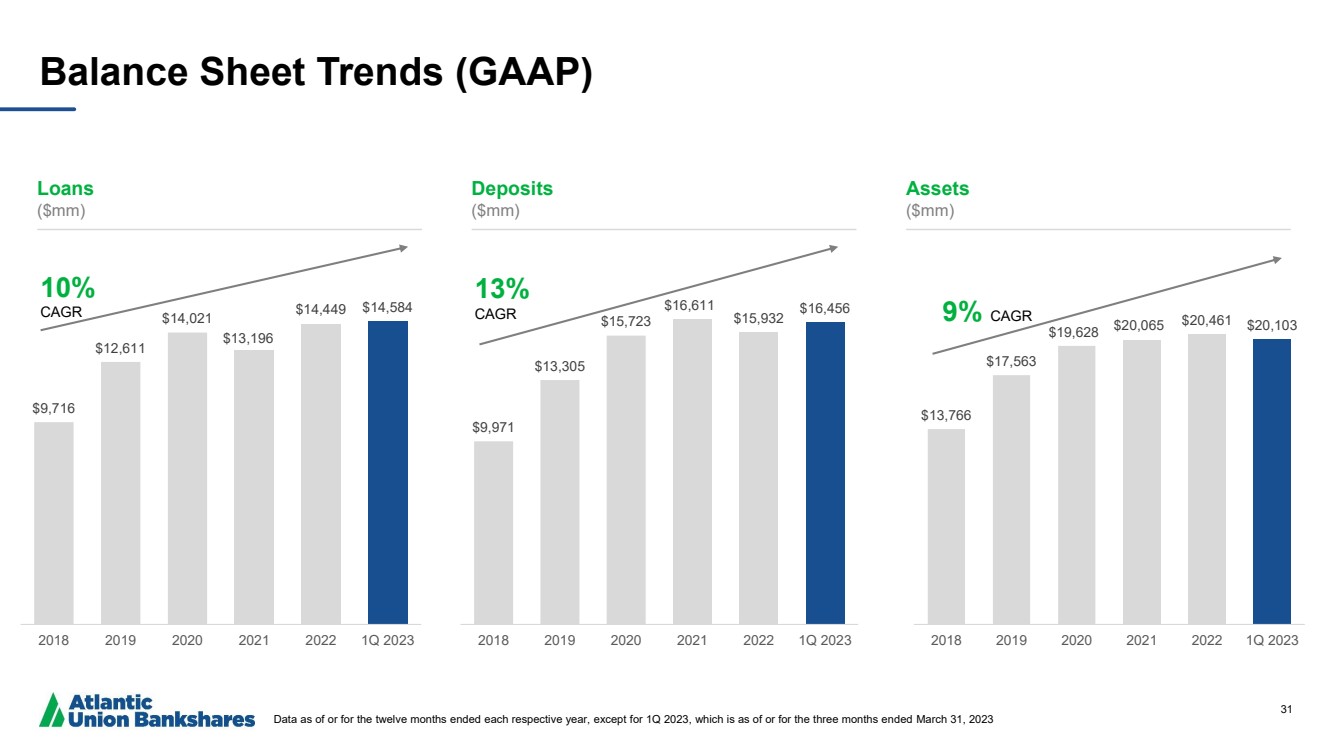
| 31 $9,971 $13,305 $15,723 $16,611 $15,932 $16,456 2018 2019 2020 2021 2022 1Q 2023 13% CAGR Balance Sheet Trends (GAAP) Data as of or for the twelve months ended each respective year, except for 1Q 2023, which is as of or for the three months ended March 31, 2023 Loans ($mm) Deposits ($mm) Assets ($mm) $9,716 $12,611 $14,021 $13,196 $14,449 $14,584 2018 2019 2020 2021 2022 1Q 2023 10% CAGR $13,766 $17,563 $19,628 $20,065 $20,461 $20,103 2018 2019 2020 2021 2022 1Q 2023 9% CAGR |
| 32 Reconciliation of Non-GAAP Disclosures The Company has provided supplemental performance measures on a tax-equivalent, tangible, operating, adjusted, or pre-tax pre-provision basis. These non-GAAP financial measures are a supplement to GAAP, which is used to prepare the Company’s financial statements, and should not be considered in isolation or as a substitute for comparable measures calculated in accordance with GAAP. In addition, the Company’s non-GAAP financial measures may not be comparable to non-GAAP financial measures of other companies. The Company uses the non-GAAP financial measures discussed herein in its analysis of the Company’s performance. The Company’s management believes that these non-GAAP financial measures provide additional understanding of ongoing operations, enhance comparability of results of operations with prior periods and show the effects of significant gains and charges in the periods presented without the impact of items or events that may obscure trends in the Company’s underlying performance. |
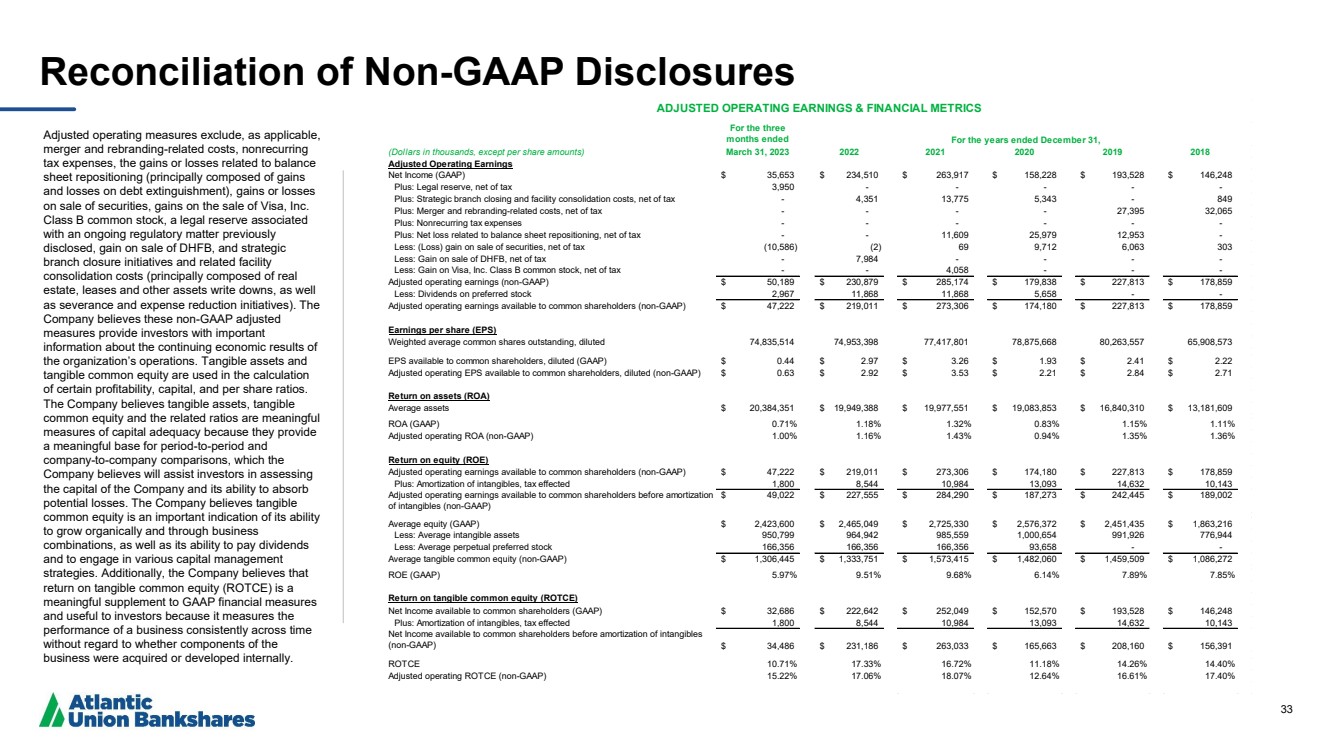
| 33 Reconciliation of Non -GAAP Disclosures Adjusted operating measures exclude, as applicable, merger and rebranding -related costs, nonrecurring tax expenses, the gains or losses related to balance sheet repositioning (principally composed of gains and losses on debt extinguishment), gains or losses on sale of securities, gains on the sale of Visa, Inc. Class B common stock, a legal reserve associated with an ongoing regulatory matter previously disclosed, gain on sale of DHFB, and strategic branch closure initiatives and related facility consolidation costs (principally composed of real estate, leases and other assets write downs, as well as severance and expense reduction initiatives). The Company believes these non -GAAP adjusted measures provide investors with important information about the continuing economic results of the organization’s operations. Tangible assets and tangible common equity are used in the calculation of certain profitability, capital, and per share ratios. The Company believes tangible assets, tangible common equity and the related ratios are meaningful measures of capital adequacy because they provide a meaningful base for period -to -period and company -to -company comparisons, which the Company believes will assist investors in assessing the capital of the Company and its ability to absorb potential losses. The Company believes tangible common equity is an important indication of its ability to grow organically and through business combinations, as well as its ability to pay dividends and to engage in various capital management strategies. Additionally, the Company believes that return on tangible common equity (ROTCE) is a meaningful supplement to GAAP financial measures and useful to investors because it measures the performance of a business consistently across time without regard to whether components of the business were acquired or developed internally. For the three months ended (Dollars in thousands, except per share amounts) March 31, 2023 2022 2021 2020 2019 2018 Adjusted Operating Earnings Net Income (GAAP) $ 35,653 $ 234,510 $ 263,917 $ 158,228 $ 193,528 $ 146,248 Plus: Legal reserve, net of tax 3,950 - - - - - Plus: Strategic branch closing and facility consolidation costs, net of tax - 4,351 13,775 5,343 - 849 Plus: Merger and rebranding-related costs, net of tax - - - - 27,395 32,065 Plus: Nonrecurring tax expenses - - - - - - Plus: Net loss related to balance sheet repositioning, net of tax - - 11,609 25,979 12,953 - Less: (Loss) gain on sale of securities, net of tax (10,586) (2) 69 9,712 6,063 303 Less: Gain on sale of DHFB, net of tax - 7,984 - - - - Less: Gain on Visa, Inc. Class B common stock, net of tax - - 4,058 - - - Adjusted operating earnings (non-GAAP) $ 50,189 $ 230,879 $ 285,174 $ 179,838 $ 227,813 $ 178,859 Less: Dividends on preferred stock 2,967 11,868 11,868 5,658 - - Adjusted operating earnings available to common shareholders (non-GAAP) $ 47,222 $ 219,011 $ 273,306 $ 174,180 $ 227,813 $ 178,859 Earnings per share (EPS) Weighted average common shares outstanding, diluted 74,835,514 74,953,398 77,417,801 78,875,668 80,263,557 65,908,573 EPS available to common shareholders, diluted (GAAP) $ 0.44 $ 2.97 $ 3.26 $ 1.93 $ 2.41 $ 2.22 Adjusted operating EPS available to common shareholders, diluted (non-GAAP) $ 0.63 $ 2.92 $ 3.53 $ 2.21 $ 2.84 $ 2.71 Return on assets (ROA) Average assets $ 20,384,351 $ 19,949,388 $ 19,977,551 $ 19,083,853 $ 16,840,310 $ 13,181,609 ROA (GAAP) 0.71% 1.18% 1.32% 0.83% 1.15% 1.11% Adjusted operating ROA (non-GAAP) 1.00% 1.16% 1.43% 0.94% 1.35% 1.36% Return on equity (ROE) Adjusted operating earnings available to common shareholders (non-GAAP) $ 47,222 $ 219,011 $ 273,306 $ 174,180 $ 227,813 $ 178,859 Plus: Amortization of intangibles, tax effected 1,800 8,544 10,984 13,093 14,632 10,143 Adjusted operating earnings available to common shareholders before amortization of intangibles (non-GAAP) $ 49,022 $ 227,555 $ 284,290 $ 187,273 $ 242,445 $ 189,002 Average equity (GAAP) $ 2,423,600 $ 2,465,049 $ 2,725,330 $ 2,576,372 $ 2,451,435 $ 1,863,216 Less: Average intangible assets 950,799 964,942 985,559 1,000,654 991,926 776,944 Less: Average perpetual preferred stock 166,356 166,356 166,356 93,658 - - Average tangible common equity (non-GAAP) $ 1,306,445 $ 1,333,751 $ 1,573,415 $ 1,482,060 $ 1,459,509 $ 1,086,272 ROE (GAAP) 5.97% 9.51% 9.68% 6.14% 7.89% 7.85% Return on tangible common equity (ROTCE) Net Income available to common shareholders (GAAP) $ 32,686 $ 222,642 $ 252,049 $ 152,570 $ 193,528 $ 146,248 Plus: Amortization of intangibles, tax effected 1,800 8,544 10,984 13,093 14,632 10,143 Net Income available to common shareholders before amortization of intangibles (non-GAAP) $ 34,486 $ 231,186 $ 263,033 $ 165,663 $ 208,160 $ 156,391 ROTCE 10.71% 17.33% 16.72% 11.18% 14.26% 14.40% Adjusted operating ROTCE (non-GAAP) 15.22% 17.06% 18.07% 12.64% 16.61% 17.40% ADJUSTED OPERATING EARNINGS & FINANCIAL METRICS For the years ended December 31, |
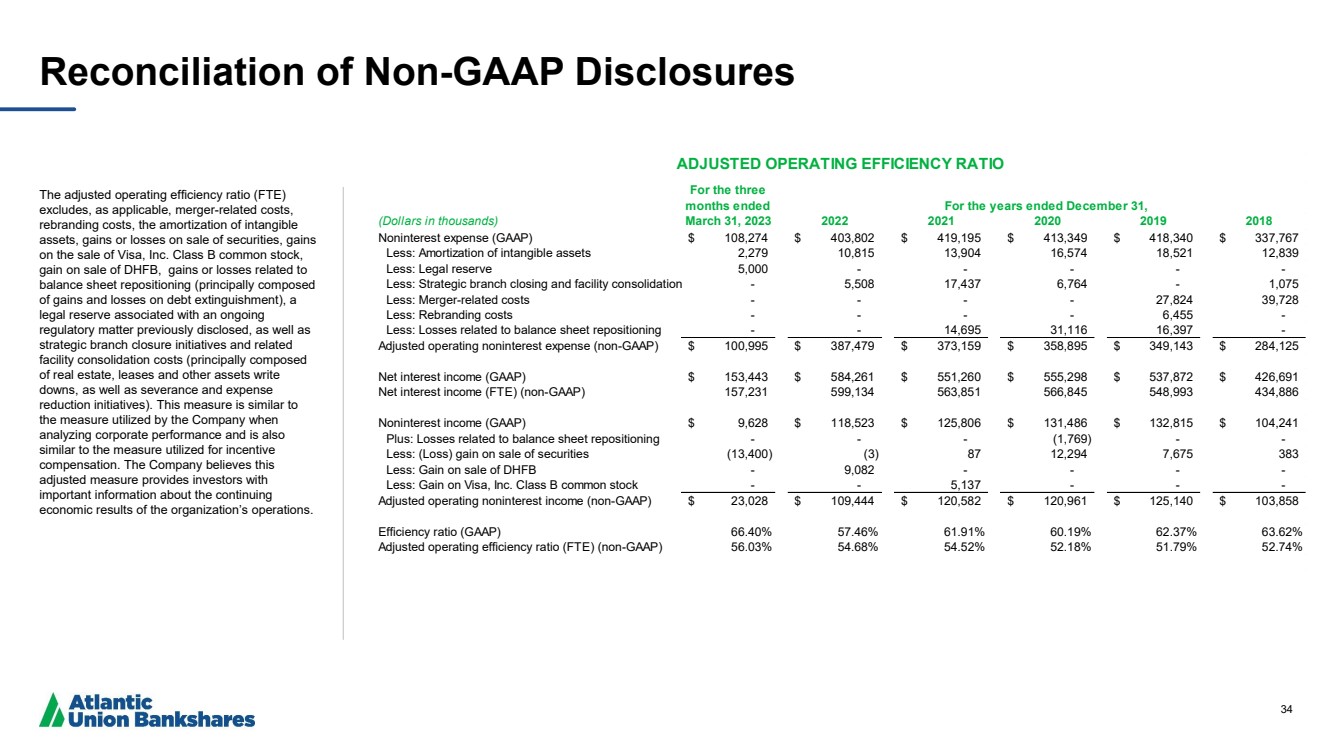
| 34 Reconciliation of Non-GAAP Disclosures The adjusted operating efficiency ratio (FTE) excludes, as applicable, merger-related costs, rebranding costs, the amortization of intangible assets, gains or losses on sale of securities, gains on the sale of Visa, Inc. Class B common stock, gain on sale of DHFB, gains or losses related to balance sheet repositioning (principally composed of gains and losses on debt extinguishment), a legal reserve associated with an ongoing regulatory matter previously disclosed, as well as strategic branch closure initiatives and related facility consolidation costs (principally composed of real estate, leases and other assets write downs, as well as severance and expense reduction initiatives). This measure is similar to the measure utilized by the Company when analyzing corporate performance and is also similar to the measure utilized for incentive compensation. The Company believes this adjusted measure provides investors with important information about the continuing economic results of the organization’s operations. For the three months ended (Dollars in thousands) March 31, 2023 2022 2021 2020 2019 2018 Noninterest expense (GAAP) $ 108,274 $ 403,802 $ 419,195 $ 413,349 $ 418,340 $ 337,767 Less: Amortization of intangible assets 2,279 10,815 13,904 16,574 18,521 12,839 Less: Legal reserve 5,000 - - - - - Less: Strategic branch closing and facility consolidation costs - 5,508 17,437 6,764 - 1,075 Less: Merger-related costs - - - - 27,824 39,728 Less: Rebranding costs - - - - 6,455 - Less: Losses related to balance sheet repositioning - - 14,695 31,116 16,397 - Adjusted operating noninterest expense (non-GAAP) $ 100,995 $ 387,479 $ 373,159 $ 358,895 $ 349,143 $ 284,125 Net interest income (GAAP) $ 153,443 $ 584,261 $ 551,260 $ 555,298 $ 537,872 $ 426,691 Net interest income (FTE) (non-GAAP) 157,231 599,134 563,851 566,845 548,993 434,886 Noninterest income (GAAP) $ 9,628 $ 118,523 $ 125,806 $ 131,486 $ 132,815 $ 104,241 Plus: Losses related to balance sheet repositioning - - - (1,769) - - Less: (Loss) gain on sale of securities (13,400) (3) 87 12,294 7,675 383 Less: Gain on sale of DHFB - 9,082 - - - - Less: Gain on Visa, Inc. Class B common stock - - 5,137 - - - Adjusted operating noninterest income (non-GAAP) $ 23,028 $ 109,444 $ 120,582 $ 120,961 $ 125,140 $ 103,858 Efficiency ratio (GAAP) 66.40% 57.46% 61.91% 60.19% 62.37% 63.62% Adjusted operating efficiency ratio (FTE) (non-GAAP) 56.03% 54.68% 54.52% 52.18% 51.79% 52.74% ADJUSTED OPERATING EFFICIENCY RATIO For the years ended December 31, |
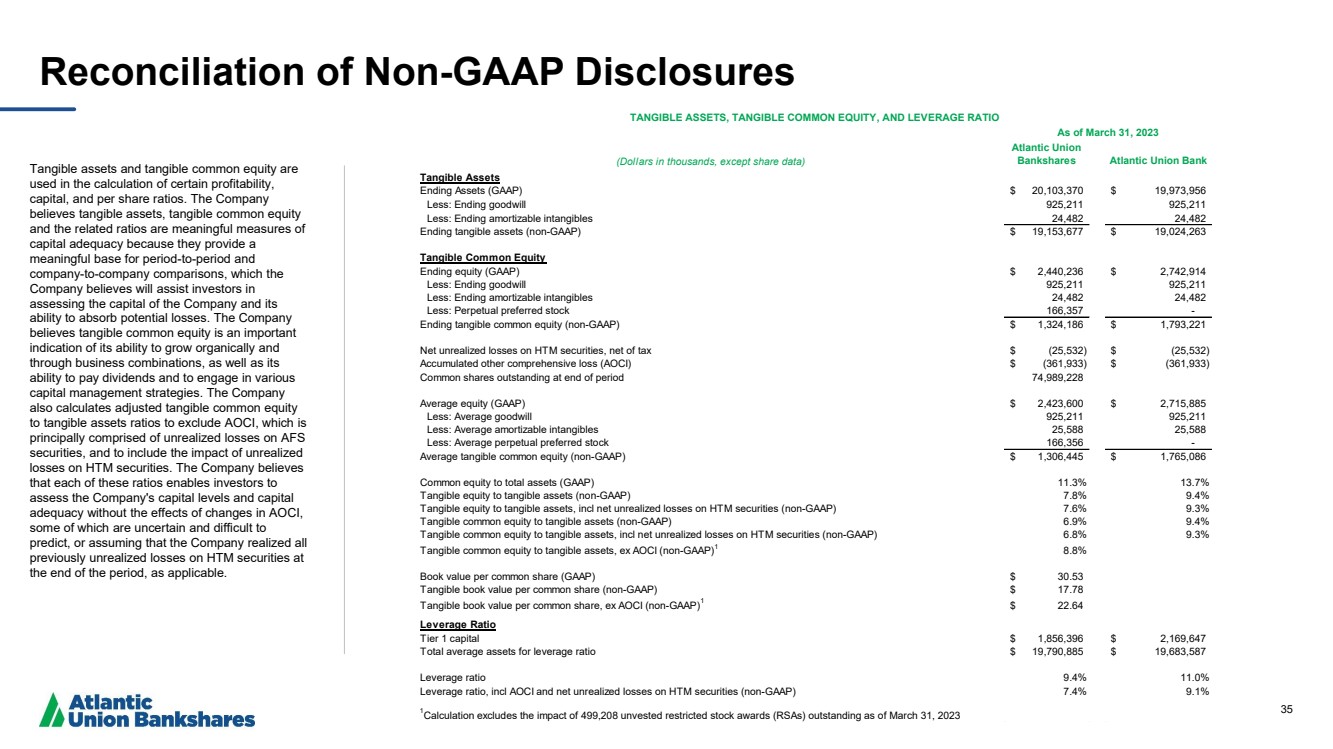
| 35 Reconciliation of Non-GAAP Disclosures Tangible assets and tangible common equity are used in the calculation of certain profitability, capital, and per share ratios. The Company believes tangible assets, tangible common equity and the related ratios are meaningful measures of capital adequacy because they provide a meaningful base for period-to-period and company-to-company comparisons, which the Company believes will assist investors in assessing the capital of the Company and its ability to absorb potential losses. The Company believes tangible common equity is an important indication of its ability to grow organically and through business combinations, as well as its ability to pay dividends and to engage in various capital management strategies. The Company also calculates adjusted tangible common equity to tangible assets ratios to exclude AOCI, which is principally comprised of unrealized losses on AFS securities, and to include the impact of unrealized losses on HTM securities. The Company believes that each of these ratios enables investors to assess the Company's capital levels and capital adequacy without the effects of changes in AOCI, some of which are uncertain and difficult to predict, or assuming that the Company realized all previously unrealized losses on HTM securities at the end of the period, as applicable. (Dollars in thousands, except share data) Atlantic Union Bankshares Atlantic Union Bank Tangible Assets Ending Assets (GAAP) $ 20,103,370 $ 19,973,956 Less: Ending goodwill 925,211 925,211 Less: Ending amortizable intangibles 24,482 24,482 Ending tangible assets (non-GAAP) $ 19,153,677 $ 19,024,263 Tangible Common Equity Ending equity (GAAP) $ 2,440,236 $ 2,742,914 Less: Ending goodwill 925,211 925,211 Less: Ending amortizable intangibles 24,482 24,482 Less: Perpetual preferred stock 166,357 - Ending tangible common equity (non-GAAP) $ 1,324,186 $ 1,793,221 Net unrealized losses on HTM securities, net of tax $ (25,532) $ (25,532) Accumulated other comprehensive loss (AOCI) $ (361,933) $ (361,933) Common shares outstanding at end of period 74,989,228 Average equity (GAAP) $ 2,423,600 $ 2,715,885 Less: Average goodwill 925,211 925,211 Less: Average amortizable intangibles 25,588 25,588 Less: Average perpetual preferred stock 166,356 - Average tangible common equity (non-GAAP) $ 1,306,445 $ 1,765,086 Less: Perpetual preferred stock Common equity to total assets (GAAP) 11.3% 13.7% Tangible equity to tangible assets (non-GAAP) 7.8% 9.4% Tangible equity to tangible assets, incl net unrealized losses on HTM securities (non-GAAP) 7.6% 9.3% Tangible common equity to tangible assets (non-GAAP) 6.9% 9.4% Tangible common equity to tangible assets, incl net unrealized losses on HTM securities (non-GAAP) 6.8% 9.3% Tangible common equity to tangible assets, ex AOCI (non-GAAP)1 8.8% Book value per common share (GAAP) $ 30.53 Tangible book value per common share (non-GAAP) $ 17.78 Tangible book value per common share, ex AOCI (non-GAAP)1 $ 22.64 Leverage Ratio Tier 1 capital $ 1,856,396 $ 2,169,647 Total average assets for leverage ratio $ 19,790,885 $ 19,683,587 Leverage ratio 9.4% 11.0% Leverage ratio, incl AOCI and net unrealized losses on HTM securities (non-GAAP) 7.4% 9.1% 1Calculation excludes the impact of 499,208 unvested restricted stock awards (RSAs) outstanding as of March 31, 2023 TANGIBLE ASSETS, TANGIBLE COMMON EQUITY, AND LEVERAGE RATIO As of March 31, 2023 |
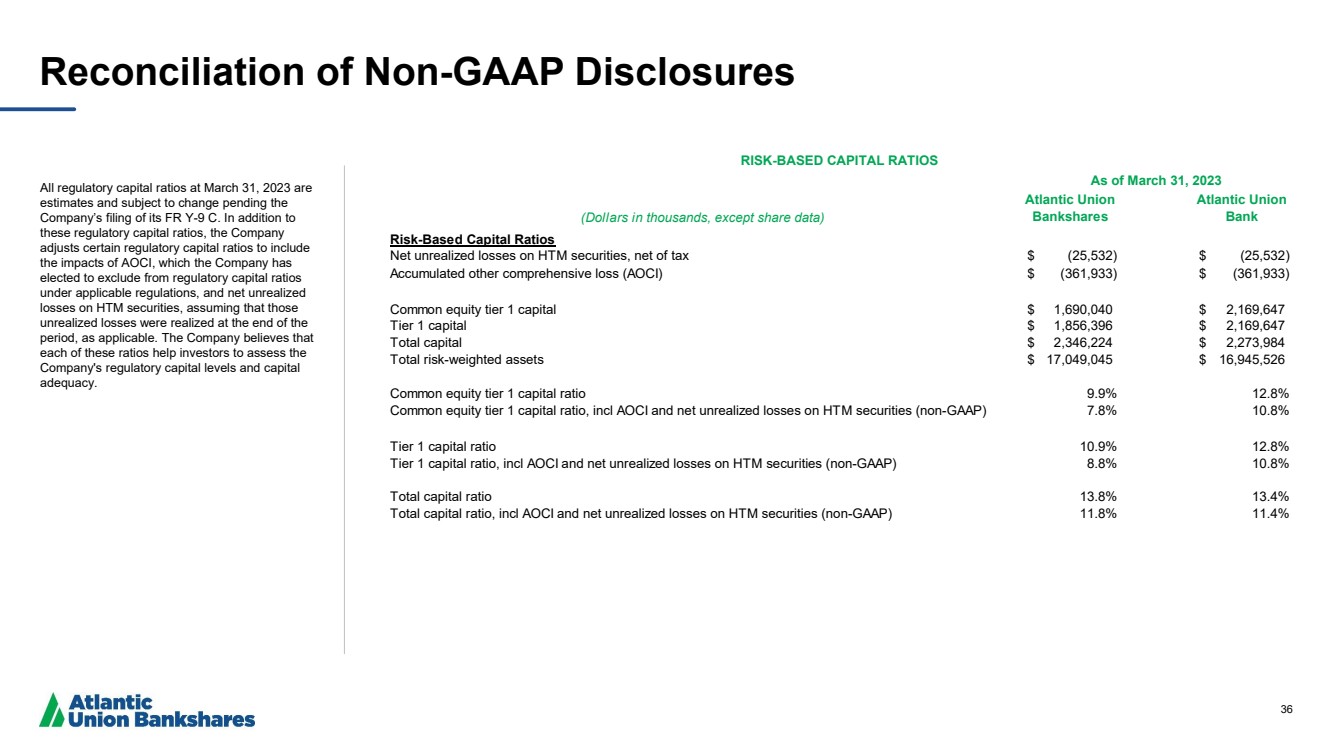
| 36 Reconciliation of Non-GAAP Disclosures All regulatory capital ratios at March 31, 2023 are estimates and subject to change pending the Company’s filing of its FR Y-9 C. In addition to these regulatory capital ratios, the Company adjusts certain regulatory capital ratios to include the impacts of AOCI, which the Company has elected to exclude from regulatory capital ratios under applicable regulations, and net unrealized losses on HTM securities, assuming that those unrealized losses were realized at the end of the period, as applicable. The Company believes that each of these ratios help investors to assess the Company's regulatory capital levels and capital adequacy. (Dollars in thousands, except share data) Atlantic Union Bankshares Atlantic Union Bank Risk-Based Capital Ratios Net unrealized losses on HTM securities, net of tax $ (25,532) $ (25,532) Accumulated other comprehensive loss (AOCI) $ (361,933) $ (361,933) Common equity tier 1 capital $ 1,690,040 $ 2,169,647 Tier 1 capital $ 1,856,396 $ 2,169,647 Total capital $ 2,346,224 $ 2,273,984 Total risk-weighted assets $ 17,049,045 $ 16,945,526 Common equity tier 1 capital ratio 9.9% 12.8% Common equity tier 1 capital ratio, incl AOCI and net unrealized losses on HTM securities (non-GAAP) 7.8% 10.8% Tier 1 capital ratio 10.9% 12.8% Tier 1 capital ratio, incl AOCI and net unrealized losses on HTM securities (non-GAAP) 8.8% 10.8% Total capital ratio 13.8% 13.4% Total capital ratio, incl AOCI and net unrealized losses on HTM securities (non-GAAP) 11.8% 11.4% RISK-BASED CAPITAL RATIOS As of March 31, 2023 |
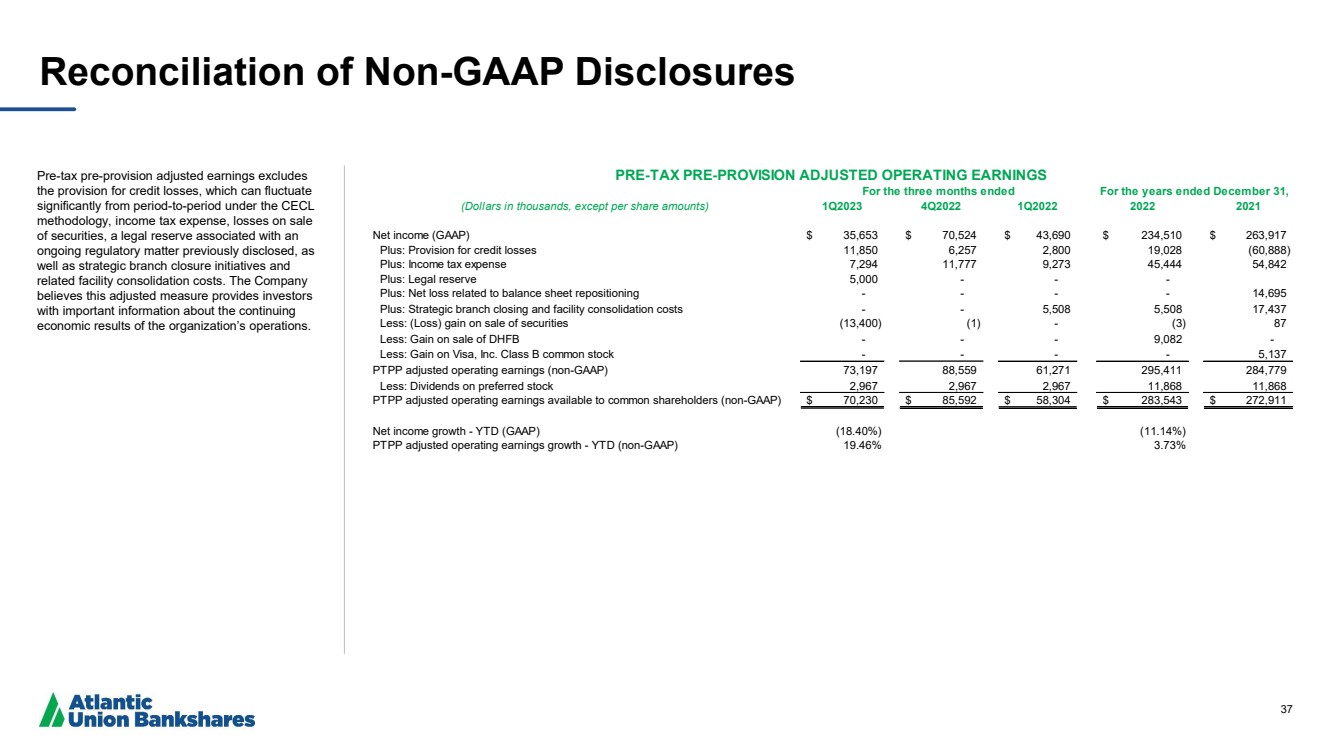
| 37 Reconciliation of Non-GAAP Disclosures Pre-tax pre-provision adjusted earnings excludes the provision for credit losses, which can fluctuate significantly from period-to-period under the CECL methodology, income tax expense, losses on sale of securities, a legal reserve associated with an ongoing regulatory matter previously disclosed, as well as strategic branch closure initiatives and related facility consolidation costs. The Company believes this adjusted measure provides investors with important information about the continuing economic results of the organization’s operations. (Dollars in thousands, except per share amounts) 1Q2023 4Q2022 1Q2022 2022 2021 Net income (GAAP) $ 35,653 $ 70,524 $ 43,690 $ 234,510 $ 263,917 Plus: Provision for credit losses 11,850 6,257 2,800 19,028 (60,888) Plus: Income tax expense 7,294 11,777 9,273 45,444 54,842 Plus: Legal reserve 5,000 - - - Plus: Net loss related to balance sheet repositioning - - - - 14,695 Plus: Strategic branch closing and facility consolidation costs - - 5,508 5,508 17,437 Less: (Loss) gain on sale of securities (13,400) (1) - (3) 87 Less: Gain on sale of DHFB - - - 9,082 - Less: Gain on Visa, Inc. Class B common stock - - - - 5,137 PTPP adjusted operating earnings (non-GAAP) 73,197 88,559 61,271 295,411 284,779 Less: Dividends on preferred stock 2,967 2,967 2,967 11,868 11,868 PTPP adjusted operating earnings available to common shareholders (non-GAAP) $ 70,230 $ 85,592 $ 58,304 $ 283,543 $ 272,911 Net income growth - YTD (GAAP) (18.40%) (11.14%) PTPP adjusted operating earnings growth - YTD (non-GAAP) 19.46% 3.73% For the three months ended PRE-TAX PRE-PROVISION ADJUSTED OPERATING EARNINGS For the years ended December 31, |
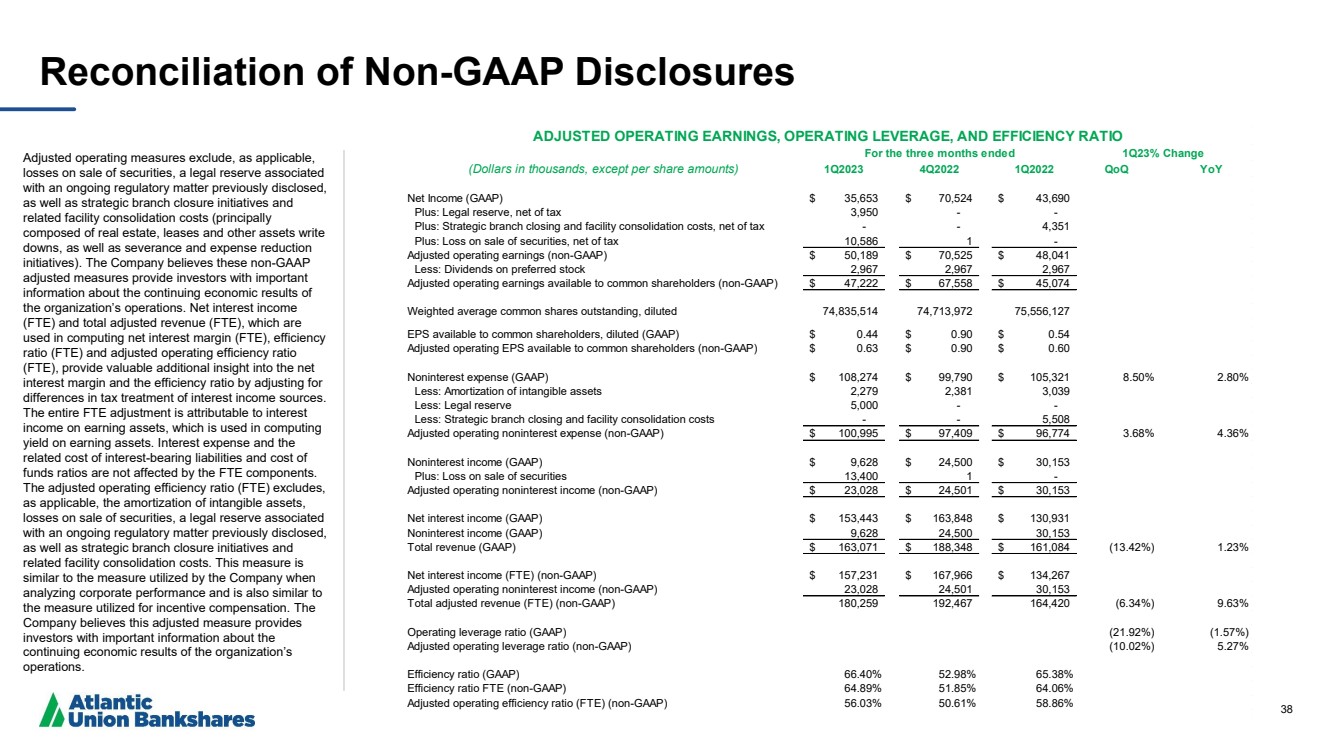
| 38 Reconciliation of Non -GAAP Disclosures Adjusted operating measures exclude, as applicable, losses on sale of securities, a legal reserve associated with an ongoing regulatory matter previously disclosed, as well as strategic branch closure initiatives and related facility consolidation costs (principally composed of real estate, leases and other assets write downs, as well as severance and expense reduction initiatives). The Company believes these non -GAAP adjusted measures provide investors with important information about the continuing economic results of the organization’s operations. Net interest income (FTE) and total adjusted revenue (FTE), which are used in computing net interest margin (FTE), efficiency ratio (FTE) and adjusted operating efficiency ratio (FTE), provide valuable additional insight into the net interest margin and the efficiency ratio by adjusting for differences in tax treatment of interest income sources. The entire FTE adjustment is attributable to interest income on earning assets, which is used in computing yield on earning assets. Interest expense and the related cost of interest -bearing liabilities and cost of funds ratios are not affected by the FTE components. The adjusted operating efficiency ratio (FTE) excludes, as applicable, the amortization of intangible assets, losses on sale of securities, a legal reserve associated with an ongoing regulatory matter previously disclosed, as well as strategic branch closure initiatives and related facility consolidation costs. This measure is similar to the measure utilized by the Company when analyzing corporate performance and is also similar to the measure utilized for incentive compensation. The Company believes this adjusted measure provides investors with important information about the continuing economic results of the organization’s operations. (Dollars in thousands, except per share amounts) 1Q2023 4Q2022 1Q2022 QoQ YoY Net Income (GAAP) $ 35,653 $ 70,524 $ 43,690 Plus: Legal reserve, net of tax 3,950 - - Plus: Strategic branch closing and facility consolidation costs, net of tax - - 4,351 Plus: Loss on sale of securities, net of tax 10,586 1 - Adjusted operating earnings (non-GAAP) $ 50,189 $ 70,525 $ 48,041 Less: Dividends on preferred stock 2,967 2,967 2,967 Adjusted operating earnings available to common shareholders (non-GAAP) $ 47,222 $ 67,558 $ 45,074 Weighted average common shares outstanding, diluted 74,835,514 74,713,972 75,556,127 EPS available to common shareholders, diluted (GAAP) $ 0.44 $ 0.90 $ 0.54 Adjusted operating EPS available to common shareholders (non-GAAP) $ 0.63 $ 0.90 $ 0.60 Noninterest expense (GAAP) $ 108,274 $ 99,790 $ 105,321 8.50% 2.80% Less: Amortization of intangible assets 2,279 2,381 3,039 Less: Legal reserve 5,000 - - Less: Strategic branch closing and facility consolidation costs - - 5,508 Adjusted operating noninterest expense (non-GAAP) $ 100,995 $ 97,409 $ 96,774 3.68% 4.36% Noninterest income (GAAP) $ 9,628 $ 24,500 $ 30,153 Plus: Loss on sale of securities 13,400 1 - Adjusted operating noninterest income (non-GAAP) $ 23,028 $ 24,501 $ 30,153 Net interest income (GAAP) $ 153,443 $ 163,848 $ 130,931 Noninterest income (GAAP) 9,628 24,500 30,153 Total revenue (GAAP) $ 163,071 $ 188,348 $ 161,084 (13.42%) 1.23% Net interest income (FTE) (non-GAAP) $ 157,231 $ 167,966 $ 134,267 Adjusted operating noninterest income (non-GAAP) 23,028 24,501 30,153 Total adjusted revenue (FTE) (non-GAAP) 180,259 192,467 164,420 (6.34%) 9.63% Operating leverage ratio (GAAP) (21.92%) (1.57%) Adjusted operating leverage ratio (non-GAAP) (10.02%) 5.27% Efficiency ratio (GAAP) 66.40% 52.98% 65.38% Efficiency ratio FTE (non-GAAP) 64.89% 51.85% 64.06% Adjusted operating efficiency ratio (FTE) (non-GAAP) 56.03% 50.61% 58.86% 1Q23% Change ADJUSTED OPERATING EARNINGS, OPERATING LEVERAGE, AND EFFICIENCY RATIO For the three months ended |