| 1 st Quarter 2023 Earnings Presentation NYSE: AUB April 25, 2023 |

| 2 Forward Looking Statements This presentation and statements by our management may constitute “forward-looking statements” within the meaning of the Private Securities Litigation Reform Act of 1995. Forward-looking statements are statements that include, without limitation, statements on slides entitled “Financial Outlook” and “Stable Deposit Balances” statements regarding our strategic priorities and liquidity and capital management strategies, expectations with regard to our business, financial, and operating results, including our deposit base and funding, the impact of future economic conditions, and statements that include, other projections, predictions, expectations, or beliefs about future events or results, including our ability to meet our top tier financial targets, or otherwise are not statements of historical fact. Such forward-looking statements are based on certain assumptions as of the time they are made, and are inherently subject to known and unknown risks, uncertainties, and other factors, some of which cannot be predicted or quantified, that may cause actual results, performance, achievements, or trends to be materially different from those expressed or implied by such forward-looking statements. Such statements are often characterized by the use of qualified words (and their derivatives) such as “expect,” “believe,” “estimate,” “plan,” “project,” “anticipate,” “intend,” “will,” “may,” “view,” “opportunity,” “potential,” “continue,” “confidence,” or words of similar meaning or other statements concerning opinions or judgment of the Company and our management about future events. Although we believe that our expectations with respect to forward-looking statements are based upon reasonable assumptions within the bounds of our existing knowledge of our business and operations, there can be no assurance that actual future results, performance, or achievements of, or trends affecting, us will not differ materially from any projected future results, performance, achievements or trends expressed or implied by such forward-looking statements. Actual future results, performance, achievements or trends may differ materially from historical results or those anticipated depending on a variety of factors, including, but not limited to the effects of or changes in: • market interest rates and their related impacts on macroeconomic conditions, customer and client behavior, our funding costs and our loan and securities portfolios; • inflation and its impacts on economic growth and customer and client behavior; • adverse developments in the financial industry generally, such as the recent bank failures, responsive measures to mitigate and manage such developments, related supervisory and regulatory actions and costs, and related impacts on customer and client behavior; • the sufficiency of liquidity; • general economic and financial market conditions, in the United States generally and particularly in the markets in which we operate and which our loans are concentrated, including the effects of declines in real estate values, an increase in unemployment levels and slowdowns in economic growth; • monetary and fiscal policies of the U.S. government, including policies of the U.S. Department of the Treasury and the Federal Reserve; • the quality or composition of our loan or investment portfolios and changes therein; • demand for loan products and financial services in our market areas; • our ability to manage our growth or implement our growth strategy; • the effectiveness of expense reduction plans; • the introduction of new lines of business or new products and services; • our ability to recruit and retain key employees; • real estate values in our lending area; • changes in accounting principles, standards, rules, and interpretations, and the related impact on our financial statements; • an insufficient ACL or volatility in the ACL resulting from the CECL methodology, either alone or as that may be affected by inflation, changing interest rates, or other factors; • our liquidity and capital positions; • concentrations of loans secured by real estate, particularly commercial real estate; • the effectiveness of our credit processes and management of our credit risk; • our ability to compete in the market for financial services and increased competition from fintech companies; • technological risks and developments, and cyber threats, attacks, or events; • operational, technological, cultural, regulatory, legal, credit, and other risks associated with the exploration, consummation and integration of potential future acquisitions, whether involving stock or cash considerations; • the potential adverse effects of unusual and infrequently occurring events, such as weather-related disasters, terrorist acts, geopolitical conflicts or public health events, and of governmental and societal responses thereto; these potential adverse effects may include, without limitation, adverse effects on the ability of our borrowers to satisfy their obligations to us, on the value of collateral securing loans, on the demand for the our loans or our other products and services, on supply chains and methods used to distribute products and services, on incidents of cyberattack and fraud, on our liquidity or capital positions, on risks posed by reliance on third-party service providers, on other aspects of our business operations and on financial markets and economic growth; • the discontinuation of LIBOR and its impact on the financial markets, and our ability to manage operational, legal, and compliance risks related to the discontinuation of LIBOR and implementation of one or more alternate reference rates; • performance by our counterparties or vendors; • deposit flows; • the availability of financing and the terms thereof; • the level of prepayments on loans and mortgage-backed securities; • legislative or regulatory changes and requirements; • actual or potential claims, damages, and fines related to litigation or government actions, which may result in, among other things, additional costs, fines, penalties, restrictions on our business activities, reputational harm, or other adverse consequences; • the effects of changes in federal, state or local tax laws and regulations; • any event or development that would cause us to conclude that there was an impairment of any asset, including intangible assets, such as goodwill; and • other factors, many of which are beyond our control. Please also refer to such other factors as discussed throughout Part I, Item 1A. “Risk Factors” and Part II, Item 7, “Management’s Discussion and Analysis of Financial Condition and Results of Operations” of the Company’s Annual Report on Form 10 K for the year ended December 31, 2022 and related disclosures in other filings, which have been filed with the U.S. Securities and Exchange Commission (“SEC”) and are available on the SEC’s website at www.sec.gov. All risk factors and uncertainties described herein and therein should be considered in evaluating forward-looking statements, and all of the forward-looking statements are expressly qualified by the cautionary statements contained or referred to herein and therein. The actual results or developments anticipated may not be realized or, even if substantially realized, they may not have the expected consequences to or effects on the Company or its businesses or operations. Readers are cautioned not to rely too heavily on the forward-looking statements, and undue reliance should not be placed on such forward-looking statements. Forward-looking statements speak only as of the date they are made. We do not intend or assume any obligation to update, revise or clarify any forward-looking statements that may be made from time to time by or on behalf of the Company, whether as a result of new information, future events or otherwise. |
| 3 Additional Information Non-GAAP Financial Measures This presentation contains certain financial information determined by methods other than in accordance with generally accepted accounting principles in the United States (“GAAP”). These non-GAAP financial measures are a supplement to GAAP, which is used to prepare the Company’s financial statements, and should not be considered in isolation or as a substitute for comparable measures calculated in accordance with GAAP. In addition, the Company’s non-GAAP financial measures may not be comparable to non-GAAP financial measures of other companies. The Company uses the non-GAAP financial measures discussed herein in its analysis of the Company’s performance. The Company’s management believes that these non-GAAP financial measures provide additional understanding of ongoing operations, enhance comparability of results of operations with prior periods, show the effects of significant gains and charges in the periods presented without the impact of items or events that may obscure trends in the Company’s underlying performance, or show the potential effects of accumulated other comprehensive income (or AOCI) or unrealized losses on securities on the Company's capital. Please see “Reconciliation of Non-GAAP Disclosures” at the end of this presentation for a reconciliation to the nearest GAAP financial measure. No Offer or Solicitation This presentation does not constitute an offer to sell or a solicitation of an offer to buy any securities. No offer of securities shall be made except by means of a prospectus meeting the requirements of the Securities Act of 1933, as amended, and no offer to sell or solicitation of an offer to buy shall be made in any jurisdiction in which such offer, solicitation or sale would be unlawful. About Atlantic Union Bankshares Corporation Headquartered in Richmond, Virginia, Atlantic Union Bankshares Corporation (NYSE: AUB) is the holding company for Atlantic Union Bank. Atlantic Union Bank has 109 branches and approximately 125 ATMs located throughout Virginia, and in portions of Maryland and North Carolina. Certain non-bank financial services affiliates of Atlantic Union Bank include: Atlantic Union Equipment Finance, Inc., which provides equipment financing; Atlantic Union Financial Consultants, LLC, which provides brokerage services; and Union Insurance Group, LLC, which offers various lines of insurance products. |
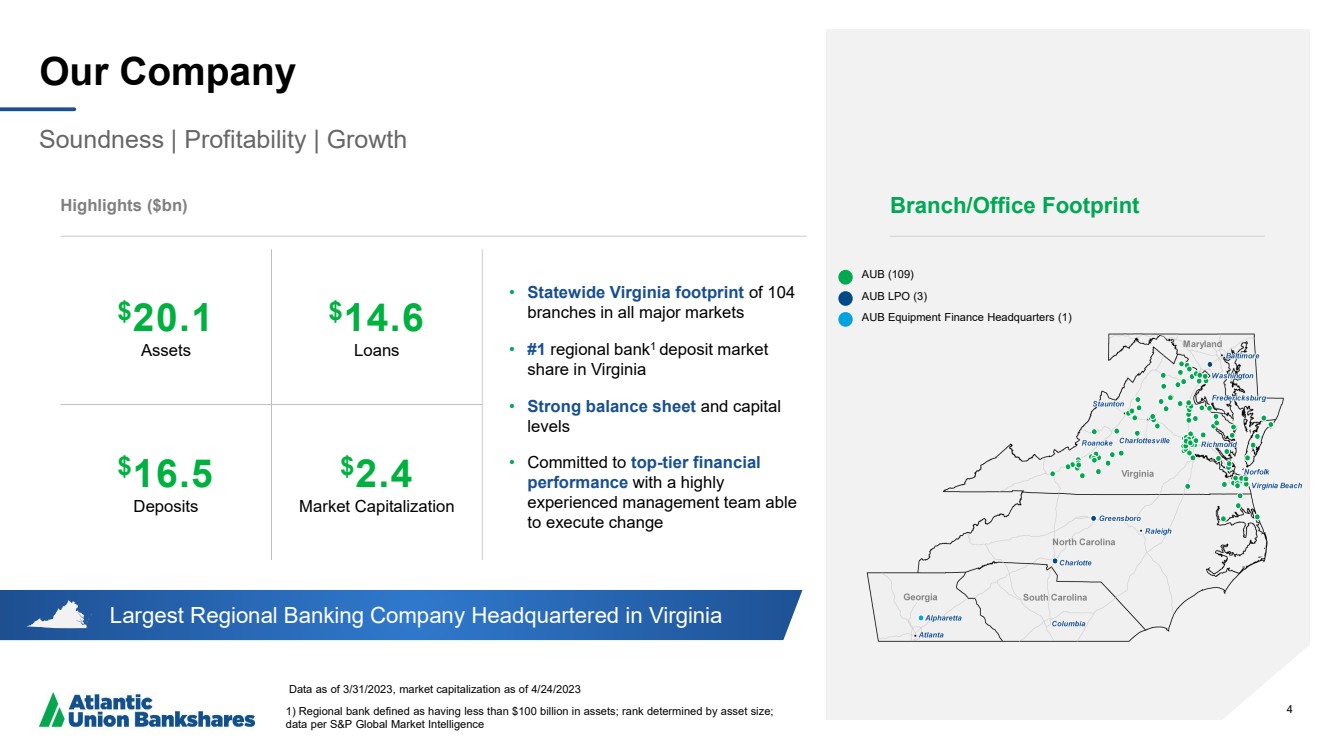
| 4 Largest Regional Banking Company Headquartered in Virginia Our Company Soundness | Profitability | Growth Data as of 3/31/2023, market capitalization as of 4/24/2023 1) Regional bank defined as having less than $100 billion in assets; rank determined by asset size; data per S&P Global Market Intelligence Highlights ($bn) • Statewide Virginia footprint of 104 branches in all major markets • #1 regional bank1 deposit market share in Virginia • Strong balance sheet and capital levels • Committed to top-tier financial performance with a highly experienced management team able to execute change 4 $20.1 Assets $14.6 Loans $16.5 Deposits $2.4 Market Capitalization Branch/Office Footprint AUB (109) AUB LPO (3) AUB Equipment Finance Headquarters (1) |
| 5 Our Shareholder Value Proposition Leading Regional Presence Dense, uniquely valuable presence across attractive markets Financial Strength Solid balance sheet & capital levels Attractive Financial Profile Solid dividend yield & payout ratio with earnings upside Strong Growth Potential Organic & acquisition opportunities Peer-Leading Performance Committed to top-tier financial performance |
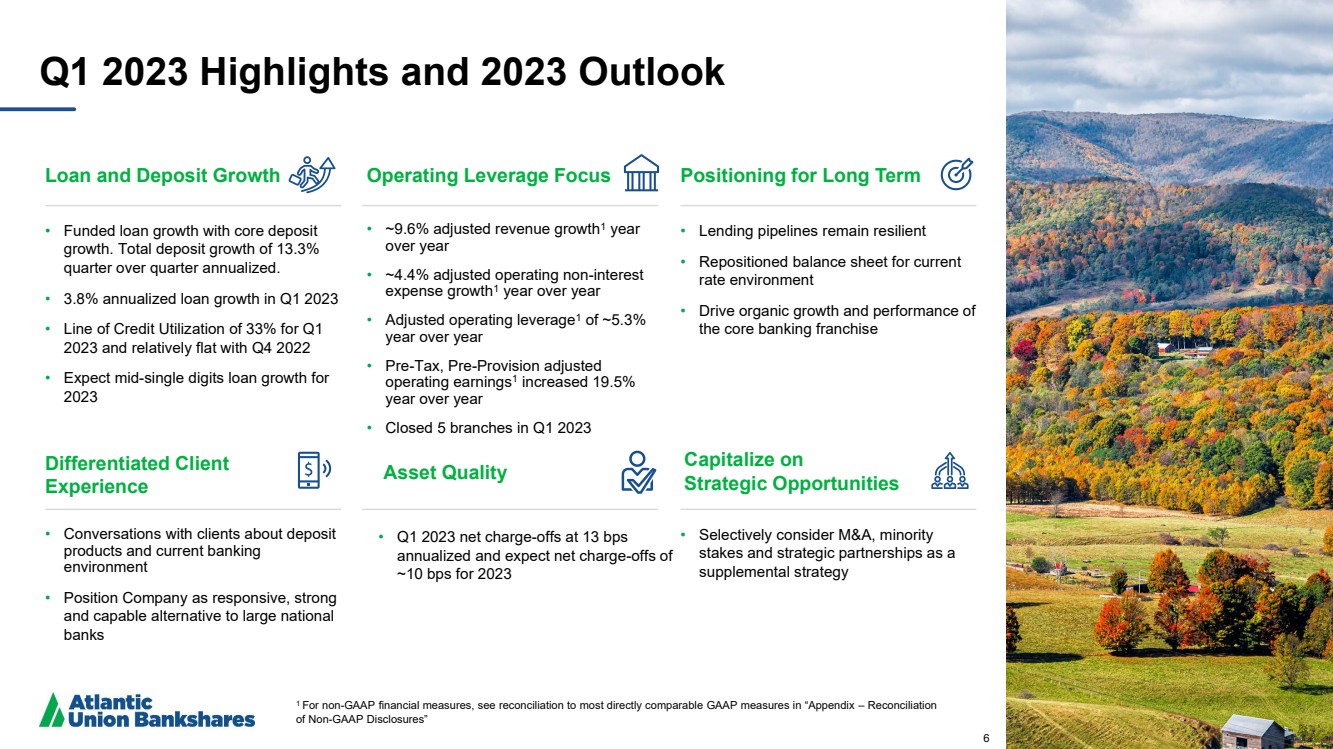
| 6 Q1 2023 Highlights and 2023 Outlook Loan and Deposit Growth • Funded loan growth with core deposit growth. Total deposit growth of 13.3% quarter over quarter annualized. • 3.8% annualized loan growth in Q1 2023 • Line of Credit Utilization of 33% for Q1 2023 and relatively flat with Q4 2022 • Expect mid-single digits loan growth for 2023 Asset Quality • Q1 2023 net charge-offs at 13 bps annualized and expect net charge-offs of ~10 bps for 2023 Positioning for Long Term • Lending pipelines remain resilient • Repositioned balance sheet for current rate environment • Drive organic growth and performance of the core banking franchise Differentiated Client Experience • Conversations with clients about deposit products and current banking environment • Position Company as responsive, strong and capable alternative to large national banks Operating Leverage Focus • ~9.6% adjusted revenue growth1 year over year • ~4.4% adjusted operating non-interest expense growth1 year over year • Adjusted operating leverage1 of ~5.3% year over year • Pre-Tax, Pre-Provision adjusted operating earnings1 increased 19.5% year over year • Closed 5 branches in Q1 2023 Capitalize on Strategic Opportunities • Selectively consider M&A, minority stakes and strategic partnerships as a supplemental strategy 6 1 For non-GAAP financial measures, see reconciliation to most directly comparable GAAP measures in “Appendix – Reconciliation of Non-GAAP Disclosures” |
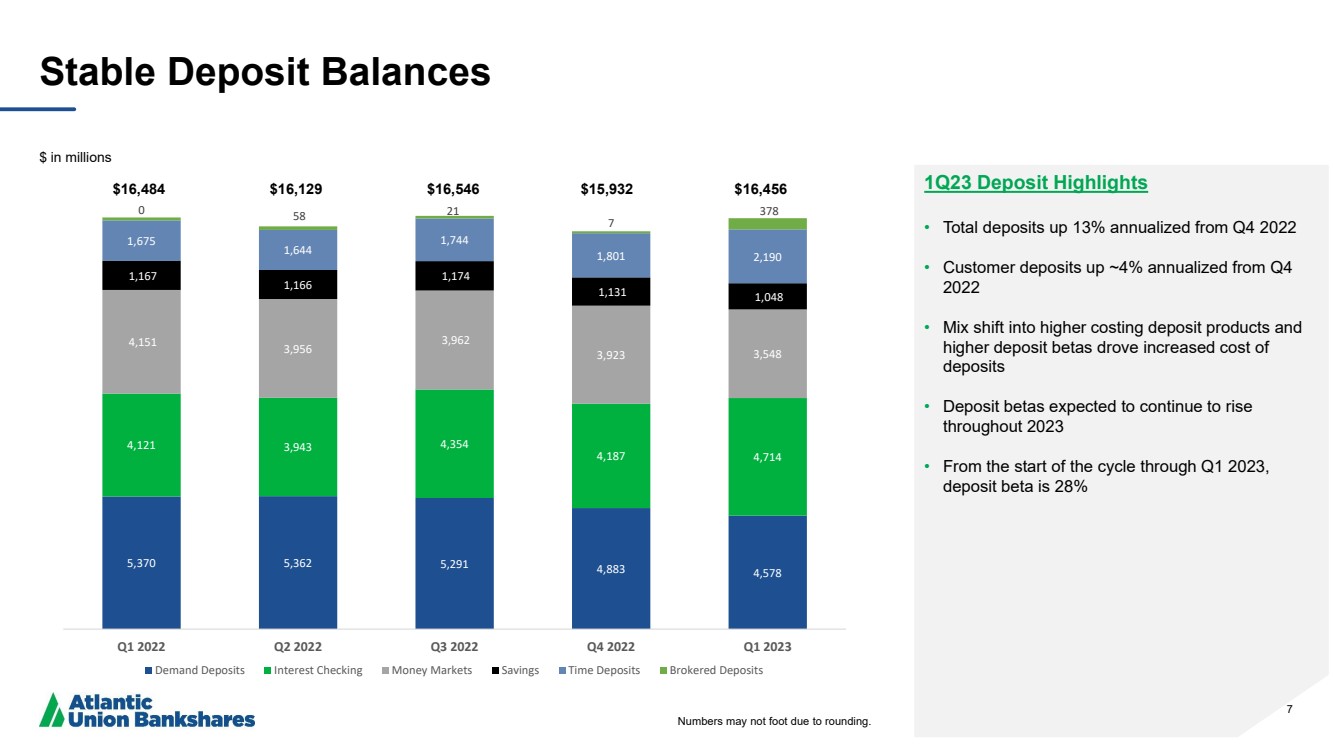
| 7 5,370 5,362 5,291 4,883 4,578 4,121 3,943 4,354 4,187 4,714 4,151 3,956 3,962 3,923 3,548 1,167 1,166 1,174 1,131 1,048 1,675 1,644 1,744 1,801 2,190 0 58 21 7 378 Q1 2022 Q2 2022 Q3 2022 Q4 2022 Q1 2023 Demand Deposits Interest Checking Money Markets Savings Time Deposits Brokered Deposits Stable Deposit Balances 1Q23 Deposit Highlights • Total deposits up 13% annualized from Q4 2022 • Customer deposits up ~4% annualized from Q4 2022 • Mix shift into higher costing deposit products and higher deposit betas drove increased cost of deposits • Deposit betas expected to continue to rise throughout 2023 • From the start of the cycle through Q1 2023, deposit beta is 28% $ in millions $16,484 $16,129 $16,546 $15,932 $16,456 Numbers may not foot due to rounding. |
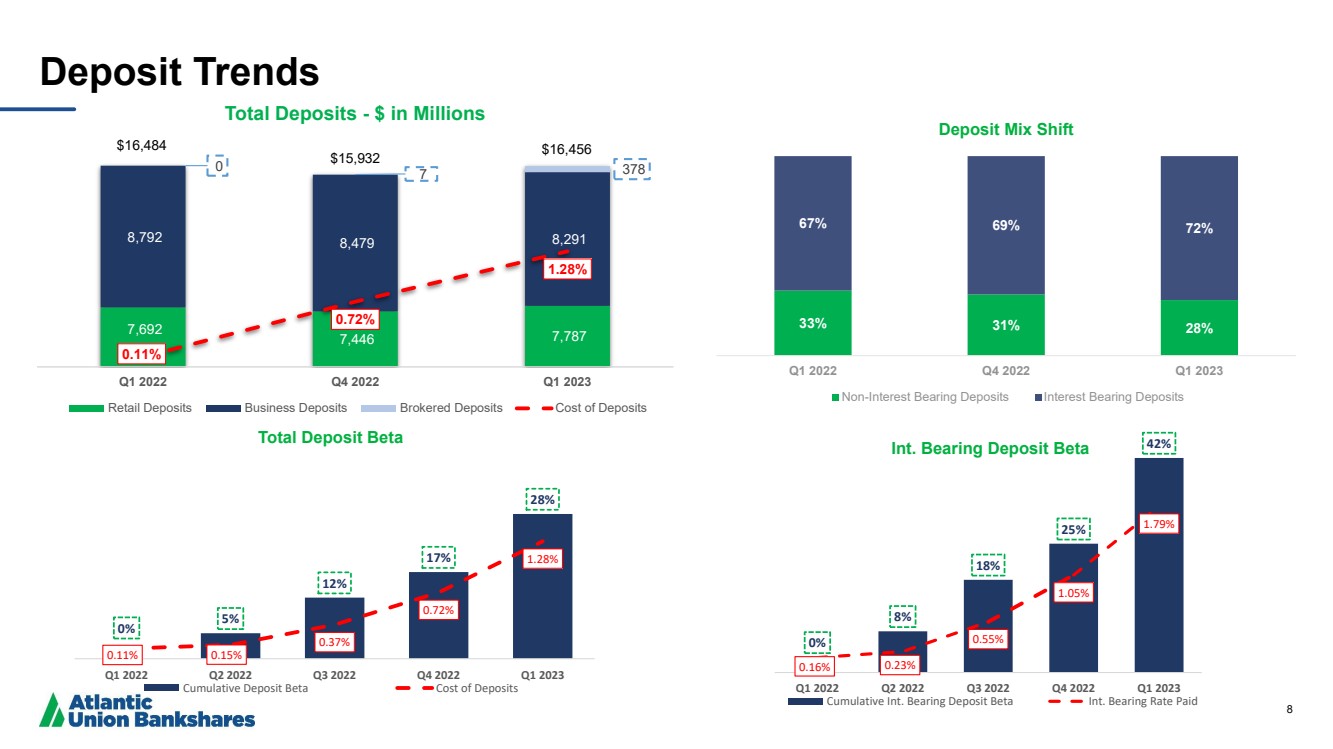
| 8 Deposit Trends 33% 31% 28% 67% 69% 72% Q1 2022 Q4 2022 Q1 2023 Deposit Mix Shift Non-Interest Bearing Deposits Interest Bearing Deposits 0% 5% 12% 17% 28% 0.11% 0.15% 0.37% 0.72% 1.28% Q1 2022 Q2 2022 Q3 2022 Q4 2022 Q1 2023 Total Deposit Beta Cumulative Deposit Beta Cost of Deposits 0% 8% 18% 25% 42% 0.16% 0.23% 0.55% 1.05% 1.79% Q1 2022 Q2 2022 Q3 2022 Q4 2022 Q1 2023 Int. Bearing Deposit Beta Cumulative Int. Bearing Deposit Beta Int. Bearing Rate Paid 7,692 7,446 7,787 8,792 8,479 8,291 0 7 378 0.11% 0.72% 1.28% Q1 2022 Q4 2022 Q1 2023 Total Deposits - $ in Millions Retail Deposits Business Deposits Brokered Deposits Cost of Deposits $16,484 $15,932 $16,456 |
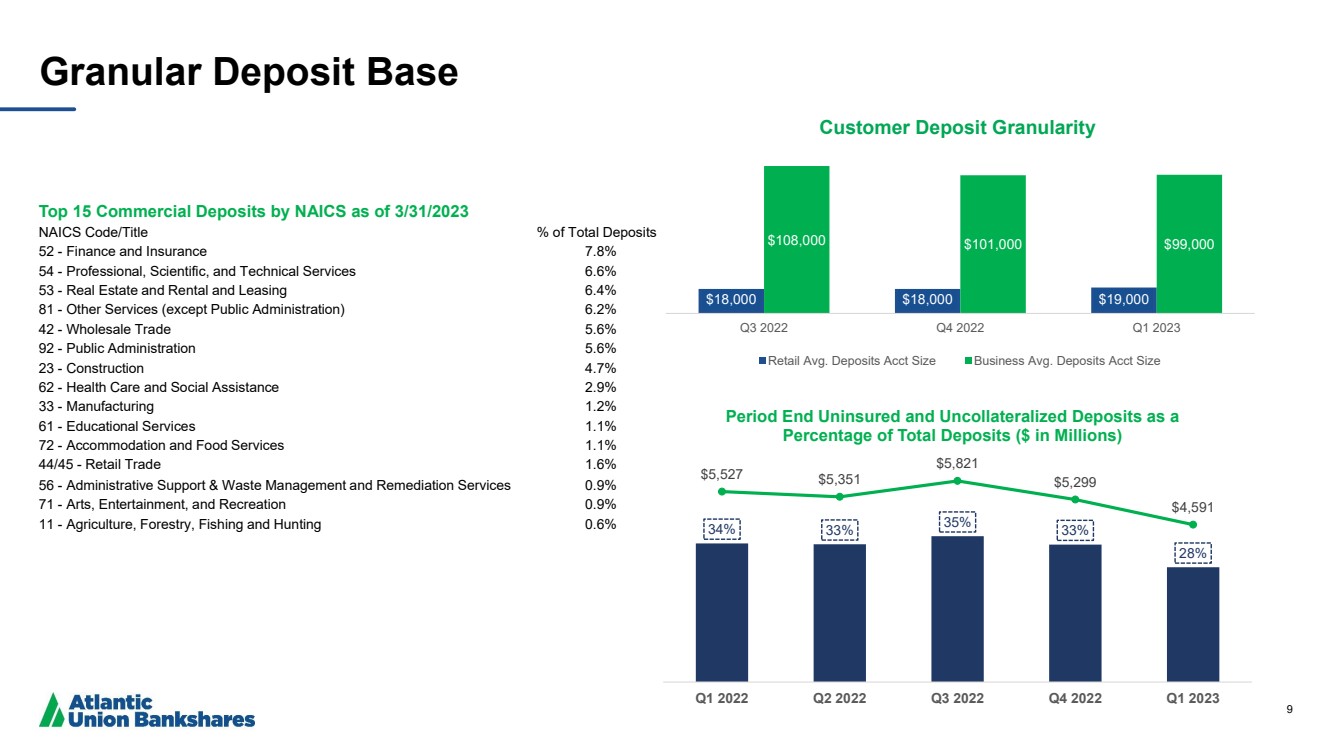
| 9 Granular Deposit Base 34% 33% 35% 33% 28% $5,527 $5,351 $5,821 $5,299 $4,591 Q1 2022 Q2 2022 Q3 2022 Q4 2022 Q1 2023 Period End Uninsured and Uncollateralized Deposits as a Percentage of Total Deposits ($ in Millions) Top 15 Commercial Deposits by NAICS as of 3/31/2023 NAICS Code/Title % of Total Deposits 52 - Finance and Insurance 7.8% 54 - Professional, Scientific, and Technical Services 6.6% 53 - Real Estate and Rental and Leasing 6.4% 81 - Other Services (except Public Administration) 6.2% 42 - Wholesale Trade 5.6% 92 - Public Administration 5.6% 23 - Construction 4.7% 62 - Health Care and Social Assistance 2.9% 33 - Manufacturing 1.2% 61 - Educational Services 1.1% 72 - Accommodation and Food Services 1.1% 44/45 - Retail Trade 1.6% 56 - Administrative Support & Waste Management and Remediation Services 0.9% 71 - Arts, Entertainment, and Recreation 0.9% 11 - Agriculture, Forestry, Fishing and Hunting 0.6% $18,000 $18,000 $19,000 $108,000 $101,000 $99,000 Q3 2022 Q4 2022 Q1 2023 Customer Deposit Granularity Retail Avg. Deposits Acct Size Business Avg. Deposits Acct Size |
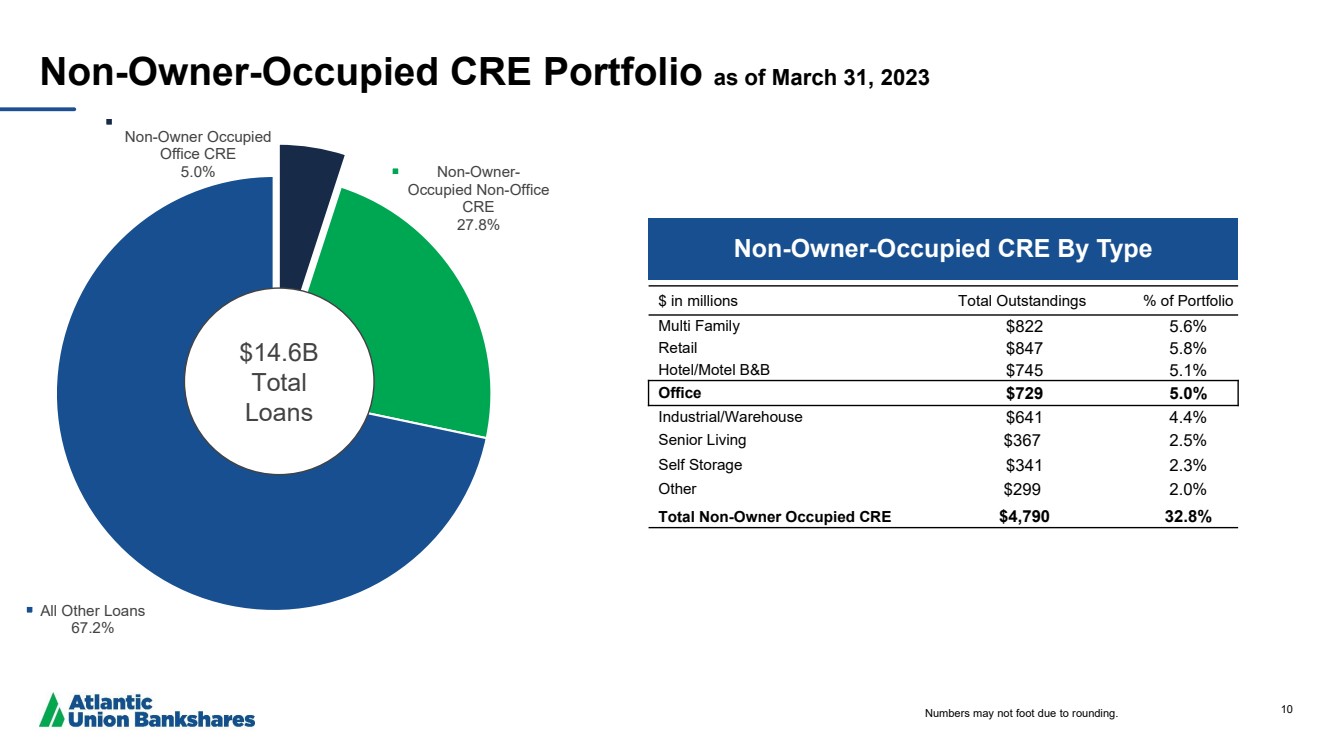
| 10 Non-Owner-Occupied CRE Portfolio as of March 31, 2023 $ in millions Total Outstandings % of Portfolio Multi Family $822 5.6% Retail $847 5.8% Hotel/Motel B&B $745 5.1% Office $729 5.0% Industrial/Warehouse $641 4.4% Senior Living $367 2.5% Self Storage $341 2.3% Other $299 2.0% Total Non-Owner Occupied CRE $4,790 32.8% Non-Owner Occupied Office CRE 5.0% Non-Owner-Occupied Non-Office CRE 27.8% All Other Loans 67.2% $14.6B Total Loans Non-Owner-Occupied CRE By Type Numbers may not foot due to rounding. |
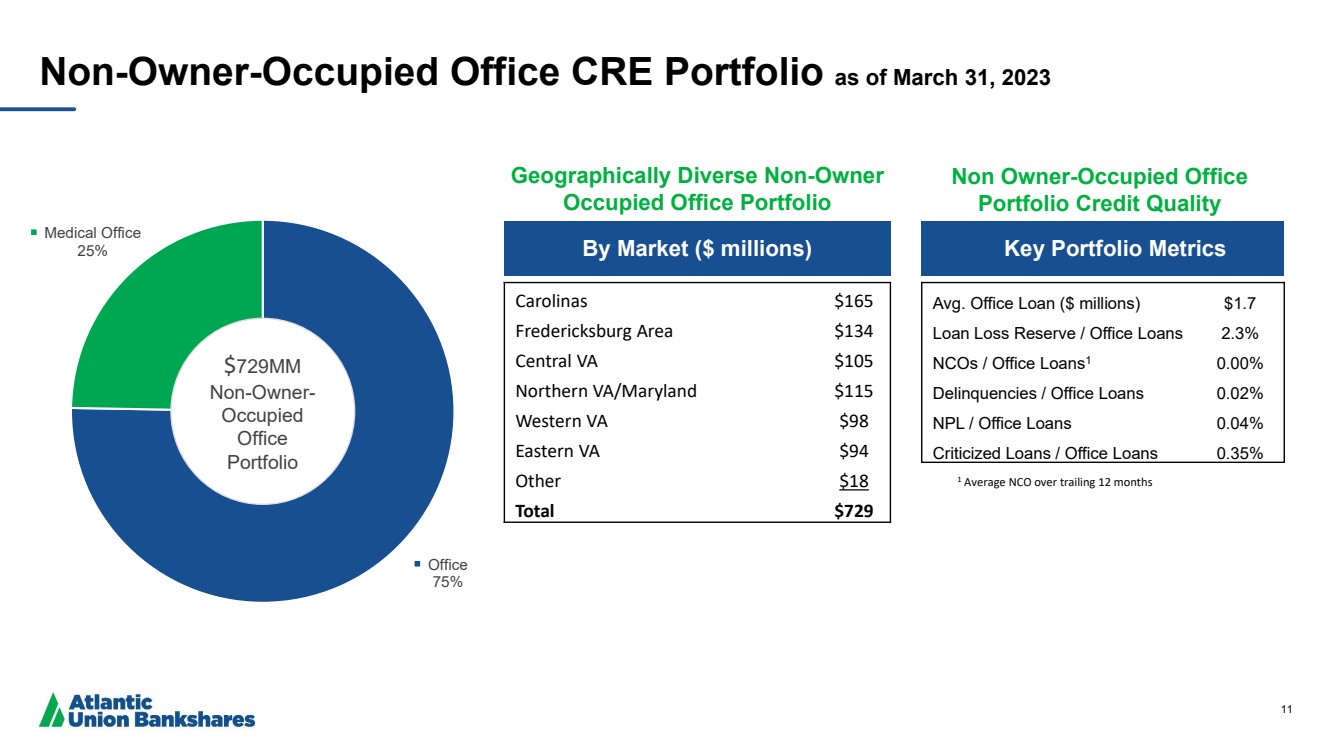
| 11 Office 75% Medical Office 25% By Market ($ millions) Key Portfolio Metrics Carolinas $165 Fredericksburg Area $134 Central VA $105 Northern VA/Maryland $115 Western VA $98 Eastern VA $94 Other $18 Total $729 Avg. Office Loan ($ millions) $1.7 Loan Loss Reserve / Office Loans 2.3% NCOs / Office Loans1 0.00% Delinquencies / Office Loans 0.02% NPL / Office Loans 0.04% Criticized Loans / Office Loans 0.35% Non-Owner-Occupied Office CRE Portfolio as of March 31, 2023 $729MM Non-Owner-Occupied Office Portfolio Non Owner-Occupied Office Portfolio Credit Quality Geographically Diverse Non-Owner Occupied Office Portfolio 1 Average NCO over trailing 12 months |
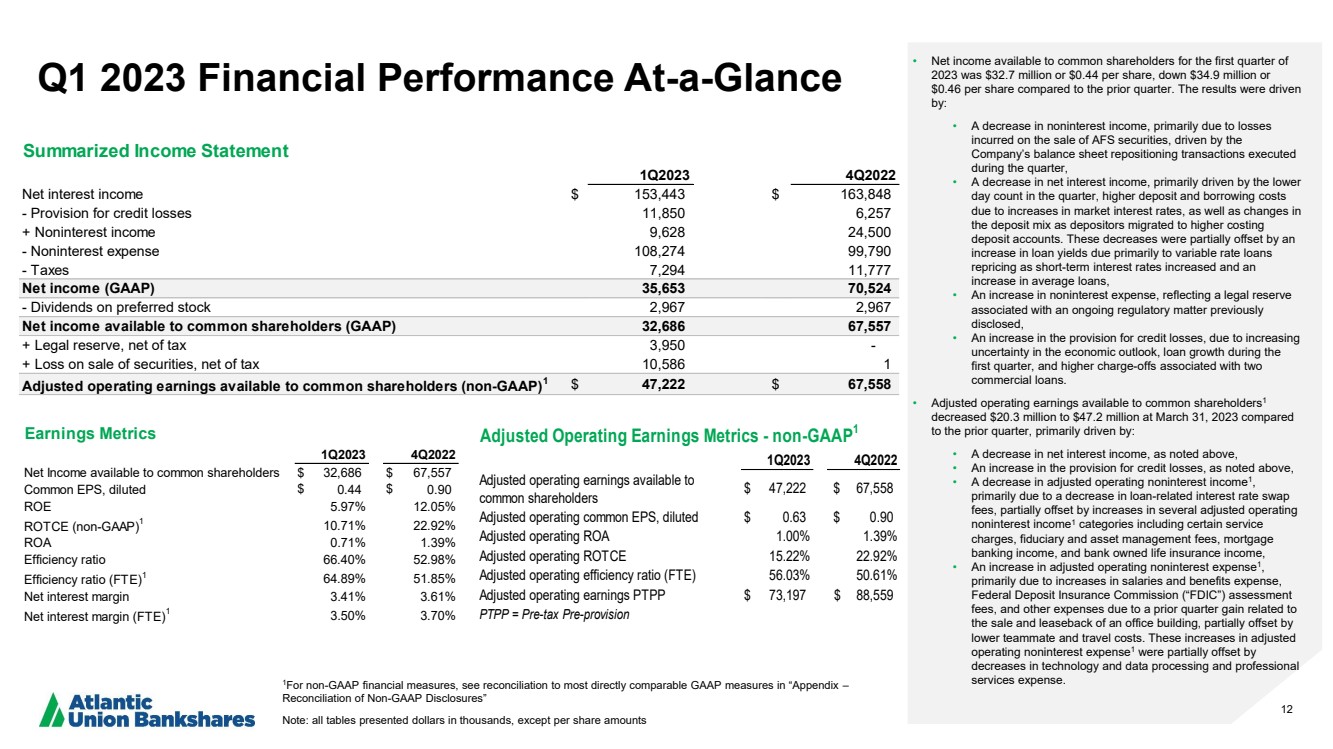
| 12 Q1 2023 Financial Performance At-a-Glance 1For non-GAAP financial measures, see reconciliation to most directly comparable GAAP measures in “Appendix – Reconciliation of Non-GAAP Disclosures” Note: all tables presented dollars in thousands, except per share amounts • Net income available to common shareholders for the first quarter of 2023 was $32.7 million or $0.44 per share, down $34.9 million or $0.46 per share compared to the prior quarter. The results were driven by: • A decrease in noninterest income, primarily due to losses incurred on the sale of AFS securities, driven by the Company’s balance sheet repositioning transactions executed during the quarter, • A decrease in net interest income, primarily driven by the lower day count in the quarter, higher deposit and borrowing costs due to increases in market interest rates, as well as changes in the deposit mix as depositors migrated to higher costing deposit accounts. These decreases were partially offset by an increase in loan yields due primarily to variable rate loans repricing as short-term interest rates increased and an increase in average loans, • An increase in noninterest expense, reflecting a legal reserve associated with an ongoing regulatory matter previously disclosed, • An increase in the provision for credit losses, due to increasing uncertainty in the economic outlook, loan growth during the first quarter, and higher charge-offs associated with two commercial loans. • Adjusted operating earnings available to common shareholders1 decreased $20.3 million to $47.2 million at March 31, 2023 compared to the prior quarter, primarily driven by: • A decrease in net interest income, as noted above, • An increase in the provision for credit losses, as noted above, • A decrease in adjusted operating noninterest income1 , primarily due to a decrease in loan-related interest rate swap fees, partially offset by increases in several adjusted operating noninterest income1 categories including certain service charges, fiduciary and asset management fees, mortgage banking income, and bank owned life insurance income, • An increase in adjusted operating noninterest expense1 , primarily due to increases in salaries and benefits expense, Federal Deposit Insurance Commission (“FDIC”) assessment fees, and other expenses due to a prior quarter gain related to the sale and leaseback of an office building, partially offset by lower teammate and travel costs. These increases in adjusted operating noninterest expense1 were partially offset by decreases in technology and data processing and professional services expense. 1Q2023 4Q2022 Net Income available to common shareholders $ 32,686 $ 67,557 Common EPS, diluted $ 0.44 $ 0.90 ROE 5.97% 12.05% ROTCE (non-GAAP)1 10.71% 22.92% ROA 0.71% 1.39% Efficiency ratio 66.40% 52.98% Efficiency ratio (FTE)1 64.89% 51.85% Net interest margin 3.41% 3.61% Net interest margin (FTE)1 3.50% 3.70% Earnings Metrics 1Q2023 4Q2022 Net Interest Income Net interest income $ 153,443 $ 163,848 Provision for credit losses - Provision for credit losses 11,850 6,257 Total noninterest income + Noninterest income 9,628 24,500 Total noninterest expenses - Noninterest expense 108,274 99,790 Income tax expense - Taxes 7,294 11,777 Net income (GAAP) 35,653 70,524 - Dividends on preferred stock 2,967 2,967 Net income available to common shareholders (GAAP) 32,686 67,557 + Legal reserve, net of tax 3,950 - Gains on securities transactions, net + Loss on sale of securities, net of tax 10,586 1 Adjusted operating earnings available to common shareholders (non-GAAP)1 $ 47,222 $ 67,558 Summarized Income Statement 1Q2023 4Q2022 Adjusted operating earnings available to common shareholders $ 47,222 $ 67,558 Adjusted operating common EPS, diluted $ 0.63 $ 0.90 Adjusted operating ROA 1.00% 1.39% Adjusted operating ROTCE 15.22% 22.92% Adjusted operating efficiency ratio (FTE) 56.03% 50.61% Adjusted operating earnings PTPP $ 73,197 $ 88,559 PTPP = Pre-tax Pre-provision Adjusted Operating Earnings Metrics - non-GAAP1 |
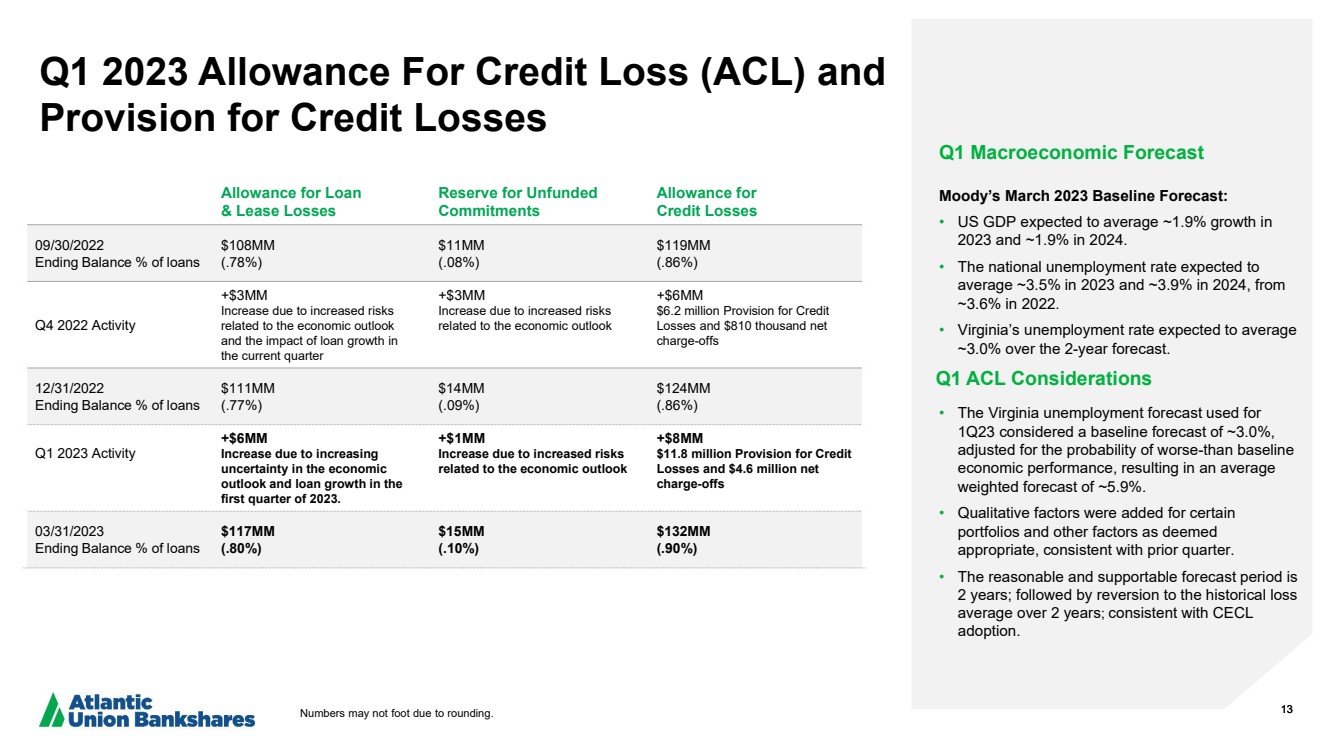
| 13 Q1 2023 Allowance For Credit Loss (ACL) and Provision for Credit Losses Q1 Macroeconomic Forecast Moody’s March 2023 Baseline Forecast: • US GDP expected to average ~1.9% growth in 2023 and ~1.9% in 2024. • The national unemployment rate expected to average ~3.5% in 2023 and ~3.9% in 2024, from ~3.6% in 2022. • Virginia’s unemployment rate expected to average ~3.0% over the 2-year forecast. Q1 ACL Considerations • The Virginia unemployment forecast used for 1Q23 considered a baseline forecast of ~3.0%, adjusted for the probability of worse-than baseline economic performance, resulting in an average weighted forecast of ~5.9%. • Qualitative factors were added for certain portfolios and other factors as deemed appropriate, consistent with prior quarter. • The reasonable and supportable forecast period is 2 years; followed by reversion to the historical loss average over 2 years; consistent with CECL adoption. Allowance for Loan & Lease Losses Reserve for Unfunded Commitments Allowance for Credit Losses 09/30/2022 Ending Balance % of loans $108MM (.78%) $11MM (.08%) $119MM (.86%) Q4 2022 Activity +$3MM Increase due to increased risks related to the economic outlook and the impact of loan growth in the current quarter +$3MM Increase due to increased risks related to the economic outlook +$6MM $6.2 million Provision for Credit Losses and $810 thousand net charge-offs 12/31/2022 Ending Balance % of loans $111MM (.77%) $14MM (.09%) $124MM (.86%) Q1 2023 Activity +$6MM Increase due to increasing uncertainty in the economic outlook and loan growth in the first quarter of 2023. +$1MM Increase due to increased risks related to the economic outlook +$8MM $11.8 million Provision for Credit Losses and $4.6 million net charge-offs 03/31/2023 Ending Balance % of loans $117MM (.80%) $15MM (.10%) $132MM (.90%) Numbers may not foot due to rounding. |
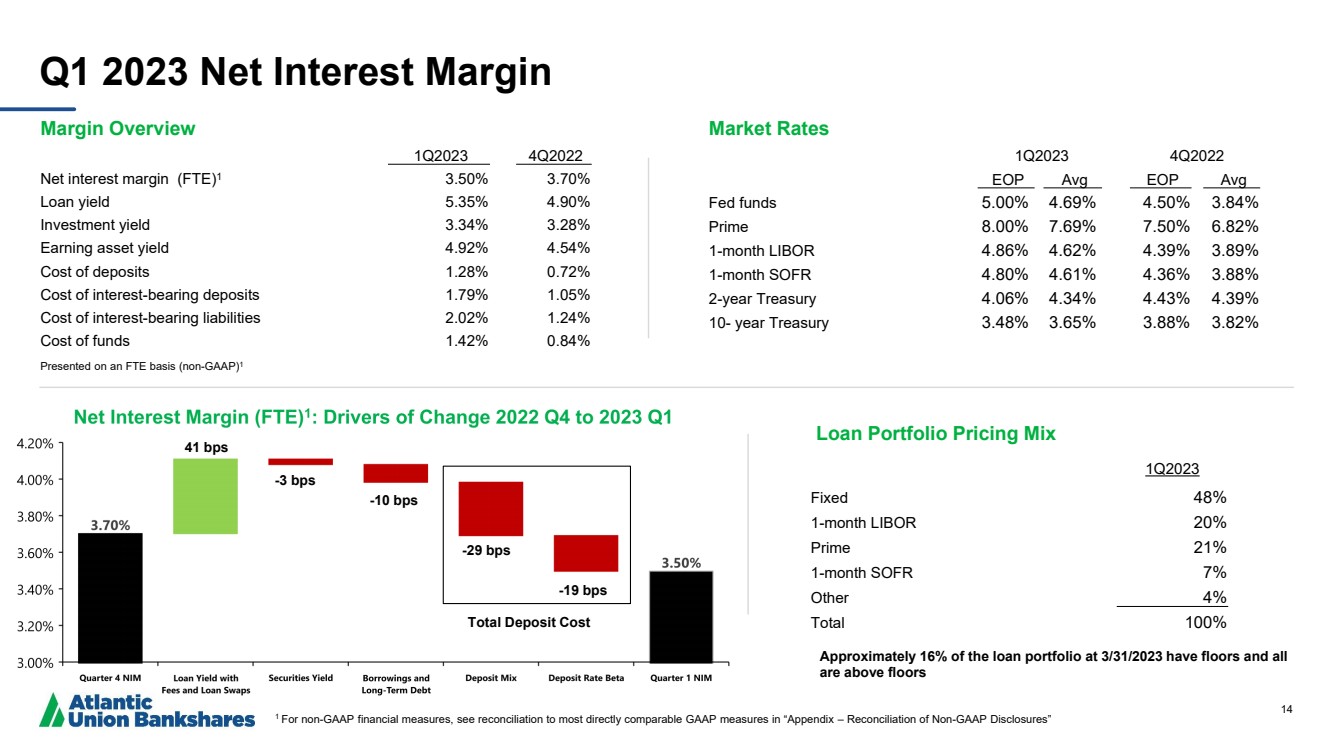
| 14 Q1 2023 Net Interest Margin Market Rates 1Q2023 4Q2022 EOP Avg EOP Avg Fed funds 5.00% 4.69% 4.50% 3.84% Prime 8.00% 7.69% 7.50% 6.82% 1-month LIBOR 4.86% 4.62% 4.39% 3.89% 1-month SOFR 4.80% 4.61% 4.36% 3.88% 2-year Treasury 4.06% 4.34% 4.43% 4.39% 10- year Treasury 3.48% 3.65% 3.88% 3.82% Margin Overview 1Q2023 4Q2022 Net interest margin (FTE)1 3.50% 3.70% Loan yield 5.35% 4.90% Investment yield 3.34% 3.28% Earning asset yield 4.92% 4.54% Cost of deposits 1.28% 0.72% Cost of interest-bearing deposits 1.79% 1.05% Cost of interest-bearing liabilities 2.02% 1.24% Cost of funds 1.42% 0.84% Presented on an FTE basis (non-GAAP)1 Approximately 16% of the loan portfolio at 3/31/2023 have floors and all are above floors Loan Portfolio Pricing Mix 1Q2023 Fixed 48% 1-month LIBOR 20% Prime 21% 1-month SOFR 7% Other 4% Total 100% 1 For non-GAAP financial measures, see reconciliation to most directly comparable GAAP measures in “Appendix – Reconciliation of Non-GAAP Disclosures” 41 bps -3 bps -10 bps -29 bps -19 bps Total Deposit Cost |
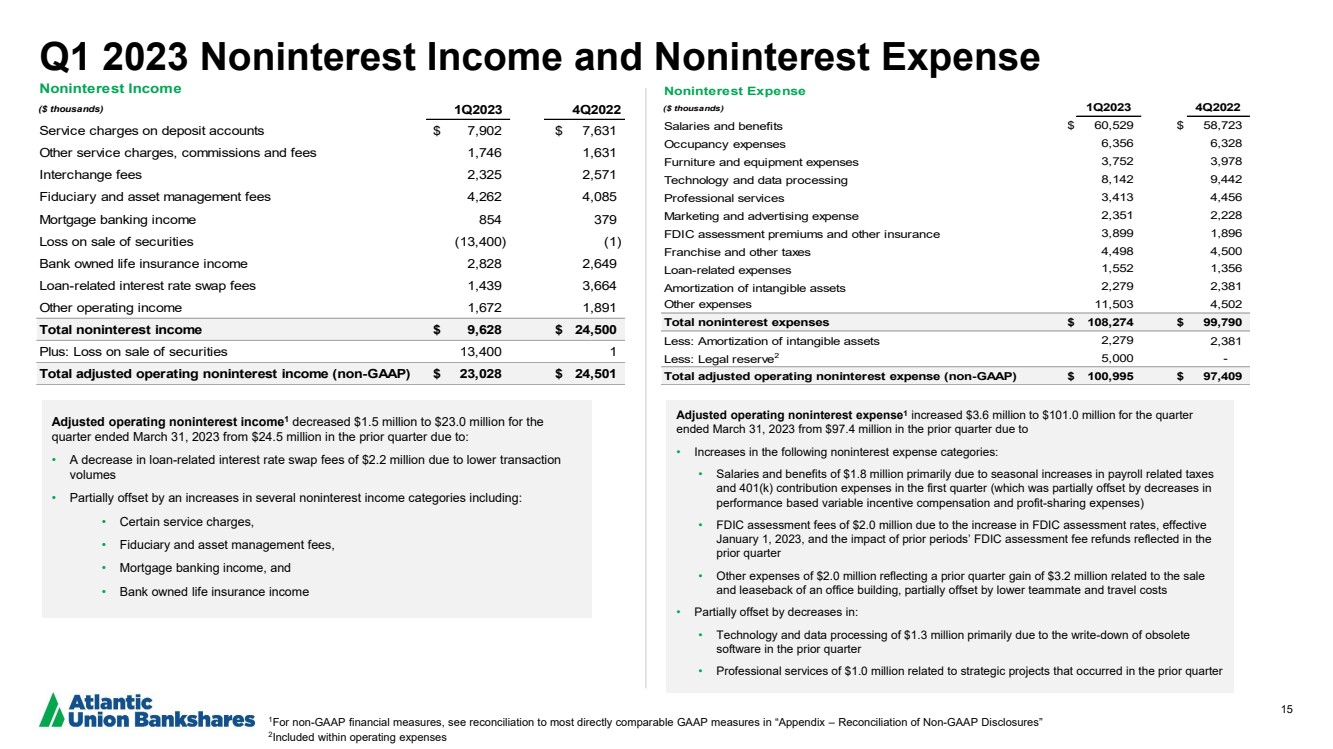
| 15 Q1 2023 Noninterest Income and Noninterest Expense Adjusted operating noninterest income1 decreased $1.5 million to $23.0 million for the quarter ended March 31, 2023 from $24.5 million in the prior quarter due to: • A decrease in loan-related interest rate swap fees of $2.2 million due to lower transaction volumes • Partially offset by an increases in several noninterest income categories including: • Certain service charges, • Fiduciary and asset management fees, • Mortgage banking income, and • Bank owned life insurance income Adjusted operating noninterest expense1 increased $3.6 million to $101.0 million for the quarter ended March 31, 2023 from $97.4 million in the prior quarter due to • Increases in the following noninterest expense categories: • Salaries and benefits of $1.8 million primarily due to seasonal increases in payroll related taxes and 401(k) contribution expenses in the first quarter (which was partially offset by decreases in performance based variable incentive compensation and profit-sharing expenses) • FDIC assessment fees of $2.0 million due to the increase in FDIC assessment rates, effective January 1, 2023, and the impact of prior periods’ FDIC assessment fee refunds reflected in the prior quarter • Other expenses of $2.0 million reflecting a prior quarter gain of $3.2 million related to the sale and leaseback of an office building, partially offset by lower teammate and travel costs • Partially offset by decreases in: • Technology and data processing of $1.3 million primarily due to the write-down of obsolete software in the prior quarter • Professional services of $1.0 million related to strategic projects that occurred in the prior quarter 1For non-GAAP financial measures, see reconciliation to most directly comparable GAAP measures in “Appendix – Reconciliation of Non-GAAP Disclosures” 2 Included within operating expenses Noninterest Income ($ thousands) 1Q2023 4Q2022 Service charges on deposit accounts $ 7,902 $ 7,631 Other service charges, commissions and fees 1,746 1,631 Interchange fees 2,325 2,571 Fiduciary and asset management fees 4,262 4,085 Mortgage banking income 854 379 Loss on sale of securities (13,400) (1) Bank owned life insurance income 2,828 2,649 Loan-related interest rate swap fees 1,439 3,664 Other operating income 1,672 1,891 Total noninterest income $ 9,628 $ 24,500 Plus: Loss on sale of securities 13,400 1 Total adjusted operating noninterest income (non-GAAP) $ 23,028 $ 24,501 Noninterest Expense ($ thousands) 1Q2023 4Q2022 Salaries and benefits $ 60,529 $ 58,723 Occupancy expenses 6,356 6,328 Furniture and equipment expenses 3,752 3,978 Technology and data processing 8,142 9,442 Professional services 3,413 4,456 Marketing and advertising expense 2,351 2,228 FDIC assessment premiums and other insurance 3,899 1,896 Franchise and other taxes 4,498 4,500 Loan-related expenses 1,552 1,356 Amortization of intangible assets 2,279 2,381 Other expenses 11,503 4,502 Total noninterest expenses $ 108,274 $ 99,790 Less: Amortization of intangible assets 2,279 2,381 Less: Legal reserve2 5,000 - Total adjusted operating noninterest expense (non-GAAP) $ 100,995 $ 97,409 |
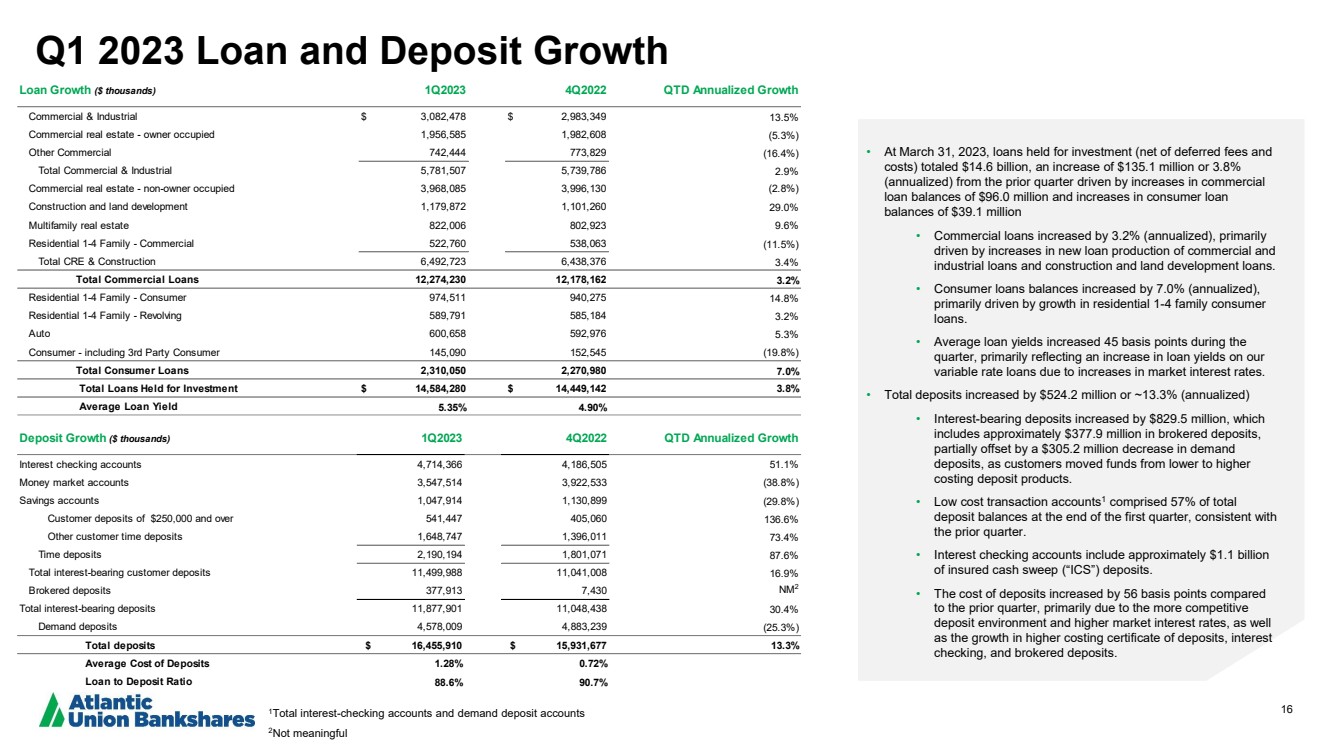
| 16 Q1 2023 Loan and Deposit Growth • At March 31, 2023, loans held for investment (net of deferred fees and costs) totaled $14.6 billion, an increase of $135.1 million or 3.8% (annualized) from the prior quarter driven by increases in commercial loan balances of $96.0 million and increases in consumer loan balances of $39.1 million • Commercial loans increased by 3.2% (annualized), primarily driven by increases in new loan production of commercial and industrial loans and construction and land development loans. • Consumer loans balances increased by 7.0% (annualized), primarily driven by growth in residential 1-4 family consumer loans. • Average loan yields increased 45 basis points during the quarter, primarily reflecting an increase in loan yields on our variable rate loans due to increases in market interest rates. • Total deposits increased by $524.2 million or ~13.3% (annualized) • Interest-bearing deposits increased by $829.5 million, which includes approximately $377.9 million in brokered deposits, partially offset by a $305.2 million decrease in demand deposits, as customers moved funds from lower to higher costing deposit products. • Low cost transaction accounts1 comprised 57% of total deposit balances at the end of the first quarter, consistent with the prior quarter. • Interest checking accounts include approximately $1.1 billion of insured cash sweep (“ICS”) deposits. • The cost of deposits increased by 56 basis points compared to the prior quarter, primarily due to the more competitive deposit environment and higher market interest rates, as well as the growth in higher costing certificate of deposits, interest checking, and brokered deposits. Loan Growth ($ thousands) 1Q2023 4Q2022 QTD Annualized Growth Commercial & Industrial $ 3,082,478 $ 2,983,349 13.5% Commercial real estate - owner occupied 1,956,585 1,982,608 (5.3%) Other Commercial 742,444 773,829 (16.4%) Total Commercial & Industrial 5,781,507 5,739,786 2.9% Commercial real estate - non-owner occupied 3,968,085 3,996,130 (2.8%) Construction and land development 1,179,872 1,101,260 29.0% Multifamily real estate 822,006 802,923 9.6% Residential 1-4 Family - Commercial 522,760 538,063 (11.5%) Total CRE & Construction 6,492,723 6,438,376 3.4% Total Commercial Loans 12,274,230 12,178,162 3.2% Residential 1-4 Family - Consumer 974,511 940,275 14.8% Residential 1-4 Family - Revolving 589,791 585,184 3.2% Auto 600,658 592,976 5.3% Consumer - including 3rd Party Consumer 145,090 152,545 (19.8%) Total Consumer Loans 2,310,050 2,270,980 7.0% Total Loans Held for Investment $ 14,584,280 $ 14,449,142 3.8% Average Loan Yield 5.35% 4.90% 1Total interest-checking accounts and demand deposit accounts 2Not meaningful Deposit Growth ($ thousands) 1Q2023 4Q2022 QTD Annualized Growth Interest checking accounts 4,714,366 4,186,505 51.1% Money market accounts 3,547,514 3,922,533 (38.8%) Savings accounts 1,047,914 1,130,899 (29.8%) Customer deposits of $250,000 and over 541,447 405,060 136.6% Other customer time deposits 1,648,747 1,396,011 73.4% Time deposits 2,190,194 1,801,071 87.6% Total interest-bearing customer deposits 11,499,988 11,041,008 16.9% Brokered deposits 377,913 7,430 NM2 Total interest-bearing deposits 11,877,901 11,048,438 30.4% Demand deposits 4,578,009 4,883,239 (25.3%) Total deposits $ 16,455,910 $ 15,931,677 13.3% Average Cost of Deposits 1.28% 0.72% Loan to Deposit Ratio 88.6% 90.7% |
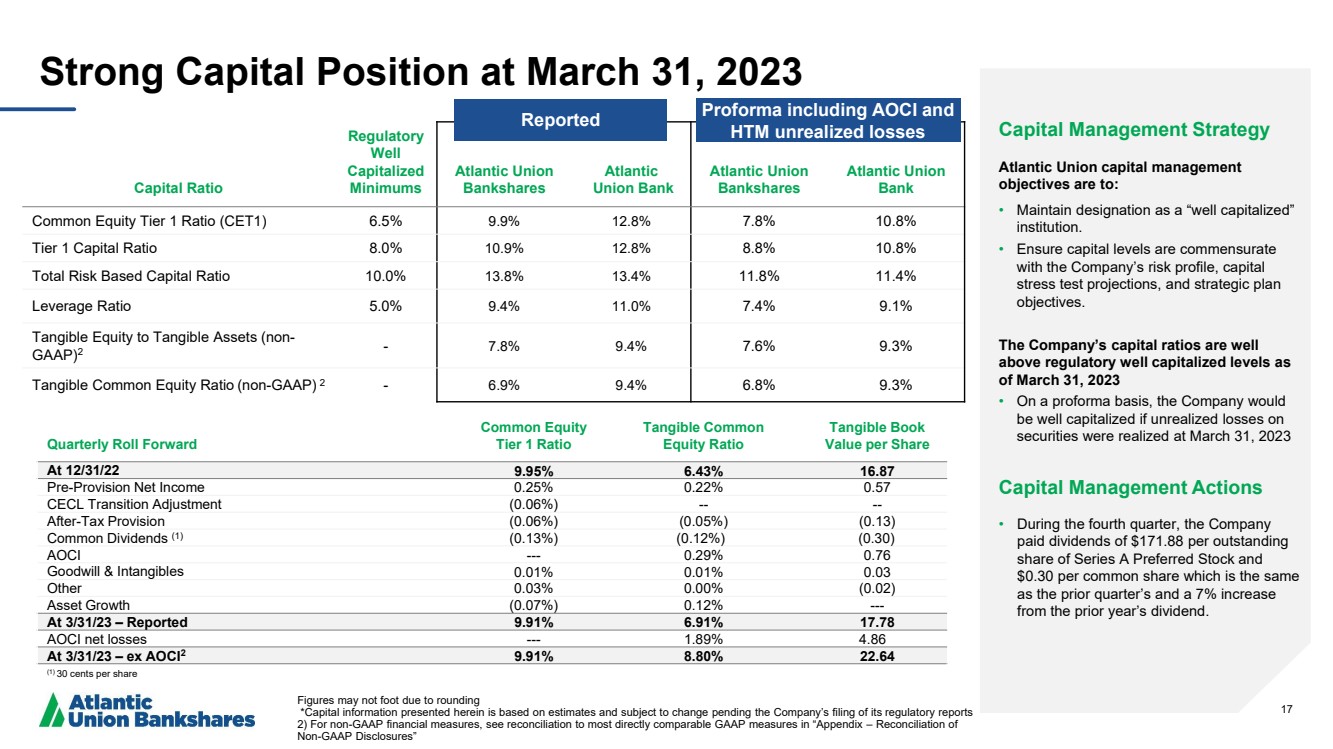
| 17 Capital Ratio Regulatory Well Capitalized Minimums Atlantic Union Bankshares Atlantic Union Bank Atlantic Union Bankshares Atlantic Union Bank Common Equity Tier 1 Ratio (CET1) 6.5% 9.9% 12.8% 7.8% 10.8% Tier 1 Capital Ratio 8.0% 10.9% 12.8% 8.8% 10.8% Total Risk Based Capital Ratio 10.0% 13.8% 13.4% 11.8% 11.4% Leverage Ratio 5.0% 9.4% 11.0% 7.4% 9.1% Tangible Equity to Tangible Assets (non-GAAP)2 - 7.8% 9.4% 7.6% 9.3% Tangible Common Equity Ratio (non-GAAP) 2 - 6.9% 9.4% 6.8% 9.3% Strong Capital Position at March 31, 2023 Figures may not foot due to rounding *Capital information presented herein is based on estimates and subject to change pending the Company’s filing of its regulatory reports 2) For non-GAAP financial measures, see reconciliation to most directly comparable GAAP measures in “Appendix – Reconciliation of Non-GAAP Disclosures” Capital Management Strategy Atlantic Union capital management objectives are to: • Maintain designation as a “well capitalized” institution. • Ensure capital levels are commensurate with the Company’s risk profile, capital stress test projections, and strategic plan objectives. The Company’s capital ratios are well above regulatory well capitalized levels as of March 31, 2023 • On a proforma basis, the Company would be well capitalized if unrealized losses on securities were realized at March 31, 2023 Capital Management Actions • During the fourth quarter, the Company paid dividends of $171.88 per outstanding share of Series A Preferred Stock and $0.30 per common share which is the same as the prior quarter’s and a 7% increase from the prior year’s dividend. Quarterly Roll Forward Common Equity Tier 1 Ratio Tangible Common Equity Ratio Tangible Book Value per Share At 12/31/22 9.95% 6.43% 16.87 Pre-Provision Net Income 0.25% 0.22% 0.57 CECL Transition Adjustment (0.06%) -- -- After-Tax Provision (0.06%) (0.05%) (0.13) Common Dividends (1) (0.13%) (0.12%) (0.30) AOCI --- 0.29% 0.76 Goodwill & Intangibles 0.01% 0.01% 0.03 Other 0.03% 0.00% (0.02) Asset Growth (0.07%) 0.12% --- At 3/31/23 – Reported 9.91% 6.91% 17.78 AOCI net losses --- 1.89% 4.86 At 3/31/23 – ex AOCI2 9.91% 8.80% 22.64 (1) 30 cents per share Reported Proforma including AOCI and HTM unrealized losses |
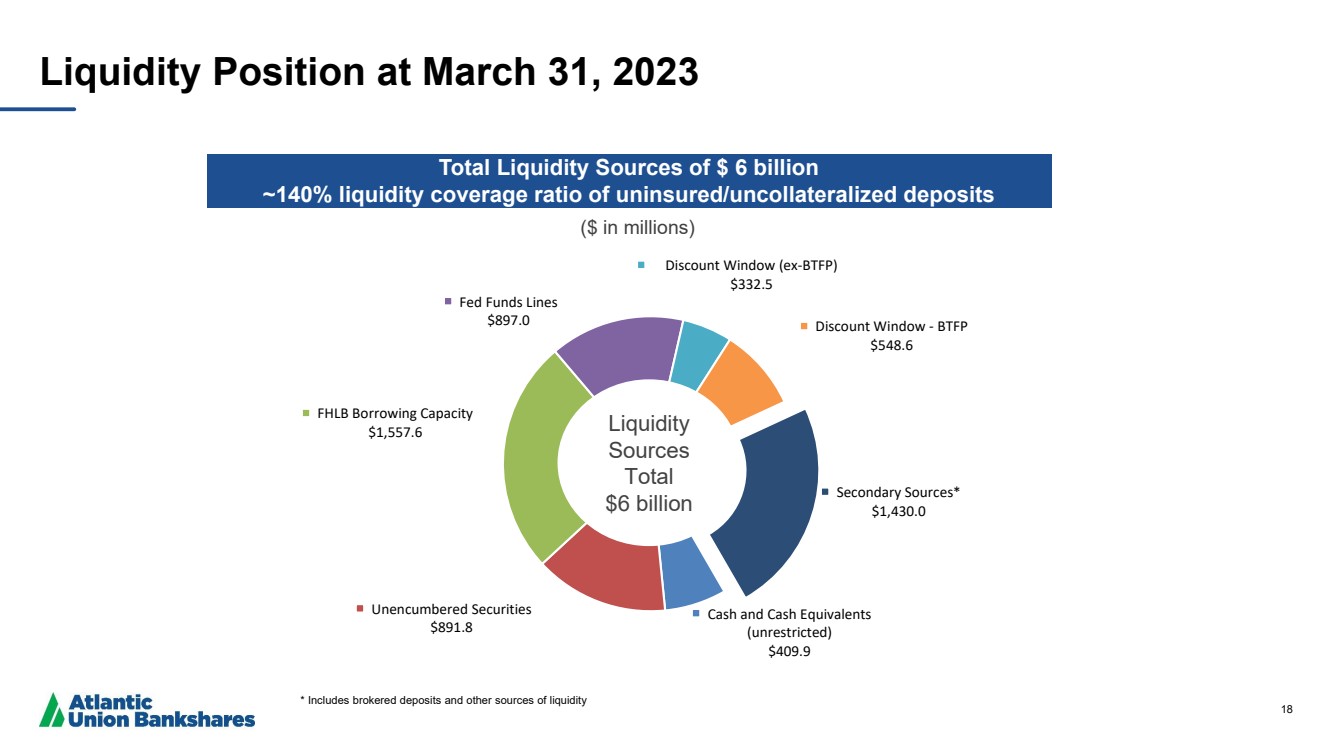
| 18 Cash and Cash Equivalents (unrestricted) $409.9 Unencumbered Securities $891.8 FHLB Borrowing Capacity $1,557.6 Fed Funds Lines $897.0 Discount Window (ex-BTFP) $332.5 Discount Window - BTFP $548.6 Secondary Sources* $1,430.0 ($ in millions) Liquidity Position at March 31, 2023 Total Liquidity Sources of $ 6 billion ~140% liquidity coverage ratio of uninsured/uncollateralized deposits * Includes brokered deposits and other sources of liquidity Liquidity Sources Total $6 billion |
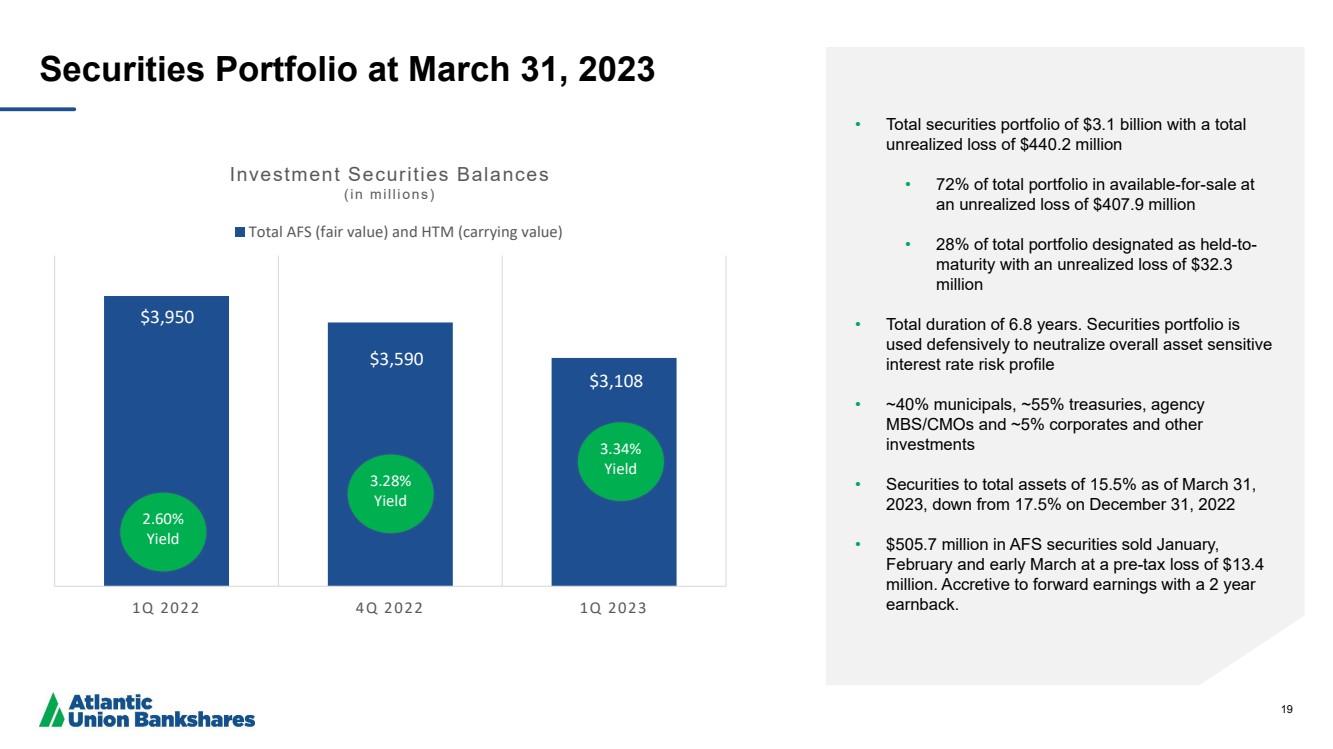
| 19 Securities Portfolio at March 31, 2023 • Total securities portfolio of $3.1 billion with a total unrealized loss of $440.2 million • 72% of total portfolio in available-for-sale at an unrealized loss of $407.9 million • 28% of total portfolio designated as held-to-maturity with an unrealized loss of $32.3 million • Total duration of 6.8 years. Securities portfolio is used defensively to neutralize overall asset sensitive interest rate risk profile • ~40% municipals, ~55% treasuries, agency MBS/CMOs and ~5% corporates and other investments • Securities to total assets of 15.5% as of March 31, 2023, down from 17.5% on December 31, 2022 • $505.7 million in AFS securities sold January, February and early March at a pre-tax loss of $13.4 million. Accretive to forward earnings with a 2 year earnback. $3,950 $3,590 $3,108 1Q 2022 4Q 2022 1Q 2023 Investment Securities Balances (in millions) Total AFS (fair value) and HTM (carrying value) 2.60% Yield 3.34% Yield 3.28% Yield |
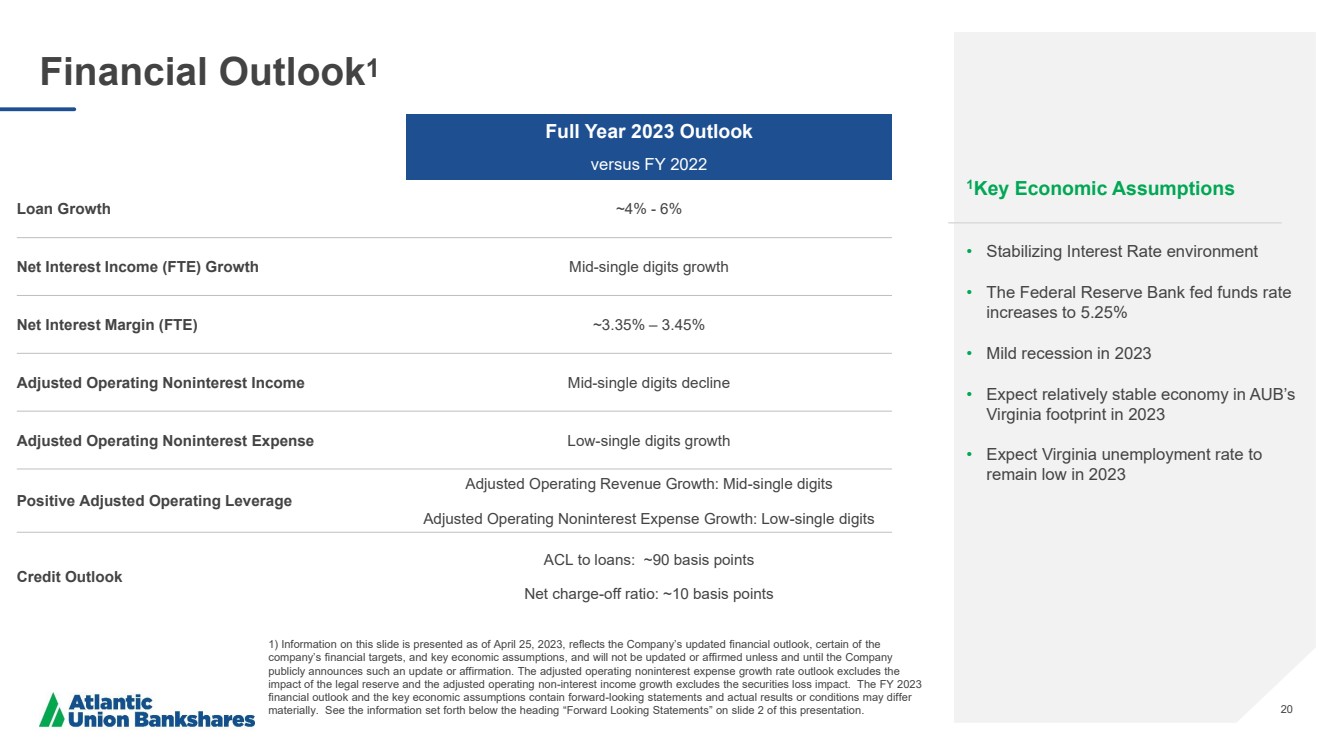
| 20 Financial Outlook1 1Key Economic Assumptions • Stabilizing Interest Rate environment • The Federal Reserve Bank fed funds rate increases to 5.25% • Mild recession in 2023 • Expect relatively stable economy in AUB’s Virginia footprint in 2023 • Expect Virginia unemployment rate to remain low in 2023 Full Year 2023 Outlook versus FY 2022 Loan Growth ~4% - 6% Net Interest Income (FTE) Growth Mid-single digits growth Net Interest Margin (FTE) ~3.35% – 3.45% Adjusted Operating Noninterest Income Mid-single digits decline Adjusted Operating Noninterest Expense Low-single digits growth Positive Adjusted Operating Leverage Adjusted Operating Revenue Growth: Mid-single digits Adjusted Operating Noninterest Expense Growth: Low-single digits Credit Outlook ACL to loans: ~90 basis points Net charge-off ratio: ~10 basis points 1) Information on this slide is presented as of April 25, 2023, reflects the Company’s updated financial outlook, certain of the company’s financial targets, and key economic assumptions, and will not be updated or affirmed unless and until the Company publicly announces such an update or affirmation. The adjusted operating noninterest expense growth rate outlook excludes the impact of the legal reserve and the adjusted operating non-interest income growth excludes the securities loss impact. The FY 2023 financial outlook and the key economic assumptions contain forward-looking statements and actual results or conditions may differ materially. See the information set forth below the heading “Forward Looking Statements” on slide 2 of this presentation. |
| 21 Appendix |

| 22 Reconciliation of Non-GAAP Disclosures The Company has provided supplemental performance measures on a tax-equivalent, tangible, operating, adjusted, or pre-tax pre-provision basis. These non-GAAP financial measures are a supplement to GAAP, which is used to prepare the Company’s financial statements, and should not be considered in isolation or as a substitute for comparable measures calculated in accordance with GAAP. In addition, the Company’s non-GAAP financial measures may not be comparable to non-GAAP financial measures of other companies. The Company uses the non-GAAP financial measures discussed herein in its analysis of the Company’s performance. The Company’s management believes that these non-GAAP financial measures provide additional understanding of ongoing operations, enhance comparability of results of operations with prior periods and show the effects of significant gains and charges in the periods presented without the impact of items or events that may obscure trends in the Company’s underlying performance. |
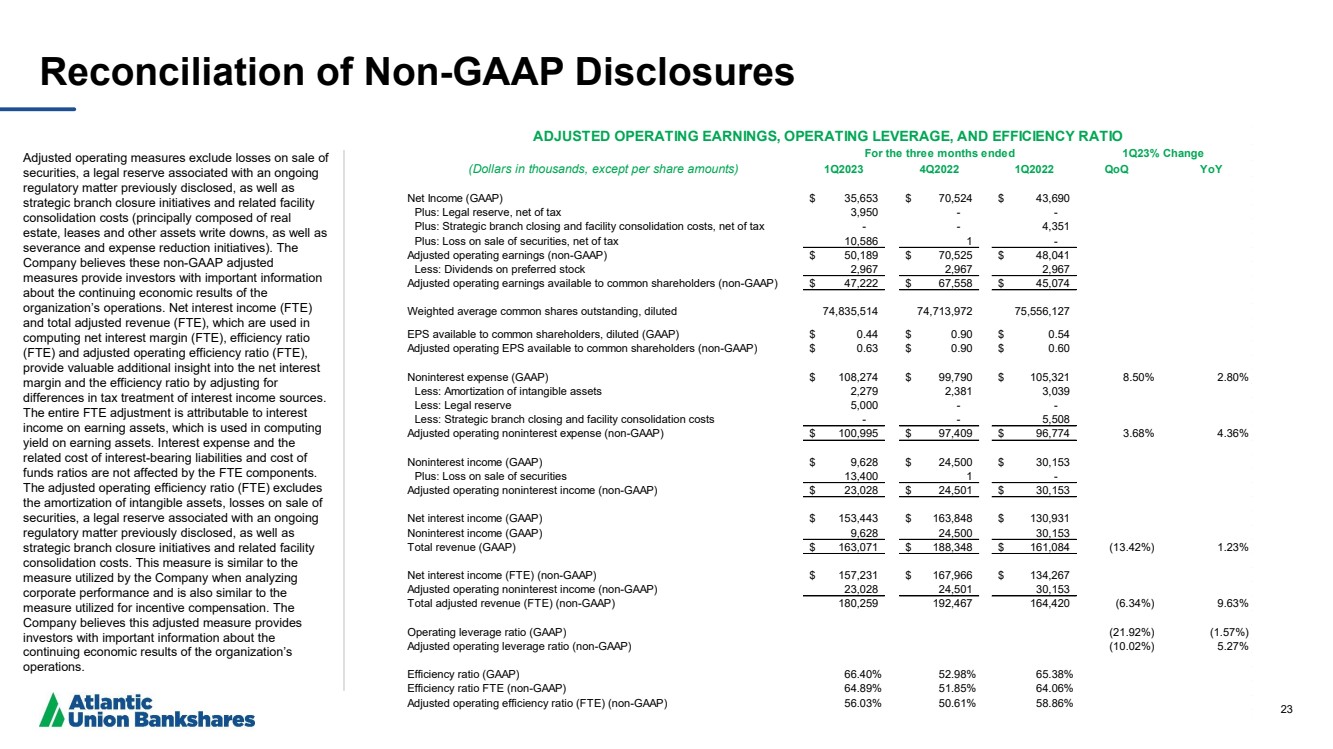
| 23 Reconciliation of Non -GAAP Disclosures Adjusted operating measures exclude losses on sale of securities, a legal reserve associated with an ongoing regulatory matter previously disclosed, as well as strategic branch closure initiatives and related facility consolidation costs (principally composed of real estate, leases and other assets write downs, as well as severance and expense reduction initiatives). The Company believes these non -GAAP adjusted measures provide investors with important information about the continuing economic results of the organization’s operations. Net interest income (FTE) and total adjusted revenue (FTE), which are used in computing net interest margin (FTE), efficiency ratio (FTE) and adjusted operating efficiency ratio (FTE), provide valuable additional insight into the net interest margin and the efficiency ratio by adjusting for differences in tax treatment of interest income sources. The entire FTE adjustment is attributable to interest income on earning assets, which is used in computing yield on earning assets. Interest expense and the related cost of interest -bearing liabilities and cost of funds ratios are not affected by the FTE components. The adjusted operating efficiency ratio (FTE) excludes the amortization of intangible assets, losses on sale of securities, a legal reserve associated with an ongoing regulatory matter previously disclosed, as well as strategic branch closure initiatives and related facility consolidation costs. This measure is similar to the measure utilized by the Company when analyzing corporate performance and is also similar to the measure utilized for incentive compensation. The Company believes this adjusted measure provides investors with important information about the continuing economic results of the organization’s operations. (Dollars in thousands, except per share amounts) 1Q2023 4Q2022 1Q2022 QoQ YoY Net Income (GAAP) $ 35,653 $ 70,524 $ 43,690 Plus: Legal reserve, net of tax 3,950 - - Plus: Strategic branch closing and facility consolidation costs, net of tax - - 4,351 Plus: Loss on sale of securities, net of tax 10,586 1 - Adjusted operating earnings (non-GAAP) $ 50,189 $ 70,525 $ 48,041 Less: Dividends on preferred stock 2,967 2,967 2,967 Adjusted operating earnings available to common shareholders (non-GAAP) $ 47,222 $ 67,558 $ 45,074 Weighted average common shares outstanding, diluted 74,835,514 74,713,972 75,556,127 EPS available to common shareholders, diluted (GAAP) $ 0.44 $ 0.90 $ 0.54 Adjusted operating EPS available to common shareholders (non-GAAP) $ 0.63 $ 0.90 $ 0.60 Noninterest expense (GAAP) $ 108,274 $ 99,790 $ 105,321 8.50% 2.80% Less: Amortization of intangible assets 2,279 2,381 3,039 Less: Legal reserve 5,000 - - Less: Strategic branch closing and facility consolidation costs - - 5,508 Adjusted operating noninterest expense (non-GAAP) $ 100,995 $ 97,409 $ 96,774 3.68% 4.36% Noninterest income (GAAP) $ 9,628 $ 24,500 $ 30,153 Plus: Loss on sale of securities 13,400 1 - Adjusted operating noninterest income (non-GAAP) $ 23,028 $ 24,501 $ 30,153 Net interest income (GAAP) $ 153,443 $ 163,848 $ 130,931 Noninterest income (GAAP) 9,628 24,500 30,153 Total revenue (GAAP) $ 163,071 $ 188,348 $ 161,084 (13.42%) 1.23% Net interest income (FTE) (non-GAAP) $ 157,231 $ 167,966 $ 134,267 Adjusted operating noninterest income (non-GAAP) 23,028 24,501 30,153 Total adjusted revenue (FTE) (non-GAAP) 180,259 192,467 164,420 (6.34%) 9.63% Operating leverage ratio (GAAP) (21.92%) (1.57%) Adjusted operating leverage ratio (non-GAAP) (10.02%) 5.27% Efficiency ratio (GAAP) 66.40% 52.98% 65.38% Efficiency ratio FTE (non-GAAP) 64.89% 51.85% 64.06% Adjusted operating efficiency ratio (FTE) (non-GAAP) 56.03% 50.61% 58.86% 1Q23% Change ADJUSTED OPERATING EARNINGS, OPERATING LEVERAGE, AND EFFICIENCY RATIO For the three months ended |
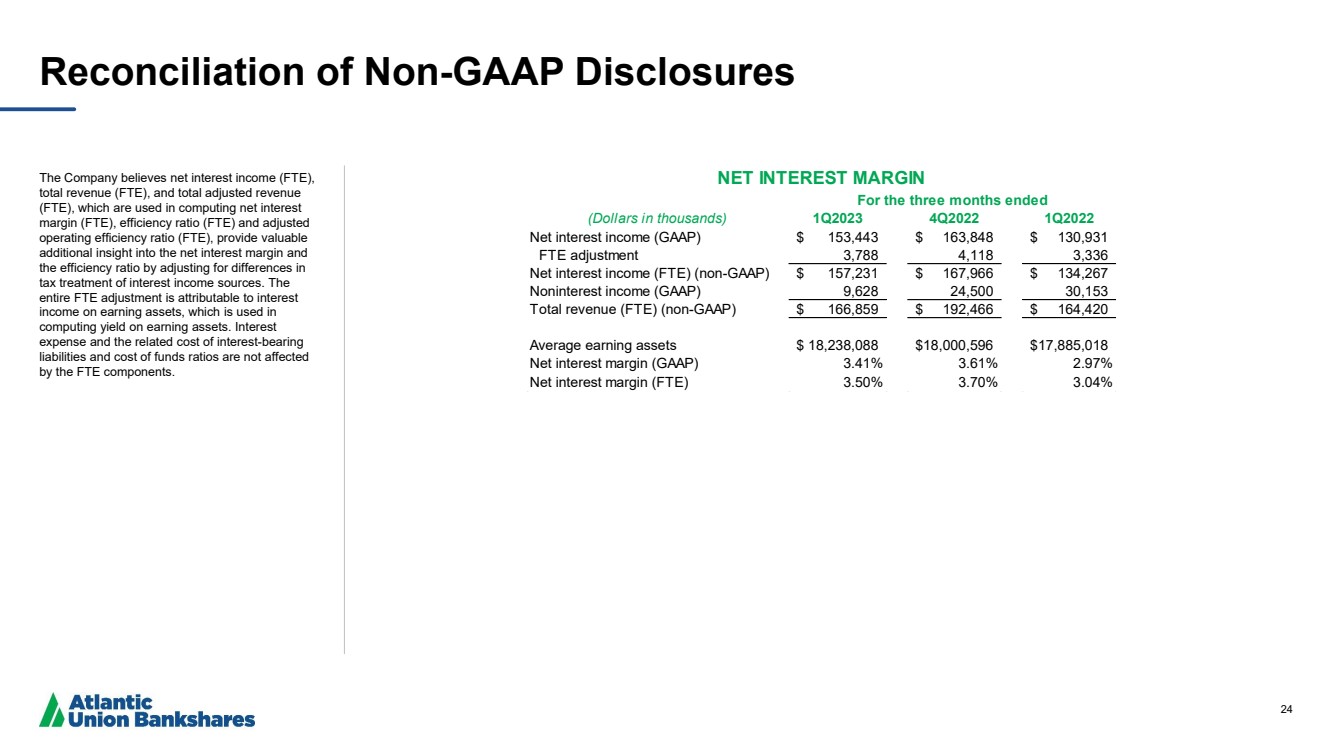
| 24 Reconciliation of Non-GAAP Disclosures The Company believes net interest income (FTE), total revenue (FTE), and total adjusted revenue (FTE), which are used in computing net interest margin (FTE), efficiency ratio (FTE) and adjusted operating efficiency ratio (FTE), provide valuable additional insight into the net interest margin and the efficiency ratio by adjusting for differences in tax treatment of interest income sources. The entire FTE adjustment is attributable to interest income on earning assets, which is used in computing yield on earning assets. Interest expense and the related cost of interest-bearing liabilities and cost of funds ratios are not affected by the FTE components. (Dollars in thousands) 1Q2023 4Q2022 1Q2022 Net interest income (GAAP) $ 153,443 $ 163,848 $ 130,931 FTE adjustment 3,788 4,118 3,336 Net interest income (FTE) (non-GAAP) $ 157,231 $ 167,966 $ 134,267 Noninterest income (GAAP) 9,628 24,500 30,153 Total revenue (FTE) (non-GAAP) $ 166,859 $ 192,466 $ 164,420 Average earning assets $ 18,238,088 $18,000,596 $17,885,018 Net interest margin (GAAP) 3.41% 3.61% 2.97% Net interest margin (FTE) 3.50% 3.70% 3.04% NET INTEREST MARGIN For the three months ended |
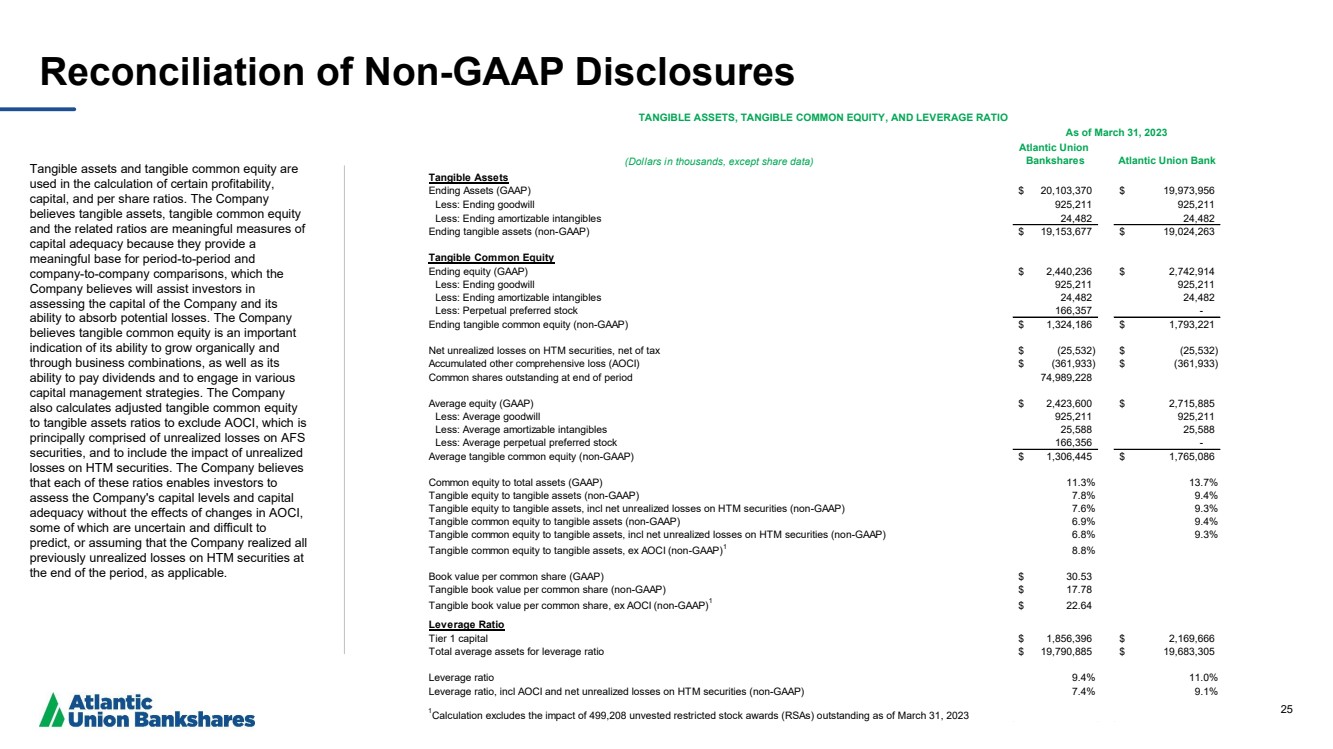
| 25 Reconciliation of Non-GAAP Disclosures Tangible assets and tangible common equity are used in the calculation of certain profitability, capital, and per share ratios. The Company believes tangible assets, tangible common equity and the related ratios are meaningful measures of capital adequacy because they provide a meaningful base for period-to-period and company-to-company comparisons, which the Company believes will assist investors in assessing the capital of the Company and its ability to absorb potential losses. The Company believes tangible common equity is an important indication of its ability to grow organically and through business combinations, as well as its ability to pay dividends and to engage in various capital management strategies. The Company also calculates adjusted tangible common equity to tangible assets ratios to exclude AOCI, which is principally comprised of unrealized losses on AFS securities, and to include the impact of unrealized losses on HTM securities. The Company believes that each of these ratios enables investors to assess the Company's capital levels and capital adequacy without the effects of changes in AOCI, some of which are uncertain and difficult to predict, or assuming that the Company realized all previously unrealized losses on HTM securities at the end of the period, as applicable. (Dollars in thousands, except share data) Atlantic Union Bankshares Atlantic Union Bank Tangible Assets Ending Assets (GAAP) $ 20,103,370 $ 19,973,956 Less: Ending goodwill 925,211 925,211 Less: Ending amortizable intangibles 24,482 24,482 Ending tangible assets (non-GAAP) $ 19,153,677 $ 19,024,263 Tangible Common Equity Ending equity (GAAP) $ 2,440,236 $ 2,742,914 Less: Ending goodwill 925,211 925,211 Less: Ending amortizable intangibles 24,482 24,482 Less: Perpetual preferred stock 166,357 - Ending tangible common equity (non-GAAP) $ 1,324,186 $ 1,793,221 Net unrealized losses on HTM securities, net of tax $ (25,532) $ (25,532) Accumulated other comprehensive loss (AOCI) $ (361,933) $ (361,933) Common shares outstanding at end of period 74,989,228 Average equity (GAAP) $ 2,423,600 $ 2,715,885 Less: Average goodwill 925,211 925,211 Less: Average amortizable intangibles 25,588 25,588 Less: Average perpetual preferred stock 166,356 - Average tangible common equity (non-GAAP) $ 1,306,445 $ 1,765,086 Less: Perpetual preferred stock Common equity to total assets (GAAP) 11.3% 13.7% Tangible equity to tangible assets (non-GAAP) 7.8% 9.4% Tangible equity to tangible assets, incl net unrealized losses on HTM securities (non-GAAP) 7.6% 9.3% Tangible common equity to tangible assets (non-GAAP) 6.9% 9.4% Tangible common equity to tangible assets, incl net unrealized losses on HTM securities (non-GAAP) 6.8% 9.3% Tangible common equity to tangible assets, ex AOCI (non-GAAP)1 8.8% Book value per common share (GAAP) $ 30.53 Tangible book value per common share (non-GAAP) $ 17.78 Tangible book value per common share, ex AOCI (non-GAAP)1 $ 22.64 Leverage Ratio Tier 1 capital $ 1,856,396 $ 2,169,666 Total average assets for leverage ratio $ 19,790,885 $ 19,683,305 Leverage ratio 9.4% 11.0% Leverage ratio, incl AOCI and net unrealized losses on HTM securities (non-GAAP) 7.4% 9.1% 1Calculation excludes the impact of 499,208 unvested restricted stock awards (RSAs) outstanding as of March 31, 2023 TANGIBLE ASSETS, TANGIBLE COMMON EQUITY, AND LEVERAGE RATIO As of March 31, 2023 |
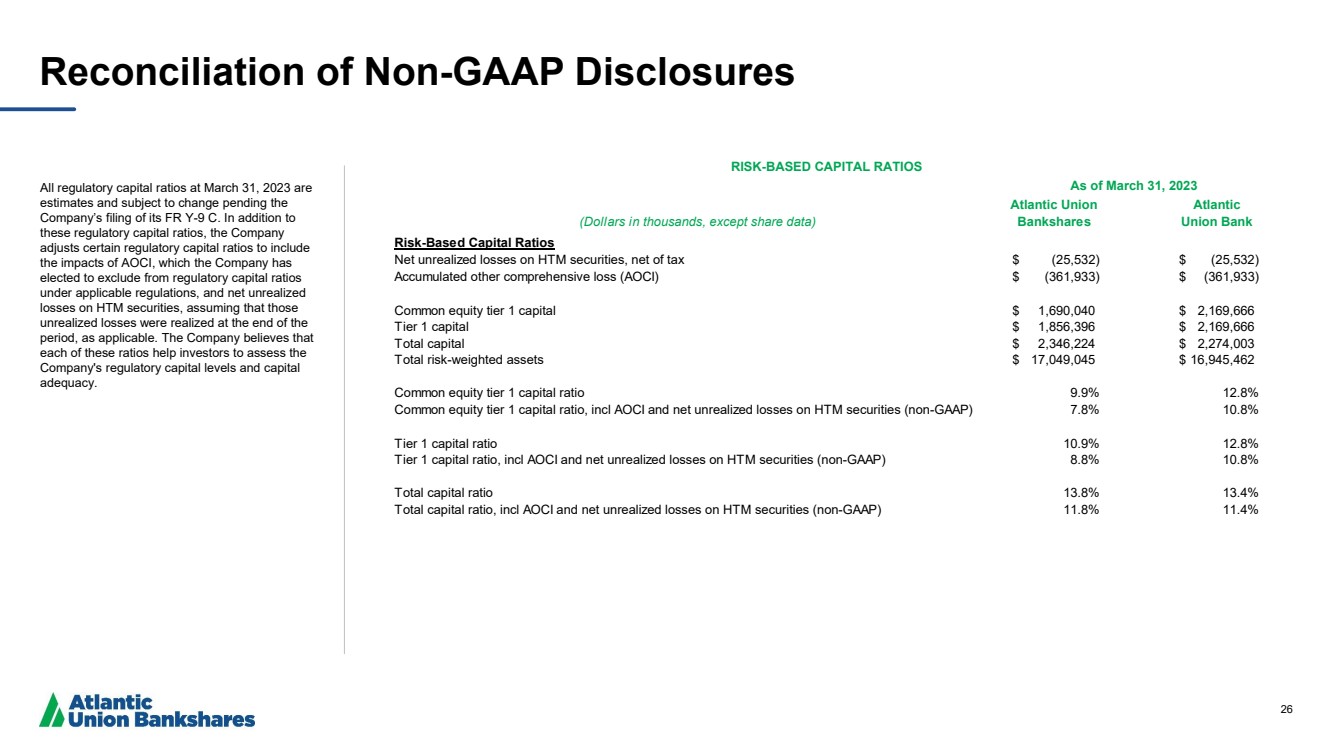
| 26 Reconciliation of Non-GAAP Disclosures All regulatory capital ratios at March 31, 2023 are estimates and subject to change pending the Company’s filing of its FR Y-9 C. In addition to these regulatory capital ratios, the Company adjusts certain regulatory capital ratios to include the impacts of AOCI, which the Company has elected to exclude from regulatory capital ratios under applicable regulations, and net unrealized losses on HTM securities, assuming that those unrealized losses were realized at the end of the period, as applicable. The Company believes that each of these ratios help investors to assess the Company's regulatory capital levels and capital adequacy. (Dollars in thousands, except share data) Atlantic Union Bankshares Atlantic Union Bank Risk-Based Capital Ratios Net unrealized losses on HTM securities, net of tax $ (25,532) $ (25,532) Accumulated other comprehensive loss (AOCI) $ (361,933) $ (361,933) Common equity tier 1 capital $ 1,690,040 $ 2,169,666 Tier 1 capital $ 1,856,396 $ 2,169,666 Total capital $ 2,346,224 $ 2,274,003 Total risk-weighted assets $ 17,049,045 $ 16,945,462 Common equity tier 1 capital ratio 9.9% 12.8% Common equity tier 1 capital ratio, incl AOCI and net unrealized losses on HTM securities (non-GAAP) 7.8% 10.8% Tier 1 capital ratio 10.9% 12.8% Tier 1 capital ratio, incl AOCI and net unrealized losses on HTM securities (non-GAAP) 8.8% 10.8% Total capital ratio 13.8% 13.4% Total capital ratio, incl AOCI and net unrealized losses on HTM securities (non-GAAP) 11.8% 11.4% RISK-BASED CAPITAL RATIOS As of March 31, 2023 |
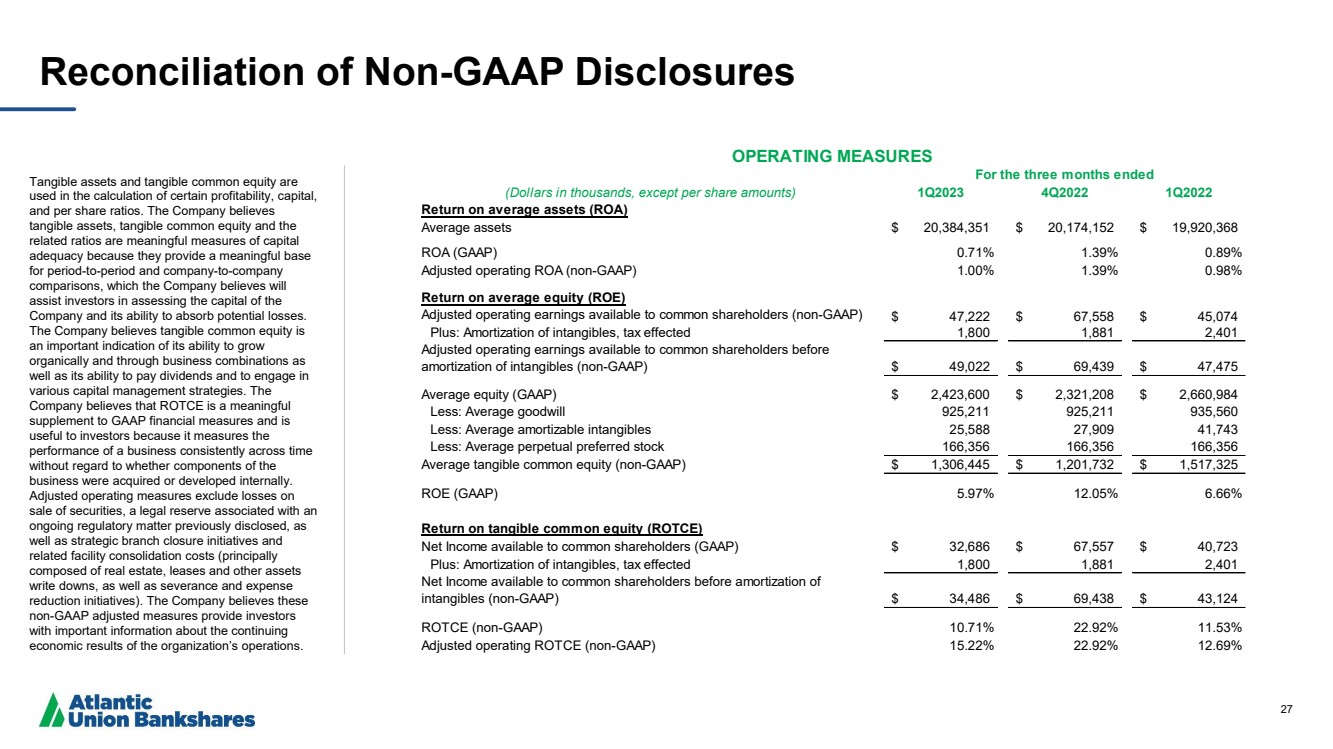
| 27 Reconciliation of Non -GAAP Disclosures Tangible assets and tangible common equity are used in the calculation of certain profitability, capital, and per share ratios. The Company believes tangible assets, tangible common equity and the related ratios are meaningful measures of capital adequacy because they provide a meaningful base for period -to -period and company -to -company comparisons, which the Company believes will assist investors in assessing the capital of the Company and its ability to absorb potential losses. The Company believes tangible common equity is an important indication of its ability to grow organically and through business combinations as well as its ability to pay dividends and to engage in various capital management strategies. The Company believes that ROTCE is a meaningful supplement to GAAP financial measures and is useful to investors because it measures the performance of a business consistently across time without regard to whether components of the business were acquired or developed internally. Adjusted operating measures exclude losses on sale of securities, a legal reserve associated with an ongoing regulatory matter previously disclosed, as well as strategic branch closure initiatives and related facility consolidation costs (principally composed of real estate, leases and other assets write downs, as well as severance and expense reduction initiatives). The Company believes these non -GAAP adjusted measures provide investors with important information about the continuing economic results of the organization’s operations. (Dollars in thousands, except per share amounts) 1Q2023 4Q2022 1Q2022 Return on average assets (ROA) Average assets $ 20,384,351 $ 20,174,152 $ 19,920,368 ROA (GAAP) 0.71% 1.39% 0.89% Adjusted operating ROA (non-GAAP) 1.00% 1.39% 0.98% Return on average equity (ROE) Adjusted operating earnings available to common shareholders (non-GAAP) $ 47,222 $ 67,558 $ 45,074 Plus: Amortization of intangibles, tax effected 1,800 1,881 2,401 Adjusted operating earnings available to common shareholders before amortization of intangibles (non-GAAP) $ 49,022 $ 69,439 $ 47,475 Average equity (GAAP) $ 2,423,600 $ 2,321,208 $ 2,660,984 Less: Average goodwill 925,211 925,211 935,560 Less: Average amortizable intangibles 25,588 27,909 41,743 Less: Average perpetual preferred stock 166,356 166,356 166,356 Average tangible common equity (non-GAAP) $ 1,306,445 $ 1,201,732 $ 1,517,325 ROE (GAAP) 5.97% 12.05% 6.66% Return on tangible common equity (ROTCE) Net Income available to common shareholders (GAAP) $ 32,686 $ 67,557 $ 40,723 Plus: Amortization of intangibles, tax effected 1,800 1,881 2,401 Net Income available to common shareholders before amortization of intangibles (non-GAAP) $ 34,486 $ 69,438 $ 43,124 ROTCE (non-GAAP) 10.71% 22.92% 11.53% Adjusted operating ROTCE (non-GAAP) 15.22% 22.92% 12.69% For the three months ended OPERATING MEASURES |
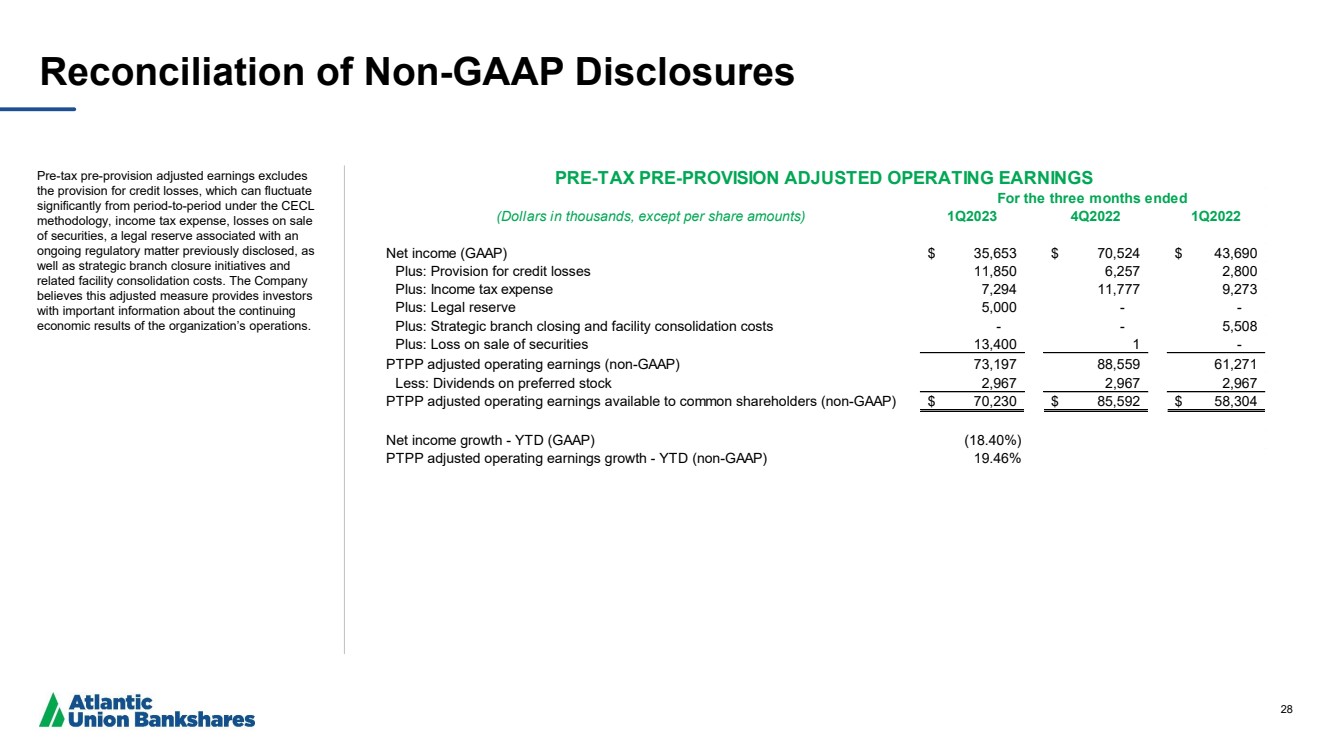
| 28 Reconciliation of Non-GAAP Disclosures Pre-tax pre-provision adjusted earnings excludes the provision for credit losses, which can fluctuate significantly from period-to-period under the CECL methodology, income tax expense, losses on sale of securities, a legal reserve associated with an ongoing regulatory matter previously disclosed, as well as strategic branch closure initiatives and related facility consolidation costs. The Company believes this adjusted measure provides investors with important information about the continuing economic results of the organization’s operations. (Dollars in thousands, except per share amounts) 1Q2023 4Q2022 1Q2022 Net income (GAAP) $ 35,653 $ 70,524 $ 43,690 Plus: Provision for credit losses 11,850 6,257 2,800 Plus: Income tax expense 7,294 11,777 9,273 Plus: Legal reserve 5,000 - - Plus: Strategic branch closing and facility consolidation costs - - 5,508 Plus: Loss on sale of securities 13,400 1 - PTPP adjusted operating earnings (non-GAAP) 73,197 88,559 61,271 Less: Dividends on preferred stock 2,967 2,967 2,967 PTPP adjusted operating earnings available to common shareholders (non-GAAP) $ 70,230 $ 85,592 $ 58,304 Net income growth - YTD (GAAP) (18.40%) PTPP adjusted operating earnings growth - YTD (non-GAAP) 19.46% For the three months ended PRE-TAX PRE-PROVISION ADJUSTED OPERATING EARNINGS |