| 3 rd Quarter FY2022 Earnings Presentation Nasdaq: AUB October 20, 2022 |

| 2 Forward Looking Statements Certain statements in this presentation may constitute “forward - looking statements” within the meaning of the Private Securities Litigation Reform Act of 1995. Forward - looking statements are statements that include, without limitation, statements on slides entitled “Financial Outlook” and “Top - Tier Financial Targets”, statements regarding the Company’s strategic priorities, outlook on future economic conditions and the impacts of current economic uncertainties, and statements that include, projections, predictions, expectations, or beliefs about future events or results or otherwise are not statements of historical fact. Such fo rward - looking statements are based on certain assumptions as of the time they are made, and are inherently subject to known and unknown risks, uncertainties, and other factors, some of which cannot be predicted or quantified, that may cause actual resul ts, performance, achievements, or trends to be materially different from those expressed or implied by such forward - looking statements. Such statements are often characterized by the use of qualified words (and their derivatives) such as “expect,” “ bel ieve,” “estimate,” “plan,” “project,” “anticipate,” “intend,” “will,” “may,” “view,” “opportunity,” “potential,” or words of sim ilar meaning or other statements concerning opinions or judgment of the Company and its management about future events. Although t he Company believes that its expectations with respect to forward - looking statements are based upon reasonable assumptions within the bounds of its existing knowledge of its business and operations, there can be no assurance that actual fu ture results, performance, or achievements of, or trends affecting, the Company will not differ materially from any projected future results, performance, achievements or trends expressed or implied by such forward - looking statements. Actual future resul ts, performance, achievements or trends may differ materially from historical results or those anticipated depending on a variety of factors, including, but not limited to the effects of or changes in: • market interest rates and the impacts on macroeconomic conditions, customer and client behavior, the Company’s funding costs and the Company’s loan and securities portfolio; • inflation and its impacts on economic growth and customer and client behavior; • general economic and financial market conditions, in the United States generally and particularly in the markets in which the Company operates and which its loans are concentrated, including the effects of declines in real estate values, an increase in unemployment levels and slowdowns in economic growth; • monetary and fiscal policies of the U.S. government, including policies of the U.S. Department of the Treasury and the Federal Reserve; • the quality or composition of the loan or investment portfolios and changes therein; • demand for loan products and financial services in the Company’s market area; • the Company’s ability to manage its growth or implement its growth strategy; • the effectiveness of expense reduction plans; • the introduction of new lines of business or new products and services; • the Company’s ability to recruit and retain key employees; • real estate values in the Bank’s lending area; • an insufficient ACL; • changes in accounting principles standards, rules and interpretations and the related impact on the Company’s financial statements; • volatility in the ACL resulting from the CECL methodology, either alone or as that may be affected by conditions arising out of the Covid - 19 pandemic, inflation, changing interest rates or other factors; • the Company’s liquidity and capital positions; • concentrations of loans secured by real estate, particularly commercial real estate; • the effectiveness of the Company’s credit processes and management of the Company’s credit risk; • the Company’s ability to compete in the market for financial services and increased competition from fintech companies; • technological risks and developments, and cyber threats, attacks, or events; • the potential adverse effects of unusual and infrequently occurring events, such as weather - related disasters, terrorist acts, geopolitical conflicts (such as the ongoing conflict between Russia and Ukraine) or public health events (such as COVID - 19), and of governmental and societal responses thereto; these potential adverse effects may include, without limitation, adverse effects on the ability of the Company's borrowers to satisfy their obligations to the Company, on the val ue of collateral securing loans, on the demand for the Company's loans or its other products and services, on supply chains and methods used to distribute products and services, on incidents of cyberattack and fraud, on the Company’s liquidity or capital positions, on risks posed by reliance on third - party service providers, on other aspects of the Company's business operations and on financial markets and economic growth; • the effect of steps the Company takes in response to the COVID - 19 pandemic, the severity and duration of the pandemic, the uncertainty regarding new variants of COVID - 19 that have emerged, the speed and efficacy of vaccine and treatment developments, the impact of loosening or tightening of government restrictions, the pace of recovery when the pandemic subsides and the heightened impact it has on many of the risks described herein; • the discontinuation of LIBOR and its impact on the financial markets, and the Company’s ability to manage operational, legal, and compliance risks related to the discontinuation of LIBOR and implementation of one or more alternate reference rates; • performance by the Company’s counterparties or vendors; • deposit flows; • the availability of financing and the terms thereof; • the level of prepayments on loans and mortgage - backed securities; • legislative or regulatory changes and requirements; • potential claims, damages, and fines related to litigation or government actions; • the effects of changes in federal, state or local tax laws and regulations; • changes to applicable accounting principles and guidelines; and • other factors, many of which are beyond the control of the Company. Please refer to the “Risk Factors” and “Management’s Discussion and Analysis of Financial Condition and Results of Operations ” s ections of the Company’s Annual Report on Form 10 - K for the year ended December 31, 2021 and related disclosures in other filings, which have been filed with the U.S. Securities and Exchange Commission (“SEC”) and are available on the SEC’s web site at www.sec.gov. All risk factors and uncertainties described herein should be considered in evaluating forward - looking statements, all forward - looking statements made in this presentation are expressly qualified by the cautionary statements contai ned or referred to herein. Readers are cautioned not to rely too heavily on the forward - looking statements in this presentation, and undue reliance should not be placed on such forward - looking statements. The actual results or developments anticipated may not be realized or, even if substantially realized, they may not have the expected consequences to or effects on the Company or its businesses or operations. Forward - looking statements speak only as of the date they are made. The Company does no t intend or assume any obligation to update, revise or clarify any forward - looking statements that may be made from time to time by or on behalf of the Company, whether as a result of new information, future events or otherwise. |
| 3 Additional Information Non - GAAP Financial Measures This presentation contains certain financial information determined by methods other than in accordance with generally accepted accounting principles in the United States (“GAAP”). These non - GAAP financial measures are a supplement to GAAP, which is used to prepare the Company’s financial statements, and should not be considered in isolation or as a substitute for comparable measures calculated in accordance with GAAP. In addition, the Company’s non - GAAP financial measures may not be comparable to non - GAAP financial measures of other companies. The Company uses the non - GAAP financial measures discussed herein in its analysis of the Company’s performance. The Company’s management believes that these non - GAAP financial measures provide additional understanding of ongoing operations, enhance comparability of results of operations with prior periods and show the effects of significant gains and charges in the periods presented without the impact of items or events that may obscure trends in the Company’s underlying performance. Please see “Reconciliation of Non - GAAP Disclosures” at the end of this presentation for a reconciliation to the nearest GAAP financial measure. No Offer or Solicitation This presentation does not constitute an offer to sell or a solicitation of an offer to buy any securities. No offer of securities shall be made except by means of a prospectus meeting the requirements of the Securities Act of 1933, as amended, and no offer to sell or solicitation of an offer to buy shall be made in any jurisdiction in which such offer, solicitation or sale would be unlawful. About Atlantic Union Bankshares Corporation Headquartered in Richmond, Virginia, Atlantic Union Bankshares Corporation (Nasdaq: AUB) is the holding company for Atlantic Union Bank. Atlantic Union Bank has 114 branches and approximately 130 ATMs located throughout Virginia, and in portions of Maryland and North Carolina. Certain non - bank financial services affiliates of Atlantic Union Bank include: Atlantic Union Equipment Finance, Inc., which provides equipment financing ; Atlantic Union Financial Consultants, LLC, which provides brokerage services; and Union Insurance Group, LLC, which offers various lines of insurance products .. |
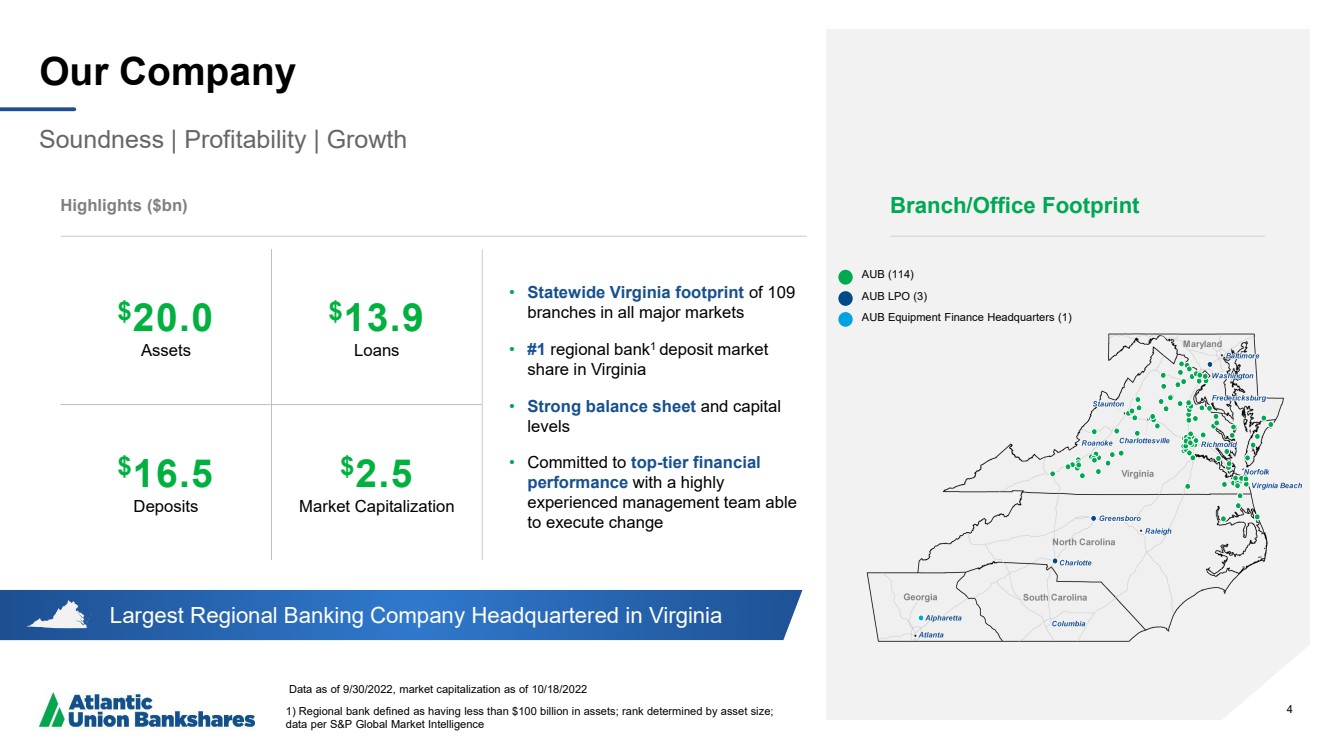
| 4 Largest Regional Banking Company Headquartered in Virginia Our Company Soundness | Profitability | Growth Data as of 9 /30/2022 , market capitalization as of 10/18/2022 1) Regional bank defined as having less than $100 billion in assets; rank determined by asset size; data per S&P Global Market Intelligence Highlights ($bn) • Statewide Virginia footprint of 109 branches in all major markets • #1 regional bank 1 deposit market share in Virginia • Strong balance sheet and capital levels • Committed to top - tier financial performance with a highly experienced management team able to execute change 4 $ 20 ..0 Assets $ 13.9 Loans $ 16.5 Deposits $ 2 ..5 Market Capitalization Branch/Office Footprint AUB (114) AUB LPO (3) AUB Equipment Finance Headquarters (1) |
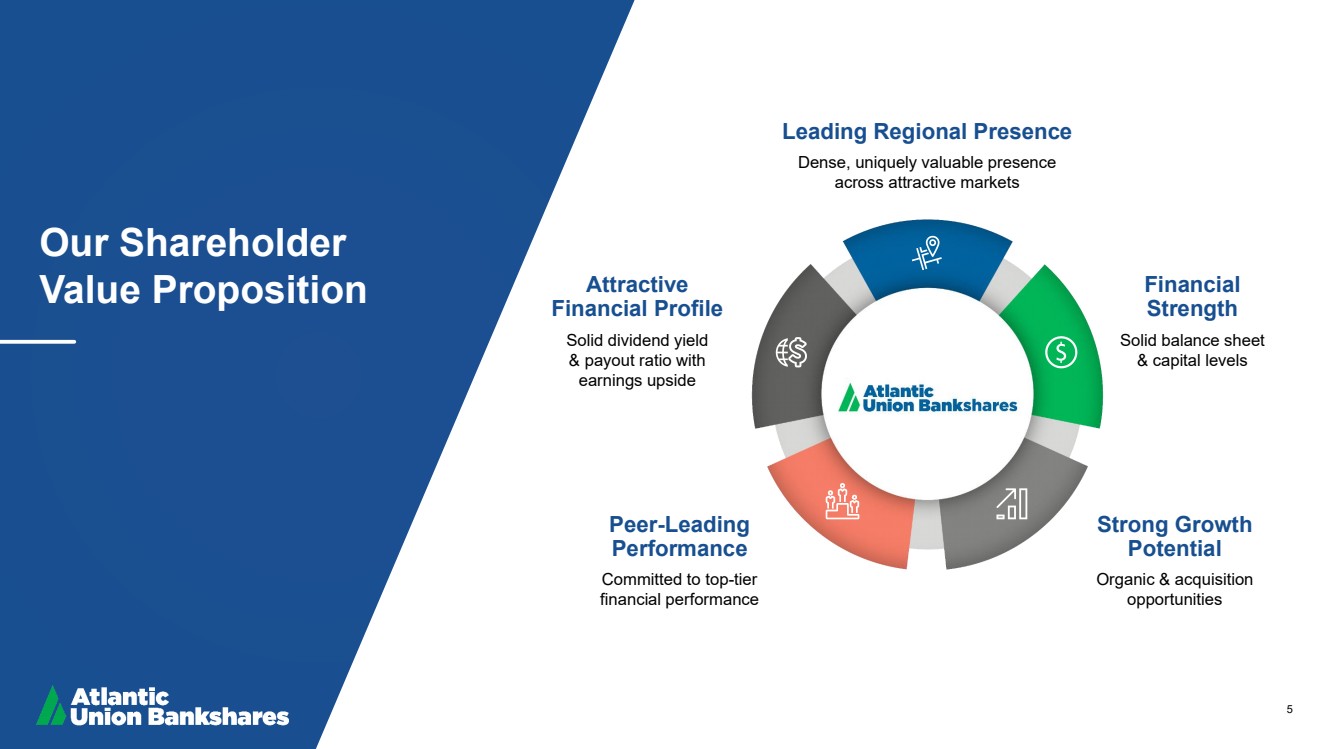
| 5 Our Shareholder Value Proposition Leading Regional Presence Dense, uniquely valuable presence across attractive markets Financial Strength Solid balance sheet & capital levels Attractive Financial Profile Solid dividend yield & payout ratio with earnings upside Strong Growth Potential Organic & acquisition opportunities Peer - Leading Performance Committed to top - tier financial performance |
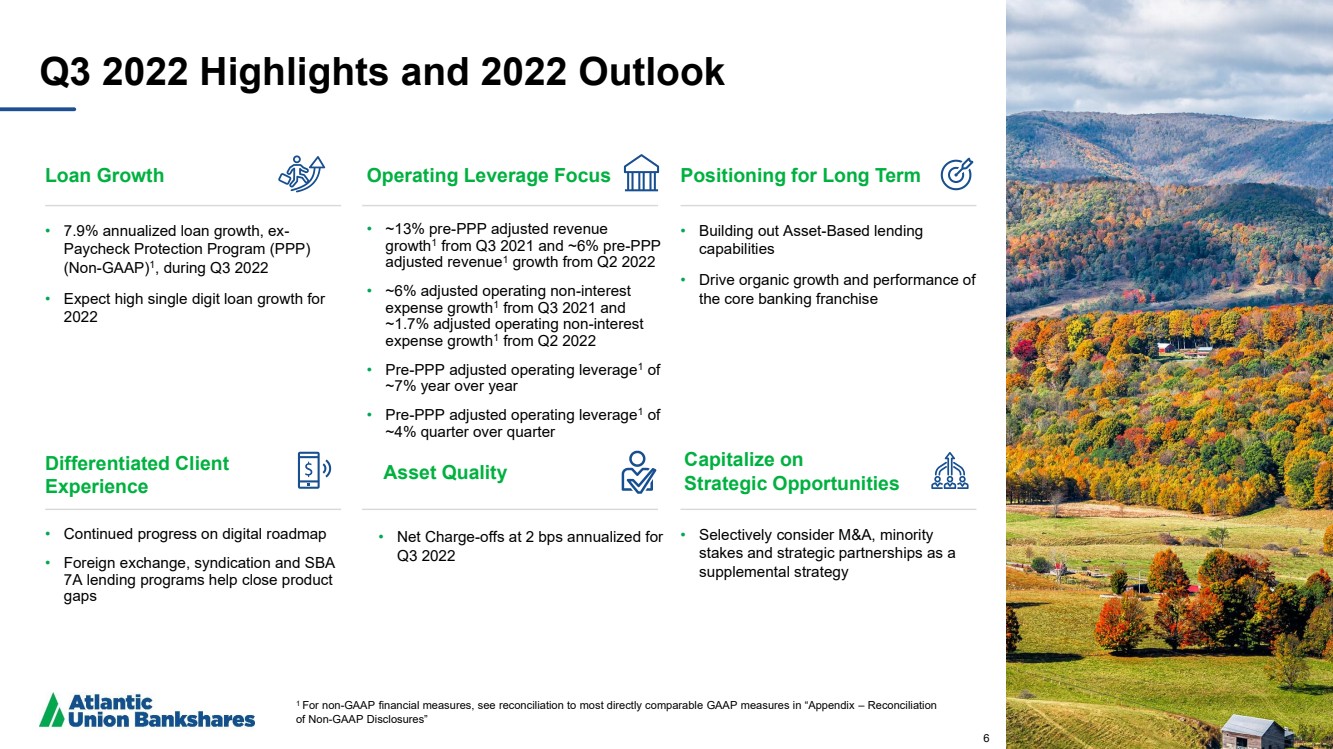
| 6 Q3 2022 Highlights and 2022 Outlook Loan Growth • 7.9% annualized loan growth, ex - Paycheck Protection Program (PPP) (Non - GAAP) 1 , during Q3 2022 • Expect high single digit loan growth for 2022 Asset Quality • Net Charge - offs at 2 bps annualized for Q3 2022 Positioning for Long Term • Building out Asset - Based lending capabilities • Drive organic growth and performance of the core banking franchise Differentiated Client Experience • Continued progress on digital roadmap • Foreign exchange, syndication and SBA 7A lending programs help close product gaps Operating Leverage Focus • ~13% pre - PPP adjusted revenue growth 1 from Q3 2021 and ~6% pre - PPP adjusted revenue 1 growth from Q2 2022 • ~6% adjusted operating non - interest expense growth 1 from Q3 2021 and ~1.7% adjusted operating non - interest expense growth 1 from Q2 2022 • Pre - PPP adjusted operating leverage 1 of ~7% year over year • Pre - PPP adjusted operating leverage 1 of ~4% quarter over quarter Capitalize on Strategic Opportunities • Selectively consider M&A, minority stakes and strategic partnerships as a supplemental strategy 6 1 For non - GAAP financial measures, see reconciliation to most directly comparable GAAP measures in “Appendix – Reconciliation of Non - GAAP Disclosures” |
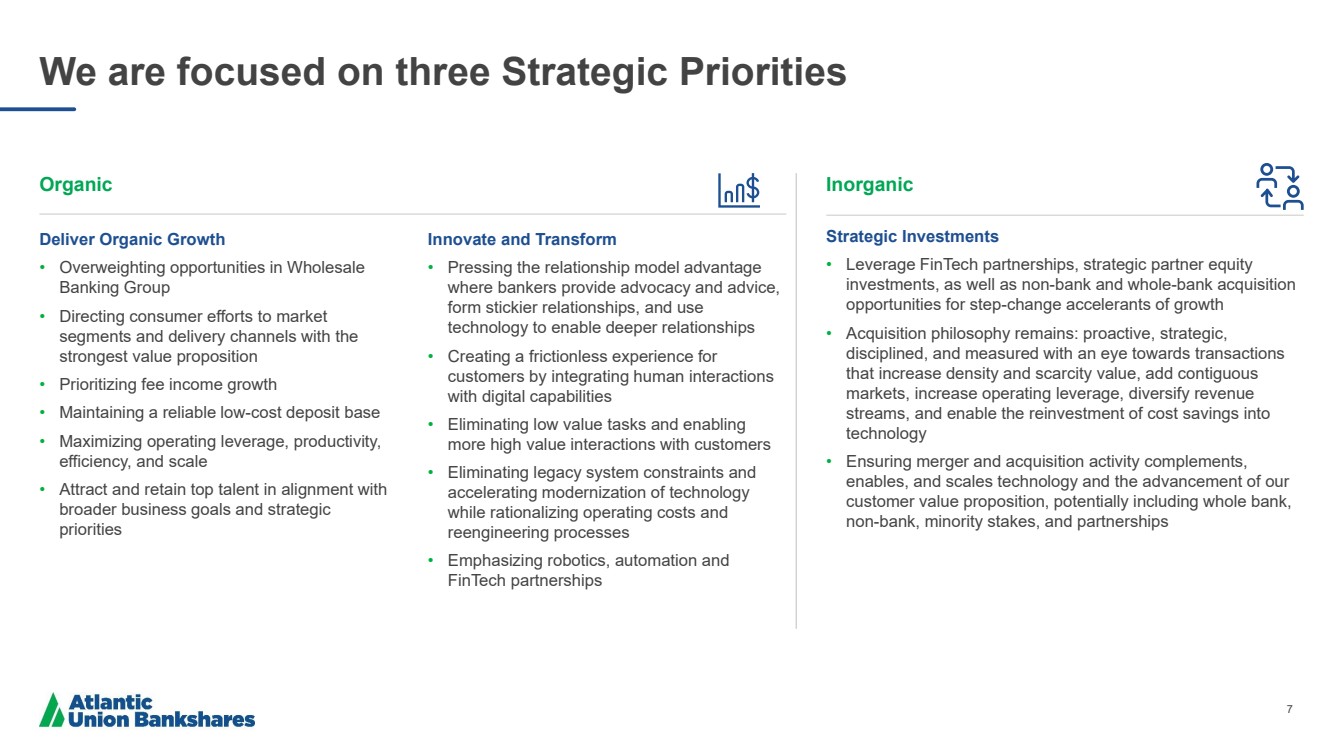
| 7 We are focused on three Strategic Priorities Organic Deliver Organic Growth • Overweighting opportunities in Wholesale Banking Group • Directing consumer efforts to market segments and delivery channels with the strongest value proposition • Prioritizing fee income growth • Maintaining a reliable low - cost deposit base • Maximizing operating leverage, productivity, efficiency, and scale • Attract and retain top talent in alignment with broader business goals and strategic priorities Innovate and Transform • Pressing the relationship model advantage where bankers provide advocacy and advice, form stickier relationships, and use technology to enable deeper relationships • Creating a frictionless experience for customers by integrating human interactions with digital capabilities • Eliminating low value tasks and enabling more high value interactions with customers • Eliminating legacy system constraints and accelerating modernization of technology while rationalizing operating costs and reengineering processes • Emphasizing robotics, automation and FinTech partnerships Inorganic Strategic Investments • Leverage FinTech partnerships, strategic partner equity investments, as well as non - bank and whole - bank acquisition opportunities for step - change accelerants of growth • Acquisition philosophy remains: proactive, strategic, disciplined, and measured with an eye towards transactions that increase density and scarcity value, add contiguous markets, increase operating leverage, diversify revenue streams, and enable the reinvestment of cost savings into technology • Ensuring merger and acquisition activity complements, enables, and scales technology and the advancement of our customer value proposition, potentially including whole bank, non - bank, minority stakes, and partnerships |
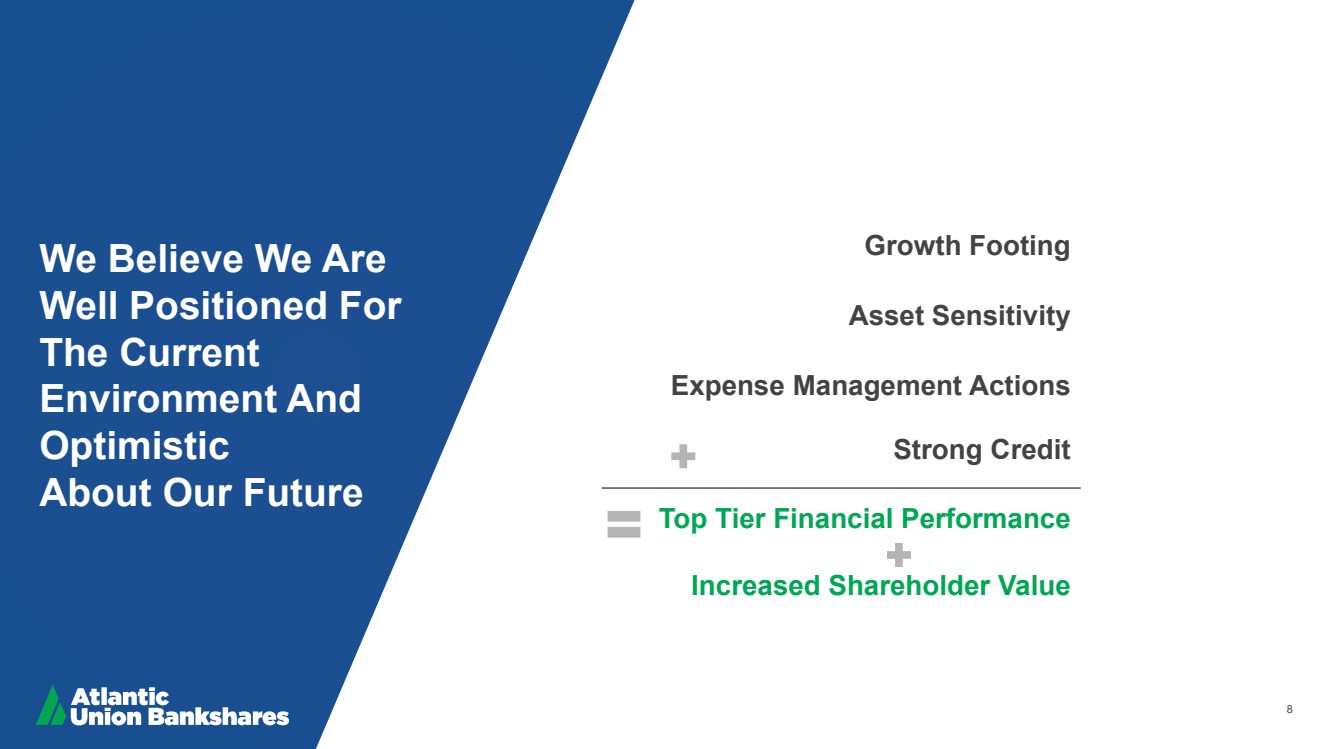
| 8 We Believe We Are Well Positioned For The Current Environment And Optimistic About Our Future Top Tier Financial Performance Increased Shareholder Value Strong Credit Expense Management Actions Asset Sensitivity Growth Footing |
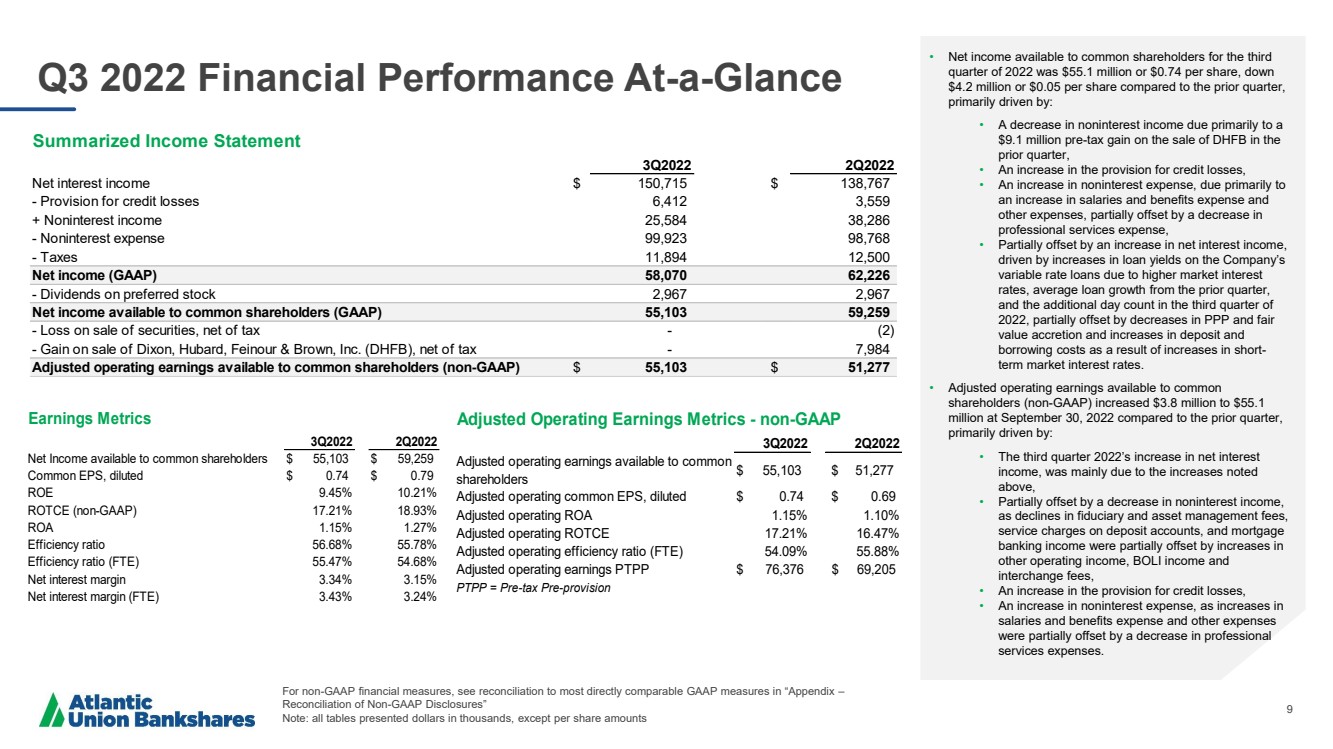
| 9 Q3 2022 Financial Performance At - a - Glance For non - GAAP financial measures, see reconciliation to most directly comparable GAAP measures in “Appendix – Reconciliation of Non - GAAP Disclosures” Note: all tables presented dollars in thousands, except per share amounts • Net income available to common shareholders for the third quarter of 2022 was $55.1 million or $ 0.74 per share, down $4.2 million or $ 0.05 per share compared to the prior quarter, primarily driven by: • A decrease in noninterest income due primarily to a $9.1 million pre - tax gain on the sale of DHFB in the prior quarter, • An increase in the provision for credit losses, • An increase in noninterest expense, due primarily to an increase in salaries and benefits expense and other expenses, partially offset by a decrease in professional services expense, • Partially offset by an increase in net interest income , driven by increases in loan yields on the Company’s variable rate loans due to higher market interest rates, average loan growth from the prior quarter, and the additional day count in the third quarter of 2022 , partially offset by decreases in PPP and fair value accretion and increases in deposit and borrowing costs as a result of increases in short - term market interest rates. • Adjusted operating earnings available to common shareholders (non - GAAP) increased $3.8 million to $55.1 million at September 30, 2022 compared to the prior quarter, primarily driven by: • The third quarter 2022’s increase in net interest income, was mainly due to the increases noted above, • Partially offset by a decrease in noninterest income, as declines in fiduciary and asset management fees, service charges on deposit accounts, and mortgage banking income were partially offset by increases in other operating income, BOLI income and interchange fees, • An increase in the provision for credit losses, • An increase in noninterest expense, as increases in salaries and benefits expense and other expenses were partially offset by a decrease in professional services expenses. 3Q2022 2Q2022 Net Income available to common shareholders $ 55,103 $ 59,259 Common EPS, diluted $ 0.74 $ 0.79 ROE 9.45% 10.21% ROTCE (non-GAAP) 17.21% 18.93% ROA 1.15% 1.27% Efficiency ratio 56.68% 55.78% Efficiency ratio (FTE) 55.47% 54.68% Net interest margin 3.34% 3.15% Net interest margin (FTE) 3.43% 3.24% Earnings Metrics 3Q2022 2Q2022 Adjusted operating earnings available to common shareholders $ 55,103 $ 51,277 Adjusted operating common EPS, diluted $ 0.74 $ 0.69 Adjusted operating ROA 1.15% 1.10% Adjusted operating ROTCE 17.21% 16.47% Adjusted operating efficiency ratio (FTE) 54.09% 55.88% Adjusted operating earnings PTPP $ 76,376 $ 69,205 PTPP = Pre-tax Pre-provision Adjusted Operating Earnings Metrics - non-GAAP 3Q2022 2Q2022 Net interest income $ 150,715 $ 138,767 - Provision for credit losses 6,412 3,559 + Noninterest income 25,584 38,286 - Noninterest expense 99,923 98,768 - Taxes 11,894 12,500 Net income (GAAP) 58,070 62,226 - Dividends on preferred stock 2,967 2,967 Net income available to common shareholders (GAAP) 55,103 59,259 - Loss on sale of securities, net of tax - (2) - Gain on sale of Dixon, Hubard, Feinour & Brown, Inc. (DHFB), net of tax - 7,984 Adjusted operating earnings available to common shareholders (non-GAAP) $ 55,103 $ 51,277 Summarized Income Statement |
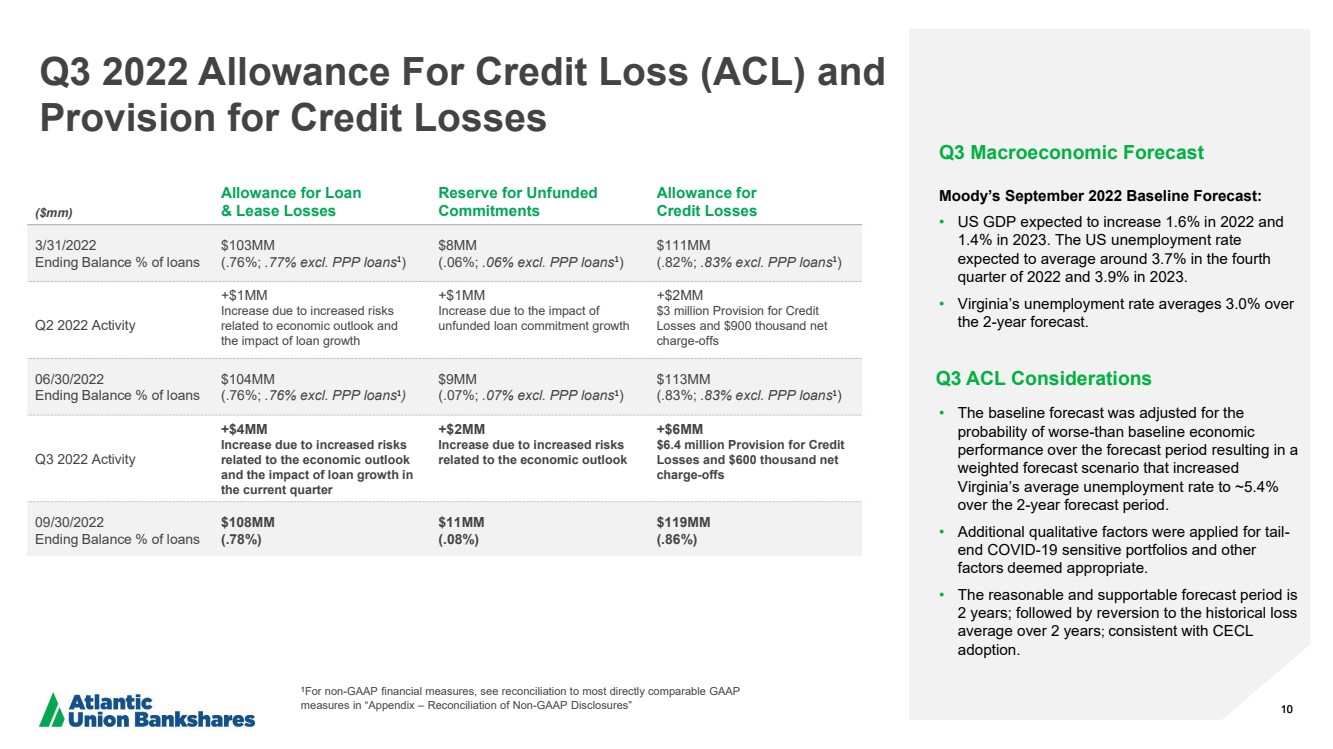
| 10 Q3 2022 Allowance For Credit Loss (ACL) and Provision for Credit Losses 10 Q3 Macroeconomic Forecast Moody’s September 2022 Baseline Forecast: • US GDP expected to increase 1.6% in 2022 and 1.4% in 2023. The US unemployment rate expected to average around 3.7% in the fourth quarter of 2022 and 3.9% in 2023. • Virginia’s unemployment rate averages 3.0% over the 2 - year forecast. Q3 ACL Considerations • The baseline forecast was adjusted for the probability of worse - than baseline economic performance over the forecast period resulting in a weighted forecast scenario that increased Virginia’s average unemployment rate to ~5.4% over the 2 - year forecast period. • Additional qualitative factors were applied for tail - end COVID - 19 sensitive portfolios and other factors deemed appropriate. • The reasonable and supportable forecast period is 2 years; followed by reversion to the historical loss average over 2 years ; consistent with CECL adoption. ($mm) Allowance for Loan & Lease Losses Reserve for Unfunded Commitments Allowance for Credit Losses 3/31/2022 Ending Balance % of loans $103MM (. 76%; ..77% excl. PPP loans 1 ) $8MM (.06%; ..06% excl. PPP loans 1 ) $111MM (.82 %; ..83% excl. PPP loans 1 ) Q2 2022 Activity +$1MM Increase due to increased risks related to economic outlook and the impact of loan growth +$1MM Increase due to the impact of unfunded loan commitment growth +$2MM $3 million Provision for Credit Losses and $900 thousand net charge - offs 06/30/2022 Ending Balance % of loans $104MM (.76%; ..76% excl. PPP loans 1 ) $9MM (.07%; ..07% excl. PPP loans 1 ) $113MM (.83%; ..83% excl. PPP loans 1 ) Q3 2022 Activity +$4MM Increase due to increased risks related to the economic outlook and the impact of loan growth in the current quarter +$2MM Increase due to increased risks related to the economic outlook +$6MM $6.4 million Provision for Credit Losses and $600 thousand net charge - offs 09/30/2022 Ending Balance % of loans $108MM (.78%) $11MM (.08%) $119MM (.86%) .. 1 For non - GAAP financial measures, see reconciliation to most directly comparable GAAP measures in “Appendix – Reconciliation of Non - GAAP Disclosures” |
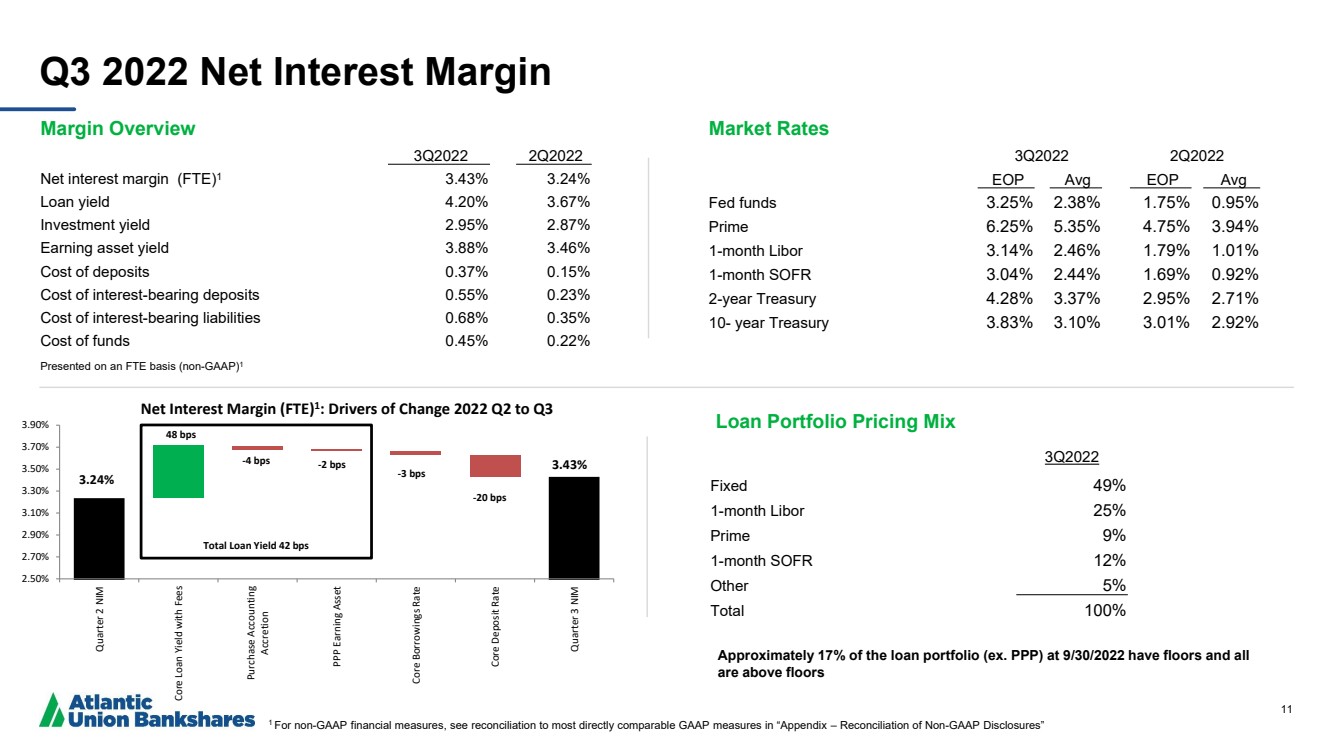
| 11 3.24% 2.50% 2.70% 2.90% 3.10% 3.30% 3.50% 3.70% 3.90% Quarter 2 NIM Core Loan Yield with Fees Purchase Accounting Accretion PPP Earning Asset Core Borrowings Rate Core Deposit Rate Quarter 3 NIM Net Interest Margin ( FTE) 1 : Drivers of Change 2022 Q2 to Q3 48 bps - 4 bps - 2 bps - 3 bps 3.43% - 20 bps Total Loan Yield 42 bps Q3 2022 Net Interest Margin Market Rates 3Q2022 2Q2022 EOP Avg EOP Avg Fed funds 3.25% 2.38% 1.75% 0.95% Prime 6.25% 5.35% 4.75% 3.94% 1 - month Libor 3.14% 2.46% 1.79% 1.01% 1 - month SOFR 3.04% 2.44% 1.69% 0.92% 2 - year Treasury 4.28% 3.37% 2.95% 2.71% 10 - year Treasury 3.83% 3.10% 3.01% 2.92% Margin Overview 3Q2022 2Q2022 Net interest margin ( FTE) 1 3.43% 3.24% Loan yield 4.20% 3.67% Investment yield 2.95% 2.87% Earning asset yield 3.88% 3.46% Cost of deposits 0.37% 0.15% Cost of interest - bearing deposits 0.55% 0.23% Cost of interest - bearing liabilities 0.68% 0.35% Cost of funds 0.45% 0.22% Presented on an FTE basis (non - GAAP) 1 Approximately 17% of the loan portfolio (ex. PPP) at 9/30/2022 have floors and all are above floors Loan Portfolio Pricing Mix 3Q2022 Fixed 49% 1 - month Libor 25% Prime 9% 1 - month SOFR 12% Other 5% Total 100% 1 For non - GAAP financial measures, see reconciliation to most directly comparable GAAP measures in “Appendix – Reconciliation of N on - GAAP Disclosures” |
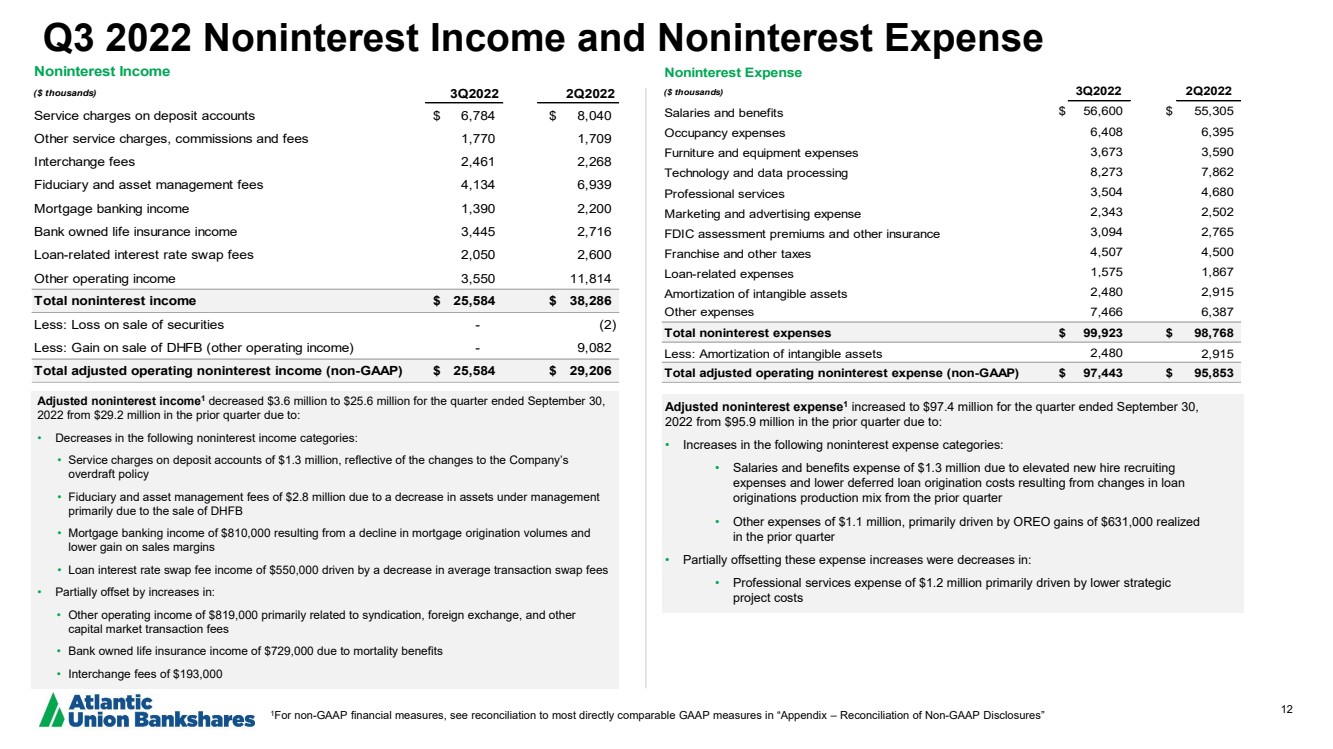
| 12 Q3 2022 Noninterest Income and Noninterest Expense Adjuste d n oninterest income 1 decreased $3.6 million to $25.6 million for the quarter ended September 30, 2022 from $29.2 million in the prior quarter due to: • Decreases in the following noninterest income categories: • Service charges on deposit accounts of $1.3 million, reflective of the changes to the Company’s overdraft policy • Fiduciary and asset management fees of $2.8 million due to a decrease in assets under management primarily due to the sale of DHFB • Mortgage banking income of $810,000 resulting from a decline in mortgage origination volumes and lower gain on sales margins • Loan interest rate swap fee income of $550,000 driven by a decrease in average transaction swap fees • Partially offset by increases in: • Other operating income of $819,000 primarily related to syndication, foreign exchange, and other capital market transaction fees • Bank owned life insurance income of $729,000 due to mortality benefits • Interchange fees of $193,000 Adjusted noninterest expense 1 increased to $97.4 million for the quarter ended September 30, 2022 from $95.9 million in the prior quarter due to : • Increases in the following noninterest expense categories: • Salaries and benefits expense of $1.3 million due to elevated new hire recruiting expenses and lower deferred loan origination costs resulting from changes in loan originations production mix from the prior quarter • Other expenses of $1.1 million, primarily driven by OREO gains of $631,000 realized in the prior quarter • Partially offsetting these expense increases were decreases in: • Professional services expense of $1.2 million primarily driven by lower strategic project costs 1 For non - GAAP financial measures, see reconciliation to most directly comparable GAAP measures in “Appendix – Reconciliation of Non - G AAP Disclosures ” Noninterest Expense ($ thousands) 3Q2022 2Q2022 Salaries and benefits $ 56,600 $ 55,305 Occupancy expenses 6,408 6,395 Furniture and equipment expenses 3,673 3,590 Technology and data processing 8,273 7,862 Professional services 3,504 4,680 Marketing and advertising expense 2,343 2,502 FDIC assessment premiums and other insurance 3,094 2,765 Franchise and other taxes 4,507 4,500 Loan-related expenses 1,575 1,867 Amortization of intangible assets 2,480 2,915 Other expenses 7,466 6,387 Total noninterest expenses $ 99,923 $ 98,768 Less: Amortization of intangible assets 2,480 2,915 Total adjusted operating noninterest expense (non-GAAP) $ 97,443 $ 95,853 Noninterest Income ($ thousands) 3Q2022 2Q2022 Service charges on deposit accounts $ 6,784 $ 8,040 Other service charges, commissions and fees 1,770 1,709 Interchange fees 2,461 2,268 Fiduciary and asset management fees 4,134 6,939 Mortgage banking income 1,390 2,200 Bank owned life insurance income 3,445 2,716 Loan-related interest rate swap fees 2,050 2,600 Other operating income 3,550 11,814 Total noninterest income $ 25,584 $ 38,286 Less: Loss on sale of securities - (2) Less: Gain on sale of DHFB (other operating income) - 9,082 Total adjusted operating noninterest income (non-GAAP) $ 25,584 $ 29,206 |
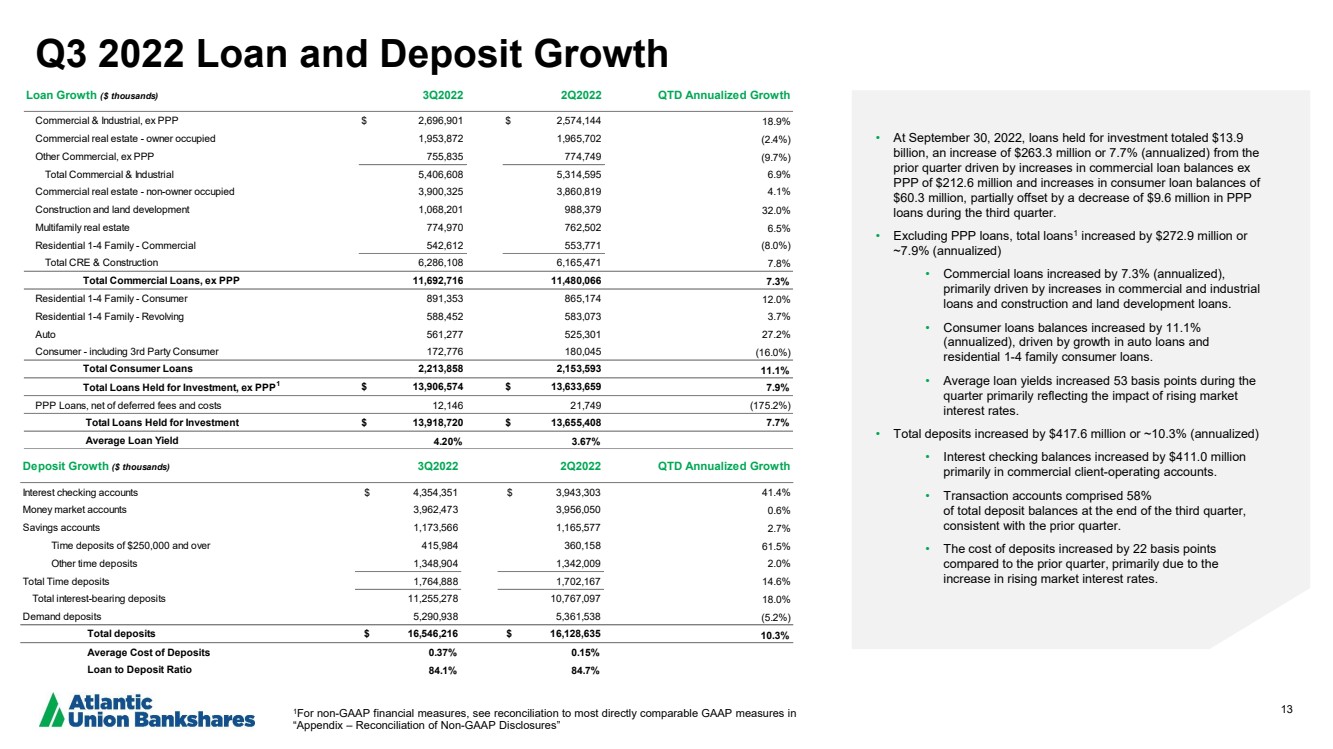
| 13 Q3 2022 Loan and Deposit Growth • At September 30, 2022, loans held for investment totaled $ 13.9 billion, an increase of $263.3 million or 7.7% (annualized) from the prior quarter driven by increases in commercial loan balances ex PPP of $212.6 million and increases in consumer loan balances of $60.3 million , partially offset by a decrease of $9.6 million in PPP loans during the third quarter. • Excluding PPP loans, total loans 1 increased by $272.9 million or ~7.9% (annualized) • Commercial loans increased by 7.3 % (annualized ), primarily driven by increases in commercial and industrial loans and construction and land development loans .. • Consumer loans balances increased by 11.1% (annualized), driven by growth in auto loans and residential 1 - 4 family consumer loans. • Average loan yields increased 53 basis points during the quarter primarily reflecting the impact of rising market interest rates. • Total deposits increased by $417.6 million or ~ 10.3 % (annualized) • Interest checking balances increased by $ 411.0 million primarily in commercial client - operating accounts. • Transaction accounts comprised 58% of total deposit balances at the end of the third quarter, consistent with the prior quarter. • The cost of deposits increased by 22 basis points compared to the prior quarter, primarily due to the increase in rising market interest rates. 1 For non - GAAP financial measures, see reconciliation to most directly comparable GAAP measures in “Appendix – Reconciliation of Non - GAAP Disclosures” Deposit Growth ($ thousands) 3Q2022 2Q2022 QTD Annualized Growth Interest checking accounts $ 4,354,351 $ 3,943,303 41.4% Money market accounts 3,962,473 3,956,050 0.6% Savings accounts 1,173,566 1,165,577 2.7% Time deposits of $250,000 and over 415,984 360,158 61.5% Other time deposits 1,348,904 1,342,009 2.0% Total Time deposits 1,764,888 1,702,167 14.6% Total interest-bearing deposits 11,255,278 10,767,097 18.0% Demand deposits 5,290,938 5,361,538 (5.2%) Total deposits $ 16,546,216 $ 16,128,635 10.3% Average Cost of Deposits 0.37% 0.15% Loan to Deposit Ratio 84.1% 84.7% Loan Growth ($ thousands) 3Q2022 2Q2022 QTD Annualized Growth Commercial & Industrial, ex PPP $ 2,696,901 $ 2,574,144 18.9% Commercial real estate - owner occupied 1,953,872 1,965,702 (2.4%) Other Commercial, ex PPP 755,835 774,749 (9.7%) Total Commercial & Industrial 5,406,608 5,314,595 6.9% Commercial real estate - non-owner occupied 3,900,325 3,860,819 4.1% Construction and land development 1,068,201 988,379 32.0% Multifamily real estate 774,970 762,502 6.5% Residential 1-4 Family - Commercial 542,612 553,771 (8.0%) Total CRE & Construction 6,286,108 6,165,471 7.8% Total Commercial Loans, ex PPP 11,692,716 11,480,066 7.3% Residential 1-4 Family - Consumer 891,353 865,174 12.0% Residential 1-4 Family - Revolving 588,452 583,073 3.7% Auto 561,277 525,301 27.2% Consumer - including 3rd Party Consumer 172,776 180,045 (16.0%) Total Consumer Loans 2,213,858 2,153,593 11.1% Total Loans Held for Investment, ex PPP 1 $ 13,906,574 $ 13,633,659 7.9% PPP Loans, net of deferred fees and costs 12,146 21,749 (175.2%) Total Loans Held for Investment $ 13,918,720 $ 13,655,408 7.7% Average Loan Yield 4.20% 3.67% |
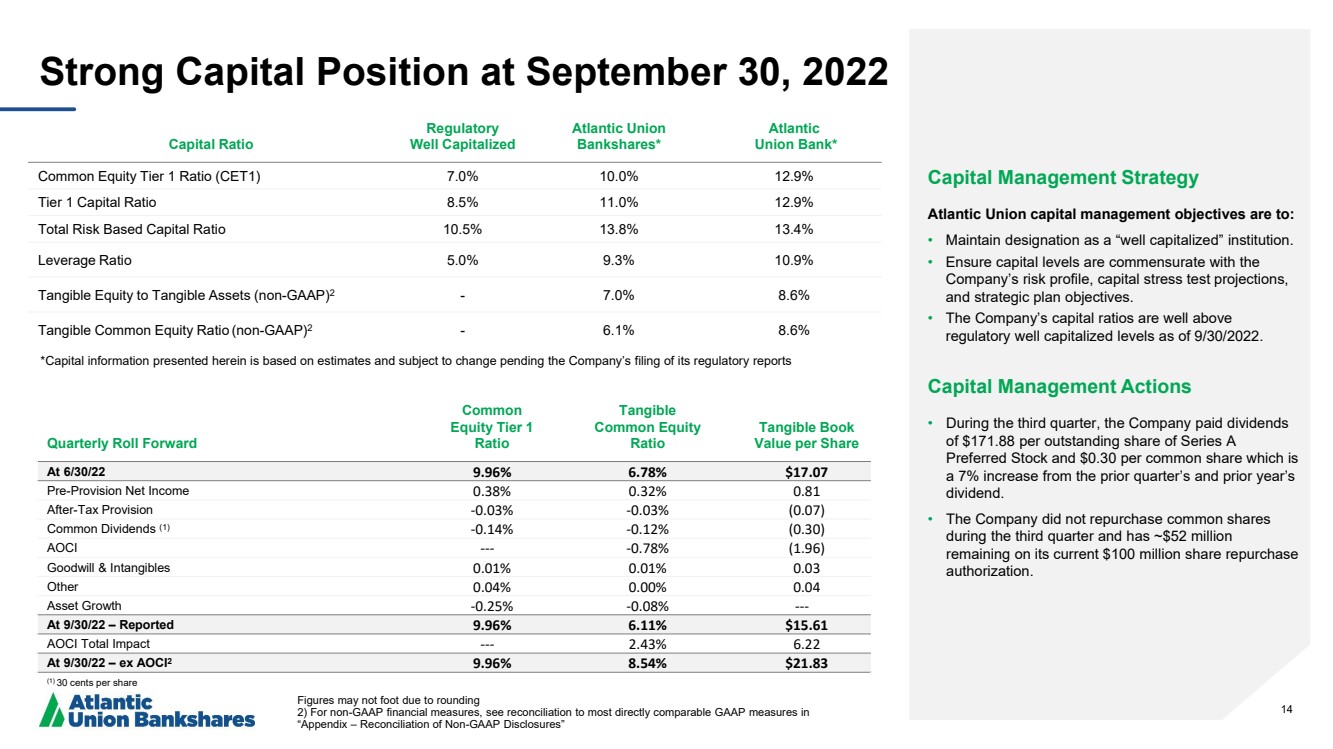
| 14 Strong Capital Position at September 30, 2022 Capital Ratio Regulatory Well Capitalized Atlantic Union Bankshares* Atlantic Union Bank* Common Equity Tier 1 Ratio (CET1) 7.0% 10.0% 12.9% Tier 1 Capital Ratio 8.5% 11.0% 12.9% Total Risk Based Capital Ratio 10.5% 13.8% 13.4% Leverage Ratio 5.0% 9.3% 10.9% Tangible Equity to Tangible Assets ( non - GAAP) 2 - 7.0% 8.6% Tangible Common Equity Ratio ( non - GAAP) 2 - 6.1% 8.6% Figures may not foot due to rounding 2 ) For non - GAAP financial measures, see reconciliation to most directly comparable GAAP measures in “Appendix – Reconciliation of Non - GAAP Disclosures” Capital Management Strategy Atlantic Union capital management objectives are to: • Maintain designation as a “well capitalized” institution. • Ensure capital levels are commensurate with the Company’s risk profile, capital stress test projections, and strategic plan objectives. • The Company’s capital ratios are well above regulatory well capitalized levels as of 9/30/2022. Capital Management Actions • During the third quarter , the Company paid dividends of $171.88 per outstanding share of Series A Preferred Stock and $ 0.30 per common share which is a 7% increase from the prior quarter’s and prior year’s dividend. • The Company did not repurchase common shares during the third quarter and has ~$52 million remaining on its current $100 million share repurchase authorization. Quarterly Roll Forward Common Equity Tier 1 Ratio Tangible Common Equity Ratio Tangible Book Value per Share At 6/30/22 9.96% 6.78% $17.07 Pre - Provision Net Income 0.38% 0.32% 0.81 After - Tax Provision - 0.03% - 0.03% ( 0.07) Common Dividends (1) - 0.14% - 0.12% ( 0.30) AOCI --- - 0.78% ( 1.96) Goodwill & Intangibles 0.01% 0.01% 0.03 Other 0.04% 0.00% 0.04 Asset Growth - 0.25% - 0.08% --- At 9/30/22 – Reported 9.96% 6.11% $15.61 AOCI Total Impact --- 2.43% 6.22 At 9/30/22 – ex AOCI 2 9.96% 8.54% $21.83 (1) 30 cents per share *Capital information presented herein is based on estimates and subject to change pending the Company’s filing of its regulat or y reports |
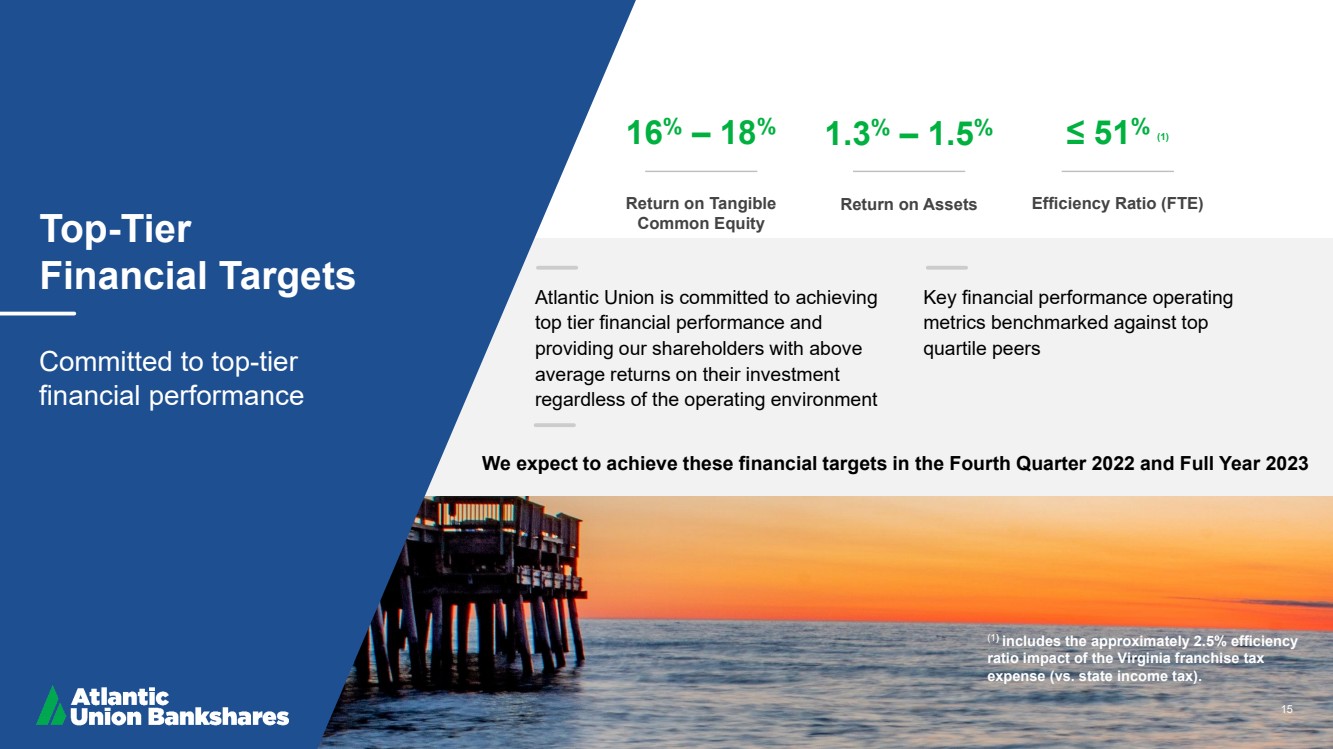
| 15 Top - Tier Financial Targets Committed to top - tier financial performance 16 % – 18 % Return on Tangible Common Equity 1.3 % – 1.5 % Return on Assets ≤ 51 % (1) Efficiency Ratio (FTE) Atlantic Union is committed to achieving top tier financial performance and providing our shareholders with above average returns on their investment regardless of the operating environment Key financial performance operating metrics benchmarked against top quartile peers 15 (1 ) includes the approximately 2.5% efficiency ratio impact of the Virginia franchise tax expense (vs. state income tax). We expect to achieve these financial targets in the Fourth Quarter 2022 and Full Year 2023 |
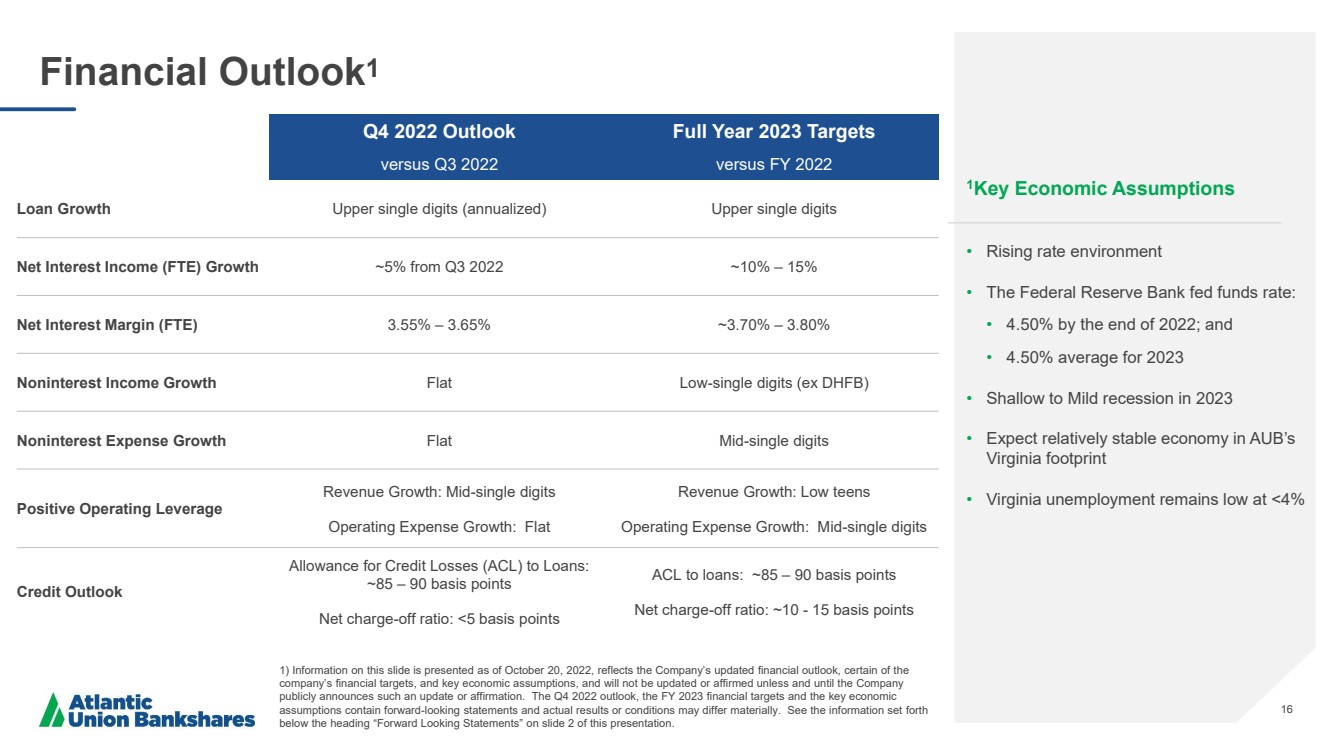
| 16 Financial Outlook 1 1 Key Economic Assumptions • Rising rate environment • The Federal Reserve Bank fed funds rate: • 4.50% by the end of 2022; and • 4.50 % average for 2023 • Shallow to Mild recession in 2023 • Expect relatively stable economy in AUB’s Virginia footprint • Virginia unemployment remains low at <4% Q4 2022 Outlook Full Year 2023 Targets versus Q3 2022 versus FY 2022 Loan Growth Upper single digits (annualized) Upper single digits Net Interest Income (FTE) Growth ~5 % from Q3 2022 ~10% – 15% Net Interest Margin (FTE) 3.55% – 3.65% ~ 3.70% – 3.80 % Noninterest Income Growth Flat Low - single digits (ex DHFB ) Noninterest Expense Growth Flat Mid - single digits Positive Operating Leverage Revenue Growth: Mid - single digits Operating Expense Growth: Flat Revenue Growth: Low teens Operating Expense Growth: M id - single digits Credit Outlook Allowance for Credit Losses (ACL) to Loans: ~ 85 – 90 basis points Net charge - off ratio: < 5 basis points ACL to loans: ~ 85 – 90 basis points Net charge - off ratio: ~10 - 15 basis points 1) Information on this slide is presented as of October 20, 2022, reflects the Company’s updated financial outlook, certain of t he company’s financial targets, and key economic assumptions, and will not be updated or affirmed unless and until the Company publicly announces such an update or affirmation. The Q4 2022 outlook, the FY 2023 financial targets and the key economic assumptions contain forward - looking statements and actual results or conditions may differ materially. See the information set forth below the heading “Forward Looking Statements” on slide 2 of this presentation. |
| 17 Appendix |

| 18 Reconciliation of Non - GAAP Disclosures The Company has provided supplemental performance measures on a tax - equivalent, tangible, operating, adjusted, or pre - tax pre - pr ovision basis. These non - GAAP financial measures are a supplement to GAAP, which is used to prepare the Company’s financial statements, and sho uld not be considered in isolation or as a substitute for comparable measures calculated in accordance with GAAP .. In addition, the Company’s non - GAAP financial measures may not be comparable to non - GAAP financial measures of other companies. The Company uses the non - GAAP financ ial measures discussed herein in its analysis of the Company’s performance. The Company’s management believes that these non - GAAP fi nancial measures provide additional understanding of ongoing operations, enhance comparability of results of operations with prior pe rio ds and show the effects of significant gains and charges in the periods presented without the impact of items or events that may obscure tren ds in the Company’s underlying performance. |
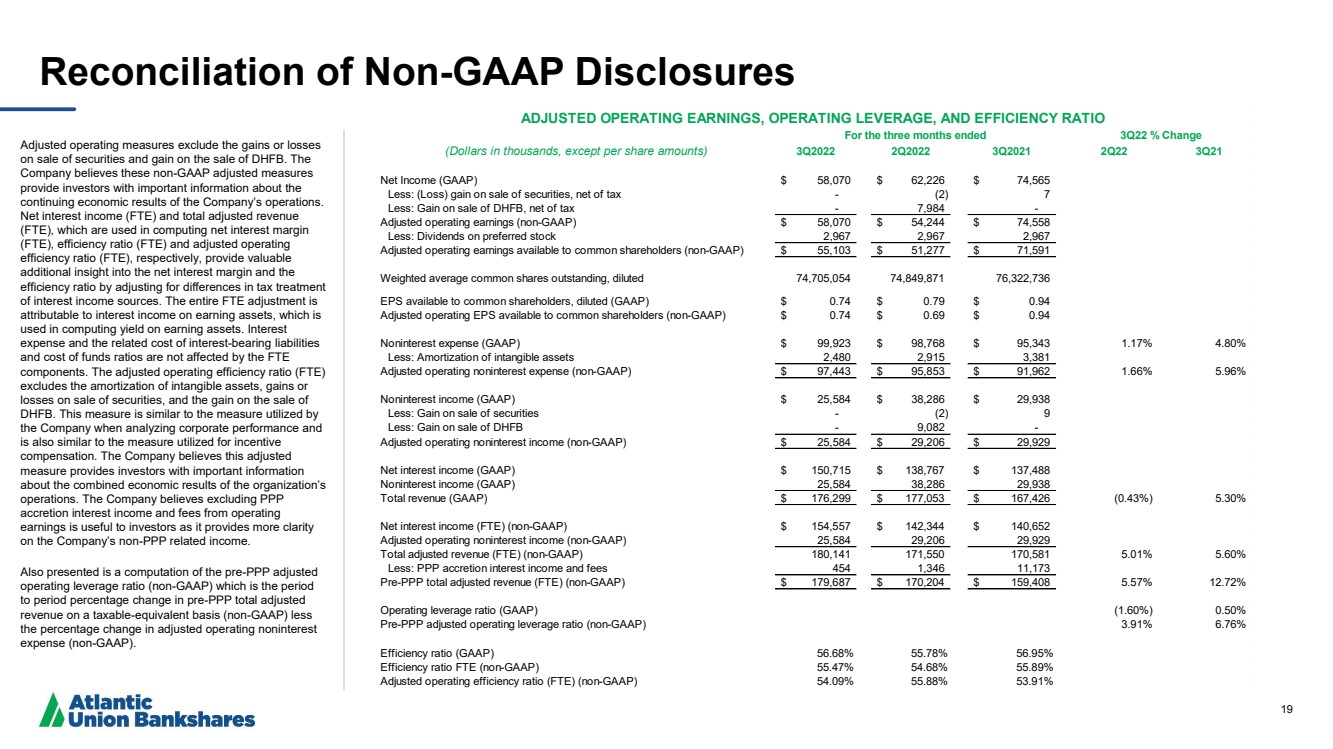
| 19 Reconciliation of Non - GAAP Disclosures Adjusted operating measures exclude the gains or losses on sale of securities and gain on the sale of DHFB. The Company believes these non - GAAP adjusted measures provide investors with important information about the continuing economic results of the Company’s operations. Net interest income (FTE) and total adjusted revenue (FTE), which are used in computing net interest margin (FTE), efficiency ratio (FTE) and adjusted operating efficiency ratio (FTE), respectively, provide valuable additional insight into the net interest margin and the efficiency ratio by adjusting for differences in tax treatment of interest income sources. The entire FTE adjustment is attributable to interest income on earning assets, which is used in computing yield on earning assets. Interest expense and the related cost of interest - bearing liabilities and cost of funds ratios are not affected by the FTE components. The adjusted operating efficiency ratio (FTE) excludes the amortization of intangible assets, gains or losses on sale of securities, and the gain on the sale of DHFB. This measure is similar to the measure utilized by the Company when analyzing corporate performance and is also similar to the measure utilized for incentive compensation. The Company believes this adjusted measure provides investors with important information about the combined economic results of the organization’s operations. The Company believes excluding PPP accretion interest income and fees from operating earnings is useful to investors as it provides more clarity on the Company’s non - PPP related income .. Also presented is a computation of the pre - PPP adjusted operating leverage ratio (non - GAAP) which is the period to period percentage change in pre - PPP total adjusted revenue on a taxable - equivalent basis (non - GAAP) less the percentage change in adjusted operating noninterest expense (non - GAAP). (Dollars in thousands, except per share amounts) 3Q2022 2Q2022 3Q2021 2Q22 3Q21 Net Income (GAAP) 58,070 $ 62,226 $ 74,565 $ Less: (Loss) gain on sale of securities, net of tax - (2) 7 Less: Gain on sale of DHFB, net of tax - 7,984 - Adjusted operating earnings (non-GAAP) 58,070 $ 54,244 $ 74,558 $ Less: Dividends on preferred stock 2,967 2,967 2,967 Adjusted operating earnings available to common shareholders (non-GAAP) 55,103 $ 51,277 $ 71,591 $ Weighted average common shares outstanding, diluted 74,705,054 74,849,871 76,322,736 EPS available to common shareholders, diluted (GAAP) 0.74 $ 0.79 $ 0.94 $ Adjusted operating EPS available to common shareholders (non-GAAP) 0.74 $ 0.69 $ 0.94 $ Noninterest expense (GAAP) 99,923 $ 98,768 $ 95,343 $ 1.17% 4.80% Less: Amortization of intangible assets 2,480 2,915 3,381 Adjusted operating noninterest expense (non-GAAP) 97,443 $ 95,853 $ 91,962 $ 1.66% 5.96% Noninterest income (GAAP) 25,584 $ 38,286 $ 29,938 $ Less: Gain on sale of securities - (2) 9 Less: Gain on sale of DHFB - 9,082 - Adjusted operating noninterest income (non-GAAP) 25,584 $ 29,206 $ 29,929 $ Net interest income (GAAP) 150,715 $ 138,767 $ 137,488 $ Noninterest income (GAAP) 25,584 38,286 29,938 Total revenue (GAAP) 176,299 $ 177,053 $ 167,426 $ (0.43%) 5.30% Net interest income (FTE) (non-GAAP) 154,557 $ 142,344 $ 140,652 $ Adjusted operating noninterest income (non-GAAP) 25,584 29,206 29,929 Total adjusted revenue (FTE) (non-GAAP) 180,141 171,550 170,581 5.01% 5.60% Less: PPP accretion interest income and fees 454 1,346 11,173 Pre-PPP total adjusted revenue (FTE) (non-GAAP) 179,687 $ 170,204 $ 159,408 $ 5.57% 12.72% Operating leverage ratio (GAAP) (1.60%) 0.50% Pre-PPP adjusted operating leverage ratio (non-GAAP) 3.91% 6.76% Efficiency ratio (GAAP) 56.68% 55.78% 56.95% Efficiency ratio FTE (non-GAAP) 55.47% 54.68% 55.89% Adjusted operating efficiency ratio (FTE) (non-GAAP) 54.09% 55.88% 53.91% For the three months ended 3Q22 % Change ADJUSTED OPERATING EARNINGS, OPERATING LEVERAGE, AND EFFICIENCY RATIO |
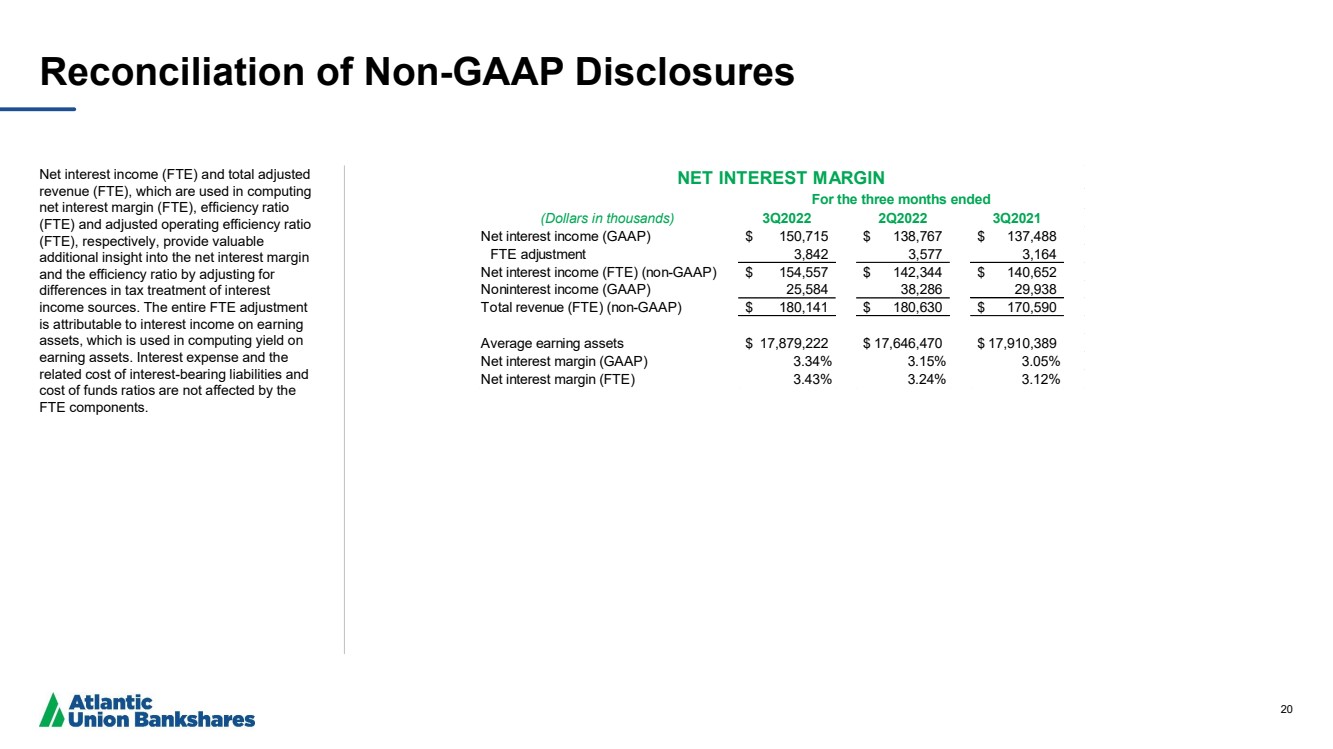
| 20 Reconciliation of Non - GAAP Disclosures Net interest income (FTE) and total adjusted revenue (FTE), which are used in computing net interest margin (FTE), efficiency ratio (FTE) and adjusted operating efficiency ratio (FTE), respectively, provide valuable additional insight into the net interest margin and the efficiency ratio by adjusting for differences in tax treatment of interest income sources. The entire FTE adjustment is attributable to interest income on earning assets, which is used in computing yield on earning assets. Interest expense and the related cost of interest - bearing liabilities and cost of funds ratios are not affected by the FTE components. (Dollars in thousands) 3Q2022 2Q2022 3Q2021 Net interest income (GAAP) 150,715 $ 138,767 $ 137,488 $ FTE adjustment 3,842 3,577 3,164 Net interest income (FTE) (non-GAAP) 154,557 $ 142,344 $ 140,652 $ Noninterest income (GAAP) 25,584 38,286 29,938 Total revenue (FTE) (non-GAAP) 180,141 $ 180,630 $ 170,590 $ Average earning assets 17,879,222 $ 17,646,470 $ 17,910,389 $ Net interest margin (GAAP) 3.34% 3.15% 3.05% Net interest margin (FTE) 3.43% 3.24% 3.12% NET INTEREST MARGIN For the three months ended |
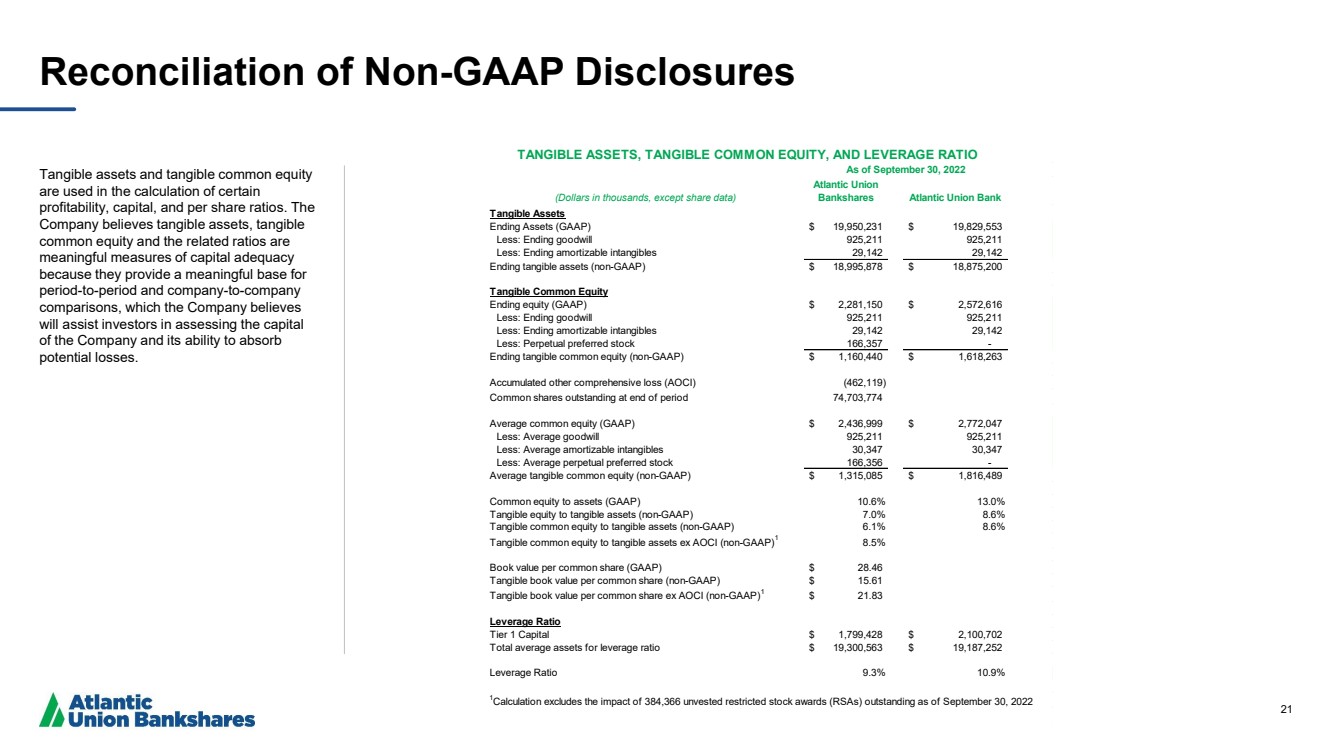
| 21 Reconciliation of Non - GAAP Disclosures Tangible assets and tangible common equity are used in the calculation of certain profitability, capital, and per share ratios. The Company believes tangible assets, tangible common equity and the related ratios are meaningful measures of capital adequacy because they provide a meaningful base for period - to - period and company - to - company comparisons, which the Company believes will assist investors in assessing the capital of the Company and its ability to absorb potential losses. (Dollars in thousands, except share data) Atlantic Union Bankshares Atlantic Union Bank Tangible Assets Ending Assets (GAAP) 19,950,231 $ 19,829,553 $ Less: Ending goodwill 925,211 925,211 Less: Ending amortizable intangibles 29,142 29,142 Amortizable intangibles, net Ending tangible assets (non-GAAP) 18,995,878 $ 18,875,200 $ Tangible Common Equity Total stockholders' equity Ending equity (GAAP) 2,281,150 $ 2,572,616 $ Less: Ending goodwill 925,211 925,211 Less: Ending amortizable intangibles 29,142 29,142 Less: Perpetual preferred stock 166,357 - Ending tangible common equity (non-GAAP) 1,160,440 $ 1,618,263 $ Accumulated other comprehensive loss (AOCI) (462,119) Common shares outstanding at end of period 74,703,774 Stockholders' equity Average common equity (GAAP) 2,436,999 $ 2,772,047 $ Less: Average goodwill Less: Average goodwill 925,211 925,211 Less: Average amortizable intangibles Less: Average amortizable intangibles 30,347 30,347 Less: Average perpetual preferred stock Less: Average perpetual preferred stock 166,356 - Average tangible common equity (non-GAAP) 1,315,085 $ 1,816,489 $ Less: Perpetual preferred stock Common equity to assets (GAAP) 10.6% 13.0% Tangible equity to tangible assets (non-GAAP) 7.0% 8.6% Tangible common equity to tangible assets (non-GAAP) 6.1% 8.6% Tangible common equity to tangible assets ex AOCI (non-GAAP) 1 8.5% Book Value per Common Share Book value per common share (GAAP) 28.46 $ Tangible Book Value per Share Tangible book value per common share (non-GAAP) 15.61 $ Tangible book value per common share ex AOCI (non-GAAP) 1 21.83 $ Leverage Ratio Tier 1 Capital 1,799,428 $ 2,100,702 $ Total average assets for leverage ratio 19,300,563 $ 19,187,252 $ Leverage Ratio 9.3% 10.9% 1 Calculation excludes the impact of 384,366 unvested restricted stock awards (RSAs) outstanding as of September 30, 2022 TANGIBLE ASSETS, TANGIBLE COMMON EQUITY, AND LEVERAGE RATIO As of September 30, 2022 |
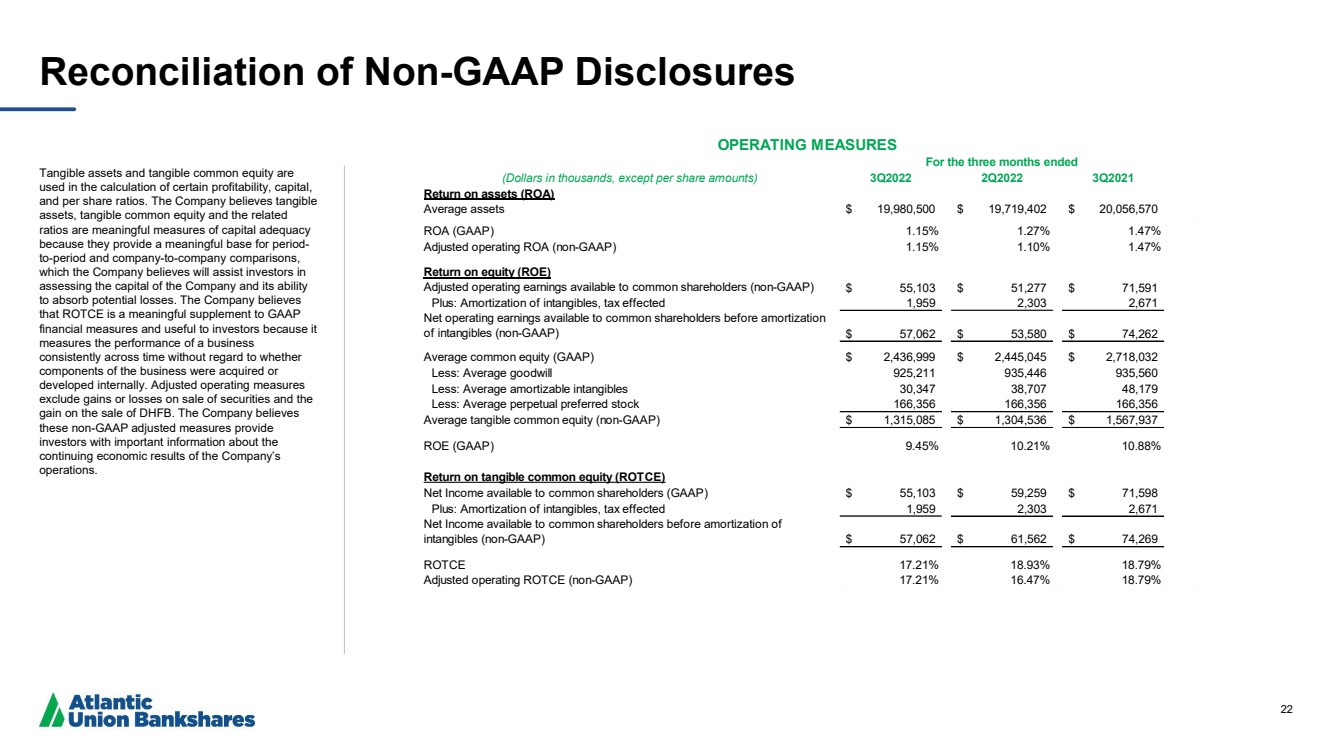
| 22 Reconciliation of Non - GAAP Disclosures Tangible assets and tangible common equity are used in the calculation of certain profitability, capital, and per share ratios. The Company believes tangible assets, tangible common equity and the related ratios are meaningful measures of capital adequacy because they provide a meaningful base for period - to - period and company - to - company comparisons, which the Company believes will assist investors in assessing the capital of the Company and its ability to absorb potential losses. The Company believes that ROTCE is a meaningful supplement to GAAP financial measures and useful to investors because it measures the performance of a business consistently across time without regard to whether components of the business were acquired or developed internally. Adjusted operating measures exclude gains or losses on sale of securities and the gain on the sale of DHFB. The Company believes these non - GAAP adjusted measures provide investors with important information about the continuing economic results of the Company’s operations .. (Dollars in thousands, except per share amounts) 3Q2022 2Q2022 3Q2021 Return on assets (ROA) Average assets 19,980,500 $ 19,719,402 $ 20,056,570 $ ROA (GAAP) 1.15% 1.27% 1.47% Adjusted operating ROA (non-GAAP) 1.15% 1.10% 1.47% Return on equity (ROE) Adjusted operating earnings available to common shareholders (non-GAAP) 55,103 $ 51,277 $ 71,591 $ Plus: Amortization of intangibles, tax effected 1,959 2,303 2,671 Net operating earnings available to common shareholders before amortization of intangibles (non-GAAP) 57,062 $ 53,580 $ 74,262 $ Average common equity (GAAP) 2,436,999 $ 2,445,045 $ 2,718,032 $ Less: Average goodwill 925,211 935,446 935,560 Less: Average amortizable intangibles 30,347 38,707 48,179 Less: Average perpetual preferred stock 166,356 166,356 166,356 Average tangible common equity (non-GAAP) 1,315,085 $ 1,304,536 $ 1,567,937 $ ROE (GAAP) 9.45% 10.21% 10.88% Return on tangible common equity (ROTCE) Net Income available to common shareholders (GAAP) 55,103 $ 59,259 $ 71,598 $ Plus: Amortization of intangibles, tax effected 1,959 2,303 2,671 Net Income available to common shareholders before amortization of intangibles (non-GAAP) 57,062 $ 61,562 $ 74,269 $ ROTCE 17.21% 18.93% 18.79% Adjusted operating ROTCE (non-GAAP) 17.21% 16.47% 18.79% For the three months ended OPERATING MEASURES |
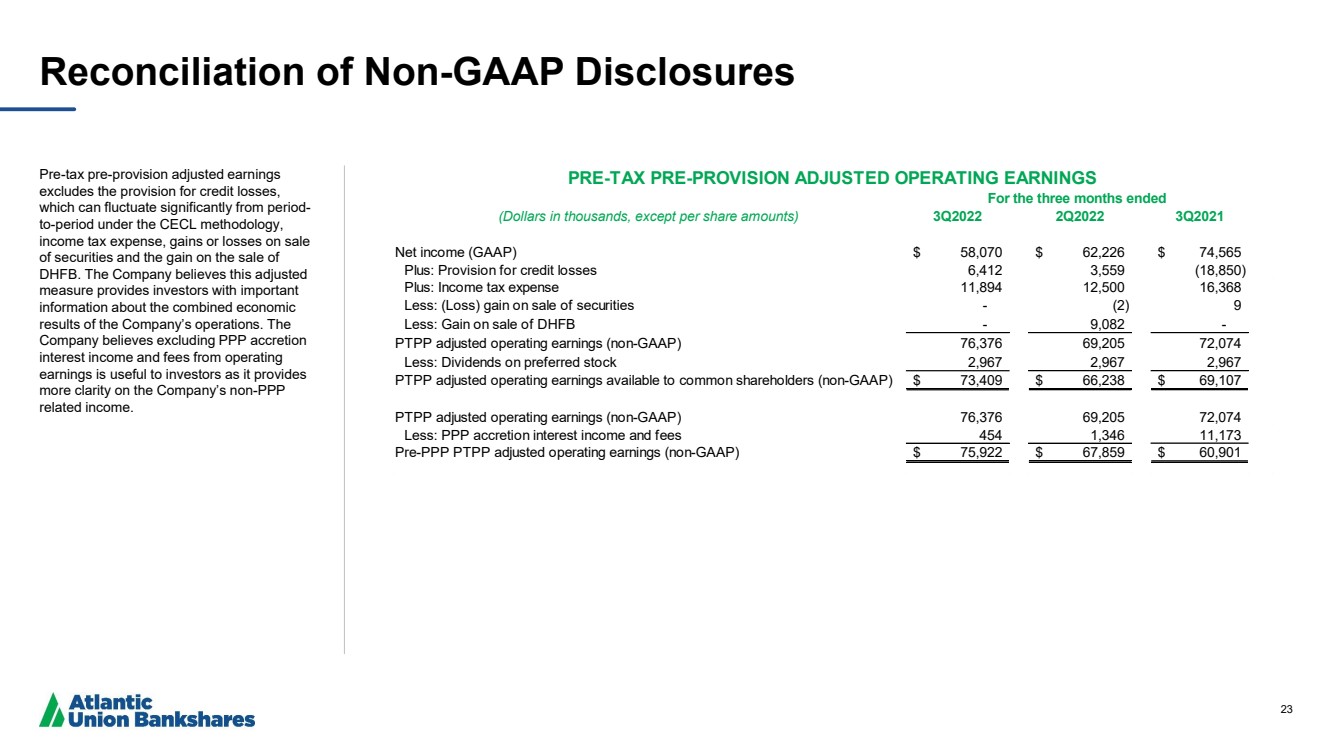
| 23 Reconciliation of Non - GAAP Disclosures Pre - tax pre - provision adjusted earnings excludes the provision for credit losses, which can fluctuate significantly from period - to - period under the CECL methodology, income tax expense, gains or losses on sale of securities and the gain on the sale of DHFB. The Company believes this adjusted measure provides investors with important information about the combined economic results of the Company’s operations. The Company believes excluding PPP accretion interest income and fees from operating earnings is useful to investors as it provides more clarity on the Company’s non - PPP related income. (Dollars in thousands, except per share amounts) 3Q2022 2Q2022 3Q2021 Net income (GAAP) 58,070 $ 62,226 $ 74,565 $ Plus: Provision for credit losses 6,412 3,559 (18,850) Plus: Income tax expense 11,894 12,500 16,368 Less: (Loss) gain on sale of securities - (2) 9 Less: Gain on sale of DHFB - 9,082 - PTPP adjusted operating earnings (non-GAAP) 76,376 69,205 72,074 Less: Dividends on preferred stock 2,967 2,967 2,967 PTPP adjusted operating earnings available to common shareholders (non-GAAP) 73,409 $ 66,238 $ 69,107 $ PTPP adjusted operating earnings (non-GAAP) 76,376 69,205 72,074 Less: PPP accretion interest income and fees 454 1,346 11,173 Pre-PPP PTPP adjusted operating earnings (non-GAAP) 75,922 $ 67,859 $ 60,901 $ For the three months ended PRE-TAX PRE-PROVISION ADJUSTED OPERATING EARNINGS |
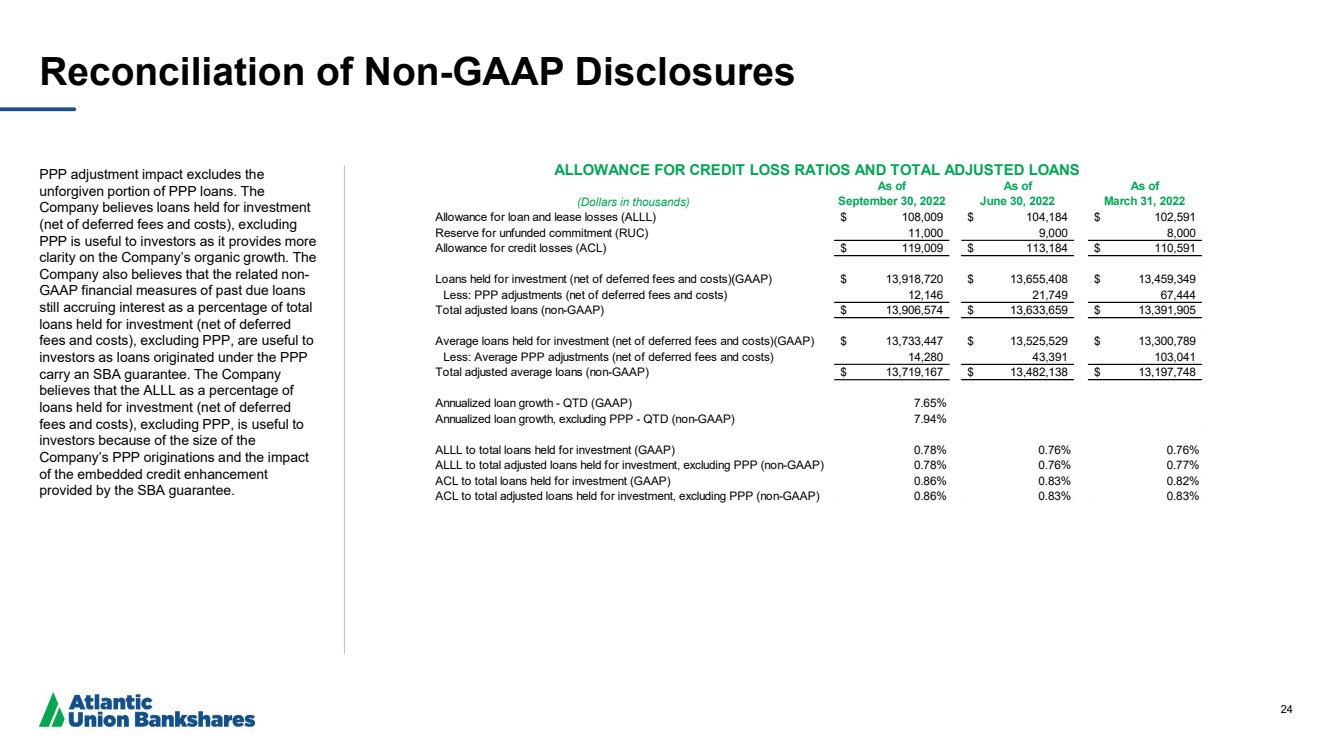
| 24 Reconciliation of Non - GAAP Disclosures PPP adjustment impact excludes the unforgiven portion of PPP loans. The Company believes loans held for investment (net of deferred fees and costs), excluding PPP is useful to investors as it provides more clarity on the Company’s organic growth. The Company also believes that the related non - GAAP financial measures of past due loans still accruing interest as a percentage of total loans held for investment (net of deferred fees and costs), excluding PPP, are useful to investors as loans originated under the PPP carry an SBA guarantee. The Company believes that the ALLL as a percentage of loans held for investment (net of deferred fees and costs), excluding PPP, is useful to investors because of the size of the Company’s PPP originations and the impact of the embedded credit enhancement provided by the SBA guarantee. (Dollars in thousands) As of September 30, 2022 As of June 30, 2022 As of March 31, 2022 Allowance for loan and lease losses (ALLL) 108,009 $ 104,184 $ 102,591 $ Reserve for unfunded commitment (RUC) 11,000 9,000 8,000 Allowance for credit losses (ACL) 119,009 $ 113,184 $ 110,591 $ Loans held for investment (net of deferred fees and costs)(GAAP) 13,918,720 $ 13,655,408 $ 13,459,349 $ Less: PPP adjustments (net of deferred fees and costs) 12,146 21,749 67,444 Total adjusted loans (non-GAAP) 13,906,574 $ 13,633,659 $ 13,391,905 $ Average loans held for investment (net of deferred fees and costs)(GAAP) 13,733,447 $ 13,525,529 $ 13,300,789 $ Less: Average PPP adjustments (net of deferred fees and costs) 14,280 43,391 103,041 Total adjusted average loans (non-GAAP) 13,719,167 $ 13,482,138 $ 13,197,748 $ Annualized loan growth - QTD (GAAP) 7.65% Annualized loan growth, excluding PPP - QTD (non-GAAP) 7.94% ALLL to total loans held for investment (GAAP) 0.78% 0.76% 0.76% ALLL to total adjusted loans held for investment, excluding PPP (non-GAAP) 0.78% 0.76% 0.77% ACL to total loans held for investment (GAAP) 0.86% 0.83% 0.82% ACL to total adjusted loans held for investment, excluding PPP (non-GAAP) 0.86% 0.83% 0.83% ALLOWANCE FOR CREDIT LOSS RATIOS AND TOTAL ADJUSTED LOANS |