| 2 nd Quarter FY2022 Earnings Presentation Nasdaq: AUB July 21, 2022 |

| 2 Forward Looking Statements Certain statements in this presentation may constitute “forward - looking statements” within the meaning of the Private Securities Litigation Reform Act of 1995. Forward - looking statements are statements that include, without limitation, statements on slides entitled “Financial Outlook” and “Top - Tier Financial Targets”, statements regarding the Company’s strategic priorities, outlook on future economic conditions and the impacts of current economic uncertainties, and statements that include, projections, predictions, expectations, or beliefs about future events or results or otherwise are not statements of historical fact. Such fo rward - looking statements are based on certain assumptions as of the time they are made, and are inherently subject to known and unknown risks, uncertainties, and other factors, some of which cannot be predicted or quantified, that may cause actual resul ts, performance, achievements, or trends to be materially different from those expressed or implied by such forward - looking statements. Such statements are often characterized by the use of qualified words (and their derivatives) such as “expect,” “ bel ieve,” “estimate,” “plan,” “project,” “anticipate,” “intend,” “will,” “may,” “view,” “opportunity,” “potential,” or words of sim ilar meaning or other statements concerning opinions or judgment of the Company and its management about future events. Although t he Company believes that its expectations with respect to forward - looking statements are based upon reasonable assumptions within the bounds of its existing knowledge of its business and operations, there can be no assurance that actual fu ture results, performance, or achievements of, or trends affecting, the Company will not differ materially from any projected future results, performance, achievements or trends expressed or implied by such forward - looking statements. Actual future resul ts, performance, achievements or trends may differ materially from historical results or those anticipated depending on a variety of factors, including, but not limited to the effects of or changes in: • market interest rates and the impacts on macroeconomic conditions, customer and client behavior, the Company’s funding costs and the Company’s loan and securities portfolio; • inflation and its impacts on economic growth and customer and client behavior; • general economic and financial market conditions, in the United States generally and particularly in the markets in which the Company operates and which its loans are concentrated, including the effects of declines in real estate values, an increase in unemployment levels and slowdowns in economic growth; • monetary and fiscal policies of the U.S. government, including policies of the U.S. Department of the Treasury and the Federal Reserve; • the quality or composition of the loan or investment portfolios and changes therein; • demand for loan products and financial services in the Company’s market area; • the Company’s ability to manage its growth or implement its growth strategy; • the effectiveness of expense reduction plans; • the introduction of new lines of business or new products and services; • the Company’s ability to recruit and retain key employees; • real estate values in the Bank’s lending area; • an insufficient ACL; • changes in accounting principles, including, without limitation, relating to the CECL methodology; • the Company’s liquidity and capital positions; • concentrations of loans secured by real estate, particularly commercial real estate; • the effectiveness of the Company’s credit processes and management of the Company’s credit risk; • the Company’s ability to compete in the market for financial services and increased competition from fintech companies; • technological risks and developments, and cyber threats, attacks, or events; • the potential adverse effects of unusual and infrequently occurring events, such as weather - related disasters, terrorist acts, geopolitical conflicts (such as the ongoing conflict between Russia and Ukraine) or public health events (such as COVID - 19), and of governmental and societal responses thereto; these potential adverse effects may include, without limitation, adverse effects on the ability of the Company's borrowers to satisfy their obligations to the Company, on the val ue of collateral securing loans, on the demand for the Company's loans or its other products and services, on supply chains and methods used to distribute products and services, on incidents of cyberattack and fraud, on the Company’s liquidity or capital positions, on risks posed by reliance on third - party service providers, on other aspects of the Company's business operations and on financial markets and economic growth; • the effect of steps the Company takes in response to COVID - 19, the severity and duration of the pandemic, the uncertainty regarding new variants of COVID - 19 that have emerged, the speed and efficacy of vaccine and treatment developments, the impact of loosening or tightening of government restrictions, the pace of recovery when the pandemic subsides and the heightened impact it has on many of the risks described herein; • the discontinuation of LIBOR and its impact on the financial markets, and the Company’s ability to manage operational, legal and compliance risks related to the discontinuation of LIBOR and implementation of one or more alternate reference rates, • performance by the Company’s counterparties or vendors; • deposit flows; • the availability of financing and the terms thereof; • the level of prepayments on loans and mortgage - backed securities; • legislative or regulatory changes and requirements; • potential claims, damages, and fines related to litigation or government actions; • the effects of changes in federal, state or local tax laws and regulations; • changes to applicable accounting principles and guidelines; and • other factors, many of which are beyond the control of the Company. Please refer to the “Risk Factors” and “Management’s Discussion and Analysis of Financial Condition and Results of Operations ” s ections of the Company’s Annual Report on Form 10 - K for the year ended December 31, 2021 and related disclosures in other filings, which have been filed with the U.S. Securities and Exchange Commission (“SEC”) and are available on the SEC’s website at www.sec.gov. All risk factors and uncertainties described herein should be consider ed in evaluating forward - looking statements, all forward - looking statements made in this presentation are expressly qualified by the cautionary statements contai ned or referred to herein. Readers are cautioned not to rely too heavily on the forward - looking statements in this presentation, and undue reliance should not be placed on such forward - looking statements. The actual results or developments anticipated may not be realized or, even if substantially realized, they may not have the expe cte d consequences to or effects on the Company or its businesses or operations. Forward - looking statements speak only as of the date they are made. The Company does no t intend or assume any obligation to update, revise or clarify any forward - looking statements that may be made from time to time by or on behalf of the Company, whether as a result of new information, future events or otherwise. |
| 3 Additional Information Non - GAAP Financial Measures This presentation contains certain financial information determined by methods other than in accordance with generally accepted accounting principles in the United States (“GAAP”). These non - GAAP financial measures are a supplement to GAAP, which is used to prepare the Company’s financial statements, and should not be considered in isolation or as a substitute for comparable measures calculated in accordance with GAAP. In addition, the Company’s non - GAAP financial measures may not be comparable to non - GAAP financial measures of other companies. The Company uses the non - GAAP financial measures discussed herein in its analysis of the Company’s performance. The Company’s management believes that these non - GAAP financial measures provide additional understanding of ongoing operations, enhance comparability of results of operations with prior periods and show the effects of significant gains and charges in the periods presented without the impact of items or events that may obscure trends in the Company’s underlying performance. Please see “Reconciliation of Non - GAAP Disclosures” at the end of this presentation for a reconciliation to the nearest GAAP financial measure. No Offer or Solicitation This presentation does not constitute an offer to sell or a solicitation of an offer to buy any securities. No offer of securities shall be made except by means of a prospectus meeting the requirements of the Securities Act of 1933, as amended, and no offer to sell or solicitation of an offer to buy shall be made in any jurisdiction in which such offer, solicitation or sale would be unlawful. About Atlantic Union Bankshares Corporation Headquartered in Richmond, Virginia, Atlantic Union Bankshares Corporation (Nasdaq: AUB) is the holding company for Atlantic Union Bank. Atlantic Union Bank has 114 branches and approximately 130 ATMs located throughout Virginia, and in portions of Maryland and North Carolina. Certain non - bank financial services affiliates of Atlantic Union Bank include: Atlantic Union Equipment Finance, Inc., which provides equipment financing ; Atlantic Union Financial Consultants, LLC, which provides brokerage services; and Union Insurance Group, LLC, which offers various lines of insurance products. Effective June 30, 2022, the Company completed the sale of Dixon, Hubard, Feinour & Brown, Inc., (“DHFB”) which was a former subsidiary of Atlantic Union Bank. |
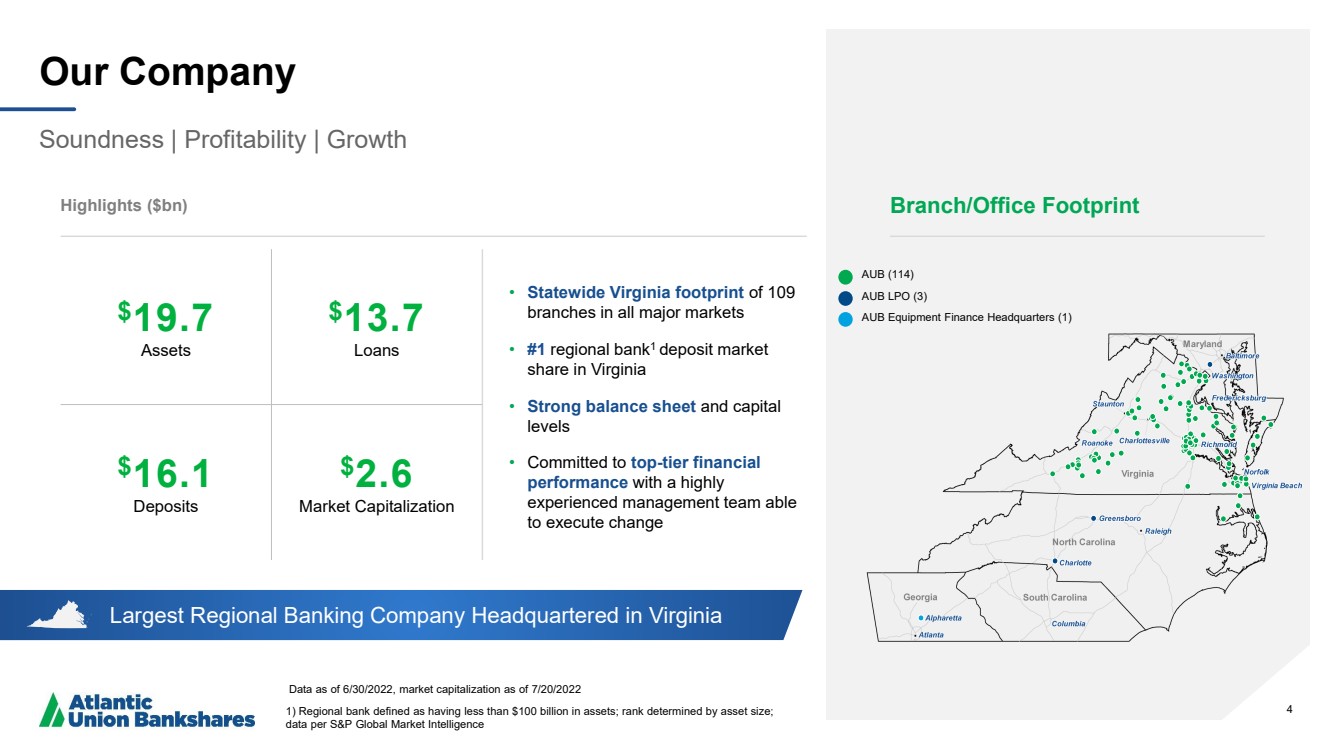
| 4 Largest Regional Banking Company Headquartered in Virginia Our Company Soundness | Profitability | Growth Data as of 6/30/2022 , market capitalization as of 7/20/2022 1) Regional bank defined as having less than $100 billion in assets; rank determined by asset size; data per S&P Global Market Intelligence Highlights ($bn) • Statewide Virginia footprint of 109 branches in all major markets • #1 regional bank 1 deposit market share in Virginia • Strong balance sheet and capital levels • Committed to top - tier financial performance with a highly experienced management team able to execute change 4 $ 19 ..7 Assets $ 13.7 Loans $ 16.1 Deposits $ 2 ..6 Market Capitalization Branch/Office Footprint AUB (114) AUB LPO (3) AUB Equipment Finance Headquarters (1) |
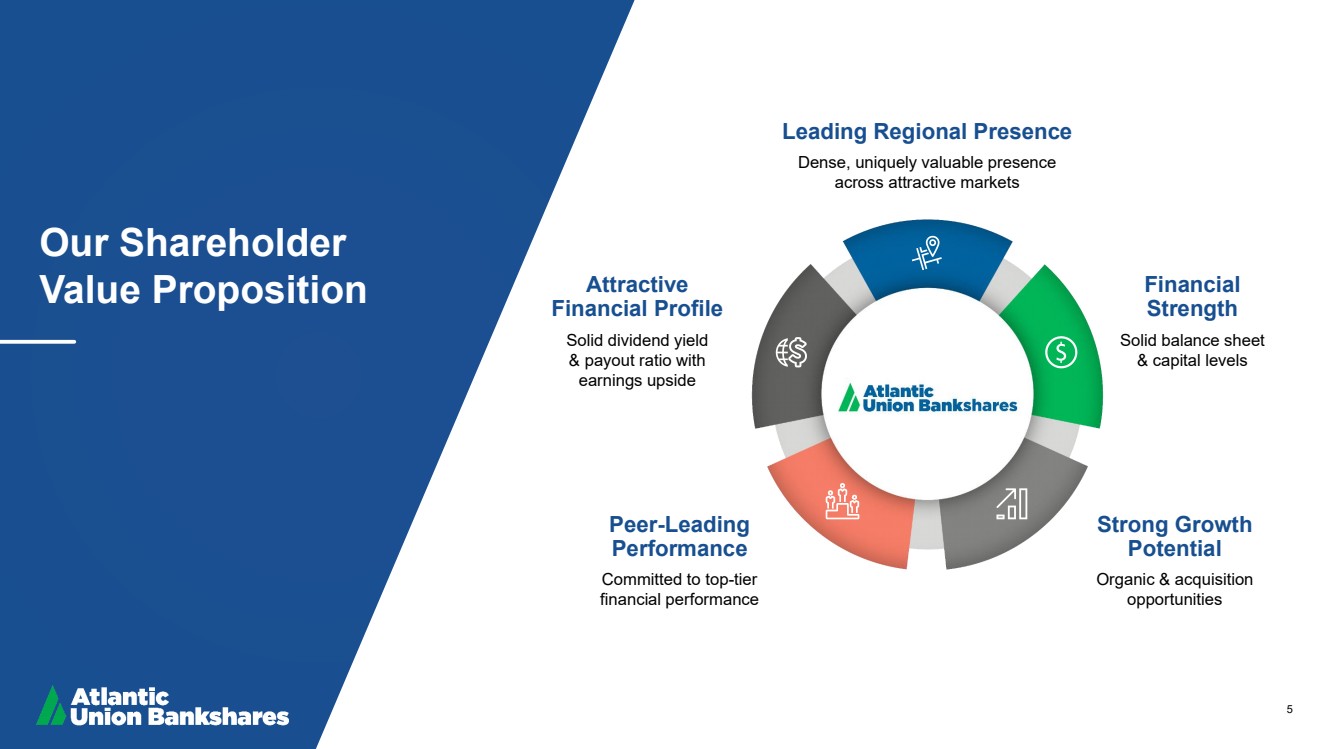
| 5 Our Shareholder Value Proposition Leading Regional Presence Dense, uniquely valuable presence across attractive markets Financial Strength Solid balance sheet & capital levels Attractive Financial Profile Solid dividend yield & payout ratio with earnings upside Strong Growth Potential Organic & acquisition opportunities Peer - Leading Performance Committed to top - tier financial performance |
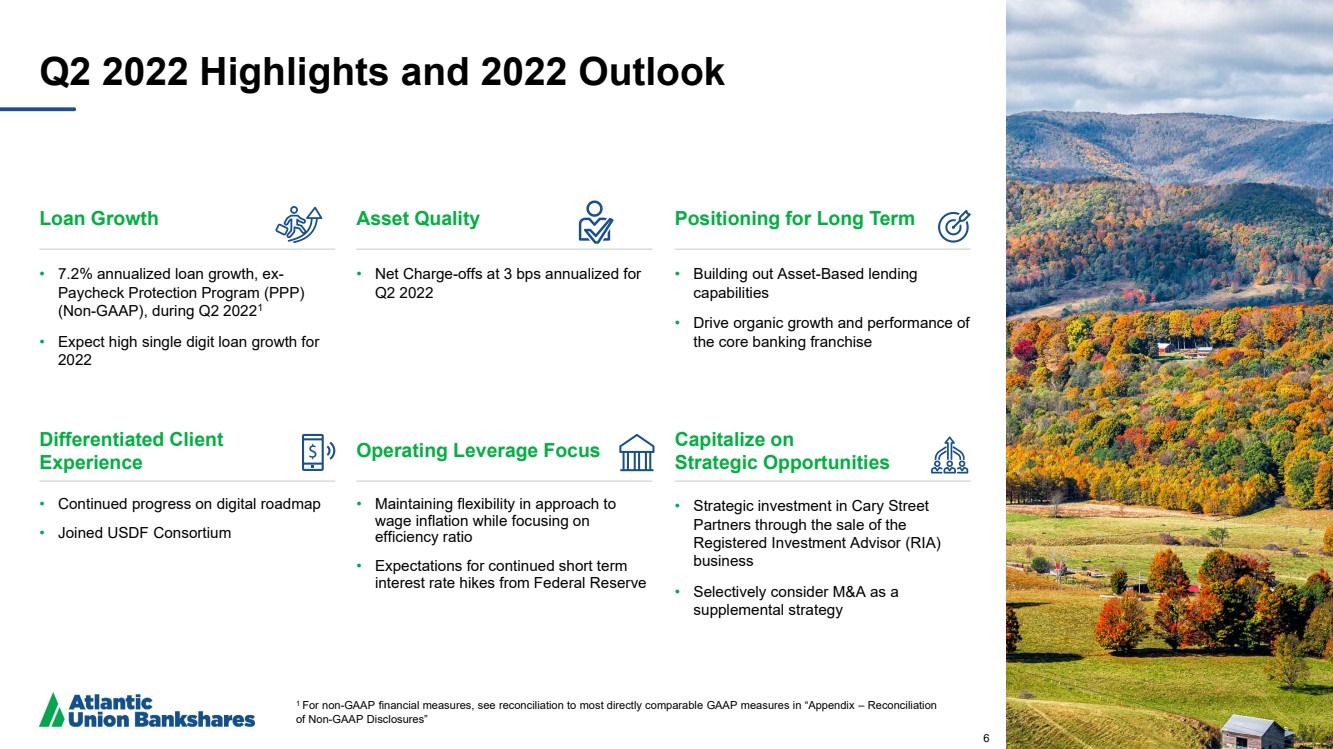
| 6 Q2 2022 Highlights and 2022 Outlook Loan Growth • 7.2% annualized loan growth, ex - Paycheck Protection Program (PPP) (Non - GAAP), during Q2 2022 1 • Expect high single digit loan growth for 2022 Asset Quality • Net Charge - offs at 3 bps annualized for Q2 2022 Positioning for Long Term • Building out Asset - Based lending capabilities • Drive organic growth and performance of the core banking franchise Differentiated Client Experience • Continued progress on digital roadmap • Joined USDF Consortium Operating Leverage Focus • Maintaining flexibility in approach to wage inflation while focusing on efficiency ratio • Expectations for continued short term interest rate hikes from Federal Reserve Capitalize on Strategic Opportunities • Strategic investment in Cary Street Partners through the sale of the Registered Investment Advisor (RIA) business • Selectively consider M&A as a supplemental strategy 6 1 For non - GAAP financial measures, see reconciliation to most directly comparable GAAP measures in “Appendix – Reconciliation of Non - GAAP Disclosures” |
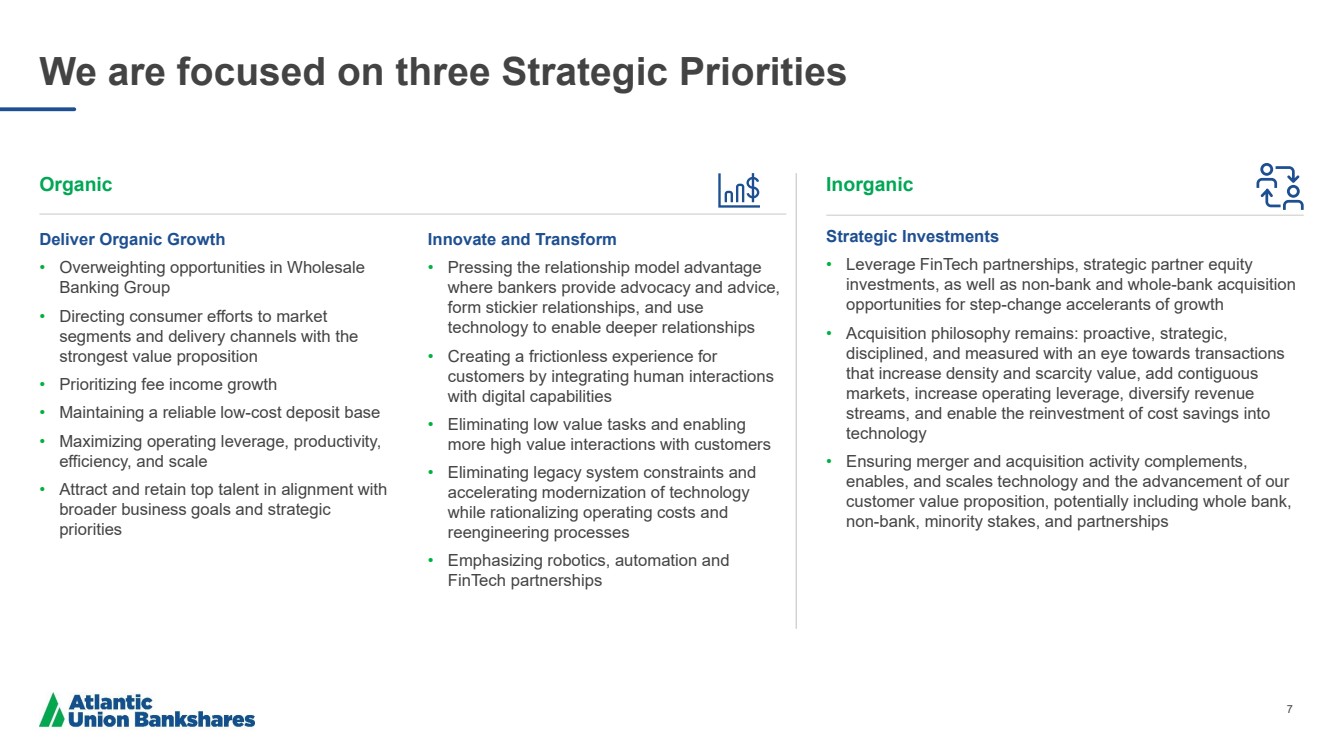
| 7 We are focused on three Strategic Priorities Organic Deliver Organic Growth • Overweighting opportunities in Wholesale Banking Group • Directing consumer efforts to market segments and delivery channels with the strongest value proposition • Prioritizing fee income growth • Maintaining a reliable low - cost deposit base • Maximizing operating leverage, productivity, efficiency, and scale • Attract and retain top talent in alignment with broader business goals and strategic priorities Innovate and Transform • Pressing the relationship model advantage where bankers provide advocacy and advice, form stickier relationships, and use technology to enable deeper relationships • Creating a frictionless experience for customers by integrating human interactions with digital capabilities • Eliminating low value tasks and enabling more high value interactions with customers • Eliminating legacy system constraints and accelerating modernization of technology while rationalizing operating costs and reengineering processes • Emphasizing robotics, automation and FinTech partnerships Inorganic Strategic Investments • Leverage FinTech partnerships, strategic partner equity investments, as well as non - bank and whole - bank acquisition opportunities for step - change accelerants of growth • Acquisition philosophy remains: proactive, strategic, disciplined, and measured with an eye towards transactions that increase density and scarcity value, add contiguous markets, increase operating leverage, diversify revenue streams, and enable the reinvestment of cost savings into technology • Ensuring merger and acquisition activity complements, enables, and scales technology and the advancement of our customer value proposition, potentially including whole bank, non - bank, minority stakes, and partnerships |
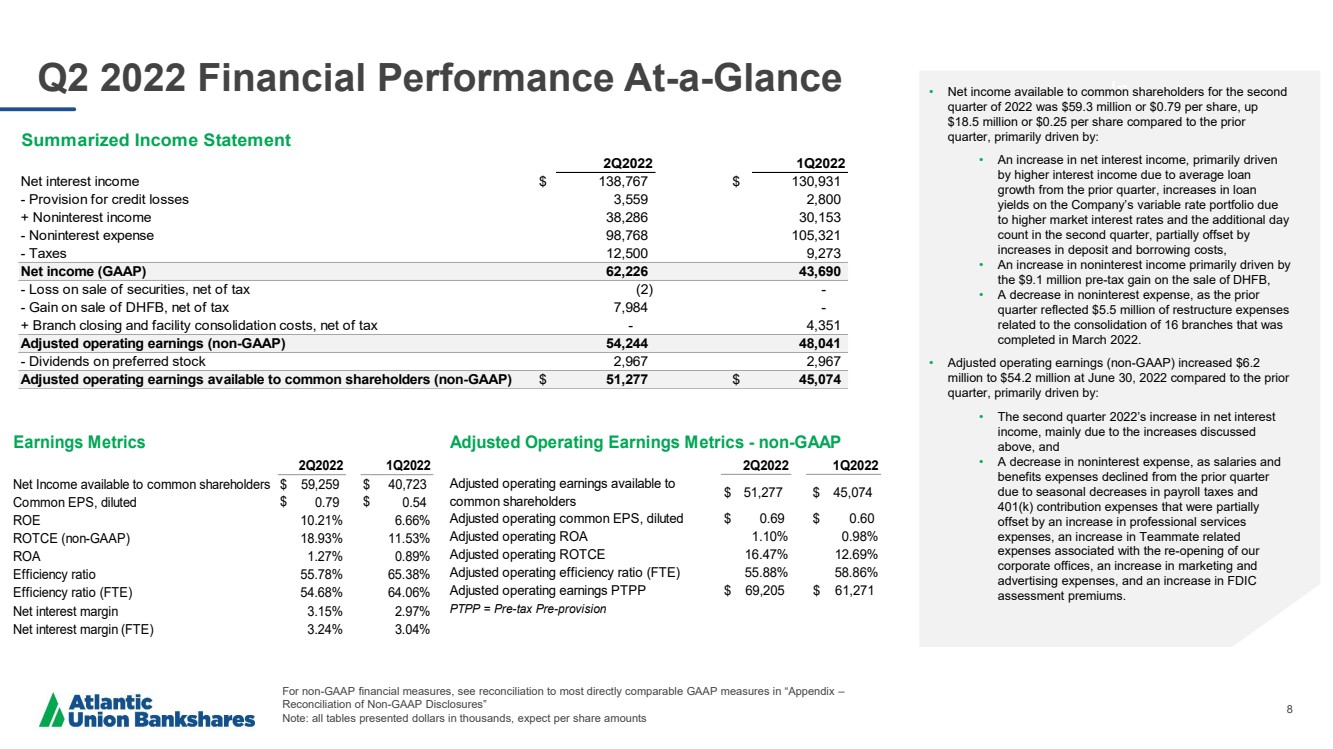
| 8 Q2 2022 Financial Performance At - a - Glance For non - GAAP financial measures, see reconciliation to most directly comparable GAAP measures in “Appendix – Reconciliation of Non - GAAP Disclosures” Note: all tables presented dollars in thousands, expect per share amounts In • Net income available to common shareholders for the second quarter of 2022 was $59.3 million or $ 0.79 per share, up $18.5 million or $ 0.25 per share compared to the prior quarter, primarily driven by: • An increase in net interest income , primarily driven by higher interest income due to average loan growth from the prior quarter, increases in loan yields on the Company’s variable rate portfolio due to higher market interest rates and the additional day count in the second quarter, partially offset by increases in deposit and borrowing costs, • An increase in noninterest income primarily driven by the $9.1 million pre - tax gain on the sale of DHFB, • A decrease in noninterest expense, as the prior quarter reflected $5.5 million of restructure expenses related to the consolidation of 16 branches that was completed in March 2022. • Adjusted operating earnings (non - GAAP) increased $6.2 million to $54.2 million at June 30, 2022 compared to the prior quarter, primarily driven by: • The second quarter 2022’s increase in net interest income, mainly due to the increases discussed above, and • A decrease in noninterest expense, as salaries and benefits expenses declined from the prior quarter due to seasonal decreases in payroll taxes and 401(k) contribution expenses that were partially offset by an increase in professional services expenses, an increase in Teammate related expenses associated with the re - opening of our corporate offices, an increase in marketing and advertising expenses, and an increase in FDIC assessment premiums. 2Q2022 1Q2022 Net Income available to common shareholders $ 59,259 $ 40,723 Common EPS, diluted $ 0.79 $ 0.54 ROE 10.21% 6.66% ROTCE (non-GAAP) 18.93% 11.53% ROA 1.27% 0.89% Efficiency ratio 55.78% 65.38% Efficiency ratio (FTE) 54.68% 64.06% Net interest margin 3.15% 2.97% Net interest margin (FTE) 3.24% 3.04% Earnings Metrics 2Q2022 1Q2022 Net interest income $ 138,767 $ 130,931 - Provision for credit losses 3,559 2,800 + Noninterest income 38,286 30,153 - Noninterest expense 98,768 105,321 - Taxes 12,500 9,273 Net income (GAAP) 62,226 43,690 - Loss on sale of securities, net of tax (2) - - Gain on sale of DHFB, net of tax 7,984 - + Branch closing and facility consolidation costs, net of tax - 4,351 Adjusted operating earnings (non-GAAP) 54,244 48,041 - Dividends on preferred stock 2,967 2,967 Adjusted operating earnings available to common shareholders (non-GAAP) $ 51,277 $ 45,074 Summarized Income Statement 2Q2022 1Q2022 Adjusted operating earnings available to common shareholders $ 51,277 $ 45,074 Adjusted operating common EPS, diluted $ 0.69 $ 0.60 Adjusted operating ROA 1.10% 0.98% Adjusted operating ROTCE 16.47% 12.69% Adjusted operating efficiency ratio (FTE) 55.88% 58.86% Adjusted operating earnings PTPP $ 69,205 $ 61,271 PTPP = Pre-tax Pre-provision Adjusted Operating Earnings Metrics - non-GAAP |
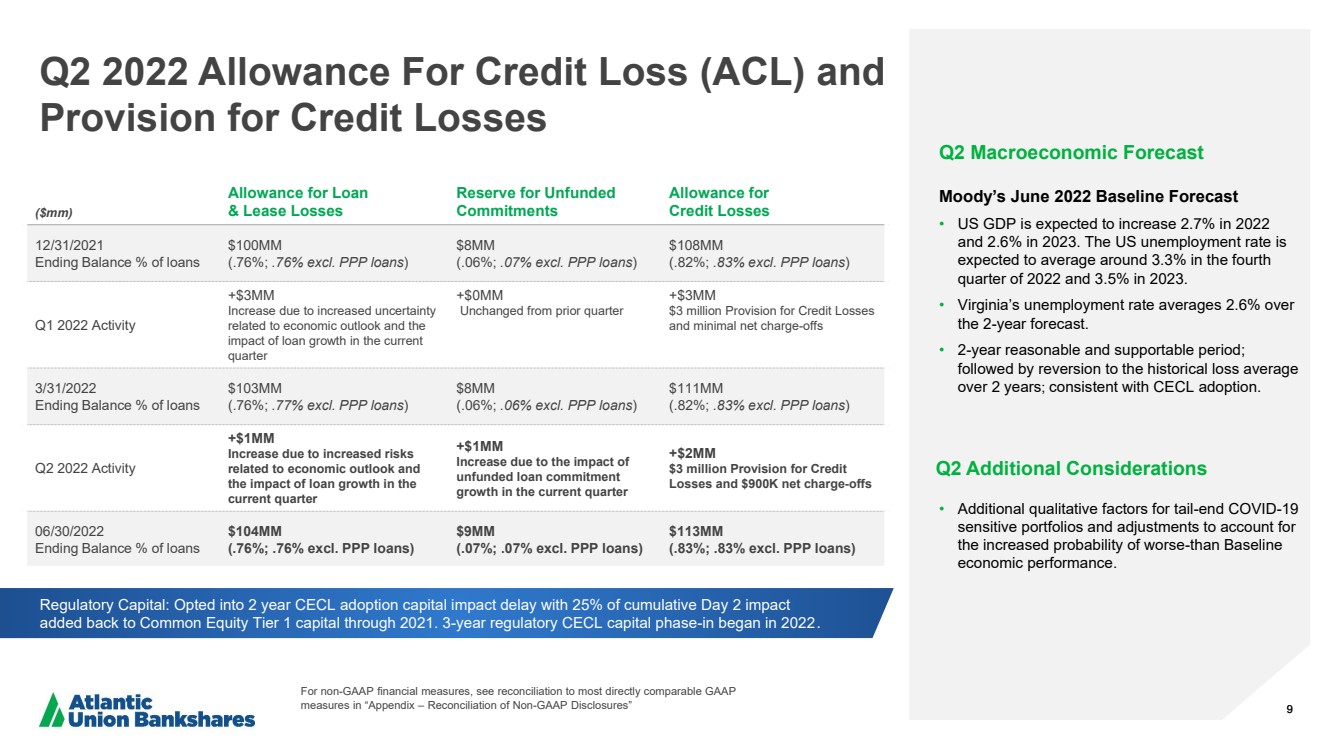
| 9 Q2 2022 Allowance For Credit Loss (ACL) and Provision for Credit Losses 9 Q2 Macroeconomic Forecast Moody’s June 2022 Baseline Forecast • US GDP i s expected to increase 2.7% in 2022 and 2.6 % in 2023. The US unemployment rate is expected to average around 3.3% in the fourth quarter of 2022 and 3.5% in 2023. • Virginia’s unemployment rate averages 2.6% over the 2 - year forecast. • 2 - year reasonable and supportable period; followed by reversion to the historical loss average over 2 years ; consistent with CECL adoption. Q2 Additional Considerations • Additional qualitative factors for tail - end COVID - 19 sensitive portfolios and adjustments to account for the increased probability of worse - than Baseline economic performance. Regulatory Capital: Opted into 2 year CECL adoption capital impact delay with 25% of cumulative Day 2 impact added back to Common Equity Tier 1 capital through 2021. 3 - year regulatory CECL capital phase - in began in 2022 ($mm) Allowance for Loan & Lease Losses Reserve for Unfunded Commitments Allowance for Credit Losses 12/31/2021 Ending Balance % of loans $ 100MM (. 76%; ..76% excl. PPP loans ) $8MM (.06 %; ..07% excl. PPP loans ) $ 108MM (. 82 %; ..83% excl. PPP loans ) Q1 2022 Activity +$3MM Increase due to increased uncertainty related to economic outlook and the impact of loan growth in the current quarter +$0MM Unchanged from prior quarter +$3MM $3 million Provision for Credit Losses and minimal net charge - offs 3/31/2022 Ending Balance % of loans $ 103MM (. 76%; ..77% excl. PPP loans ) $8MM (.06 %; ..06% excl. PPP loans ) $ 111MM (. 82 %; ..83% excl. PPP loans ) Q2 2022 Activity +$1MM Increase due to increased risks related to economic outlook and the impact of loan growth in the current quarter +$1MM Increase due to the impact of unfunded loan commitment growth in the current quarter +$2MM $3 million Provision for Credit Losses and $900K net charge - offs 06/30/2022 Ending Balance % of loans $ 104MM (.76 %; .76% excl. PPP loans) $9MM (. 07%; .07% excl. PPP loans) $ 113MM (. 83%; .83% excl. PPP loans) .. For non - GAAP financial measures, see reconciliation to most directly comparable GAAP measures in “Appendix – Reconciliation of Non - GAAP Disclosures ” |
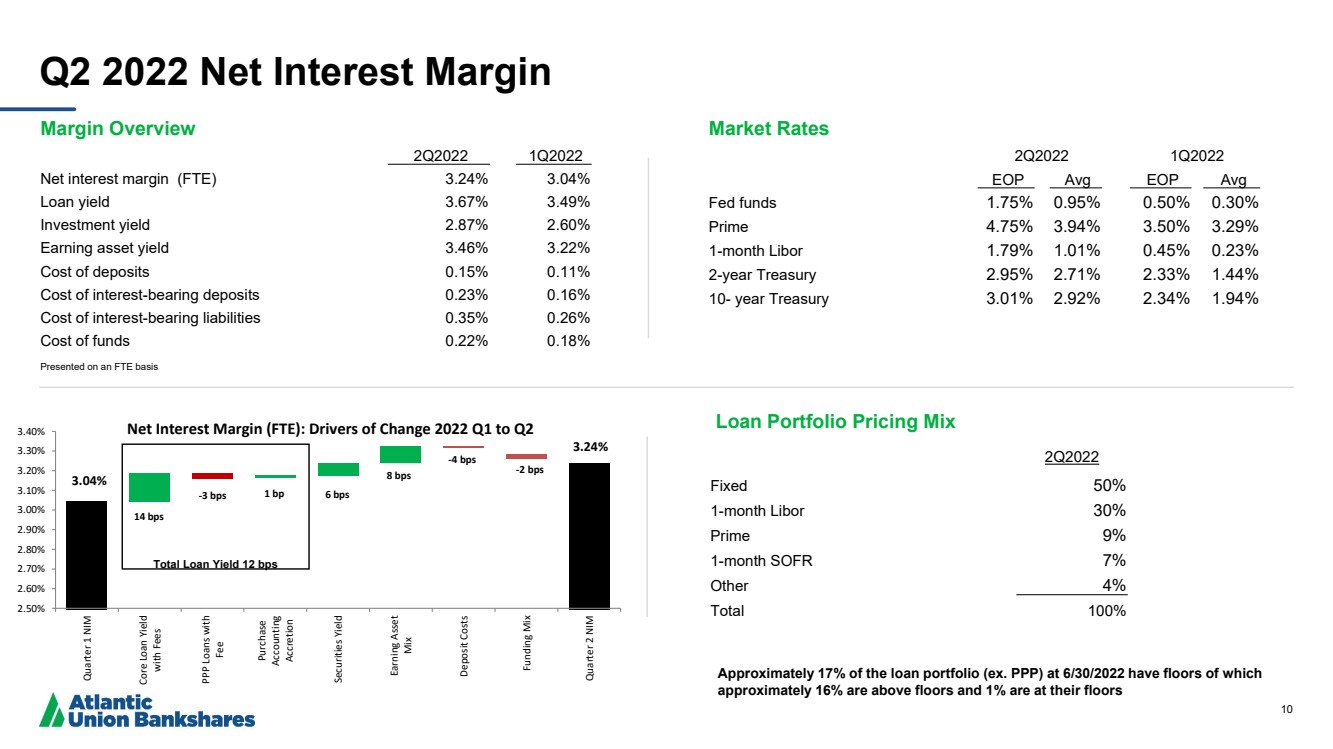
| 10 3.04% 3.24% - 2 bps 2.50% 2.60% 2.70% 2.80% 2.90% 3.00% 3.10% 3.20% 3.30% 3.40% Quarter 1 NIM Core Loan Yield with Fees PPP Loans with Fee Purchase Accounting Accretion Securities Yield Earning Asset Mix Deposit Costs Funding Mix Quarter 2 NIM Net Interest Margin (FTE): Drivers of Change 2022 Q1 to Q2 14 bps 1 bp 8 bps - 3 bps - 4 bps Q2 2022 Net Interest Margin Market Rates 2Q2022 1Q2022 EOP Avg EOP Avg Fed funds 1.75% 0.95% 0.50% 0.30% Prime 4.75% 3.94% 3.50% 3.29% 1 - month Libor 1.79% 1.01% 0.45% 0.23% 2 - year Treasury 2.95% 2.71% 2.33% 1.44% 10 - year Treasury 3.01% 2.92% 2.34% 1.94% Margin Overview 2Q2022 1Q2022 Net interest margin (FTE) 3.24% 3.04% Loan yield 3.67% 3.49% Investment yield 2.87% 2.60% Earning asset yield 3.46% 3.22% Cost of deposits 0.15% 0.11% Cost of interest - bearing deposits 0.23% 0.16% Cost of interest - bearing liabilities 0.35% 0.26% Cost of funds 0.22% 0.18% Presented on an FTE basis Approximately 17% of the loan portfolio (ex. PPP) at 6/30/2022 have floors of which approximately 16% are above floors and 1 % are at their floors Loan Portfolio Pricing Mix 2Q2022 Fixed 50% 1 - month Libor 30% Prime 9% 1 - month SOFR 7% Other 4% Total 100% Total Loan Yield 12 bps 6 bps |
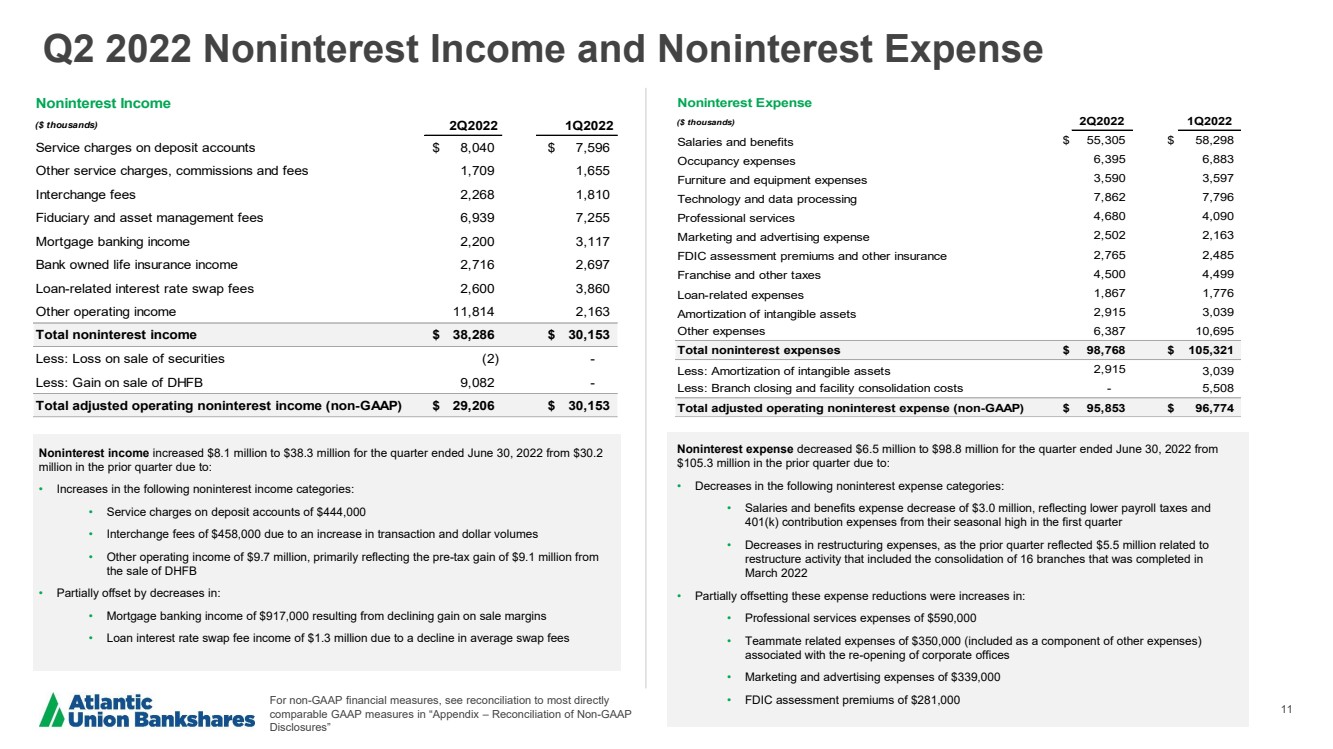
| 11 Q2 2022 Noninterest Income and Noninterest Expense Noninterest income increased $8.1 million to $38.3 million for the quarter ended June 30, 2022 from $30.2 million in the prior quarter due to: • Increases in the following noninterest income categories : • Service charges on deposit accounts of $444,000 • Interchange fees of $458,000 due to an increase in transaction and dollar volumes • O ther operating income of $ 9.7 million, primarily reflecting the pre - tax gain of $9.1 million from the sale of DHFB • Partially offset by decreases in: • Mortgage banking income of $917,000 resulting from declining gain on sale margins • Loan interest rate swap fee income of $1.3 million due to a decline in average swap fees Noninterest expense decreased $6.5 million to $ 98.8 million for the quarter ended June 30 , 2022 from $105.3 million in the prior quarter due to : • Decreases in the following noninterest expense categories: • Salaries and benefits expense decrease of $3.0 million, reflecting lower payroll taxes and 401(k) contribution expenses from their seasonal high in the first quarter • Decreases in restructuring expenses, as the prior quarter reflected $5.5 million related to restructure activity that included the consolidation of 16 branches that was completed in March 2022 • Partially offsetting these expense reductions were increases in: • P rofessional services expenses of $590,000 • Teammate related expenses of $ 350,000 (included as a component of other expenses) associated with the re - opening of corporate offices • M arketing and advertising expenses of $ 339,000 • FDIC assessment premiums of $ 281,000 Noninterest Income ($ thousands) 2Q2022 1Q2022 Service charges on deposit accounts $ 8,040 $ 7,596 Other service charges, commissions and fees 1,709 1,655 Interchange fees 2,268 1,810 Fiduciary and asset management fees 6,939 7,255 Mortgage banking income 2,200 3,117 Bank owned life insurance income 2,716 2,697 Loan-related interest rate swap fees 2,600 3,860 Other operating income 11,814 2,163 Total noninterest income $ 38,286 $ 30,153 Less: Loss on sale of securities (2) - Less: Gain on sale of DHFB 9,082 - Total adjusted operating noninterest income (non-GAAP) $ 29,206 $ 30,153 For non - GAAP financial measures, see reconciliation to most directly comparable GAAP measures in “Appendix – Reconciliation of Non - GAAP Disclosures ” Noninterest Expense ($ thousands) 2Q2022 1Q2022 Salaries and benefits $ 55,305 $ 58,298 Occupancy expenses 6,395 6,883 Furniture and equipment expenses 3,590 3,597 Technology and data processing 7,862 7,796 Professional services 4,680 4,090 Marketing and advertising expense 2,502 2,163 FDIC assessment premiums and other insurance 2,765 2,485 Franchise and other taxes 4,500 4,499 Loan-related expenses 1,867 1,776 Amortization of intangible assets 2,915 3,039 Other expenses 6,387 10,695 Total noninterest expenses $ 98,768 $ 105,321 Less: Amortization of intangible assets 2,915 3,039 Less: Branch closing and facility consolidation costs - 5,508 Total adjusted operating noninterest expense (non-GAAP) $ 95,853 $ 96,774 |
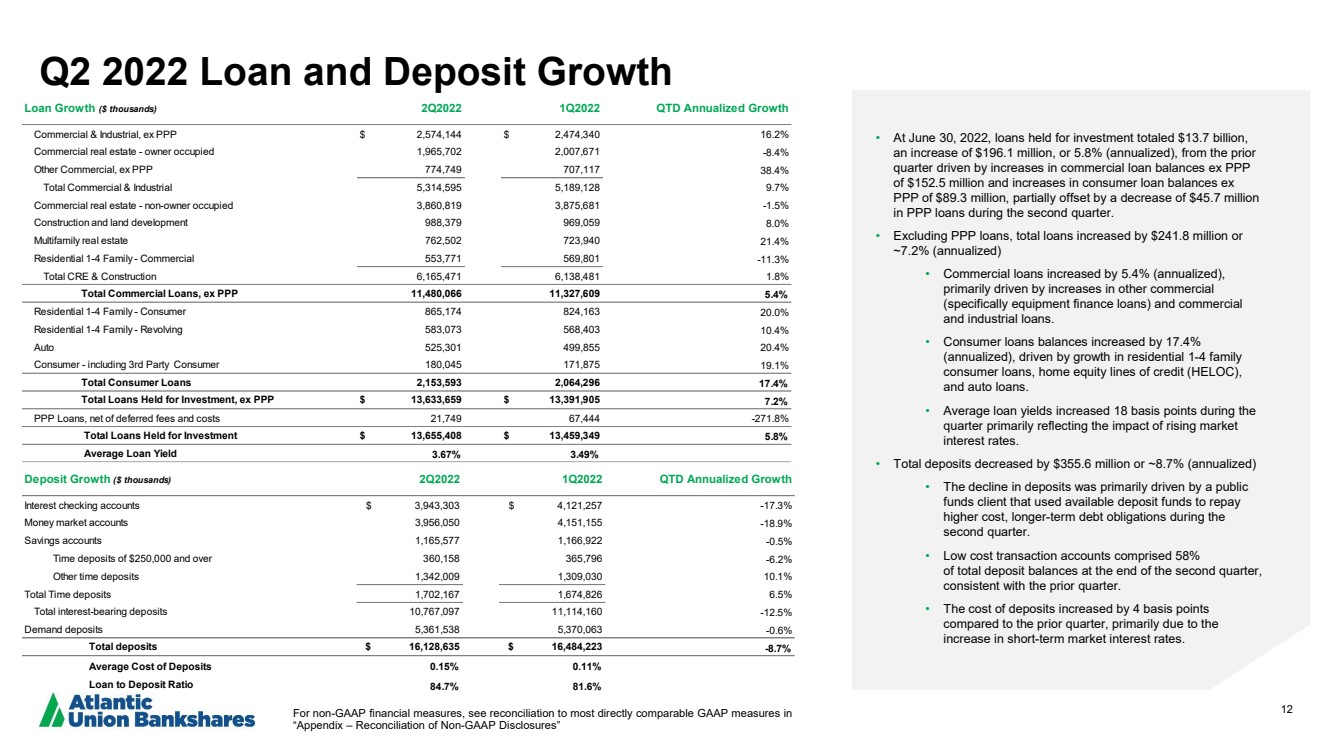
| 12 Q2 2022 Loan and Deposit Growth • At June 30, 2022, loans held for investment totaled $ 13.7 billion, an increase of $196.1 million, or 5.8% (annualized), from the prior quarter driven by increases in commercial loan balances ex PPP of $152.5 million and increases in consumer loan balances ex PPP of $89.3 million , partially offset by a decrease of $45.7 million in PPP loans during the second quarter. • Excluding PPP loans, total loans increased by $241.8 million or ~7.2% (annualized) • Commercial loans increased by 5.4 % (annualized ), primarily driven by increases in other commercial (specifically equipment finance loans) and commercial and industrial loans .. • Consumer loans balances increased by 17.4% (annualized), driven by growth in residential 1 - 4 family consumer loans, home equity lines of credit (HELOC), and auto loans .. • Average loan yields increased 18 basis points during the quarter primarily reflecting the impact of rising market interest rates. • Total deposits decreased by $355.6 million or ~8.7% (annualized) • The decline in deposits was primarily driven by a public funds client that used available deposit funds to repay higher cost, longer - term debt obligations during the second quarter. • Low cost transaction accounts comprised 58% of total deposit balances at the end of the second quarter, consistent with the prior quarter. • The cost of deposits increased by 4 basis points compared to the prior quarter, primarily due to the increase in short - term market interest rates. For non - GAAP financial measures, see reconciliation to most directly comparable GAAP measures in “Appendix – Reconciliation of Non - GAAP Disclosures” Loan Growth ($ thousands) 2Q2022 1Q2022 QTD Annualized Growth Commercial & Industrial, ex PPP $ 2,574,144 $ 2,474,340 16.2% Commercial real estate - owner occupied 1,965,702 2,007,671 -8.4% Other Commercial, ex PPP 774,749 707,117 38.4% Total Commercial & Industrial 5,314,595 5,189,128 9.7% Commercial real estate - non-owner occupied 3,860,819 3,875,681 -1.5% Construction and land development 988,379 969,059 8.0% Multifamily real estate 762,502 723,940 21.4% Residential 1-4 Family - Commercial 553,771 569,801 -11.3% Total CRE & Construction 6,165,471 6,138,481 1.8% Total Commercial Loans, ex PPP 11,480,066 11,327,609 5.4% Residential 1-4 Family - Consumer 865,174 824,163 20.0% Residential 1-4 Family - Revolving 583,073 568,403 10.4% Auto 525,301 499,855 20.4% Consumer - including 3rd Party Consumer 180,045 171,875 19.1% Total Consumer Loans 2,153,593 2,064,296 17.4% Total Loans Held for Investment, ex PPP $ 13,633,659 $ 13,391,905 7.2% PPP Loans, net of deferred fees and costs 21,749 67,444 -271.8% Total Loans Held for Investment $ 13,655,408 $ 13,459,349 5.8% Average Loan Yield 3.67% 3.49% Deposit Growth ($ thousands) 2Q2022 1Q2022 QTD Annualized Growth Interest checking accounts $ 3,943,303 $ 4,121,257 -17.3% Money market accounts 3,956,050 4,151,155 -18.9% Savings accounts 1,165,577 1,166,922 -0.5% Time deposits of $250,000 and over 360,158 365,796 -6.2% Other time deposits 1,342,009 1,309,030 10.1% Total Time deposits 1,702,167 1,674,826 6.5% Total interest-bearing deposits 10,767,097 11,114,160 -12.5% Demand deposits 5,361,538 5,370,063 -0.6% Total deposits $ 16,128,635 $ 16,484,223 -8.7% Average Cost of Deposits 0.15% 0.11% Loan to Deposit Ratio 84.7% 81.6% |
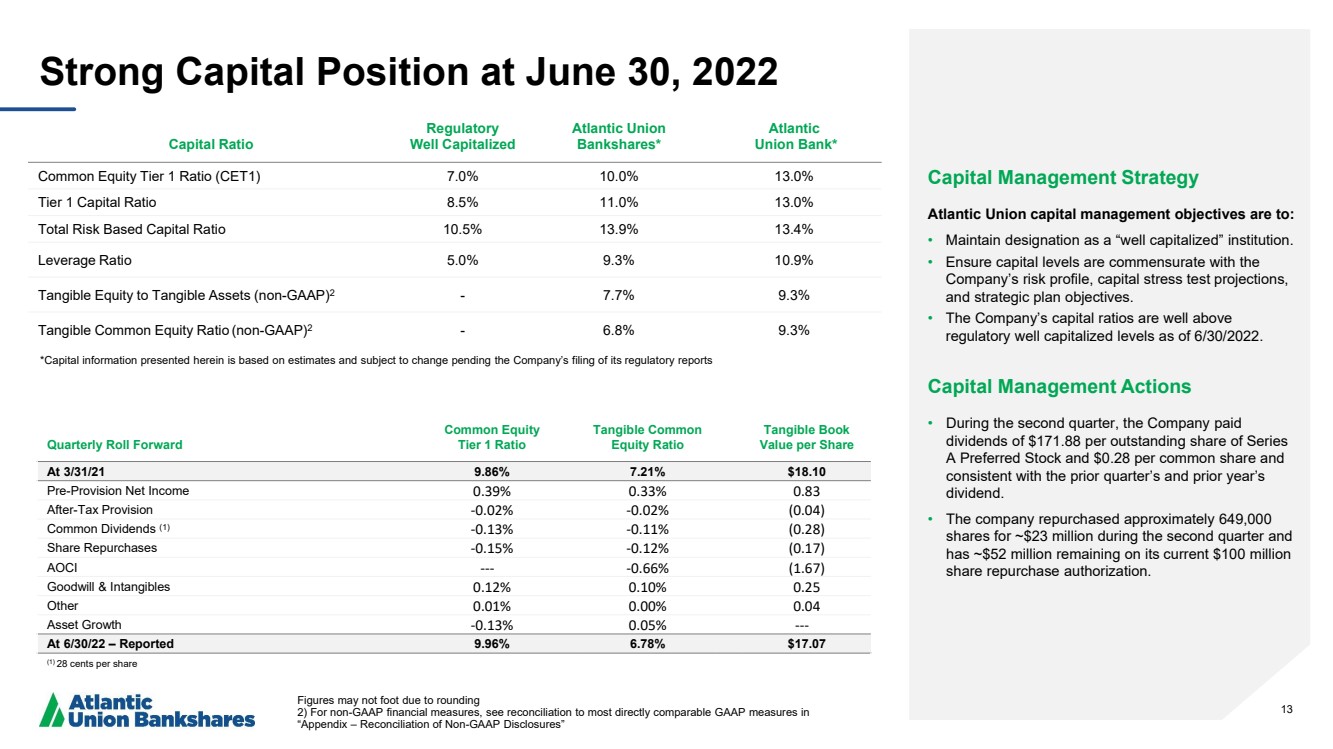
| 13 Strong Capital Position at June 30, 2022 Capital Ratio Regulatory Well Capitalized Atlantic Union Bankshares* Atlantic Union Bank* Common Equity Tier 1 Ratio (CET1) 7.0% 10.0% 13.0% Tier 1 Capital Ratio 8.5% 11.0% 13.0% Total Risk Based Capital Ratio 10.5% 13.9% 13.4% Leverage Ratio 5.0% 9.3% 10.9% Tangible Equity to Tangible Assets ( non - GAAP) 2 - 7.7% 9.3% Tangible Common Equity Ratio ( non - GAAP) 2 - 6.8% 9.3% Figures may not foot due to rounding 2 ) For non - GAAP financial measures, see reconciliation to most directly comparable GAAP measures in “Appendix – Reconciliation of Non - GAAP Disclosures” Capital Management Strategy Atlantic Union capital management objectives are to: • Maintain designation as a “well capitalized” institution. • Ensure capital levels are commensurate with the Company’s risk profile, capital stress test projections, and strategic plan objectives. • The Company’s capital ratios are well above regulatory well capitalized levels as of 6/30/2022. Capital Management Actions • During the second quarter , the Company paid dividends of $171.88 per outstanding share of Series A Preferred Stock and $0.28 per common share and consistent with the prior quarter’s and prior year’s dividend .. • The company repurchased approximately 649,000 shares for ~$23 million during the second quarter and has ~$52 million remaining on its current $100 million share repurchase authorization. Quarterly Roll Forward Common Equity Tier 1 Ratio Tangible Common Equity Ratio Tangible Book Value per Share At 3/31/21 9.86% 7.21% $18.10 Pre - Provision Net Income 0.39% 0.33% 0.83 After - Tax Provision - 0.02% - 0.02% ( 0.04) Common Dividends (1) - 0.13% - 0.11% ( 0.28) Share Repurchases - 0.15% - 0.12% ( 0.17) AOCI --- - 0.66% ( 1.67) Goodwill & Intangibles 0.12% 0.10% 0.25 Other 0.01% 0.00% 0.04 Asset Growth - 0.13% 0.05% --- At 6/30/22 – Reported 9.96% 6.78% $17.07 (1) 28 cents per share *Capital information presented herein is based on estimates and subject to change pending the Company’s filing of its regulat or y reports |
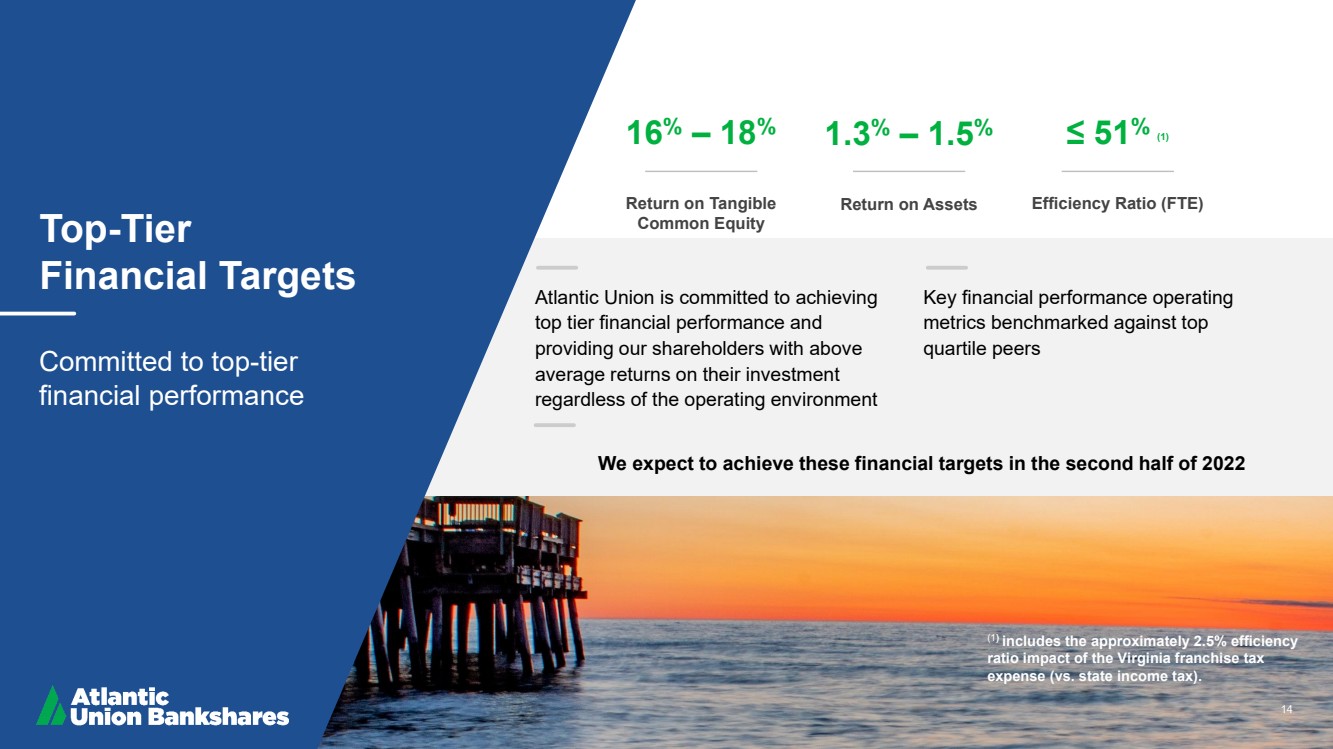
| 14 Top - Tier Financial Targets Committed to top - tier financial performance 16 % – 18 % Return on Tangible Common Equity 1.3 % – 1.5 % Return on Assets ≤ 51 % (1) Efficiency Ratio (FTE) Atlantic Union is committed to achieving top tier financial performance and providing our shareholders with above average returns on their investment regardless of the operating environment Key financial performance operating metrics benchmarked against top quartile peers 14 We expect to achieve these financial targets in the second half of 2022 (1 ) includes the approximately 2.5% efficiency ratio impact of the Virginia franchise tax expense (vs. state income tax). |
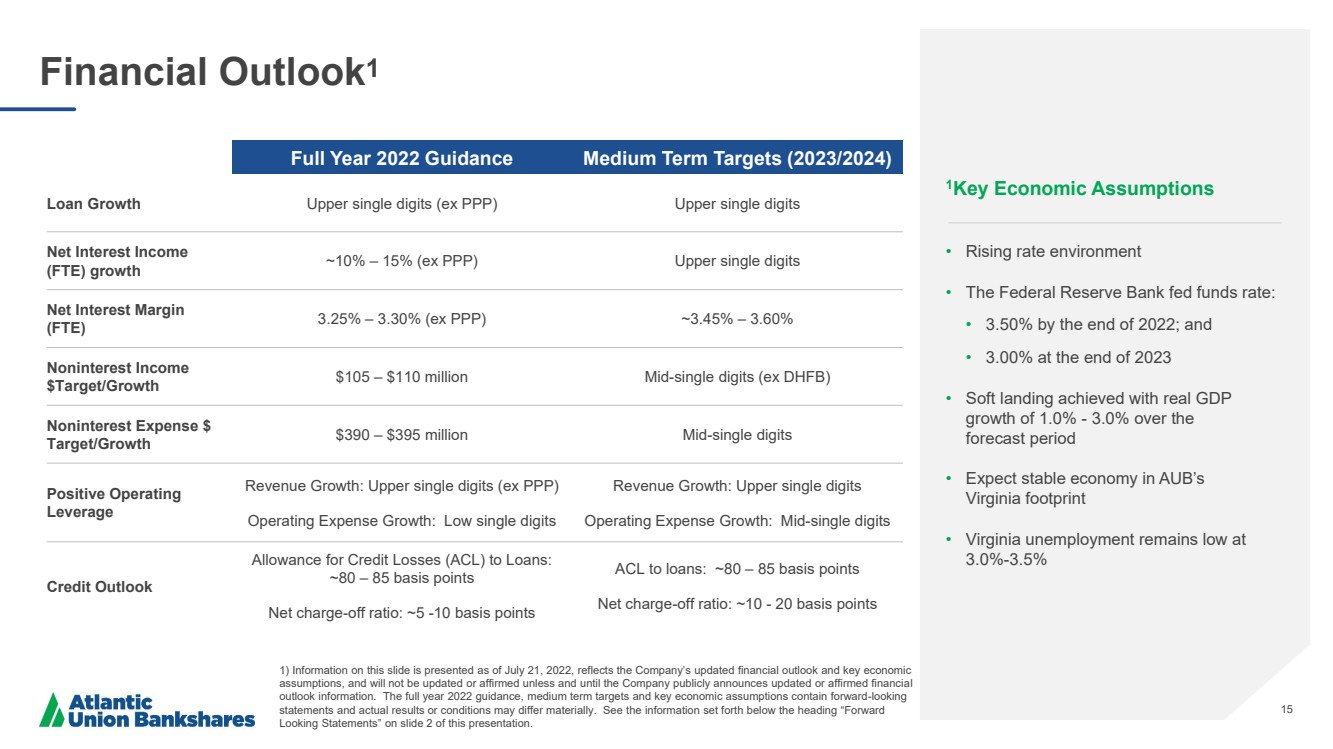
| 15 Financial Outlook 1 1 Key Economic Assumptions • Rising rate environment • The Federal Reserve Bank fed funds rate: • 3.50% by the end of 2022; and • 3.00% at the end of 2023 • Soft landing achieved with real GDP growth of 1.0% - 3.0% over the forecast period • Expect stable economy in AUB’s Virginia footprint • Virginia unemployment remains low at 3.0% - 3.5% Full Year 2022 Guidance Medium Term Targets (2023/2024) Loan Growth Upper single digits (ex PPP) Upper single digits Net Interest Income (FTE) growth ~10% – 15% (ex PPP) Upper single digits Net Interest Margin (FTE) 3.25% – 3.30% (ex PPP) ~ 3.45% – 3.60% Noninterest Income $Target/Growth $105 – $110 million Mid - single digits (ex DHFB ) Noninterest Expense $ Target/Growth $ 390 – $395 million Mid - single digits Positive Operating Leverage Revenue Growth: Upper single digits (ex PPP) Operating Expense Growth: Low single digits Revenue Growth: Upper single digits Operating Expense Growth: M id - single digits Credit Outlook Allowance for Credit Losses (ACL) to Loans: ~80 – 85 basis points Net charge - off ratio: ~5 - 10 basis points ACL to loans: ~80 – 85 basis points Net charge - off ratio: ~10 - 20 basis points 1) Information on this slide is presented as of July 21, 2022, reflects the Company’s updated financial outlook and key economic assumptions, and will not be updated or affirmed unless and until the Company publicly announces updated or affirmed financia l outlook information. The full year 2022 guidance, medium term targets and key economic assumptions contain forward - looking statements and actual results or conditions may differ materially. See the information set forth below the heading “Forward Looking Statements” on slide 2 of this presentation. |
| 16 Appendix |

| 17 Reconciliation of Non - GAAP Disclosures The Company has provided supplemental performance measures on a tax - equivalent, tangible, operating, adjusted, or pre - tax pre - pr ovision basis. These non - GAAP financial measures are a supplement to GAAP, which is used to prepare the Company’s financial statements, and sho uld not be considered in isolation or as a substitute for comparable measures calculated in accordance with GAAP .. In addition, the Company’s non - GAAP financial measures may not be comparable to non - GAAP financial measures of other companies. The Company uses the non - GAAP financ ial measures discussed herein in its analysis of the Company’s performance. The Company’s management believes that these non - GAAP fi nancial measures provide additional understanding of ongoing operations, enhance comparability of results of operations with prior pe rio ds and show the effects of significant gains and charges in the periods presented without the impact of items or events that may obscure tren ds in the Company’s underlying performance. |
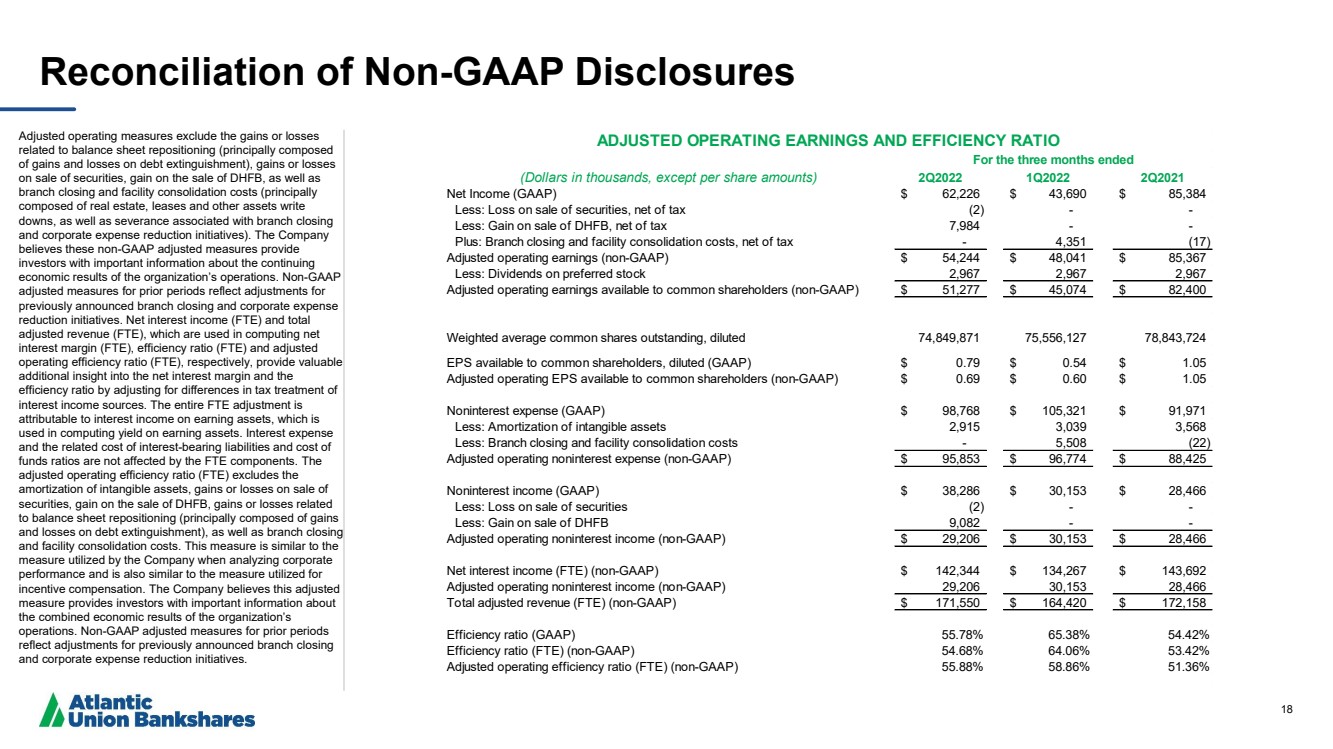
| 18 Reconciliation of Non - GAAP Disclosures Adjusted operating measures exclude the gains or losses related to balance sheet repositioning (principally composed of gains and losses on debt extinguishment), gains or losses on sale of securities, gain on the sale of DHFB, as well as branch closing and facility consolidation costs (principally composed of real estate, leases and other assets write downs, as well as severance associated with branch closing and corporate expense reduction initiatives). The Company believes these non - GAAP adjusted measures provide investors with important information about the continuing economic results of the organization’s operations. Non - GAAP adjusted measures for p rior periods reflect adjustments for previously announced branch closing and corporate expense reduction initiatives. Net interest income (FTE) and total adjusted revenue (FTE), which are used in computing net interest margin (FTE), efficiency ratio (FTE) and adjusted operating efficiency ratio (FTE), respectively, provide valuable additional insight into the net interest margin and the efficiency ratio by adjusting for differences in tax treatment of interest income sources. The entire FTE adjustment is attributable to interest income on earning assets, which is used in computing yield on earning assets. Interest expense and the related cost of interest - bearing liabilities and cost of funds ratios are not affected by the FTE components. The adjusted operating efficiency ratio (FTE) excludes the amortization of intangible assets, gains or losses on sale of securities, gain on the sale of DHFB, gains or losses related to balance sheet repositioning (principally composed of gains and losses on debt extinguishment), as well as branch closing and facility consolidation costs. This measure is similar to the measure utilized by the Company when analyzing corporate performance and is also similar to the measure utilized for incentive compensation. The Company believes this adjusted measure provides investors with important information about the combined economic results of the organization’s operations. Non - GAAP adjusted measures for prior periods reflect adjustments for previously announced branch closing and corporate expense reduction initiatives. (Dollars in thousands, except per share amounts) 2Q2022 1Q2022 2Q2021 Net Income (GAAP) 62,226 $ 43,690 $ 85,384 $ Less: Loss on sale of securities, net of tax (2) - - Less: Gain on sale of DHFB, net of tax 7,984 - - Plus: Branch closing and facility consolidation costs, net of tax - 4,351 (17) Adjusted operating earnings (non-GAAP) 54,244 $ 48,041 $ 85,367 $ Less: Dividends on preferred stock 2,967 2,967 2,967 Adjusted operating earnings available to common shareholders (non-GAAP) 51,277 $ 45,074 $ 82,400 $ Weighted average common shares outstanding, diluted 74,849,871 75,556,127 78,843,724 EPS available to common shareholders, diluted (GAAP) 0.79 $ 0.54 $ 1.05 $ Adjusted operating EPS available to common shareholders (non-GAAP) 0.69 $ 0.60 $ 1.05 $ Noninterest expense (GAAP) 98,768 $ 105,321 $ 91,971 $ Less: Amortization of intangible assets 2,915 3,039 3,568 Less: Branch closing and facility consolidation costs - 5,508 (22) Adjusted operating noninterest expense (non-GAAP) 95,853 $ 96,774 $ 88,425 $ Noninterest income (GAAP) 38,286 $ 30,153 $ 28,466 $ Less: Loss on sale of securities (2) - - Less: Gain on sale of DHFB 9,082 - - Adjusted operating noninterest income (non-GAAP) 29,206 $ 30,153 $ 28,466 $ Net interest income (FTE) (non-GAAP) 142,344 $ 134,267 $ 143,692 $ Adjusted operating noninterest income (non-GAAP) 29,206 30,153 28,466 Total adjusted revenue (FTE) (non-GAAP) 171,550 $ 164,420 $ 172,158 $ Efficiency ratio (GAAP) 55.78% 65.38% 54.42% Efficiency ratio (FTE) (non-GAAP) 54.68% 64.06% 53.42% Adjusted operating efficiency ratio (FTE) (non-GAAP) 55.88% 58.86% 51.36% ADJUSTED OPERATING EARNINGS AND EFFICIENCY RATIO For the three months ended |
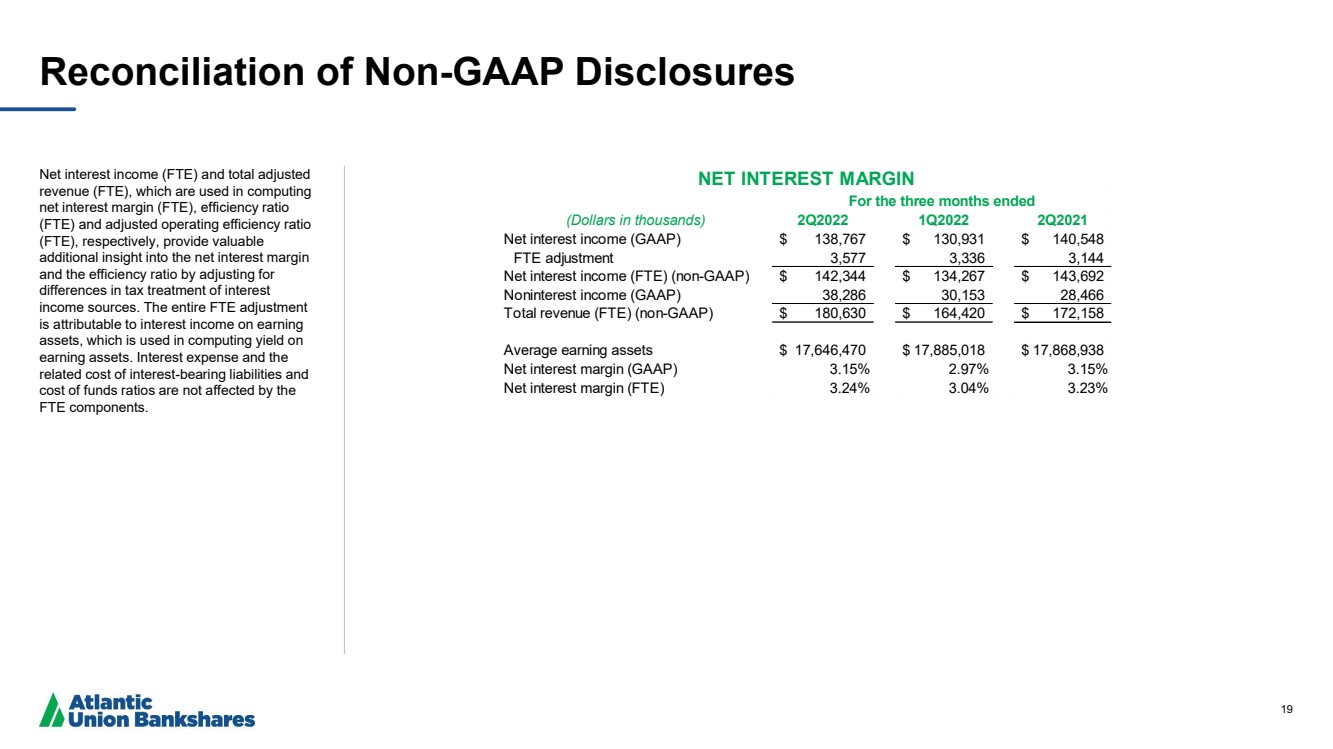
| 19 Reconciliation of Non - GAAP Disclosures Net interest income (FTE) and total adjusted revenue (FTE), which are used in computing net interest margin (FTE), efficiency ratio (FTE) and adjusted operating efficiency ratio (FTE), respectively, provide valuable additional insight into the net interest margin and the efficiency ratio by adjusting for differences in tax treatment of interest income sources. The entire FTE adjustment is attributable to interest income on earning assets, which is used in computing yield on earning assets. Interest expense and the related cost of interest - bearing liabilities and cost of funds ratios are not affected by the FTE components. (Dollars in thousands) 2Q2022 1Q2022 2Q2021 Net interest income (GAAP) 138,767 $ 130,931 $ 140,548 $ FTE adjustment 3,577 3,336 3,144 Net interest income (FTE) (non-GAAP) 142,344 $ 134,267 $ 143,692 $ Noninterest income (GAAP) 38,286 30,153 28,466 Total revenue (FTE) (non-GAAP) 180,630 $ 164,420 $ 172,158 $ Average earning assets 17,646,470 $ 17,885,018 $ 17,868,938 $ Net interest margin (GAAP) 3.15% 2.97% 3.15% Net interest margin (FTE) 3.24% 3.04% 3.23% NET INTEREST MARGIN For the three months ended |
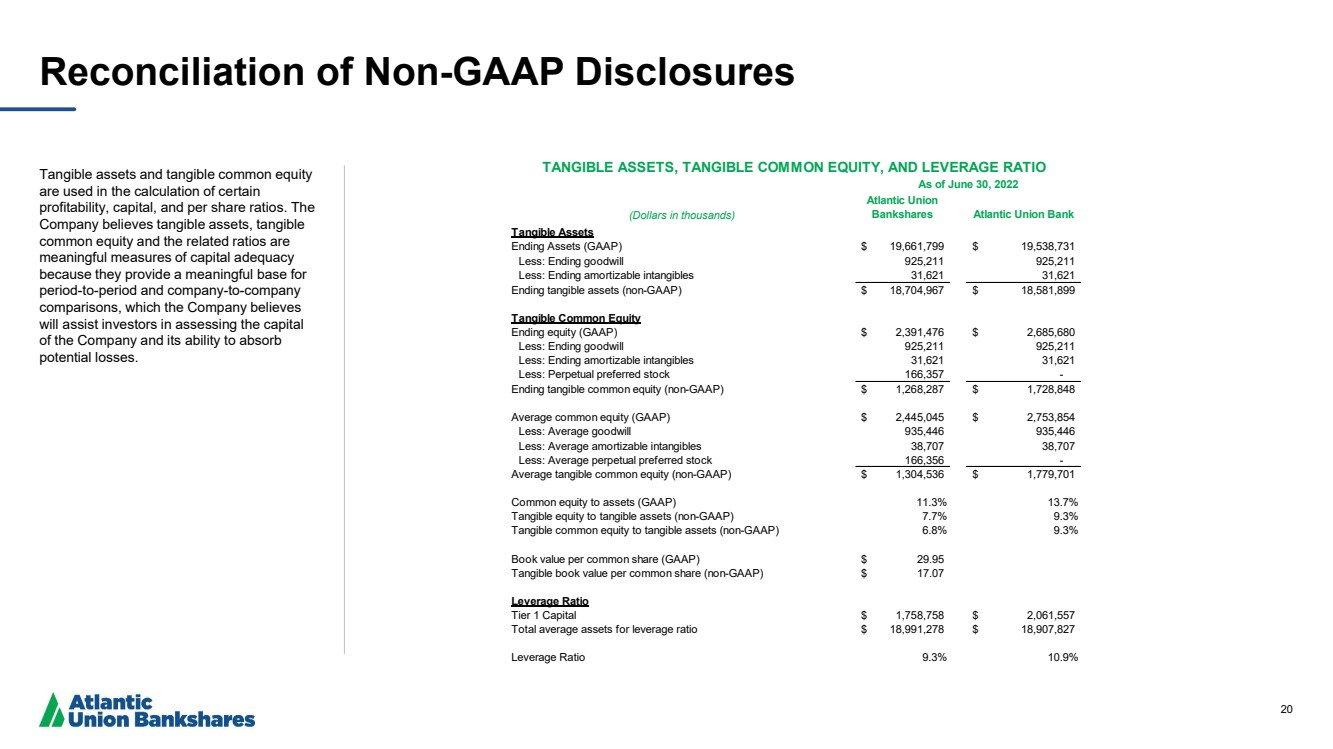
| 20 Reconciliation of Non - GAAP Disclosures Tangible assets and tangible common equity are used in the calculation of certain profitability, capital, and per share ratios. The Company believes tangible assets, tangible common equity and the related ratios are meaningful measures of capital adequacy because they provide a meaningful base for period - to - period and company - to - company comparisons, which the Company believes will assist investors in assessing the capital of the Company and its ability to absorb potential losses. (Dollars in thousands) Atlantic Union Bankshares Atlantic Union Bank Tangible Assets Ending Assets (GAAP) 19,661,799 $ 19,538,731 $ Less: Ending goodwill 925,211 925,211 Less: Ending amortizable intangibles 31,621 31,621 Ending tangible assets (non-GAAP) 18,704,967 $ 18,581,899 $ Tangible Common Equity Ending equity (GAAP) 2,391,476 $ 2,685,680 $ Less: Ending goodwill 925,211 925,211 Less: Ending amortizable intangibles 31,621 31,621 Less: Perpetual preferred stock 166,357 - Ending tangible common equity (non-GAAP) 1,268,287 $ 1,728,848 $ Average common equity (GAAP) 2,445,045 $ 2,753,854 $ Less: Average goodwill 935,446 935,446 Less: Average amortizable intangibles 38,707 38,707 Less: Average perpetual preferred stock 166,356 - Average tangible common equity (non-GAAP) 1,304,536 $ 1,779,701 $ Less: Perpetual preferred stock Common equity to assets (GAAP) 11.3% 13.7% Tangible equity to tangible assets (non-GAAP) 7.7% 9.3% Tangible common equity to tangible assets (non-GAAP) 6.8% 9.3% Book value per common share (GAAP) 29.95 $ Tangible book value per common share (non-GAAP) 17.07 $ Leverage Ratio Tier 1 Capital 1,758,758 $ 2,061,557 $ Total average assets for leverage ratio 18,991,278 $ 18,907,827 $ Leverage Ratio 9.3% 10.9% TANGIBLE ASSETS, TANGIBLE COMMON EQUITY, AND LEVERAGE RATIO As of June 30, 2022 |
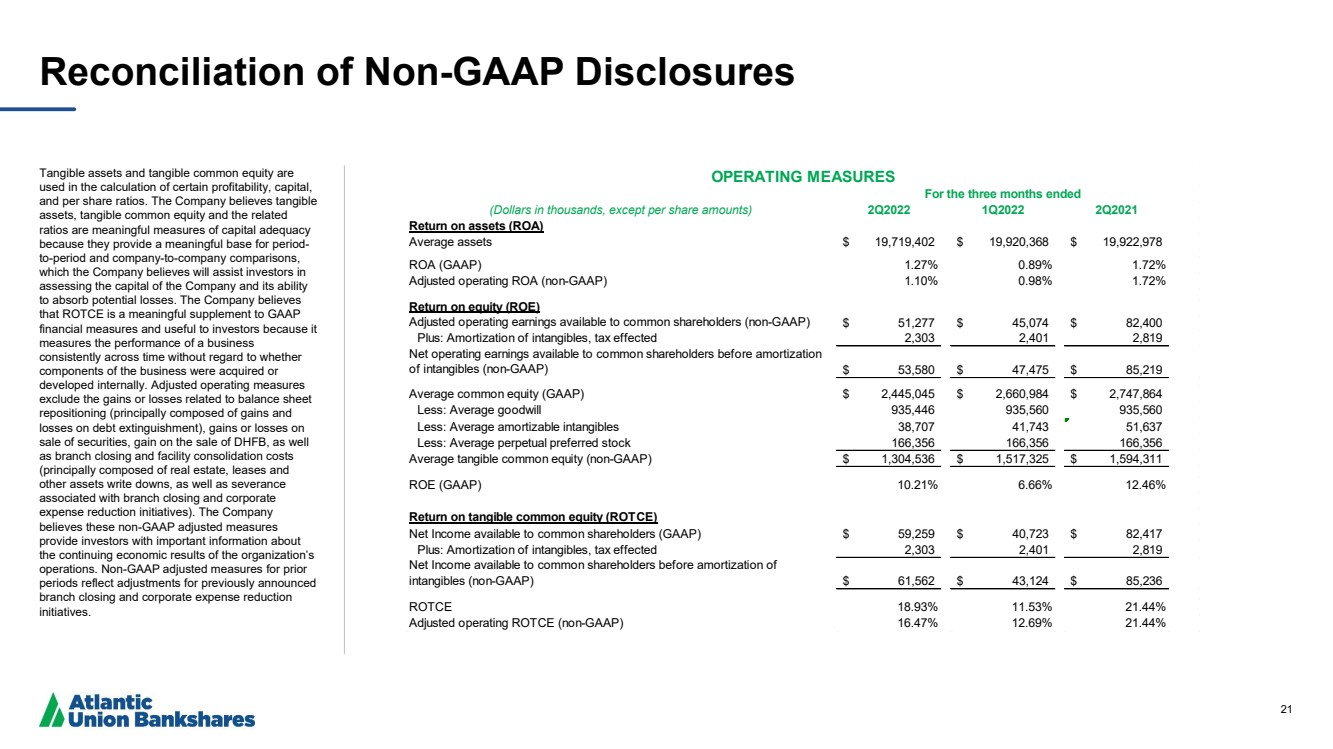
| 21 Reconciliation of Non - GAAP Disclosures Tangible assets and tangible common equity are used in the calculation of certain profitability, capital, and per share ratios. The Company believes tangible assets, tangible common equity and the related ratios are meaningful measures of capital adequacy because they provide a meaningful base for period - to - period and company - to - company comparisons, which the Company believes will assist investors in assessing the capital of the Company and its ability to absorb potential losses. The Company believes that ROTCE is a meaningful supplement to GAAP financial measures and useful to investors because it measures the performance of a business consistently across time without regard to whether components of the business were acquired or developed internally. Adjusted operating measures exclude the gains or losses related to balance sheet repositioning (principally composed of gains and losses on debt extinguishment), gains or losses on sale of securities, gain on the sale of DHFB, as well as branch closing and facility consolidation costs (principally composed of real estate, leases and other assets write downs, as well as severance associated with branch closing and corporate expense reduction initiatives). The Company believes these non - GAAP adjusted measures provide investors with important information about the continuing economic results of the organization’s operations. Non - GAAP adjusted measures for prior periods reflect adjustments for previously announced branch closing and corporate expense reduction initiatives. (Dollars in thousands, except per share amounts) 2Q2022 1Q2022 2Q2021 Return on assets (ROA) Average assets 19,719,402 $ 19,920,368 $ 19,922,978 $ ROA (GAAP) 1.27% 0.89% 1.72% Adjusted operating ROA (non-GAAP) 1.10% 0.98% 1.72% Return on equity (ROE) Adjusted operating earnings available to common shareholders (non-GAAP) 51,277 $ 45,074 $ 82,400 $ Plus: Amortization of intangibles, tax effected 2,303 2,401 2,819 Net operating earnings available to common shareholders before amortization of intangibles (non-GAAP) 53,580 $ 47,475 $ 85,219 $ Average common equity (GAAP) 2,445,045 $ 2,660,984 $ 2,747,864 $ Less: Average goodwill 935,446 935,560 935,560 Less: Average amortizable intangibles 38,707 41,743 51,637 Less: Average perpetual preferred stock 166,356 166,356 166,356 Average tangible common equity (non-GAAP) 1,304,536 $ 1,517,325 $ 1,594,311 $ ROE (GAAP) 10.21% 6.66% 12.46% Return on tangible common equity (ROTCE) Net Income available to common shareholders (GAAP) 59,259 $ 40,723 $ 82,417 $ Plus: Amortization of intangibles, tax effected 2,303 2,401 2,819 Net Income available to common shareholders before amortization of intangibles (non-GAAP) 61,562 $ 43,124 $ 85,236 $ ROTCE 18.93% 11.53% 21.44% Adjusted operating ROTCE (non-GAAP) 16.47% 12.69% 21.44% OPERATING MEASURES For the three months ended |
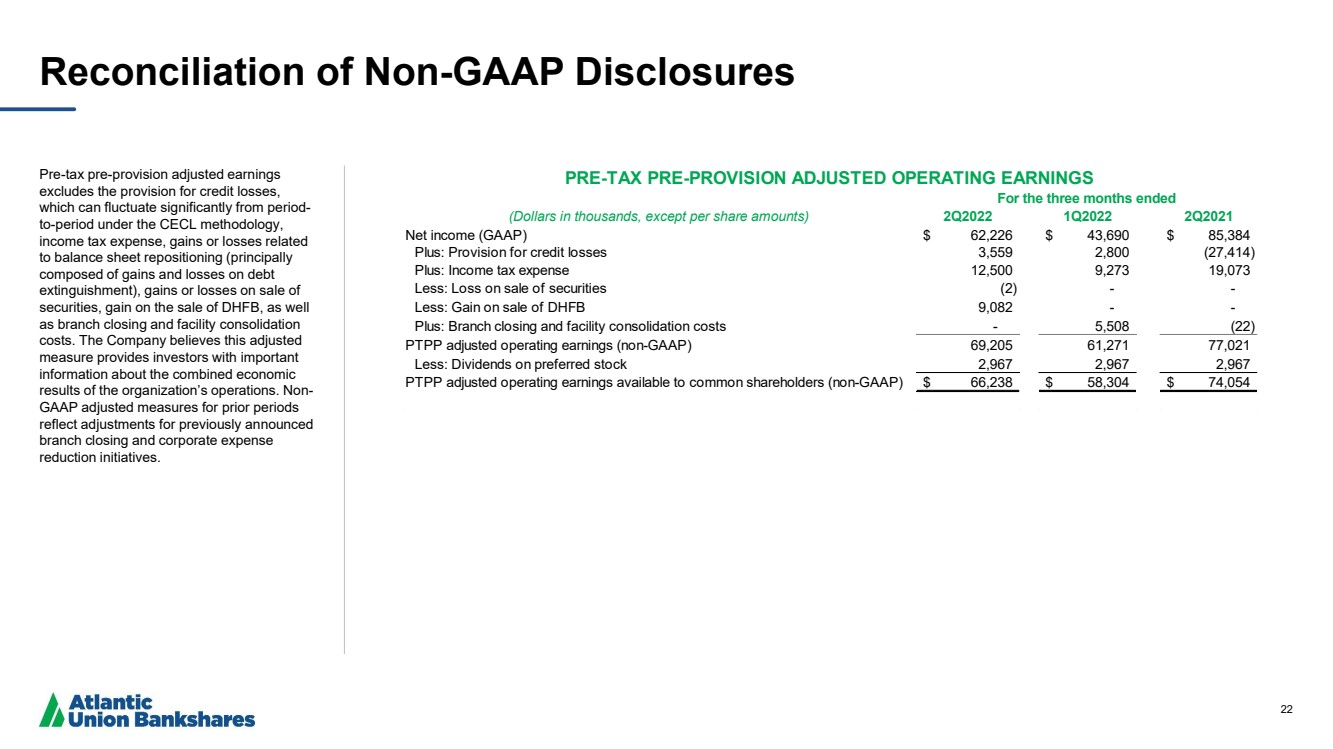
| 22 Reconciliation of Non - GAAP Disclosures Pre - tax pre - provision adjusted earnings excludes the provision for credit losses, which can fluctuate significantly from period - to - period under the CECL methodology, income tax expense, gains or losses related to balance sheet repositioning (principally composed of gains and losses on debt extinguishment), gains or losses on sale of securities, gain on the sale of DHFB, as well as branch closing and facility consolidation costs. The Company believes this adjusted measure provides investors with important information about the combined economic results of the organization’s operations. Non - GAAP adjusted measures for prior periods reflect adjustments for previously announced branch closing and corporate expense reduction initiatives. (Dollars in thousands, except per share amounts) 2Q2022 1Q2022 2Q2021 Net income (GAAP) 62,226 $ 43,690 $ 85,384 $ Plus: Provision for credit losses 3,559 2,800 (27,414) Plus: Income tax expense 12,500 9,273 19,073 Less: Loss on sale of securities (2) - - Less: Gain on sale of DHFB 9,082 - - Plus: Branch closing and facility consolidation costs - 5,508 (22) PTPP adjusted operating earnings (non-GAAP) 69,205 61,271 77,021 Less: Dividends on preferred stock 2,967 2,967 2,967 PTPP adjusted operating earnings available to common shareholders (non-GAAP) 66,238 $ 58,304 $ 74,054 $ PRE-TAX PRE-PROVISION ADJUSTED OPERATING EARNINGS For the three months ended |
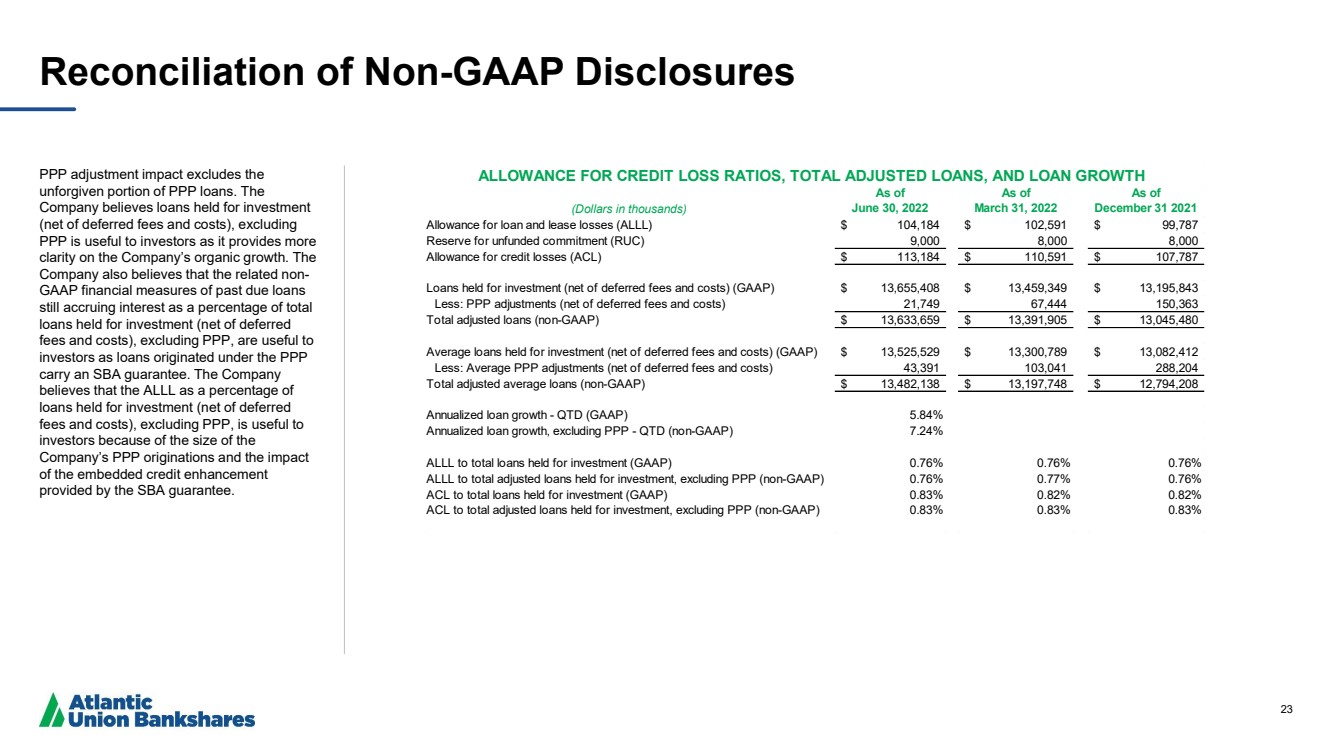
| 23 Reconciliation of Non - GAAP Disclosures PPP adjustment impact excludes the unforgiven portion of PPP loans. The Company believes loans held for investment (net of deferred fees and costs), excluding PPP is useful to investors as it provides more clarity on the Company’s organic growth. The Company also believes that the related non - GAAP financial measures of past due loans still accruing interest as a percentage of total loans held for investment (net of deferred fees and costs), excluding PPP, are useful to investors as loans originated under the PPP carry an SBA guarantee. The Company believes that the ALLL as a percentage of loans held for investment (net of deferred fees and costs), excluding PPP, is useful to investors because of the size of the Company’s PPP originations and the impact of the embedded credit enhancement provided by the SBA guarantee. (Dollars in thousands) As of June 30, 2022 As of March 31, 2022 As of December 31 2021 Allowance for loan and lease losses (ALLL) 104,184 $ 102,591 $ 99,787 $ Reserve for unfunded commitment (RUC) 9,000 8,000 8,000 Allowance for credit losses (ACL) 113,184 $ 110,591 $ 107,787 $ Loans held for investment (net of deferred fees and costs) (GAAP) 13,655,408 $ 13,459,349 $ 13,195,843 $ Less: PPP adjustments (net of deferred fees and costs) 21,749 67,444 150,363 Total adjusted loans (non-GAAP) 13,633,659 $ 13,391,905 $ 13,045,480 $ Average loans held for investment (net of deferred fees and costs) (GAAP) 13,525,529 $ 13,300,789 $ 13,082,412 $ Less: Average PPP adjustments (net of deferred fees and costs) 43,391 103,041 288,204 Total adjusted average loans (non-GAAP) 13,482,138 $ 13,197,748 $ 12,794,208 $ Annualized loan growth - QTD (GAAP) 5.84% Annualized loan growth, excluding PPP - QTD (non-GAAP) 7.24% ALLL to total loans held for investment (GAAP) 0.76% 0.76% 0.76% ALLL to total adjusted loans held for investment, excluding PPP (non-GAAP) 0.76% 0.77% 0.76% ACL to total loans held for investment (GAAP) 0.83% 0.82% 0.82% ACL to total adjusted loans held for investment, excluding PPP (non-GAAP) 0.83% 0.83% 0.83% ALLOWANCE FOR CREDIT LOSS RATIOS, TOTAL ADJUSTED LOANS, AND LOAN GROWTH |