
Exhibit 99.1            Bill Cimino           VICE PRESIDENT DIRECTOR OF INVESTOR RELATIONS 
 
 
Forward Looking Statements     Certain   statements   in  this  presentation   may   constitute   forward-looking       Please   refer to  the  “Risk   Factors”  and   “Management’s     Discussion   and   statements within the meaning of the Private Securities Litigation Reform       Act      Analysis  of Financial Condition   and   Results  of Operation” sections    of the   of 1995. Forward-looking    statements include, without limitation, projections,         Company’s   Annual Report on     Form  10-K   for the year ended    December 31,   predictions, expectations or beliefs about future events or results that are not         2017 and related disclosures in other filings, which have been filed with the   statements of historical fact. Such forward-looking     statements are based on          Securities and  Exchange Commission (the       “SEC”), and   are available  on the   various assumptions as of the time they are made, and are inherently subject             SEC’s   website    at  www.sec.gov.    The    actual  results   or  developments   to known and unknown risks, uncertainties, and other factors that may cause              anticipated may not be realized or, even if substantially realized, they may not   actual results, performance    or achievements to    be  materially different from       have  the  expected   consequences     to  or  effects on   the  Company    or  its   those  expressed   or implied   by  such  forward-looking   statements. Forward-         businesses or operations. You     are cautioned   not to rely too  heavily on  the   looking  statements   are often  accompanied    by  words  that convey   projected       forward-looking  statements   contained   in this presentation. Forward-looking   future  events  or outcomes    such  as  “expect,” “believe,” “estimate,” “plan,”        statements speak only as of the date they are made and the Company does   “project,” “anticipate,” “intend,” “will,” “may,” “view,” “opportunity,” “potential,”    not undertake any obligation to update, revise or clarify these forward-looking   or words   of similar  meaning    or other  statements   concerning   opinions   or      statements,   whether   as  a  result  of  new   information,   future  events  or   judgment of the Company and its management about future events.                          otherwise.   Although Union Bankshares Corporation (“Union” or the “Company”) believes   that its expectations   with respect to   forward-looking  statements   are  based   upon reasonable assumptions within the bounds of its existing knowledge of   its business and   operations, there  can  be  no  assurance  that actual results,   performance, or achievements of the Company will not differ materially from   any  projected   future results, performance, or achievements        expressed   or   implied   by   such    forward-looking    statements.    Actual   future   results,   performance or achievements may differ materially from        historical results or   those anticipated depending on a variety of factors.   2 
 
 
Additional Information     Unaudited Pro Forma Financial Information                                              No Offer or Solicitation    The unaudited pro forma financial information included herein is presented for         This presentation does not constitute an offer to sell or a solicitation of an offer    informational purposes only and does not necessarily reflect the financial             to buy any securities or a solicitation of any vote or approval with respect to    results of the combined company had the companies actually been combined               the proposed acquisition by Union of Access National Bank. No offer of    during periods presented. The adjustments included in this unaudited pro forma         securities shall be made except by means of a prospectus meeting the    financial information are preliminary and may be significantly revised and may         requirements of the Securities Act of 1933, as amended, and no offer to sell or    not agree to actual amounts finally recorded by Union. This financial                  solicitation of an offer to buy shall be made in any jurisdiction in which such    information does not reflect the benefits of the Access National Corporation           offer, solicitation or sale would be unlawful.   (“Access” or “ANCX”) merger’s expected cost savings and expense efficiencies,                                                                                           About Union Bankshares Corporation    opportunities to earn additional revenue, potential impacts of current market    conditions on revenues or asset dispositions, among other factors, and                 Headquartered in Richmond, Virginia, Union Bankshares Corporation (Nasdaq:    includes various preliminary estimates and may not necessarily be indicative of        UBSH) is the holding company for Union Bank & Trust. Union Bank & Trust has    the financial position or results of operations that would have occurred if the        140 branches, 7 of which are operated as Xenith Bank, a division of Union Bank    merger had been completed on the date or at the beginning of the period                & Trust of Richmond, Virginia, and approximately 190 ATMs located throughout    indicated or which may be attained in the future.                                      Virginia, and in portions of Maryland and North Carolina. Non-bank affiliates of                                                                                           the holding company include: Old Dominion Capital Management, Inc. and    Non-GAAP Financial Measures                                                                                           Dixon, Hubard, Feinour, & Brown, Inc., which both provide investment advisory    This presentation contains certain financial information determined by methods         services, and Union Insurance Group, LLC, which offers various lines of    other than in accordance with generally accepted accounting policies in the            insurance products.   United States (“GAAP”). These non-GAAP disclosures have limitations as an    analytical tool and should not be considered in isolation or as a substitute for    analysis of our results as reported under GAAP, nor are they necessarily    comparable to non-GAAP performance measures that may be presented by    other companies. Management uses these non-GAAP measures in its analysis    of performance because it believes the measures are material and will be used    as measures of performance by investors.  Please see “Reconciliation of Non-   GAAP Disclosures” at the end of this presentation for a reconciliation to the    nearest GAAP financial measure.   3 
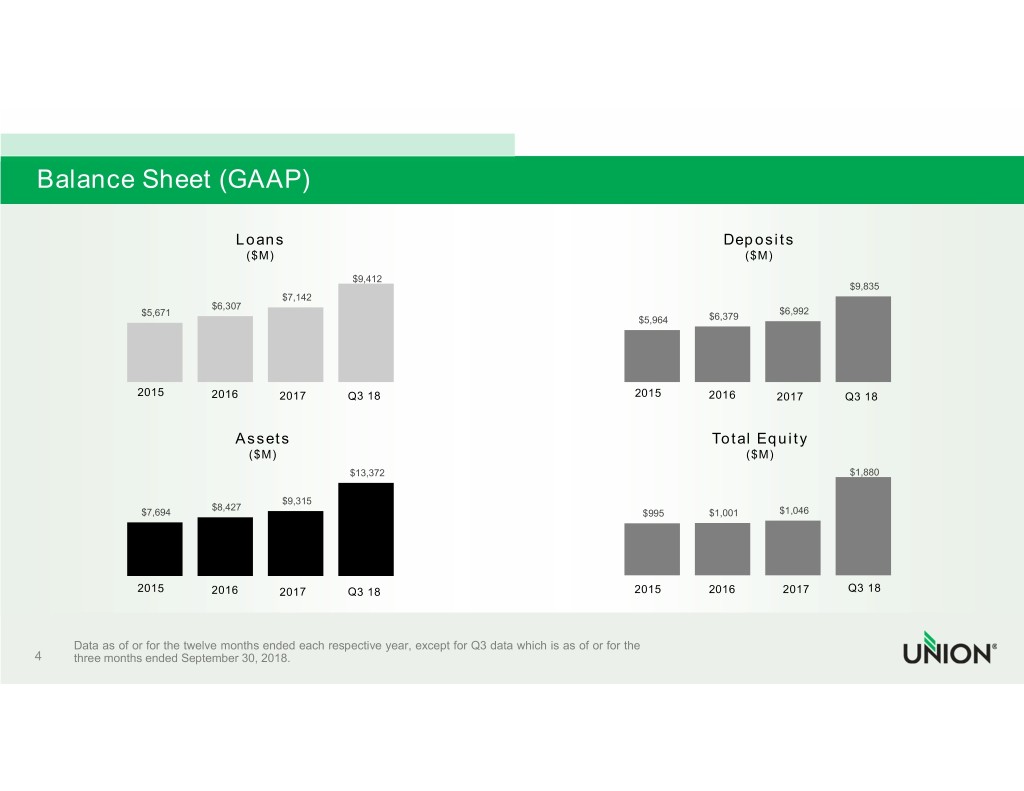
 
 
Balance Sheet (GAAP)                                  Loans                                                                          Deposits                                   ($M)                                                                            ($M)                                                     $9,412                                                                                                                                     $9,835                                          $7,142                               $6,307                   $5,671                                                                                                 $6,992                                                                                                   $5,964      $6,379                     2015        2016      2017       Q3 18                                          2015        2016       2017       Q3 18                                  Assets                                                                       Total Equity                                    ($M)                                                                            ($M)                                                    $13,372                                                                         $1,880                                           $9,315                               $8,427                   $7,694                                                                           $995       $1,001     $1,046                     2015        2016      2017       Q3 18                                          2015        2016        2017      Q3 18         Data as of or for the twelve months ended each respective year, except for Q3 data which is as of or for the 4     three months ended September 30, 2018. 
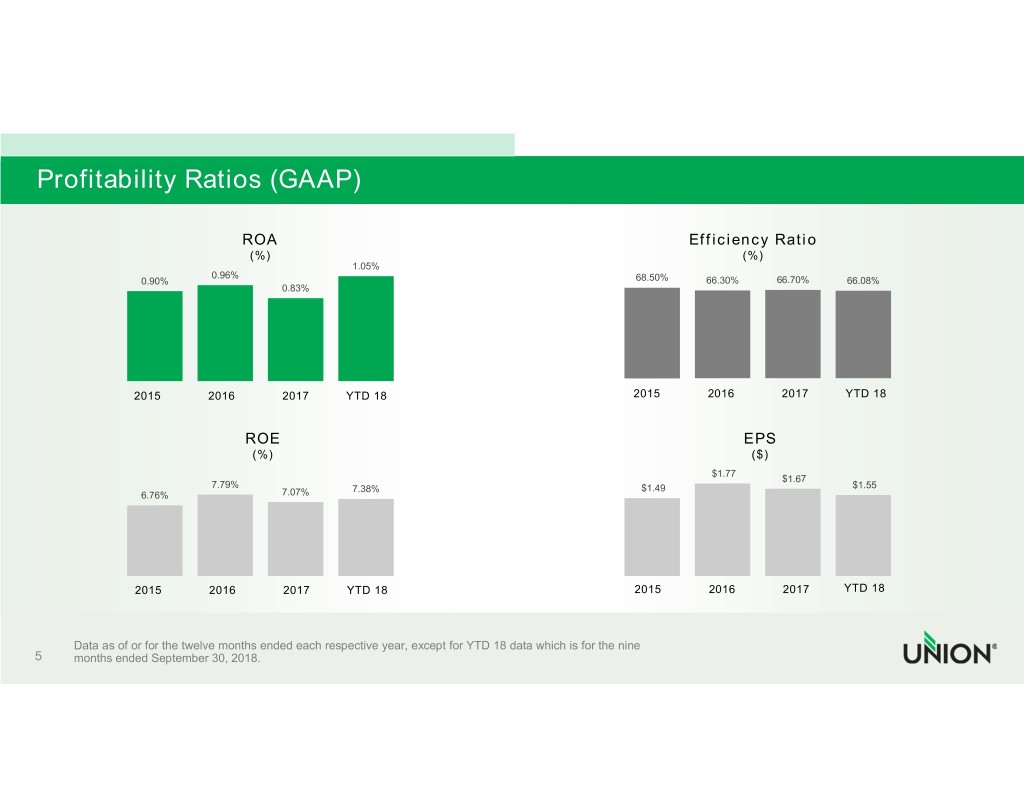
 
 
Profitability Ratios (GAAP)                                   ROA                                                                     Efficiency Ratio                                    (%)                                                                            (%)                                                    1.05%                              0.96%                  0.90%                                                                           68.50%     66.30%      66.70%     66.08%                                         0.83%                   2015        2016        2017      YTD 18                                         2015       2016        2017       YTD 18                                    ROE                                                                             EPS                                    (%)                                                                              ($)                                                                                                              $1.77                                                                                                                          $1.67                               7.79%                 7.38%                                          $1.49                             $1.55                   6.76%                  7.07%                   2015        2016        2017      YTD 18                                         2015        2016        2017     YTD 18         Data as of or for the twelve months ended each respective year, except for YTD 18 data which is for the nine 5     months ended September 30, 2018. 
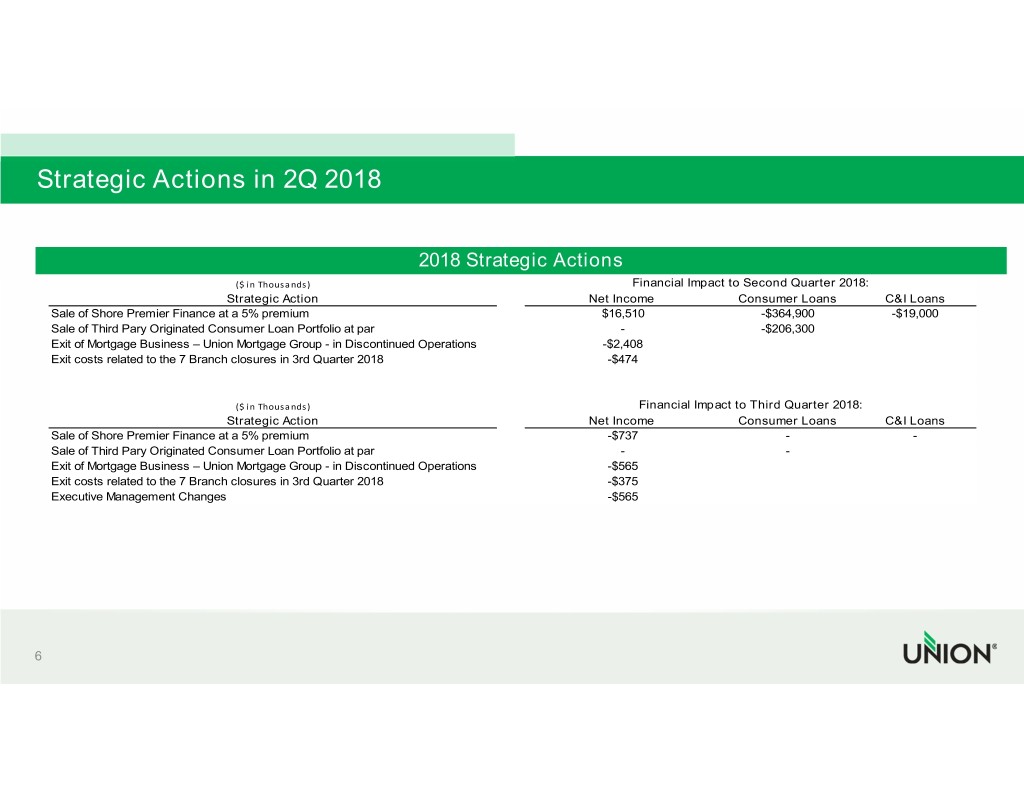
 
 
Strategic Actions in 2Q 2018                                                                 2018 Strategic Actions                                                                                             Financial Impact to Second Quarter 2018:                                 ($ in Thousands)                                Strategic ActionFor the Twelve Months Ended 12/31     Net Income         Three Consumer Months  LoansEnded C&I LoansNine Months Ended (DollarsSale in of thousands) Shore Premier Finance at a 5% premium2014 2015 2016 2017 $16,510  3/31/2018     6/30/2018 -$364,900 9/30/2018 -$19,000 9/30/2018      Sale of Third Pary Originated Consumer Loan Portfolio at par                         -                    -$206,300 Sale Exitof Shore of Mortgage Premier Business Finance – at Union a 5% Mortgage pre  Group$52,164 - in Discontinued $67,079 Operations $77,476 $72,923 -$2,408 $16,639 $47,327 $38,197 $102,163 Sale Exitof Third costs Pary related Originated to the 7  Branch closures in 3rd $13,724 Quarter 2018 -  -  $4,405 -$474 $22,236 $6,537 $1,129        $29,902 Plus: Nonrecurring tax expenses                -            -             -        $6,250                -            -             -                      -  Net operating earnings (non-GAAP)        $65,888       $67,079       $77,476      $83,578          $38,875       $53,864      $39,326               $132,065                                 ($ in Thousands)                                             Financial Impact to Third Quarter 2018: Weighted avg. common shares out., Strategicdiluted   46,130,895 Action   45,138,891    43,890,271    43,779,744 Net Income   65,636,262 Consumer   65,965,577 Loans   66,013,152 C&I Loans                65,873,202      Sale of Shore Premier Finance at a 5% premium                                      -$737                      -                  - EPS Sale(GAAP) of Third Pary Originated Consumer Loan Portfolio $1.13 at par $1.49 $1.77 $1.67 -     $0.25        $0.72 -       $0.58                  $1.55 OperatingExit of EPS Mortgage (non-GAAP) Business – Union Mortgage Group $1.43 - in Discontinued $1.49 Operations $1.77 $1.91 -$565 $0.59 $0.82 $0.60  $2.01      Exit costs related to the 7 Branch closures in 3rd Quarter 2018                    -$375      Executive Management Changes                                                       -$565   6 
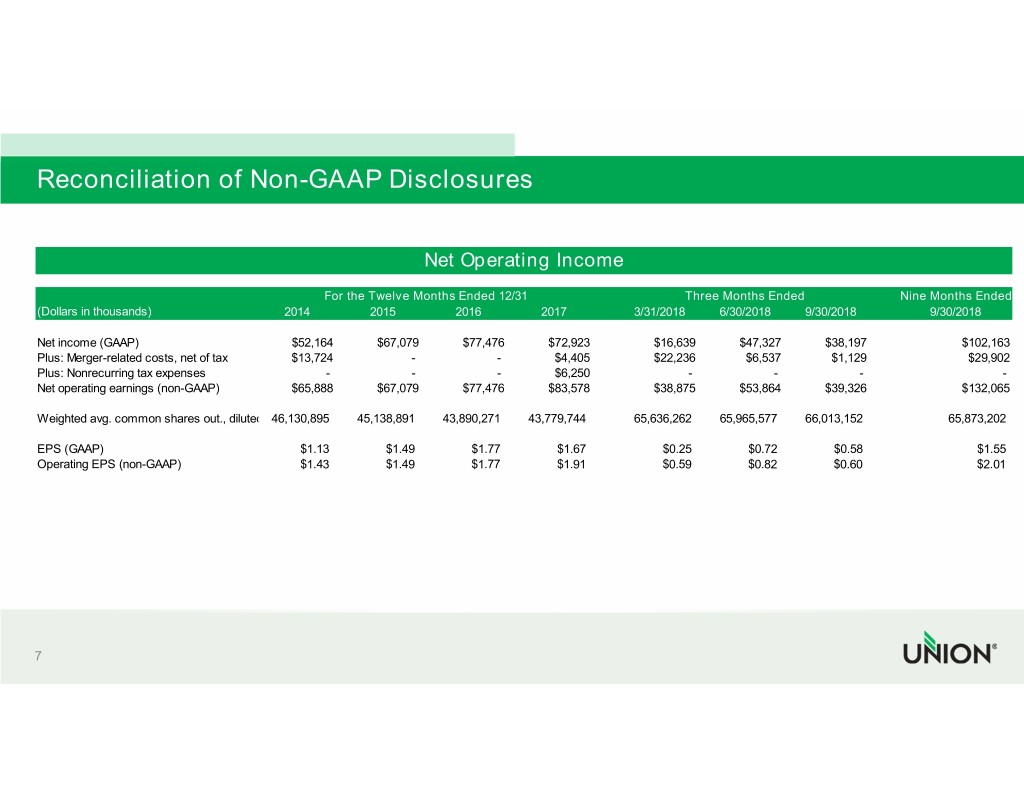
 
 
Reconciliation of Non-GAAP Disclosures                                                                   Net Operating Income                                                 For the Twelve Months Ended 12/31                         Three Months Ended                Nine Months Ended (Dollars in thousands)                  2014          2015          2016          2017           3/31/2018    6/30/2018     9/30/2018           9/30/2018  Net income (GAAP)                        $52,164       $67,079       $77,476       $72,923          $16,639       $47,327      $38,197               $102,163 Plus: Merger-related costs, net of tax   $13,724             -             -        $4,405          $22,236        $6,537       $1,129                $29,902 Plus: Nonrecurring tax expenses                -             -             -        $6,250               -             -             -                      -  Net operating earnings (non-GAAP)        $65,888       $67,079       $77,476       $83,578          $38,875       $53,864      $39,326               $132,065  Weighted avg. common shares out., diluted   46,130,895    45,138,891    43,890,271    43,779,744    65,636,262    65,965,577    66,013,152                 65,873,202  EPS (GAAP)                                 $1.13         $1.49        $1.77         $1.67            $0.25         $0.72         $0.58                  $1.55 Operating EPS (non-GAAP)                   $1.43         $1.49        $1.77         $1.91            $0.59         $0.82         $0.60                  $2.01   7 
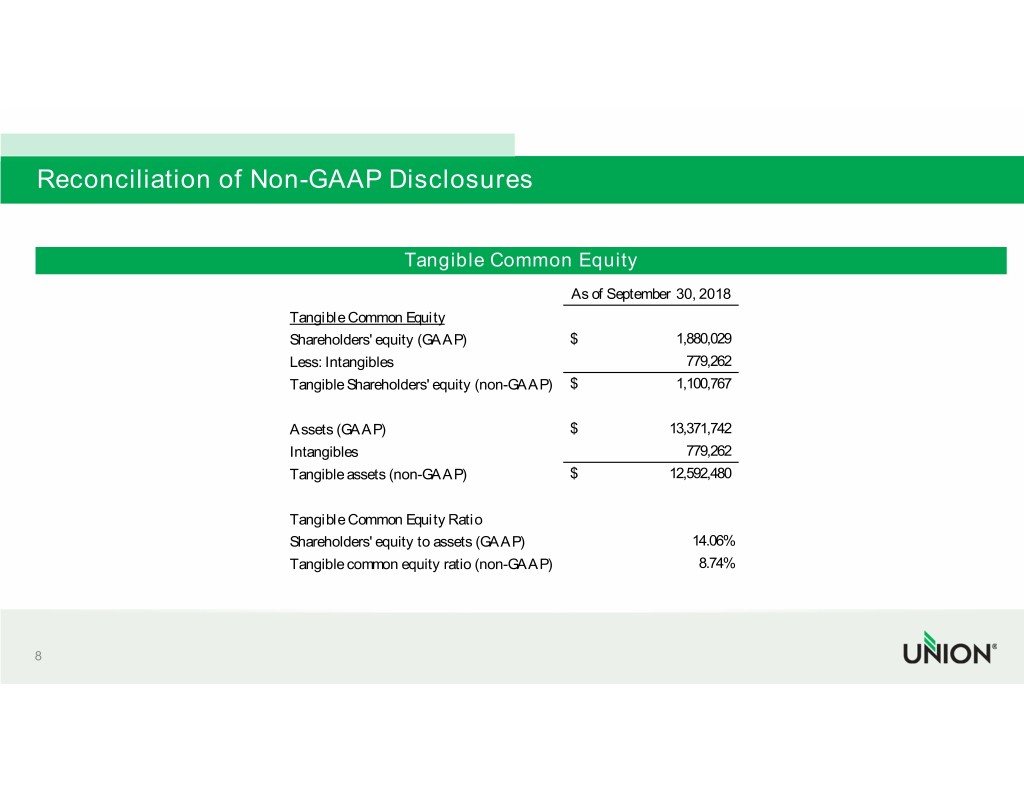
 
 
Reconciliation of Non-GAAP Disclosures                                                                Tangible Common Equity                                                For the Twelve Months Ended 12/31As of September 30,      Three 2018 Months Ended            Nine Months Ended (Dollars in thousands)                  2014Tangible Common 2015 Equity 2016     2017           3/31/2018     6/30/2018    9/30/2018           9/30/2018 Sale of Shore Premier Finance at a 5% pre Shareholders'$52,164 equity $67,079 (GAAP) $77,476 $72,923 $                        $16,639     1,880,029 $47,327 $38,197 $102,163 Sale of Third Pary Originated Less:      $13,724 Intangibles -            -        $4,405                           $22,236        779,262 $6,537 $1,129 $29,902 Plus: Nonrecurring tax expenses                -            -             -        $6,250                -            -             -                      -  Net operating earnings (non-GAAP)Tangible $65,888 Shareholders' $67,079 equity $77,476 (non-GAAP) $83,578 $                        $38,875     1,100,767 $53,864 $39,326 $132,065  Weighted avg. common shares out., diluted   46,130,895    45,138,891    43,890,271    43,779,744    65,636,262    65,965,577    66,013,152                65,873,202                                          Assets (GAAP)                                $                           13,371,742  EPS (GAAP)Intangibles                      $1.13        $1.49         $1.77         $1.67                              $0.25      779,262 $0.72 $0.58  $1.55 Operating EPS (non-GAAP)                   $1.43        $1.49         $1.77         $1.91            $0.59        $0.82         $0.60                  $2.01                                          Tangible assets (non-GAAP)                   $                           12,592,480                                            Tangible Common Equity Ratio                                          Shareholders' equity to assets (GAAP)                           14.06%                                          Tangible common equity ratio (non-GAAP)                          8.74%   8 
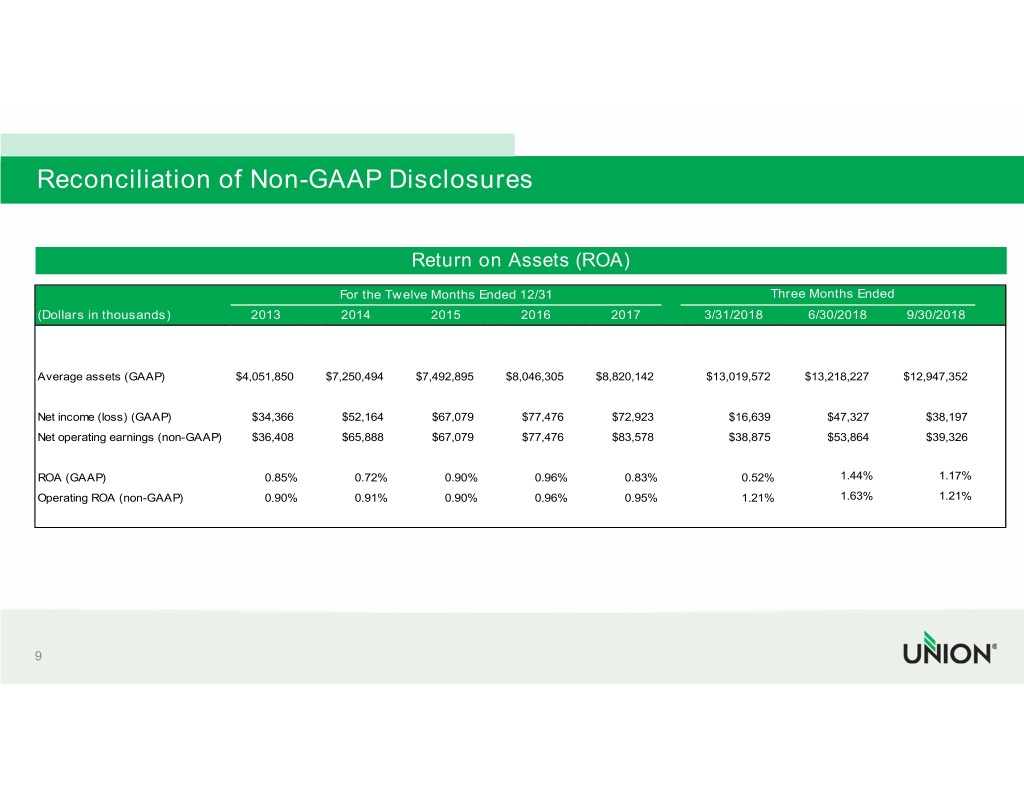
 
 
Reconciliation of Non-GAAP Disclosures                                                                 Return on Assets (ROA)                                                ForFor the the Twelve TwelveTwelve Months Months Months Ended Ended Ended 12/31 12/31 12/31 Three Months  Ended Three  MonthsMonths Ended Ended Nine Months Ended (Dollars(Dollars(Dollars in  inthousands)  inthousands) thousands) 2013 20132014 2014 2015 2015 2015 2016 2016 2016 2017 2017 2017 3/31/2018 3/31/2018 3/31/2018 6/30/2018 6/30/2018 9/30/20186/30/2018 9/30/2018 9/30/2018 9/30/2018     Sale of Shore Premier Finance at a 5% pre $52,164      $67,079       $77,476      $72,923          $16,639       $47,327      $38,197                $102,163 Sale of Third Pary Originated            $13,724            -             -        $4,405          $22,236        $6,537       $1,129                 $29,902 Plus: Nonrecurring tax expenses                -            -             -        $6,250                -            -             -                      -  Average  assetsassets (GAAP) (GAAP) $4,051,850 $4,051,850 $7,250,494 $7,250,494 $7,492,895 $7,492,895 $8,046,305 $8,046,305 $8,820,142 $8,820,142 $13,019,572 $13,019,572 $13,218,227 $13,218,227 $12,947,352 $12,947,352 Net operating earnings (non-GAAP)        $65,888       $67,079       $77,476      $83,578          $38,875       $53,864      $39,326                $132,065  NetWeighted income avg.  (loss)(loss) common (GAAP) (GAAP) shares out., dilute $34,366 $34,366d   46,130,895 $52,164 $52,164   45,138,891 $67,079 $67,079   43,890,271 $77,476 $77,476   43,779,744 $72,923 $72,923   65,636,262 $16,639   65,965,577 $16,639 $47,327   66,013,152 $47,327 $38,197     $38,197          65,873,202 Net operating earnings (non-GAAP) $36,408      $65,888      $67,079       $77,476       $83,578           $38,875        $53,864        $39,326 NetEPS operating (GAAP) earnings (non-GAAP) $36,408 $1.13 $65,888 $1.49 $67,079 $1.77 $77,476 $1.67 $83,578 $0.25 $38,875 $0.72 $53,864 $0.58 $39,326  $1.55 Operating EPS (non-GAAP)                   $1.43        $1.49         $1.77         $1.91            $0.59        $0.82         $0.60                  $2.01                                                                                                                            1.44%         1.17% ROA (GAAP)                         0.85% 0.85%   0.72% 0.72%  0.90% 0.90%   0.96% 0.96%   0.83% 0.83%       0.52% 0.52%         1.44%          1.17%                                                                                                                            1.63%         1.21% Operating  ROAROA  (non-GAAP)(non-GAAP) 0.90% 0.90% 0.91% 0.91% 0.90% 0.90% 0.96% 0.96%   0.95% 0.95%       1.21% 1.21%         1.63%          1.21%   9 
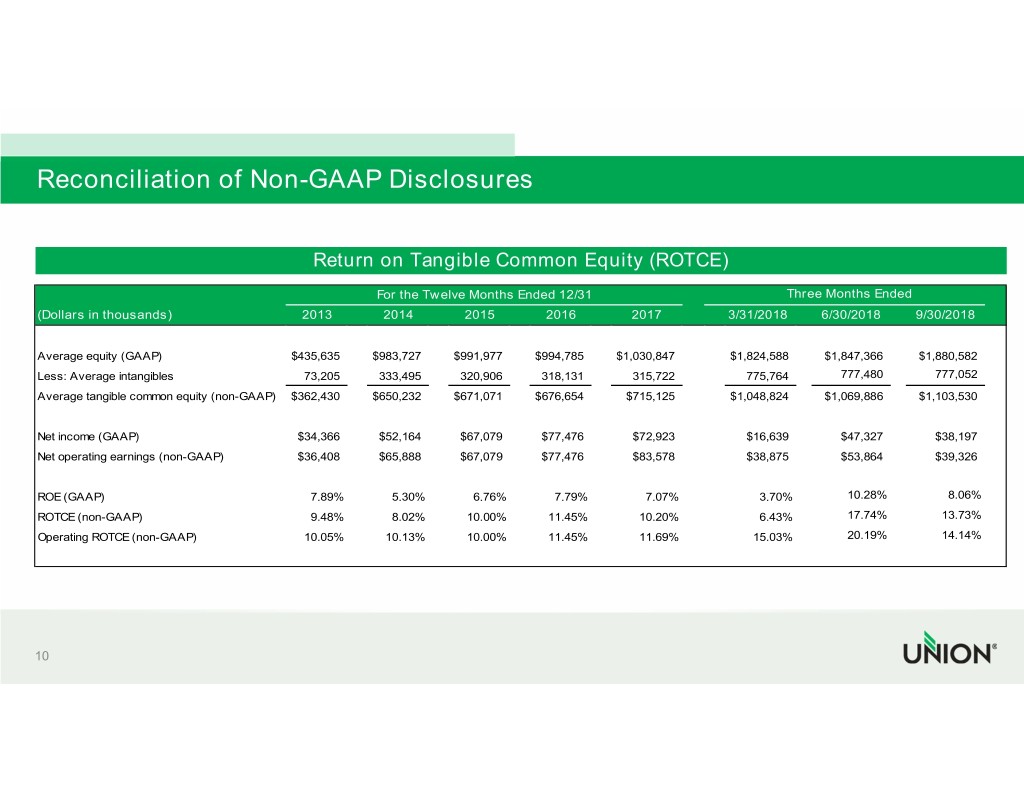
 
 
Reconciliation of Non-GAAP Disclosures                                                 Return on Tangible Common Equity (ROTCE)                                                ForFor the the TwelveFor Twelve the Months Twelve Months Ended Months Ended 12/31 Ended 12/31 12/31 Three Months  Ended Three   Three Months Months Ended EndedNine Months Ended (Dollars(Dollars(Dollars in  inthousands) thousands) in thousands) 20132014 2013 2014 2015 2014 2015 2016 2015 2016 2016 2017 2017 2017 3/31/2018  3/31/2018 3/31/2018 6/30/2018 6/30/2018 9/30/20186/30/2018 9/30/2018 9/30/2018 9/30/2018     Sale of Shore Premier Finance at a 5% pre $52,164      $67,079       $77,476      $72,923          $16,639       $47,327      $38,197                $102,163 SaleAverage of Third equity Pary (GAAP) Originated  $435,635 $13,724 $983,727 -  $991,977 - $994,785 $4,405 $1,030,847 $22,236 $1,824,588 $6,537 $1,847,366 $1,129 $1,880,582 $29,902 Plus: Nonrecurring tax expenses                -            -             -        $6,250                -            -             -                      -  AverageLess: Average assets intangibles (GAAP) $4,051,850 73,205 $7,250,494 333,495 $7,492,895 320,906 $8,046,305 318,131 $8,820,142 315,722 775,764$13,019,572        777,480 $13,218,227         777,052 $12,947,352  Net operating earnings (non-GAAP)        $65,888       $67,079       $77,476      $83,578          $38,875       $53,864      $39,326                $132,065 Average tangible common equity (non-GAAP) $362,430 $650,232    $671,071    $676,654     $715,125        $1,048,824    $1,069,886    $1,103,530  NetWeighted income avg. (loss) common (GAAP) shares out., dilute $34,366d   46,130,895 $52,164   45,138,891 $67,079   43,890,271 $77,476   43,779,744 $72,923   65,636,262    65,965,577 $16,639   66,013,152 $47,327     $38,197          65,873,202 Net income (GAAP)                      $34,366      $52,164     $67,079     $77,476      $72,923          $16,639        $47,327       $38,197 NetEPS operating (GAAP) earnings (non-GAAP) $36,408 $1.13 $65,888 $1.49 $67,079 $1.77 $77,476 $1.67 $83,578 $0.25 $38,875 $0.72 $53,864 $0.58 $39,326  $1.55 OperatingNet operating EPS earnings (non-GAAP) (non-GAAP) $36,408 $1.43 $65,888 $1.49 $67,079 $1.77 $77,476 $1.91 $83,578 $0.59 $38,875 $0.82 $53,864 $0.60 $39,326 $2.01 ROA (GAAP)                          0.85%          0.72%         0.90%         0.96%          0.83%             0.52%           1.44%          1.17% OperatingROE (GAAP) ROA (non-GAAP)  0.90% 7.89%    0.91% 5.30%   0.90% 6.76%  7.79% 0.96%  7.07% 0.95%      3.70% 1.21%   10.28%1.63%    8.06% 1.21% ROTCE (non-GAAP)                         9.48%       8.02%       10.00%      11.45%       10.20%            6.43%         17.74%        13.73% Operating ROTCE (non-GAAP)              10.05%      10.13%       10.00%      11.45%       11.69%           15.03%         20.19%        14.14%   10 
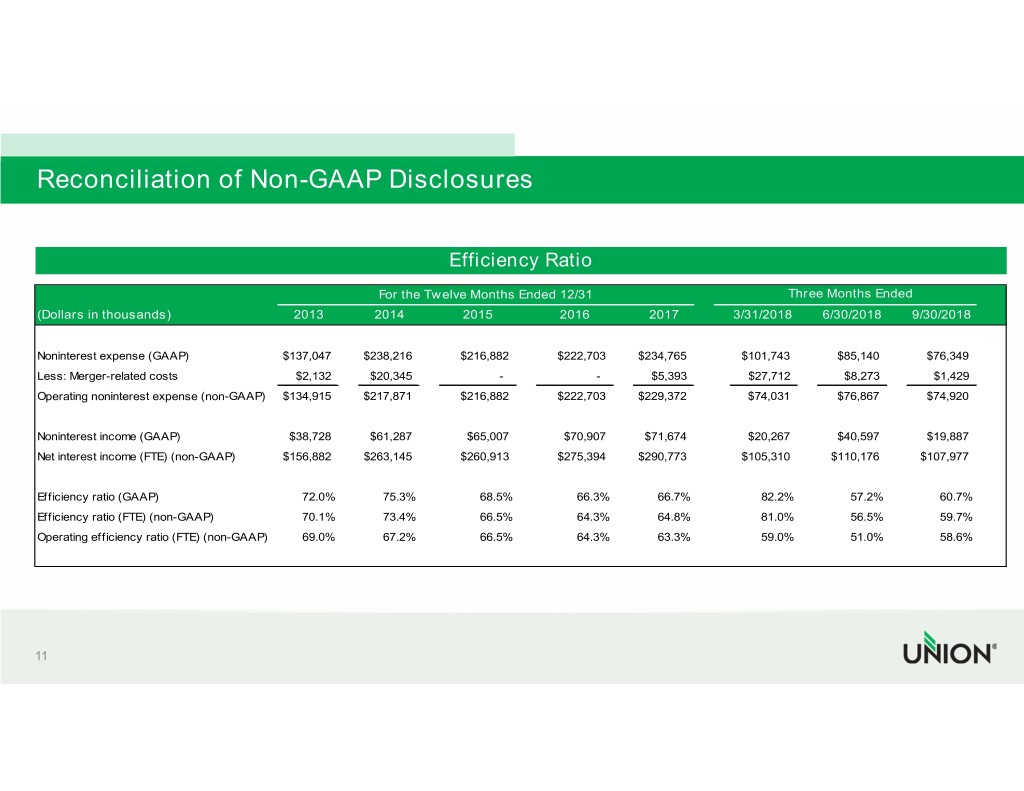
 
 
Reconciliation of Non-GAAP Disclosures                                                                       Efficiency Ratio                                                ForFor the the TwelveFor Twelve the Months Twelve Months Ended Months Ended 12/31 Ended 12/31 12/31 Three Months  Ended Three   Three Months Months Ended EndedNine Months Ended (Dollars(Dollars(Dollars in  inthousands)  thousands)in thousands) 20132014 2013 2014 2015 2014 2015 2016 2015 2016 2017 2016 2017 3/31/20182017 3/31/2018 3/31/2018 6/30/2018 6/30/2018 9/30/20186/30/2018 9/30/2018 9/30/2018 9/30/2018     Sale of Shore Premier Finance at a 5% pre $52,164      $67,079       $77,476      $72,923          $16,639       $47,327      $38,197                $102,163 SaleNoninterest of Third expense Pary Originated (GAAP)  $137,047 $13,724 $238,216 -  $216,882 -  $222,703 $4,405 $234,765 $22,236 $101,743 $6,537 $85,140 $1,129 $76,349 $29,902 Plus: Nonrecurring tax expenses                -            -             -        $6,250                -            -             -                      -  AverageLess: Merger-related assets (GAAP) costs $4,051,850 $2,132 $7,250,494 $20,345 $7,492,895                 -    $8,046,305                 -    $8,820,142 $5,393 $13,019,572 $27,712 $8,273 $13,218,227 $1,429 $12,947,352 Net operating earnings (non-GAAP)        $65,888       $67,079       $77,476      $83,578          $38,875       $53,864      $39,326                $132,065 Operating noninterest expense (non-GAAP) $134,915 $217,871      $216,882       $222,703    $229,372        $74,031       $76,867      $74,920  NetWeighted income avg. (loss) common (GAAP) shares out., dilute $34,366d   46,130,895 $52,164   45,138,891 $67,079   43,890,271 $77,476   43,779,744 $72,923   65,636,262    65,965,577 $16,639   66,013,152 $47,327     $38,197          65,873,202 Noninterest income (GAAP)             $38,728      $61,287       $65,007        $70,907     $71,674        $20,267       $40,597      $19,887 NetEPS operating (GAAP) earnings (non-GAAP) $36,408 $1.13 $65,888 $1.49 $67,079 $1.77 $77,476 $1.67 $83,578 $0.25 $38,875 $0.72 $53,864 $0.58 $39,326  $1.55 OperatingNet interest EPS income (non-GAAP) (FTE) (non-GAAP) $156,882 $1.43 $263,145 $1.49 $260,913 $1.77 $275,394 $1.91 $290,773 $0.59 $105,310 $0.82 $110,176 $0.60 $107,977 $2.01 ROA (GAAP)                          0.85%          0.72%         0.90%         0.96%          0.83%             0.52%           1.44%          1.17% OperatingEfficiency  ratioROA (GAAP) (non-GAAP) 0.90% 72.0% 0.91% 75.3% 0.90% 68.5% 0.96% 66.3% 0.95% 66.7%  82.2% 1.21%   57.2%1.63%   60.7%  1.21% Efficiency ratio (FTE) (non-GAAP)       70.1%       73.4%          66.5%          64.3%       64.8%          81.0%         56.5%        59.7% Operating efficiency ratio (FTE) (non-GAAP) 69.0%   67.2%          66.5%          64.3%       63.3%          59.0%         51.0%        58.6%   11 
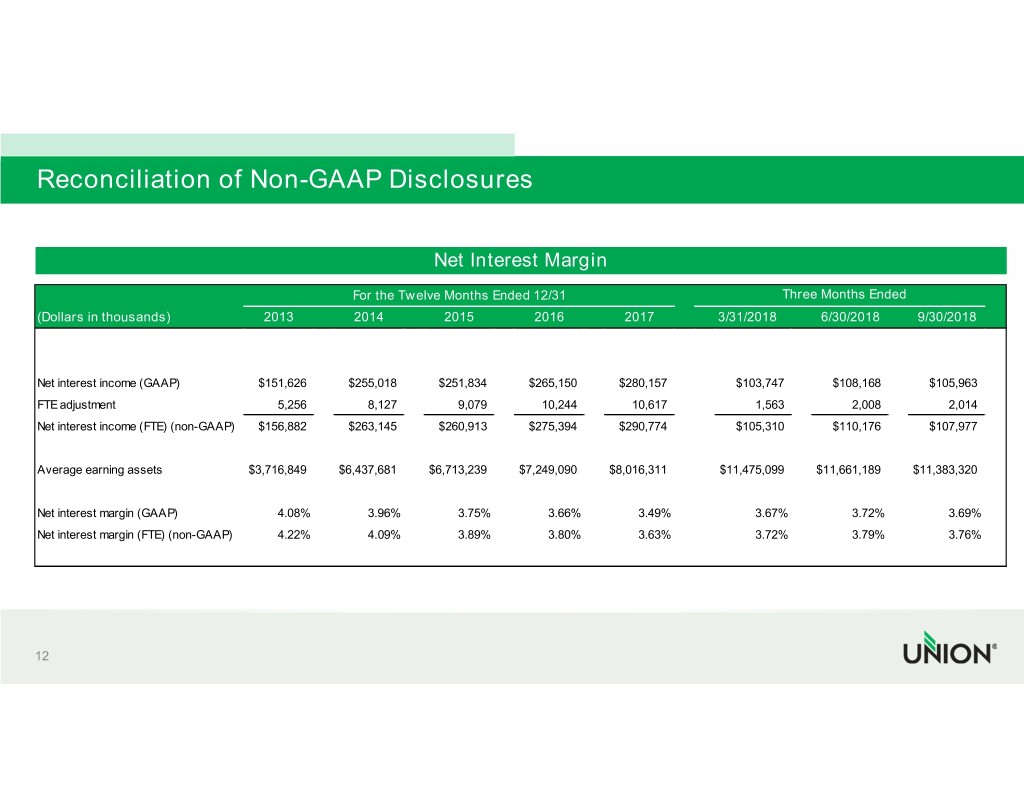
 
 
Reconciliation of Non-GAAP Disclosures                                                                    Net Interest Margin                                                ForFor theFor the Twelve the Twelve Twelve Months Months Months Ended Ended Ended 12/31 12/31 12/31 Three Months  Ended Three   Three Months Months Ended EndedNine Months Ended (Dollars(Dollars(Dollars in in  inthousands) thousands) thousands) 2013 20132014 2014 2014 2015 2015 2015 2016 2016 2016 2017 2017 2017 3/31/2018 3/31/2018 6/30/2018 3/31/2018 9/30/20186/30/2018 6/30/2018 9/30/2018 9/30/2018 9/30/2018     Sale of Shore Premier Finance at a 5% pre $52,164      $67,079       $77,476      $72,923          $16,639       $47,327      $38,197                $102,163 Sale of Third Pary Originated            $13,724            -             -        $4,405          $22,236        $6,537       $1,129                 $29,902 Plus: Nonrecurring tax expenses                -            -             -        $6,250                -            -             -                      -  Average assets (GAAP)           $4,051,850    $7,250,494    $7,492,895     $8,046,305    $8,820,142        $13,019,572    $13,218,227     $12,947,352 Net interestoperating income earnings (GAAP) (non-GAAP) $151,626 $65,888 $255,018 $67,079 $251,834 $77,476 $265,150 $83,578 $280,157 $38,875 $53,864 $103,747 $39,326 $108,168 $105,963 $132,065 FTE adjustment                          5,256         8,127          9,079        10,244         10,617              1,563           2,008           2,014 Weighted avg. common shares out., diluted   46,130,895    45,138,891    43,890,271    43,779,744    65,636,262    65,965,577    66,013,152                65,873,202 Net incomeinterest (loss) income (GAAP) (FTE) (non-GAAP) $34,366 $156,882 $52,164 $263,145 $67,079 $260,913 $77,476 $275,394 $72,923 $290,774 $16,639 $105,310 $47,327 $110,176 $38,197 $107,977 NetEPS operating (GAAP) earnings (non-GAAP) $36,408 $1.13 $65,888 $1.49 $67,079 $1.77 $77,476 $1.67 $83,578 $0.25 $38,875 $0.72 $53,864 $0.58 $39,326  $1.55 OperatingAverage earning EPS (non-GAAP) assets $3,716,849 $1.43 $6,437,681 $1.49 $6,713,239 $1.77 $7,249,090 $1.91 $8,016,311 $0.59 $11,475,099 $0.82 $11,661,189 $0.60 $11,383,320 $2.01 ROA (GAAP)                          0.85%          0.72%         0.90%         0.96%          0.83%             0.52%           1.44%          1.17%  OperatingNet interest ROA margin (non-GAAP) (GAAP) 0.90% 4.08% 0.91% 3.96% 0.90% 3.75% 0.96% 3.66% 0.95% 3.49%  1.21% 3.67%1.63%     3.72%     1.21% 3.69% Net interest margin (FTE) (non-GAAP)    4.22%         4.09%          3.89%          3.80%         3.63%              3.72%           3.79%           3.76%   12 

 
 
           John Asbury PRESIDENT & CEO, UNION BANKSHARES        CEO, UNION BANK & TRUST 
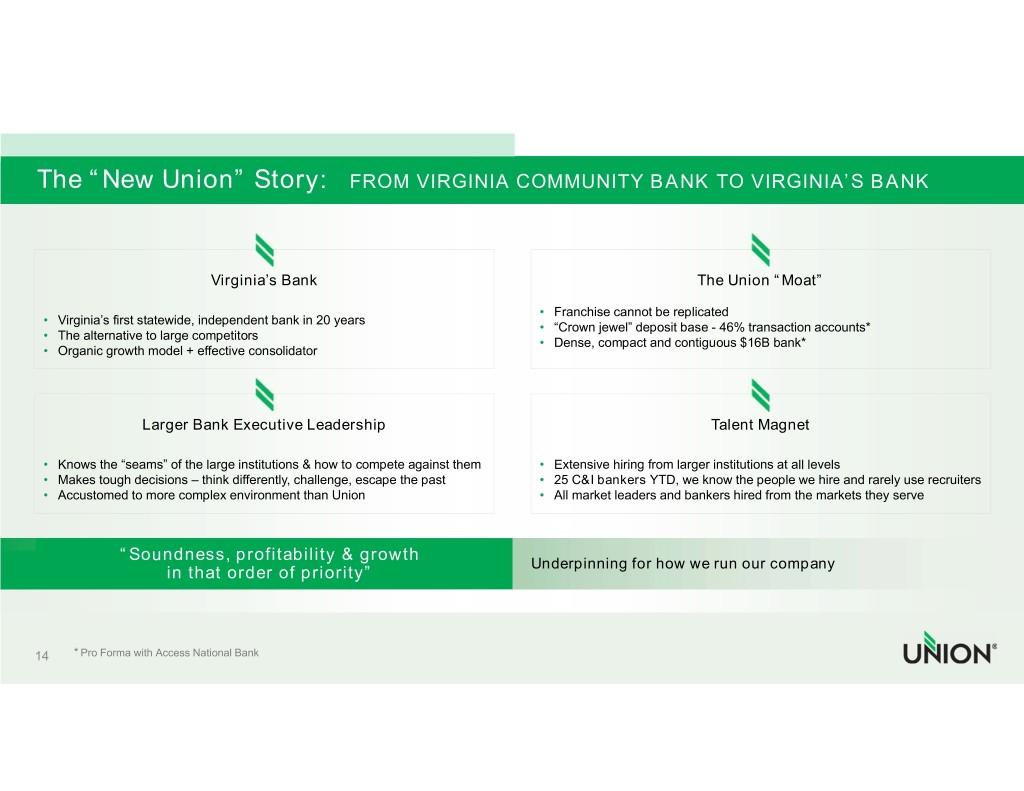
 
 
The “New Union” Story:   FROM VIRGINIA COMMUNITY BANK TO VIRGINIA’S BANK                               Virginia’s Bank                                                                The Union “Moat”                                                                                    •  Franchise cannot be replicated   •  Virginia’s first statewide, independent bank in 20 years                                                                                  •  “Crown jewel” deposit base - 46% transaction accounts*  •  The alternative to large competitors                                                                                  •  Dense, compact and contiguous $16B bank*  •  Organic growth model + effective consolidator                    Larger Bank Executive Leadership                                                            Talent Magnet   •  Knows the “seams” of the large institutions & how to compete against them    •  Extensive hiring from larger institutions at all levels  •  Makes tough decisions – think differently, challenge, escape the past        •  25 C&I bankers YTD, we know the people we hire and rarely use recruiters  •  Accustomed to more complex environment than Union                            •  All market leaders and bankers hired from the markets they serve                “Soundness, profitability & growth                                                                                 Underpinning for how we run our company                      in that order of priority”   14    * Pro Forma with Access National Bank 
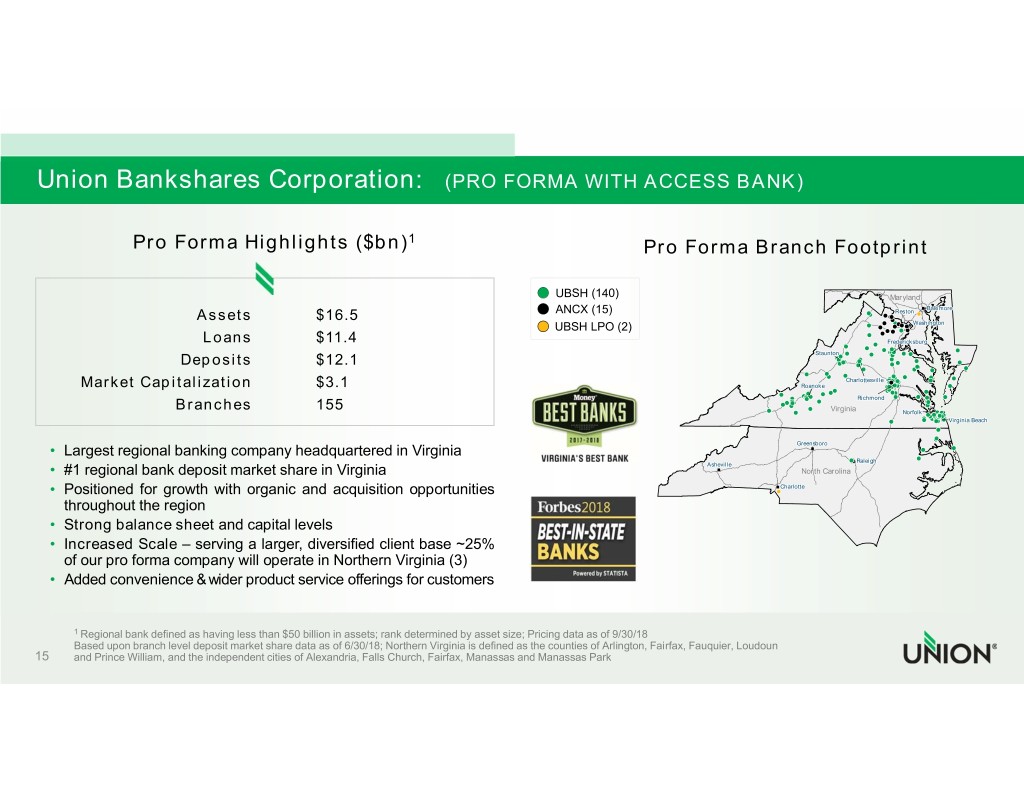
 
 
Union Bankshares Corporation:   (PRO FORMA WITH ACCESS BANK)               Pro Forma Highlights ($bn)1                                      Pro Forma Branch Footprint                                                                     UBSH (140)                                                                                                               Maryland                                                                                                                    BaltimoreBaltimore                                                                    ANCX (15)                                   RestonReston                                                                                                                                   Assets         $16.5                                                                                                                                                                                     Washington                                                                                                                                                                                  UBSH LPO (2)                                                                                                                                                                   Loans         $11.4                                                                     FredericksburgFredericksburg                                                                                                                                                                                                                                                                                                                                  StauntonStaunton                                                                                                                                                                                                                                                                                                                                                             Deposits         $12.1                                                                                                                                                                                                                                                                                                                                                                                                                                                                                                                                CharlottesvilleCharlottesville                                                                                                                         Market Capitalization         $3.1                                                           RoanokeRoanoke                                                                                                                                                                                                                                                                                                                              RichmondRichmond                                                                                                                                                                                                                                                      Branches          155                                                              Virginia                                                                                                                NorfolkNorfolk                                                                                                                                                                                                                                         VirginiaVirginia  BeachBeach                                                                                                                                                                                                                                                                                                                                             Greensboro                                                                                                                         • Largest regional banking company headquartered in Virginia                                                                                                                                                               Raleigh                                                                                        AshevilleAsheville  Raleigh   • #1 regional bank deposit market share in Virginia                                              North Carolina   • Positioned for growth with organic and acquisition opportunities                            Charlotte     throughout the region   • Strong balance sheet and capital levels   • Increased Scale – serving a larger, diversified client base ~25%     of our pro forma company will operate in Northern Virginia (3)   • Added convenience & wider product service offerings for customers        1 Regional bank defined as having less than $50 billion in assets; rank determined by asset size; Pricing data as of 9/30/18      Based upon branch level deposit market share data as of 6/30/18; Northern Virginia is defined as the counties of Arlington, Fairfax, Fauquier, Loudoun  15   and Prince William, and the independent cities of Alexandria, Falls Church, Fairfax, Manassas and Manassas Park 
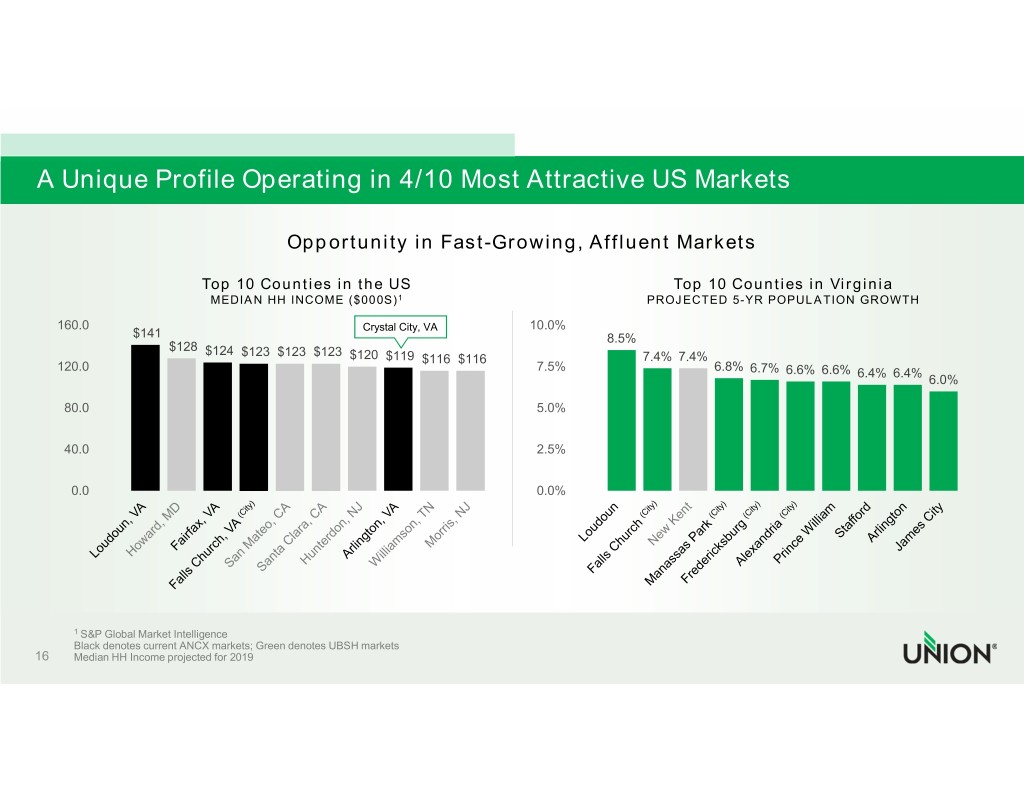
 
 
A Unique Profile Operating in 4/10 Most Attractive US Markets                                           Opportunity in Fast-Growing, Affluent Markets                             Top 10 Counties in the US                                                   Top 10 Counties in Virginia                             MEDIAN HH INCOME ($000S)1                                              PROJECTED 5-YR POPULATION GROWTH      160.0                                            Crystal City, VA           10.0%                 $141                                                                        8.5%                       $128 $124  $123 $123 $123                                                     $120  $119 $116 $116                           7.4%  7.4%     120.0                                                                        7.5%                         6.8%                                                                                                                    6.7%  6.6%  6.6%  6.4% 6.4%                                                                                                                                                 6.0%       80.0                                                                        5.0%       40.0                                                                        2.5%        0.0                                                                        0.0%         1 S&P Global Market Intelligence       Black denotes current ANCX markets; Green denotes UBSH markets 16    Median HH Income projected for 2019 
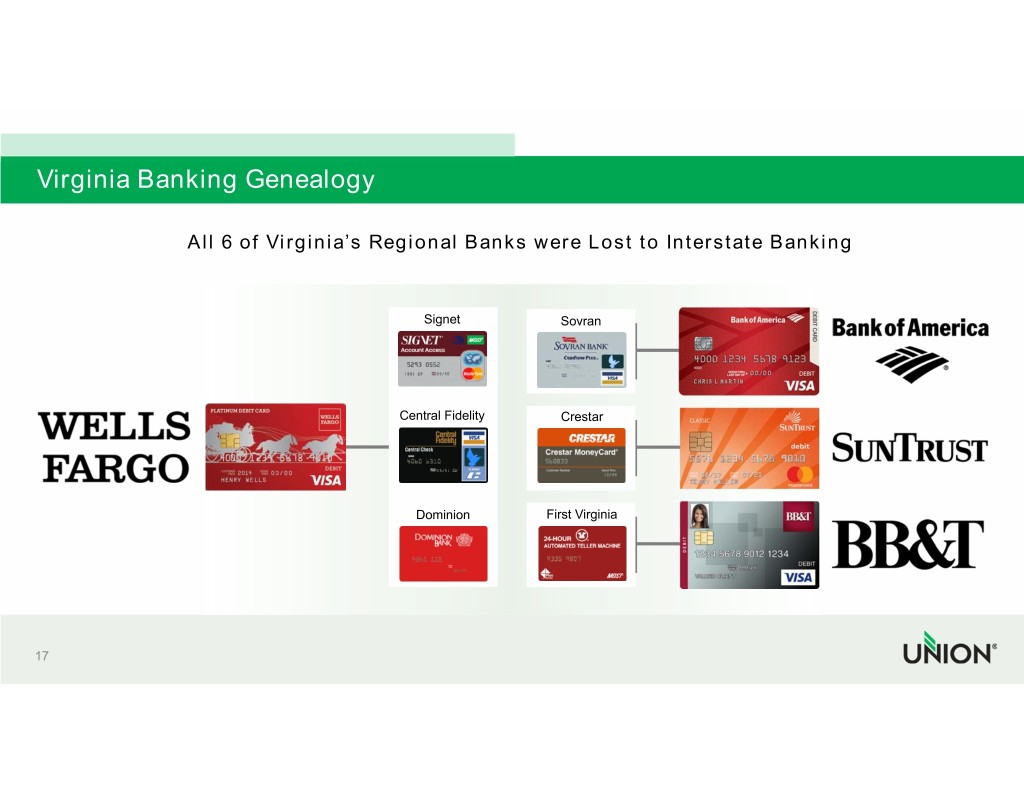
 
 
Virginia Banking Genealogy                 All 6 of Virginia’s Regional Banks were Lost to Interstate Banking                                         Signet        Sovran                                       Central Fidelity Crestar                                         Dominion     First Virginia   17 
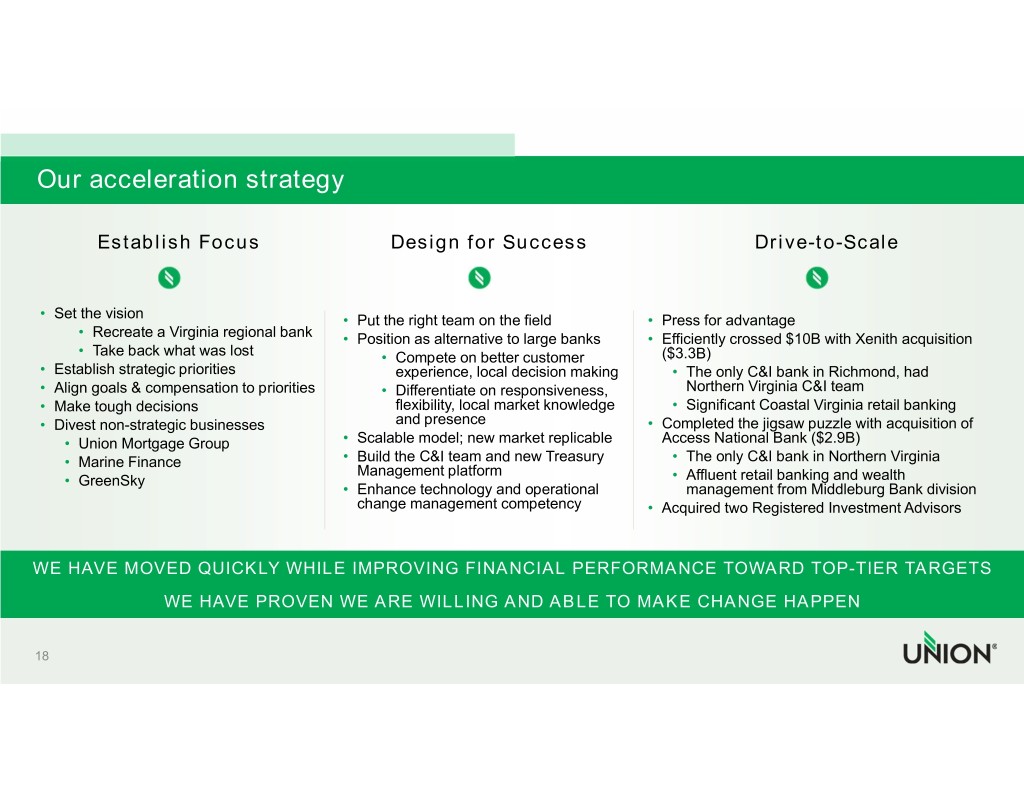
 
 
Our acceleration strategy          Establish Focus                       Design for Success                             Drive-to-Scale    • Set the vision                       • Put the right team on the field      • Press for advantage       • Recreate a Virginia regional bank • Position as alternative to large banks • Efficiently crossed $10B with Xenith acquisition        • Take back what was lost              • Compete on better customer        ($3.3B)  • Establish strategic priorities             experience, local decision making   • The only C&I bank in Richmond, had   • Align goals & compensation to priorities  • Differentiate on responsiveness,     Northern Virginia C&I team  • Make tough decisions                       flexibility, local market knowledge • Significant Coastal Virginia retail banking  • Divest non-strategic businesses            and presence                     • Completed the jigsaw puzzle with acquisition of       • Union Mortgage Group              • Scalable model; new market replicable  Access National Bank ($2.9B)     • Marine Finance                    • Build the C&I team and new Treasury     • The only C&I bank in Northern Virginia                                          Management platform     • GreenSky                                                                    • Affluent retail banking and wealth                                          • Enhance technology and operational        management from Middleburg Bank division                                          change management competency          • Acquired two Registered Investment Advisors  WE HAVE MOVED QUICKLY WHILE IMPROVING FINANCIAL PERFORMANCE TOWARD TOP-TIER TARGETS                  WE HAVE PROVEN WE ARE WILLING AND ABLE TO MAKE CHANGE HAPPEN   18 
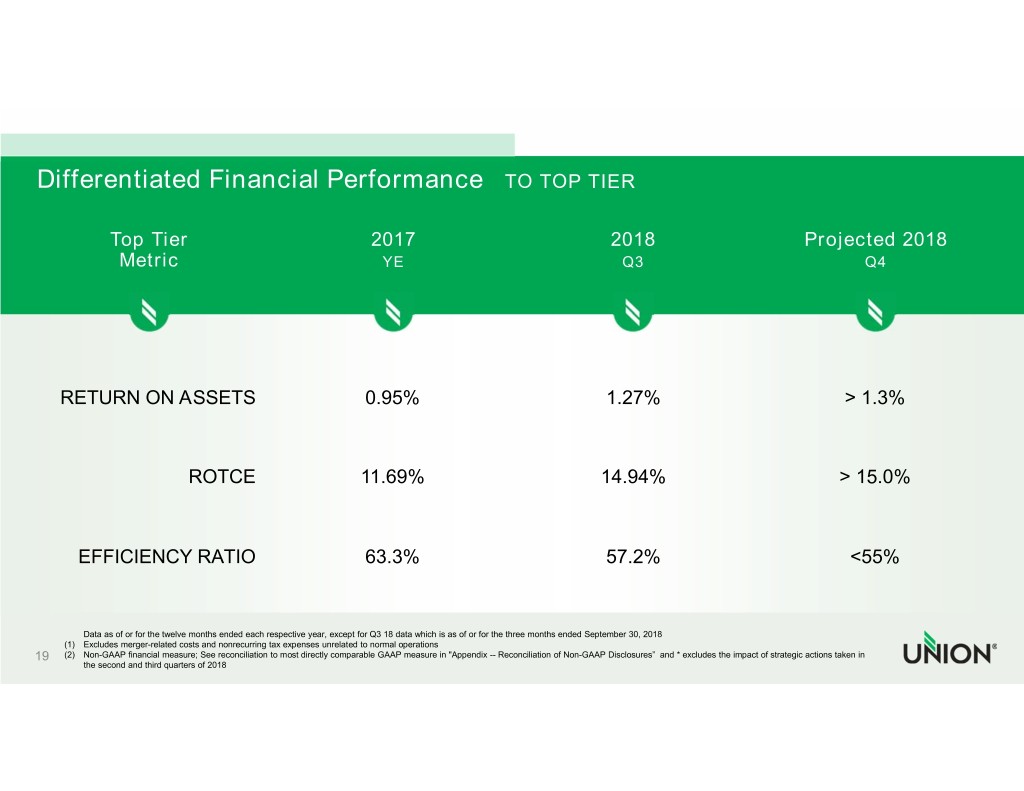
 
 
 Differentiated Financial Performance   TO TOP TIER                      Top Tier                                                           2017                                                          2018                                              Projected 2018                       Metric                                                              YE                                                            Q3                                                            Q4          RETURN ON ASSETS                                                               0.95%                                                         1.27%                                                        > 1.3%                                           ROTCE                                       11.69%                                                        14.94%                                                        > 15.0%               EFFICIENCY RATIO                                                          63.3%                                                         57.2%                                                          <55%                Data as of or for the twelve months ended each respective year, except for Q3 18 data which is as of or for the three months ended September 30, 2018         (1)  Excludes merger-related costs and nonrecurring tax expenses unrelated to normal operations 19      (2)  Non-GAAP financial measure; See reconciliation to most directly comparable GAAP measure in "Appendix -- Reconciliation of Non-GAAP Disclosures”  and * excludes the impact of strategic actions taken in               the second and third quarters of 2018 
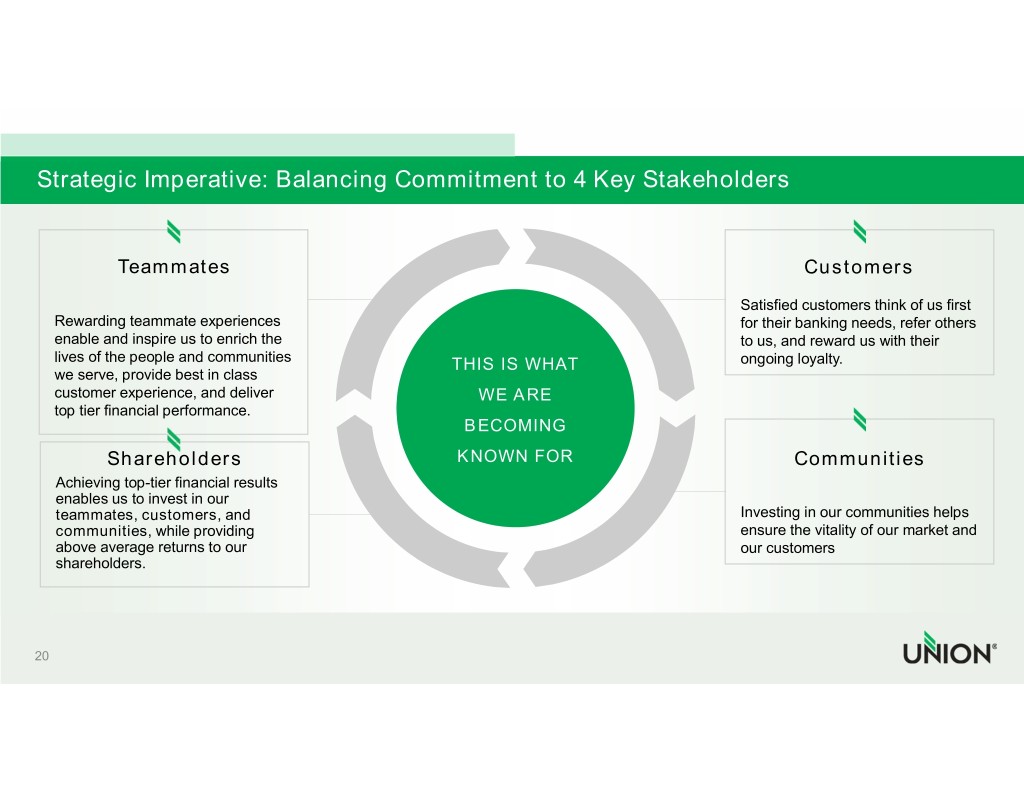
 
 
Strategic Imperative: Balancing Commitment to 4 Key Stakeholders              Teammates                                                                               Customers                                                                                             Satisfied customers think of us first    Rewarding teammate experiences                                                           for their banking needs, refer others    enable and inspire us to enrich the                                                      to us, and reward us with their    lives of the people and communities                 THIS IS WHAT                         ongoing loyalty.   we serve, provide best in class              COMMERCIAL         RETAIL   customer experience, and deliver                       WE ARE    top tier financial performance.                                                        BECOMING           ShareholdersKNOWN FOR                                                                    Communities    Achieving top-tier financial results                  WEALTH    enables us to invest in our    teammates, customers, and                                                               Investing in our communities helps     communities, while providing                                                            ensure the vitality of our market and     above average returns to our                                                            our customers    shareholders.   20 
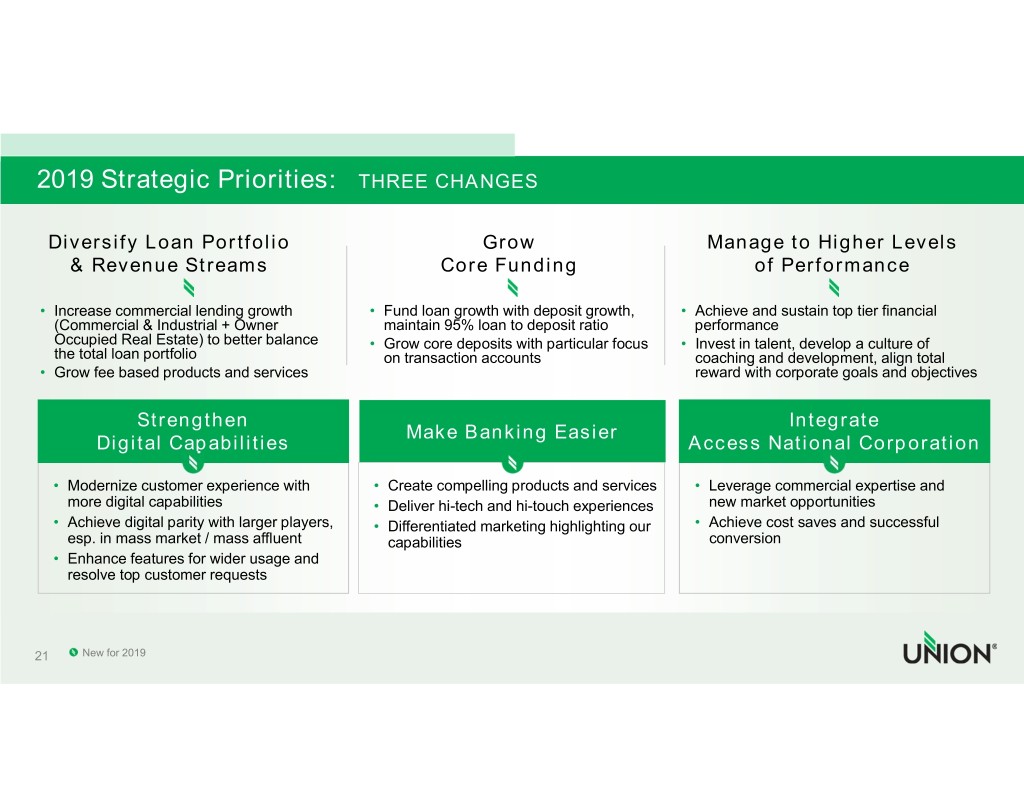
 
 
2019 Strategic Priorities:   THREE CHANGES    Diversify Loan Portfolio                                Grow                         Manage to Higher Levels     & Revenue Streams                               Core Funding                             of Performance   • Increase commercial lending growth      • Fund loan growth with deposit growth, • Achieve and sustain top tier financial    (Commercial & Industrial + Owner           maintain 95% loan to deposit ratio      performance   Occupied Real Estate) to better balance  • Grow core deposits with particular focus • Invest in talent, develop a culture of    the total loan portfolio                   on transaction accounts                 coaching and development, align total   • Grow fee based products and services                                              reward with corporate goals and objectives               Strengthen                                                                          Integrate                                                 Make Banking Easier         Digital Capabilities                                                        Access National Corporation    • Modernize customer experience with      • Create compelling products and services • Leverage commercial expertise and      more digital capabilities               • Deliver hi-tech and hi-touch experiences new market opportunities   • Achieve digital parity with larger players, • Differentiated marketing highlighting our • Achieve cost saves and successful      esp. in mass market / mass affluent      capabilities                              conversion   • Enhance features for wider usage and      resolve top customer requests   21    New for 2019 

 
 
      Maria Tedesco PRESIDENT UNION BANK & TRUST 
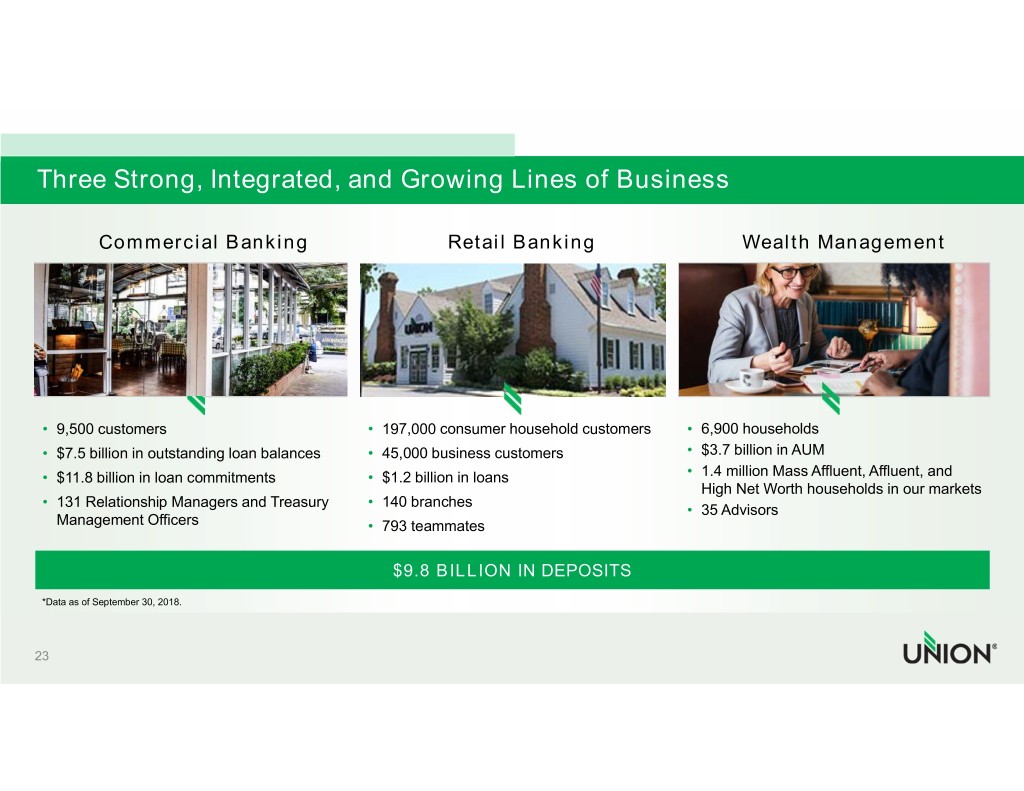
 
 
Three Strong, Integrated, and Growing Lines of Business          Commercial Banking                           Retail Banking                        Wealth Management    • 9,500 customers                         • 197,000 consumer household customers   • 6,900 households  • $7.5 billion in outstanding loan balances • 45,000 business customers            • $3.7 billion in AUM  • $11.8 billion in loan commitments       • $1.2 billion in loans                  • 1.4 million Mass Affluent, Affluent, and                                                                                        High Net Worth households in our markets  • 131 Relationship Managers and Treasury  • 140 branches                                                                                     • 35 Advisors    Management Officers                     • 793 teammates                                                $9.8 BILLION IN DEPOSITS   *Data as of September 30, 2018.    23 
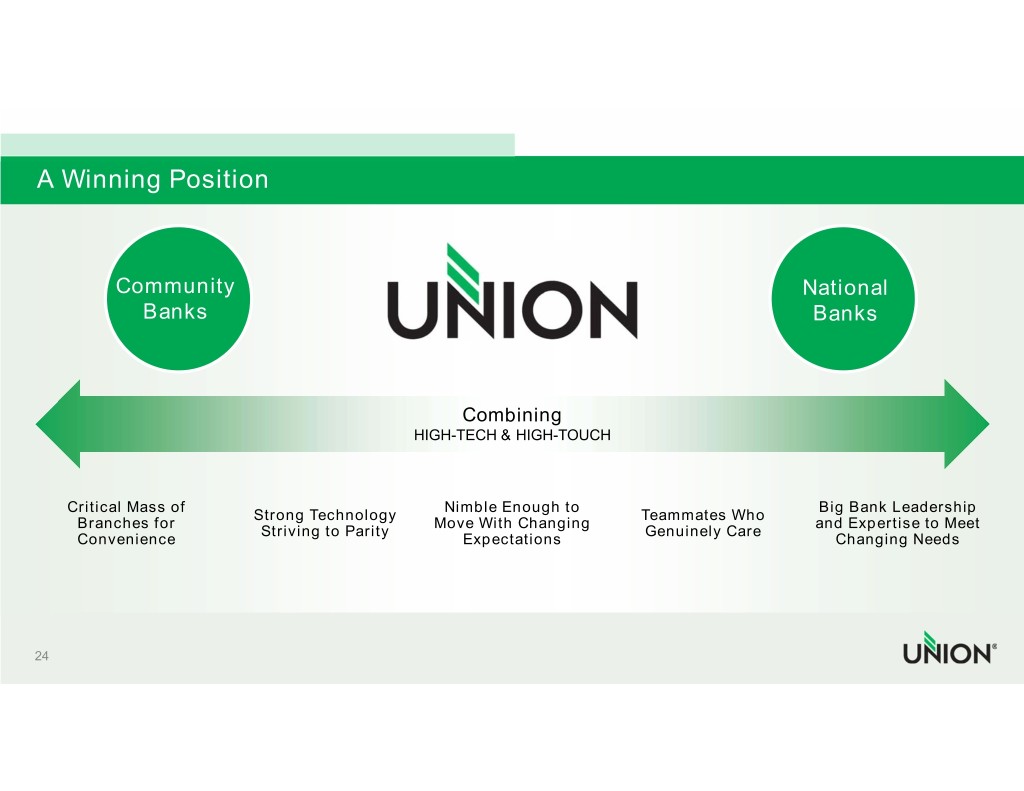
 
 
A Winning Position             Community                                                                                National               Banks                                                                                 Banks                                                          Combining                                                  HIGH-TECH & HIGH-TOUCH       Critical Mass of                                 Nimble Enough to                                Big Bank Leadership                              Strong Technology                                 Teammates Who       Branches for                                  Move With Changing                                and Expertise to Meet                               Striving to Parity                                Genuinely Care      Convenience                                       Expectations                                    Changing Needs   24 
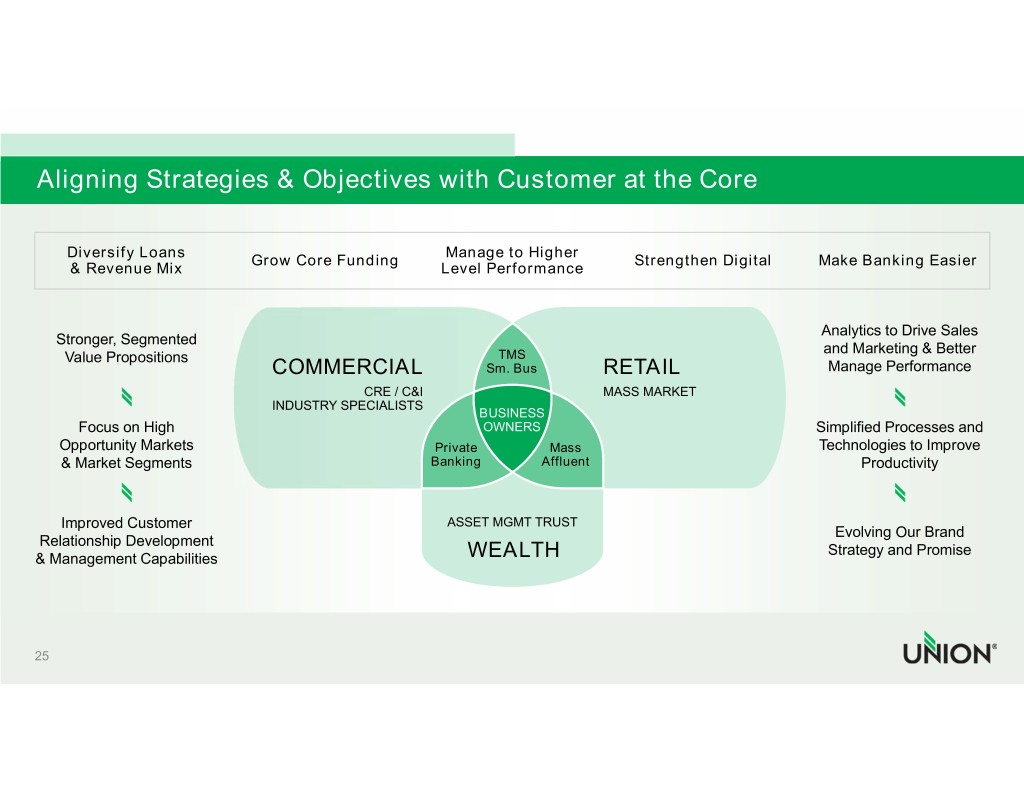
 
 
Aligning Strategies & Objectives with Customer at the Core       Diversify Loans                                  Manage to Higher                              Grow Core Funding                                Strengthen Digital      Make Banking Easier     & Revenue Mix                                   Level Performance                                                                                                        Analytics to Drive Sales     Stronger, Segmented                                                                                                       and Marketing & Better      Value Propositions                                      TMS                                COMMERCIAL                 Sm. Bus        RETAIL                       Manage Performance                                           CRE / C&I                      MASS MARKET                                INDUSTRY SPECIALISTS                                                          BUSINESS        Focus on High                                       OWNERS                                     Simplified Processes and     Opportunity Markets                             Private        Mass                               Technologies to Improve     & Market Segments                               Banking       Affluent                                 Productivity      Improved Customer                                 ASSET MGMT TRUST                                                                                                        Evolving Our Brand   Relationship Development                                                                                                        Strategy and Promise & Management Capabilities                               WEALTH   25 
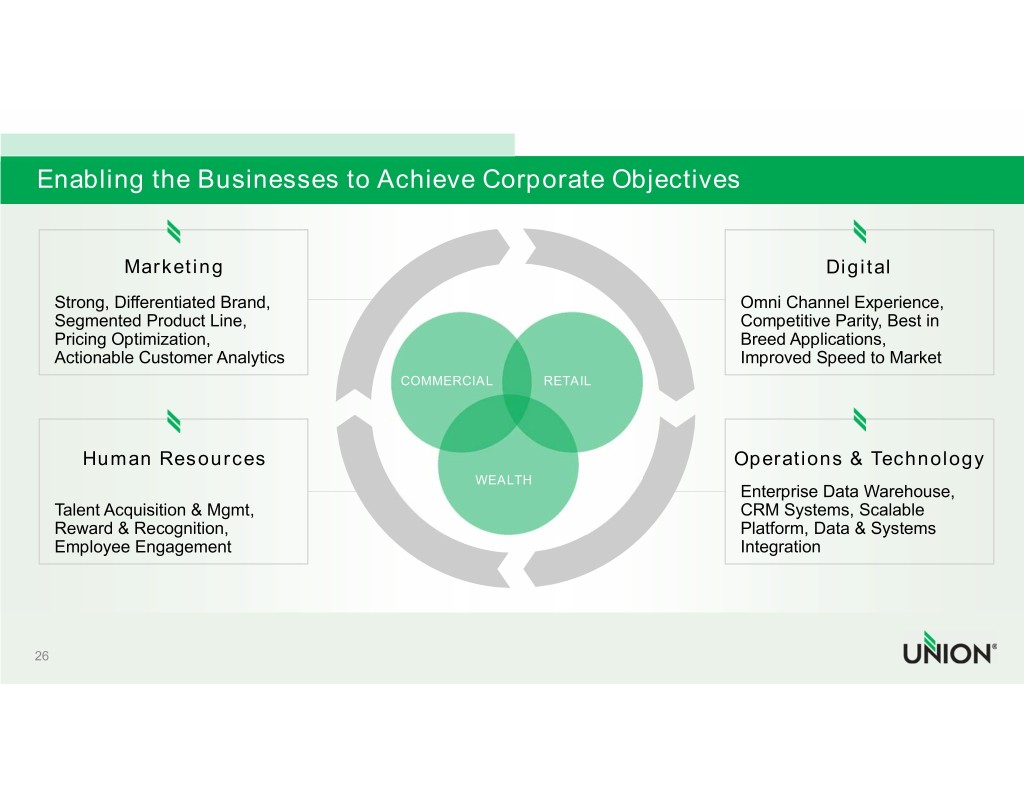
 
 
Enabling the Businesses to Achieve Corporate Objectives             Marketing                                                                  Digital    Strong, Differentiated Brand,                                             Omni Channel Experience,    Segmented Product Line,                                                   Competitive Parity, Best in    Pricing Optimization,                                                     Breed Applications,   Actionable Customer Analytics                                             Improved Speed to Market                                        COMMERCIAL      RETAIL        Human Resources                                                       Operations & Technology                                                 WEALTH                                                                             Enterprise Data Warehouse,   Talent Acquisition & Mgmt,                                                CRM Systems, Scalable    Reward & Recognition,                                                     Platform, Data & Systems    Employee Engagement                                                       Integration   26 
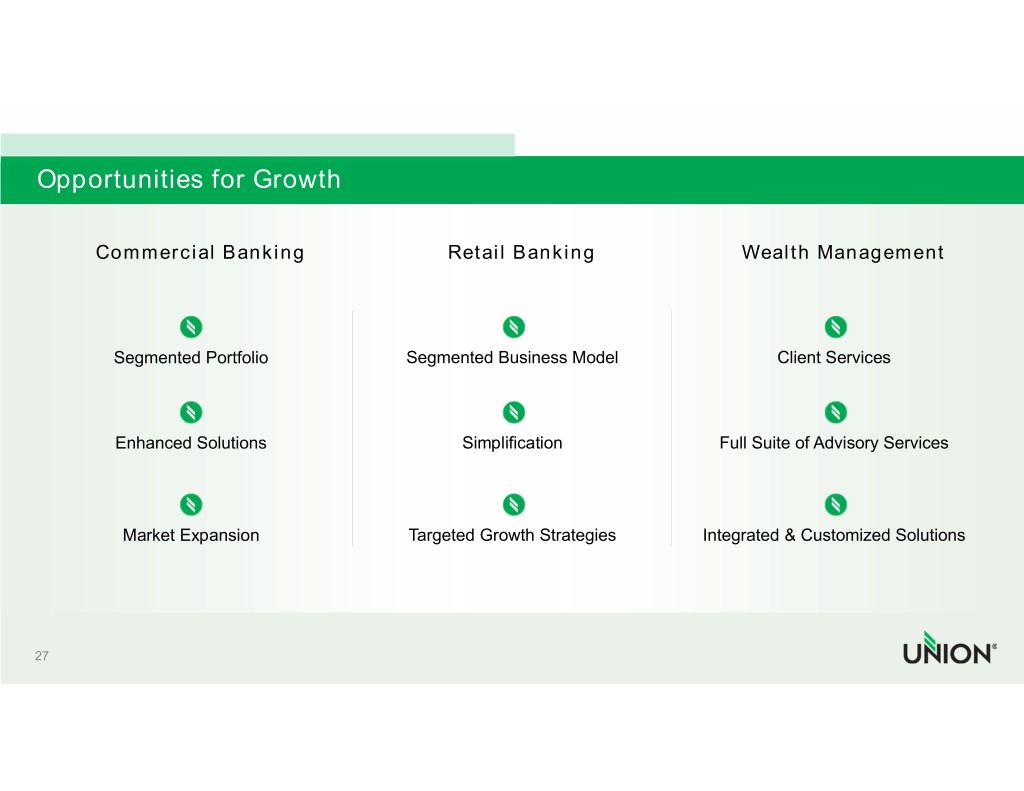
 
 
Opportunities for Growth         Commercial Banking                    Retail Banking                 Wealth Management            Segmented Portfolio            Segmented Business Model                Client Services            Enhanced Solutions                   Simplification              Full Suite of Advisory Services             Market Expansion              Targeted Growth Strategies      Integrated & Customized Solutions   27 
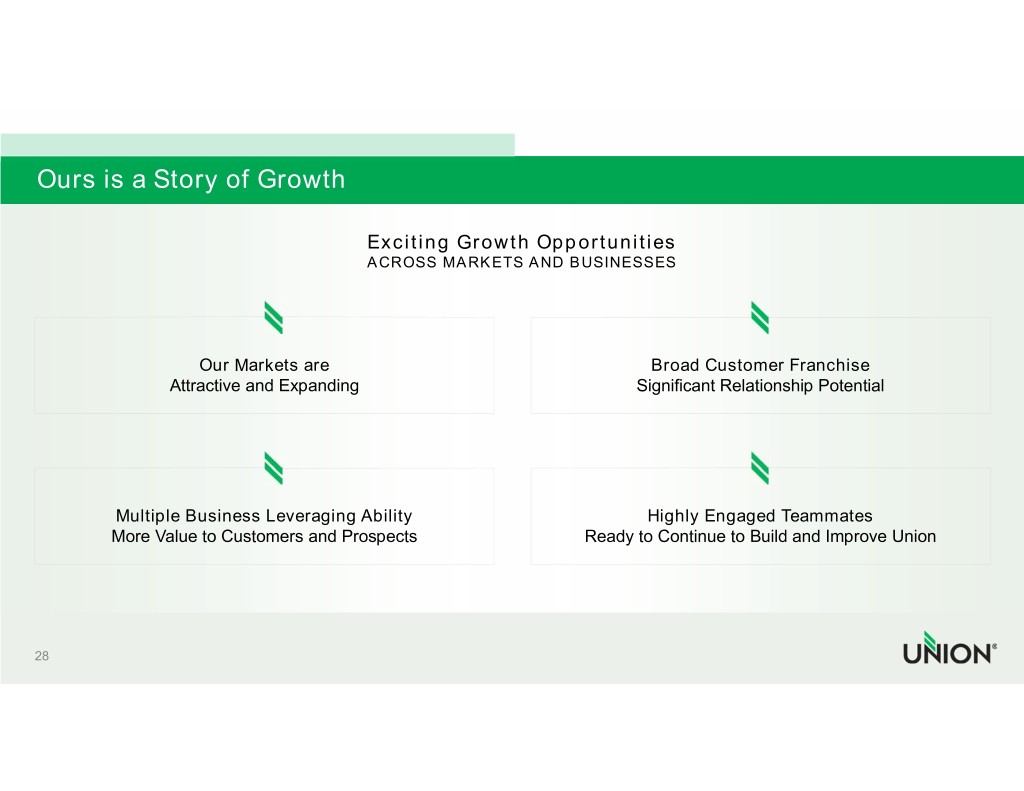
 
 
Ours is a Story of Growth                                      Exciting Growth Opportunities                                      ACROSS MARKETS AND BUSINESSES                     Our Markets are                                 Broad Customer Franchise                Attractive and Expanding                          Significant Relationship Potential            Multiple Business Leveraging Ability                     Highly Engaged Teammates         More Value to Customers and Prospects              Ready to Continue to Build and Improve Union   28 

 
 
             David Ring COMMERCIAL BANKING GROUP EXECUTIVE 
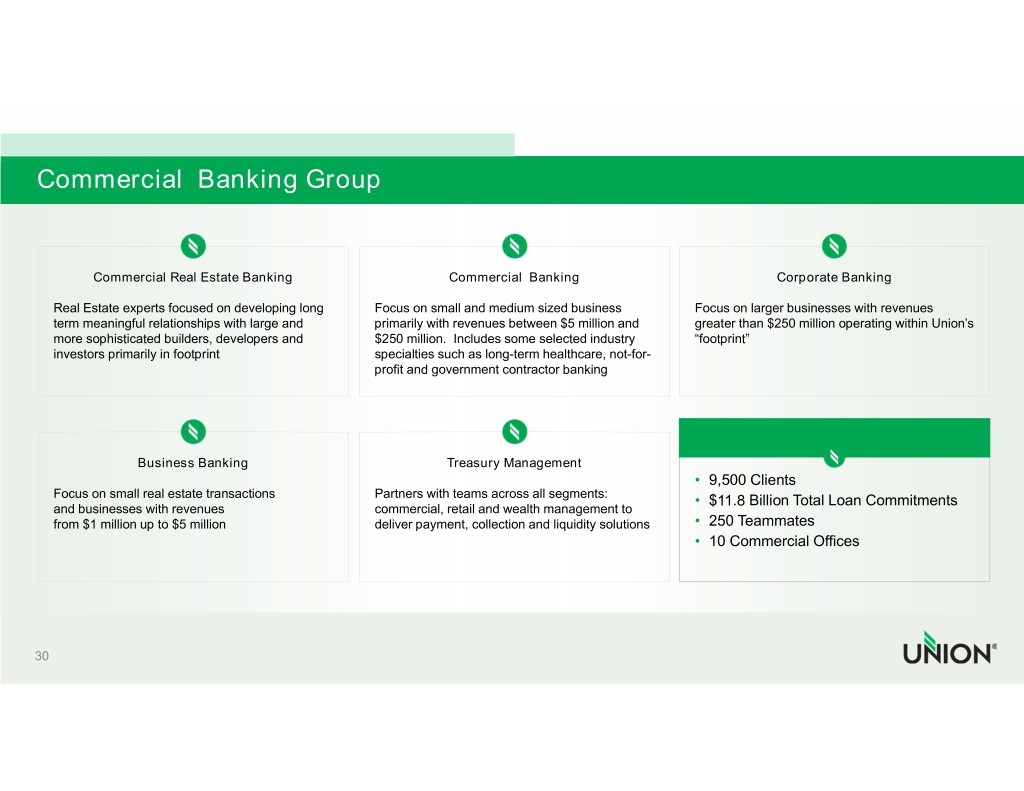
 
 
Commercial  Banking Group            Commercial Real Estate Banking                            Commercial  Banking                                  Corporate Banking     Real Estate experts focused on developing long      Focus on small and medium sized business           Focus on larger businesses with revenues     term meaningful relationships with large and        primarily with revenues between $5 million and     greater than $250 million operating within Union’s     more sophisticated builders, developers and         $250 million.  Includes some selected industry     “footprint”    investors primarily in footprint                    specialties such as long-term healthcare, not-for-                                                        profit and government contractor banking                    Business Banking                                 Treasury Management                                                                                                           •  9,500 Clients    Focus on small real estate transactions             Partners with teams across all segments:           •  $11.8 Billion Total Loan Commitments    and businesses with revenues                        commercial, retail and wealth management to     from $1 million up to $5 million                    deliver payment, collection and liquidity solutions • 250 Teammates                                                                                                           •  10 Commercial Offices   30 
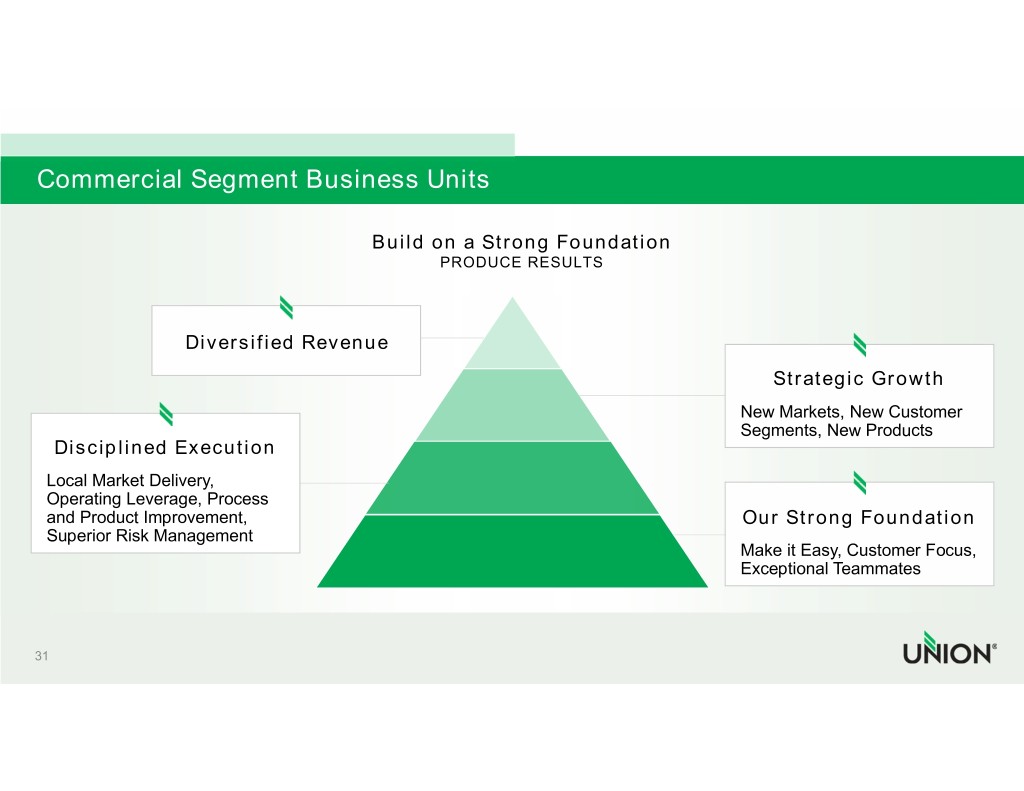
 
 
Commercial Segment Business Units                                      Build on a Strong Foundation                                             PRODUCE RESULTS                   Diversified Revenue                                                                                 Strategic Growth                                                                             New Markets, New Customer                                                                              Segments, New Products   Disciplined Execution  Local Market Delivery,   Operating Leverage, Process   and Product Improvement,                                                   Our Strong Foundation  Superior Risk Management                                                                             Make it Easy, Customer Focus,                                                                              Exceptional Teammates   31 
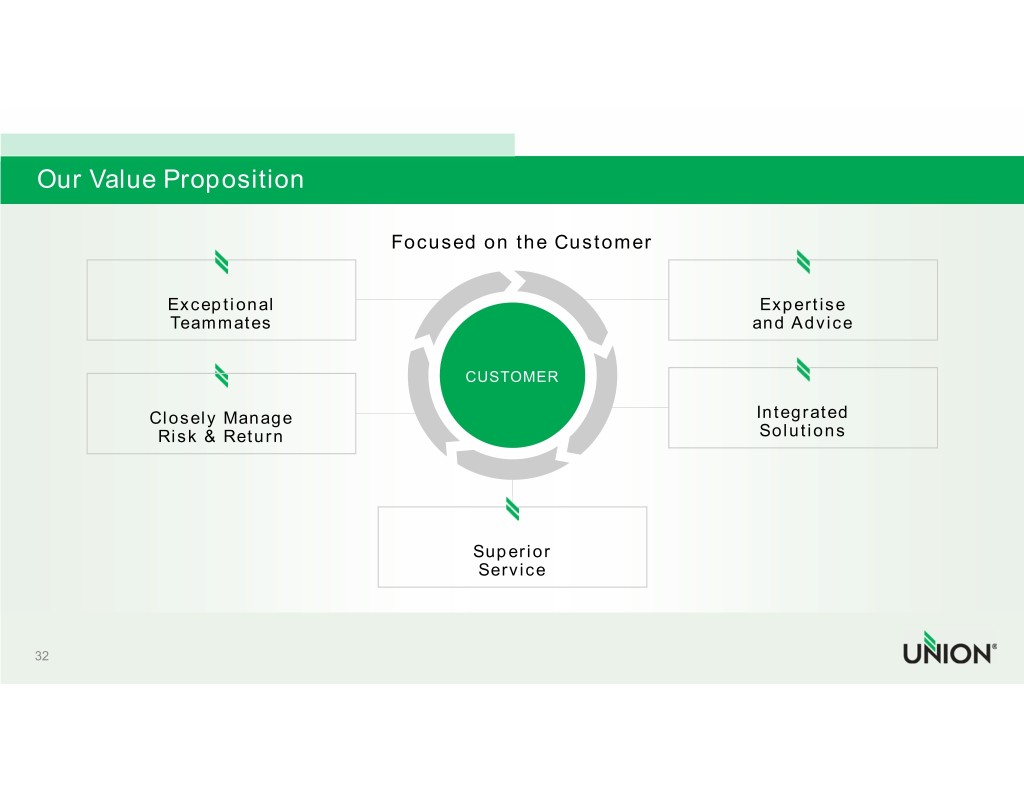
 
 
Our Value Proposition                                        Focused on the Customer                Exceptional                                                     Expertise                Teammates                                                     and Advice                                                CUSTOMER              Closely Manage                                                    Integrated              Risk & Return                                                    Solutions                                                  Superior                                                 Service   32 
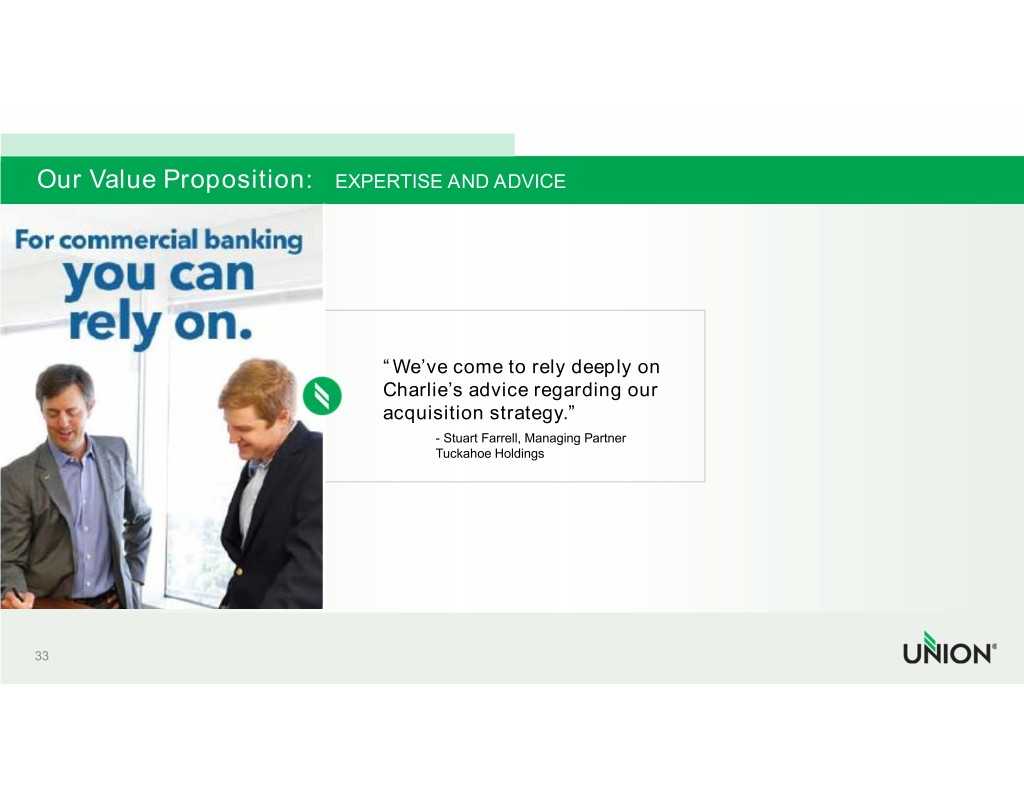
 
 
Our Value Proposition:   EXPERTISE AND ADVICE                                     “We’ve come to rely deeply on                                    Charlie’s advice regarding our                                    acquisition strategy.”                                         - Stuart Farrell, Managing Partner                                         Tuckahoe Holdings   33 
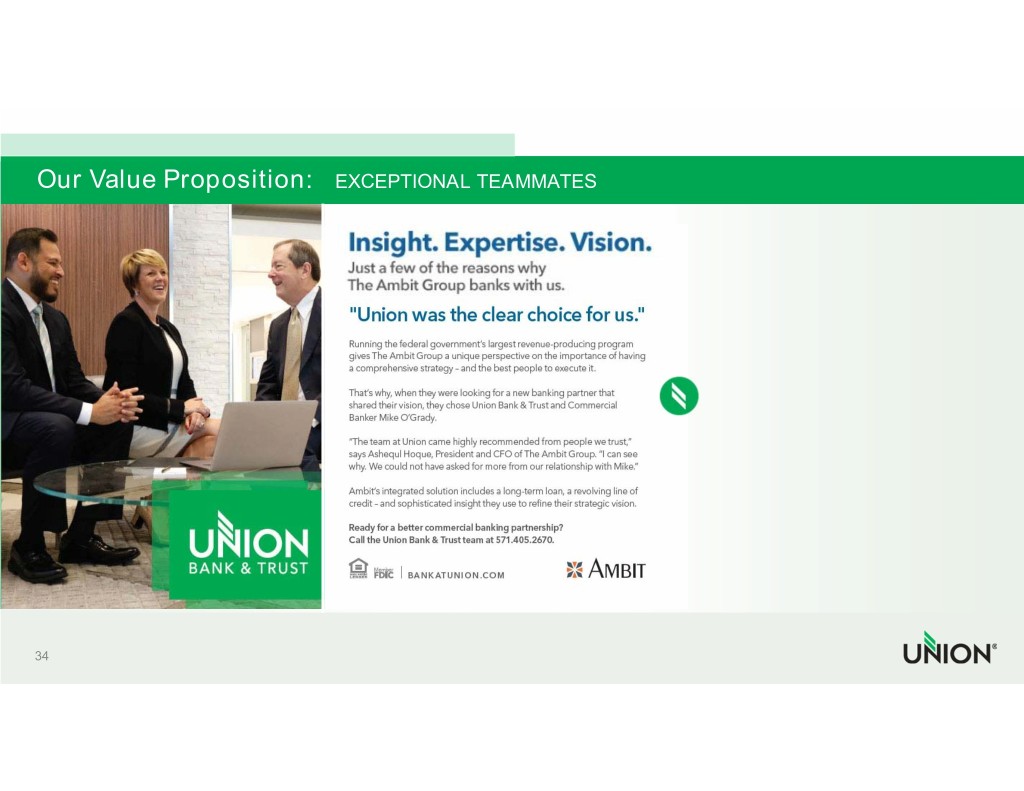
 
 
Our Value Proposition:   EXCEPTIONAL TEAMMATES   34 
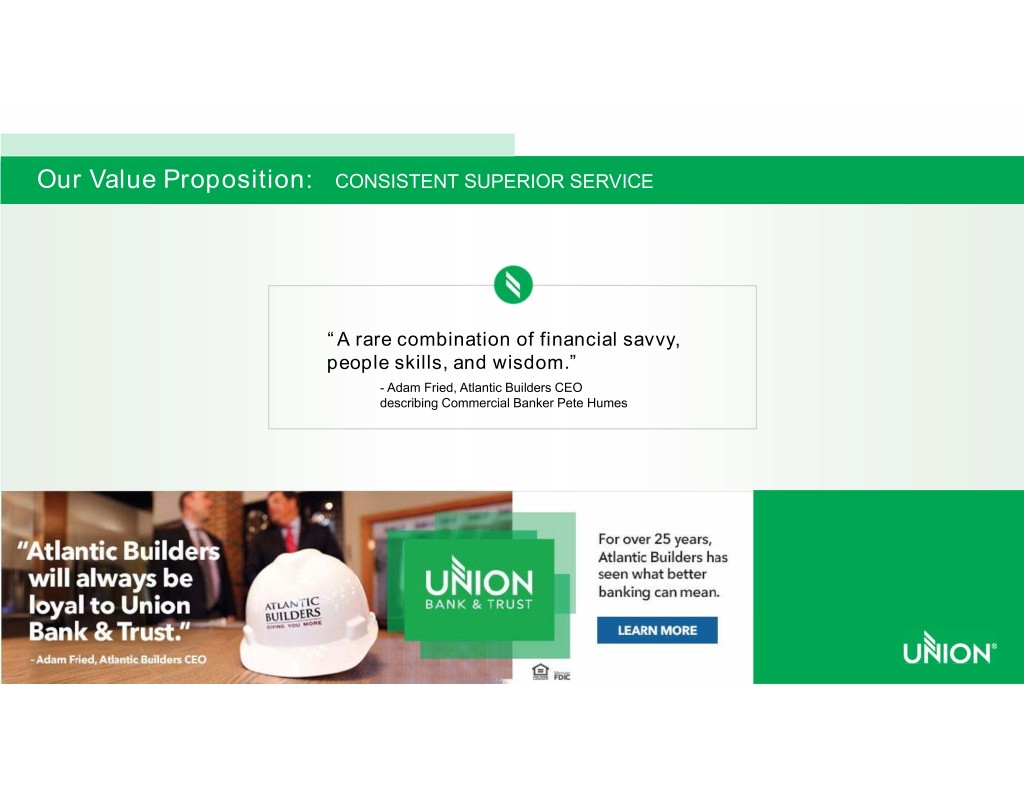
 
 
Our Value Proposition:   CONSISTENT SUPERIOR SERVICE                                “A rare combination of financial savvy,                              people skills, and wisdom.”                                   - Adam Fried, Atlantic Builders CEO                                   describing Commercial Banker Pete Humes   35 
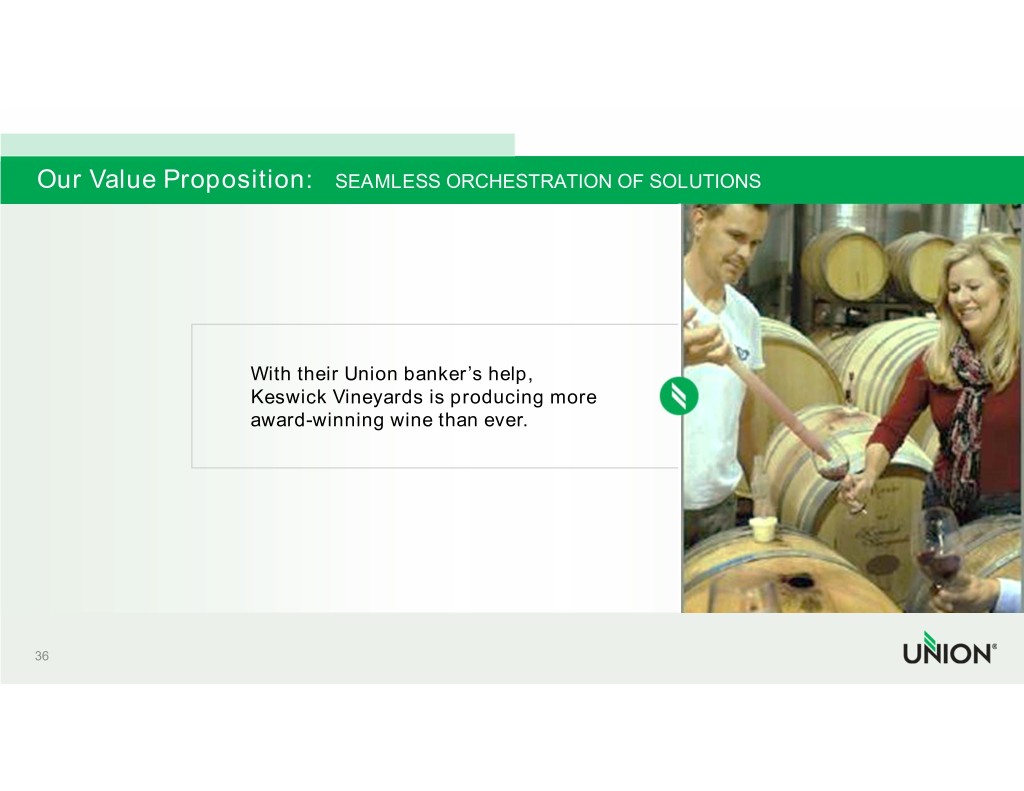
 
 
Our Value Proposition:   SEAMLESS ORCHESTRATION OF SOLUTIONS                        With their Union banker’s help,                      Keswick Vineyards is producing more                       award-winning wine than ever.   36 
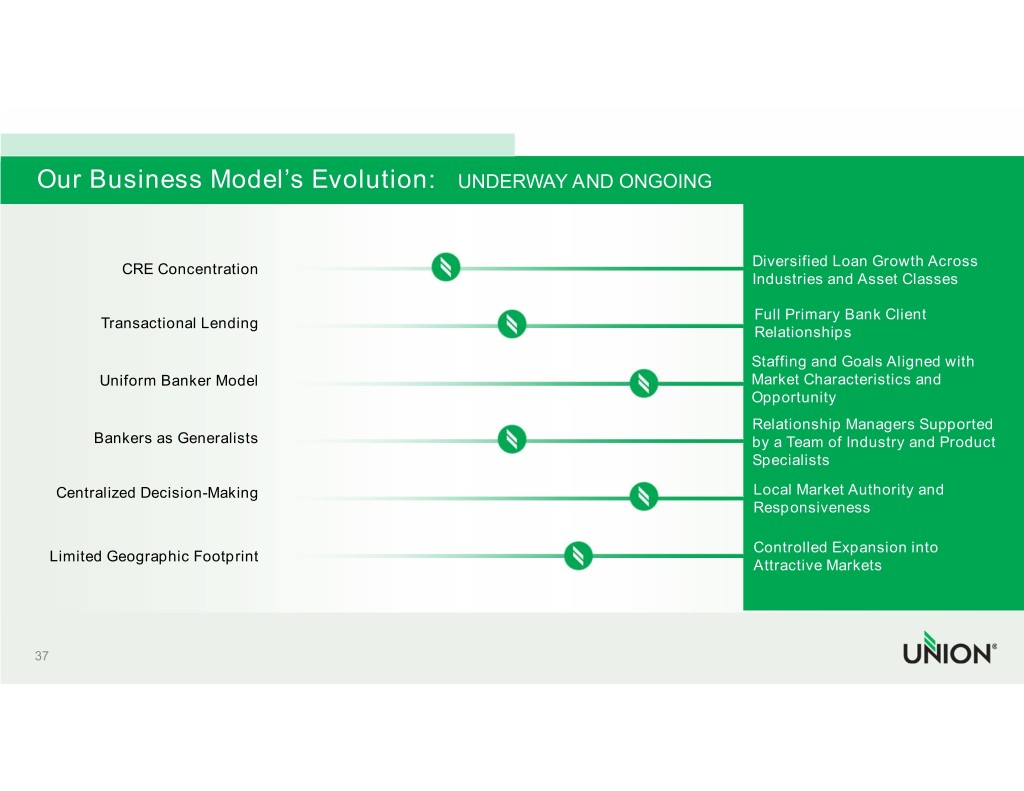
 
 
Our Business Model’s Evolution:   UNDERWAY AND ONGOING                                                                                               Diversified Loan Growth Across             CRE Concentration                                                                                             Industries and Asset Classes                                                                                                Full Primary Bank Client          Transactional Lending                                                                                              Relationships                                                                                              Staffing and Goals Aligned with          Uniform Banker Model                                                                Market Characteristics and                                                                                              Opportunity                                                                                              Relationship Managers Supported          Bankers as Generalists                                                              by a Team of Industry and Product                                                                                              Specialists     Centralized Decision-Making                                                               Local Market Authority and                                                                                               Responsiveness                                                                                                Controlled Expansion into    Limited Geographic Footprint                                                                                              Attractive Markets   37 
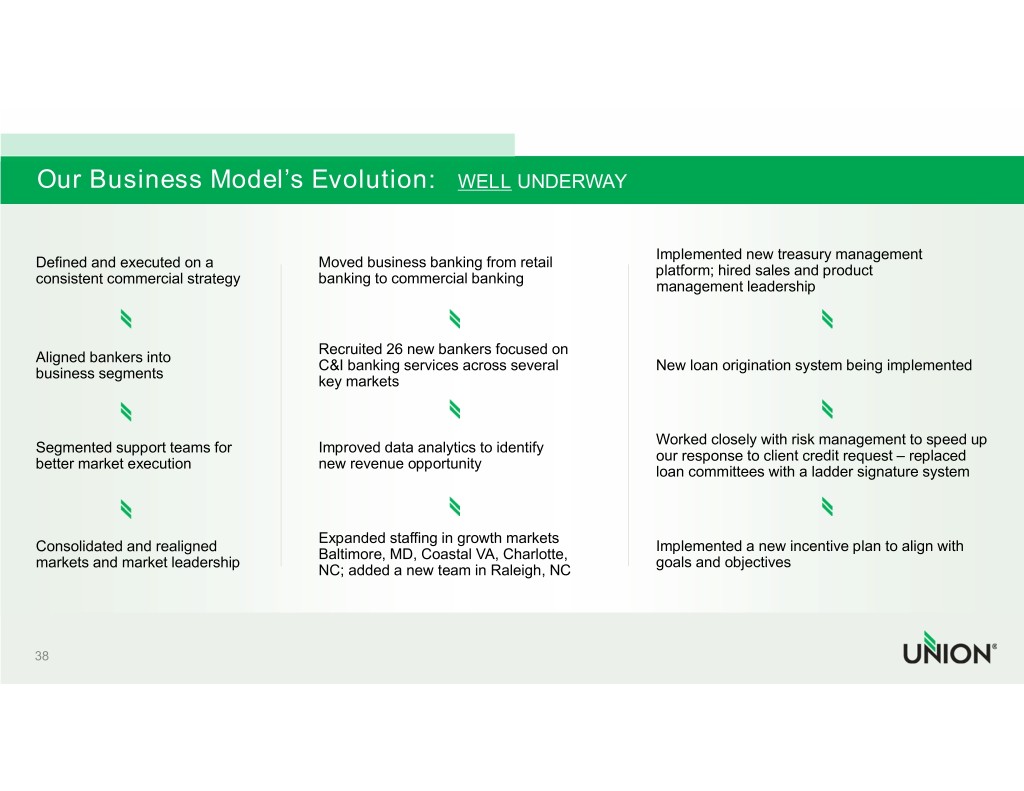
 
 
Our Business Model’s Evolution:   WELL UNDERWAY                                                                                   Implemented new treasury management  Defined and executed on a           Moved business banking from retail                                                                                  platform; hired sales and product  consistent commercial strategy      banking to commercial banking                                                                                 management leadership                                       Recruited 26 new bankers focused on  Aligned bankers into                                     C&I banking services across several         New loan origination system being implemented business segments                                     key markets                                                                                  Worked closely with risk management to speed up  Segmented support teams for         Improved data analytics to identify                                                                                 our response to client credit request – replaced  better market execution             new revenue opportunity                                                                                 loan committees with a ladder signature system                                       Expanded staffing in growth markets Consolidated and realigned                                                      Implemented a new incentive plan to align with                                      Baltimore, MD, Coastal VA, Charlotte,  markets and market leadership                                                   goals and objectives                                     NC; added a new team in Raleigh, NC   38 
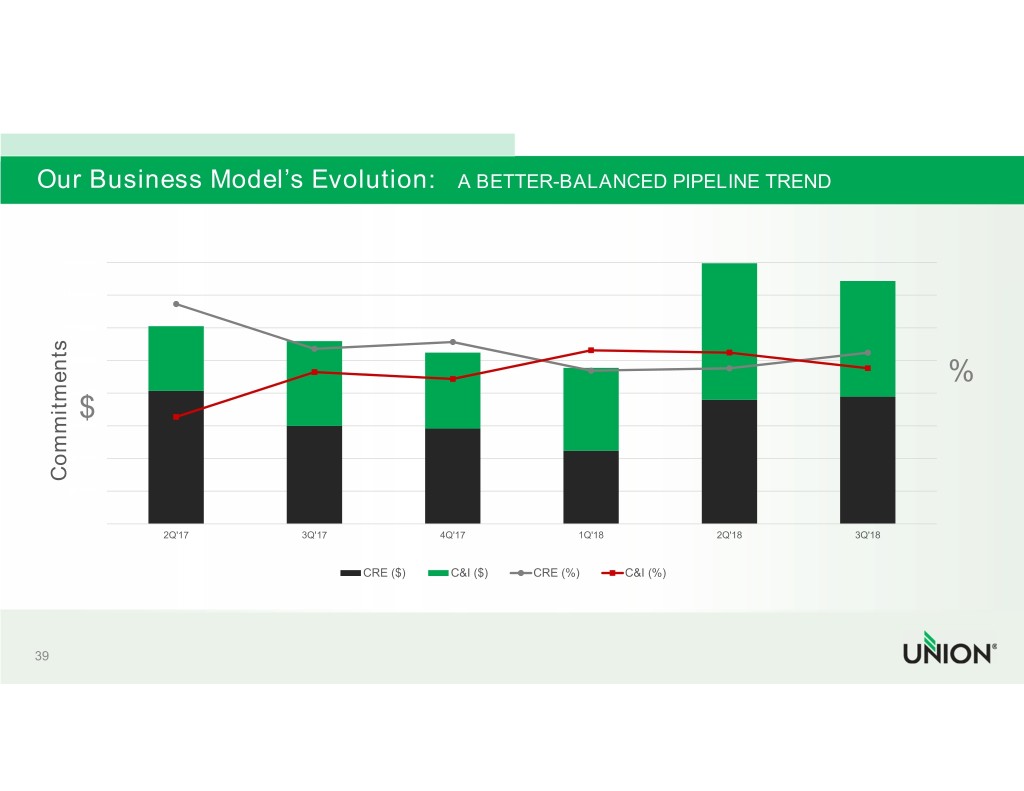
 
 
Our Business Model’s Evolution:   A BETTER-BALANCED PIPELINE TREND         1600000        1400000        1200000       1000000                                                                                                                                                                                       %        800000          $        600000         400000        Commitments        200000              0                             2Q'17                        3Q'17                         4Q'17                         1Q'18                        2Q'18                         3Q'18                                                                        CRE ($)            C&I ($)           CRE (%)             C&I (%)   39 
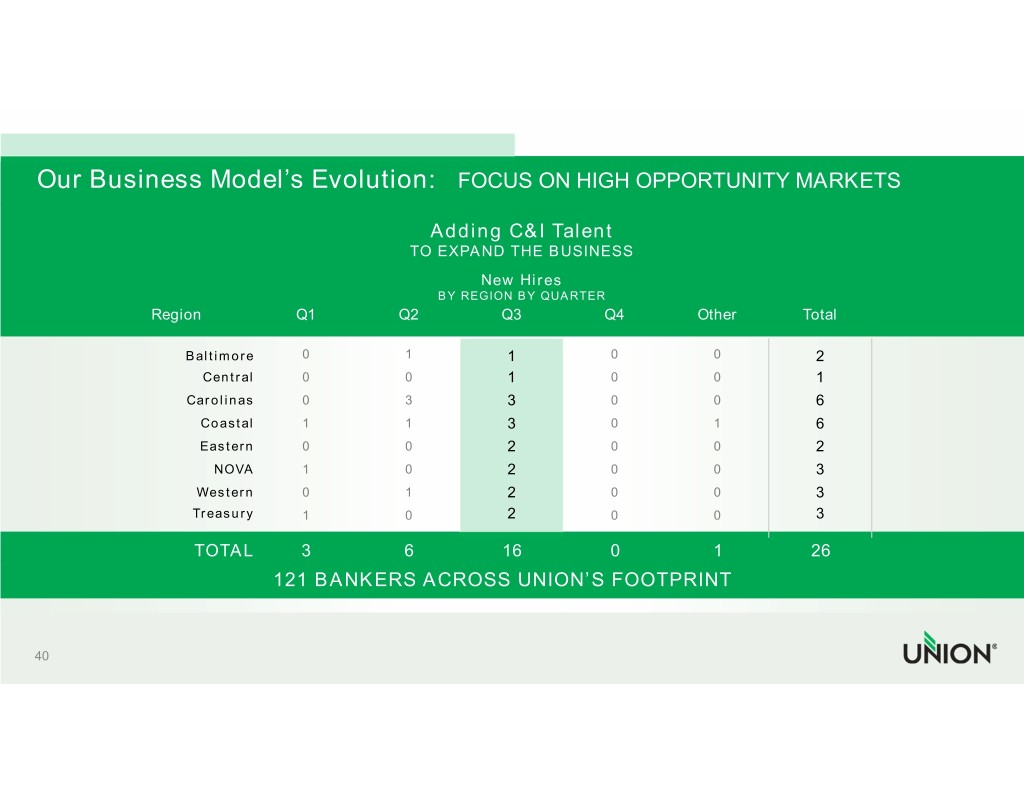
 
 
Our Business Model’s Evolution:   FOCUS ON HIGH OPPORTUNITY MARKETS                                                                  Adding C&I Talent                                                             TO EXPAND THE BUSINESS                                                                         New Hires                                                                  BY REGION BY QUARTER                    Region                 Q1               Q2              Q3               Q4             Other            Total                          Baltimore          011                                               002                            Central         001                                               001                         Carolinas          033                                               006                            Coastal         113                                               016                            Eastern         002                                               002                              NOVA          102                                               003                           Western          012                                               003                          Treasury          102                                               003                            TOTAL36160126                                       121 BANKERS ACROSS UNION’S FOOTPRINT_   40 
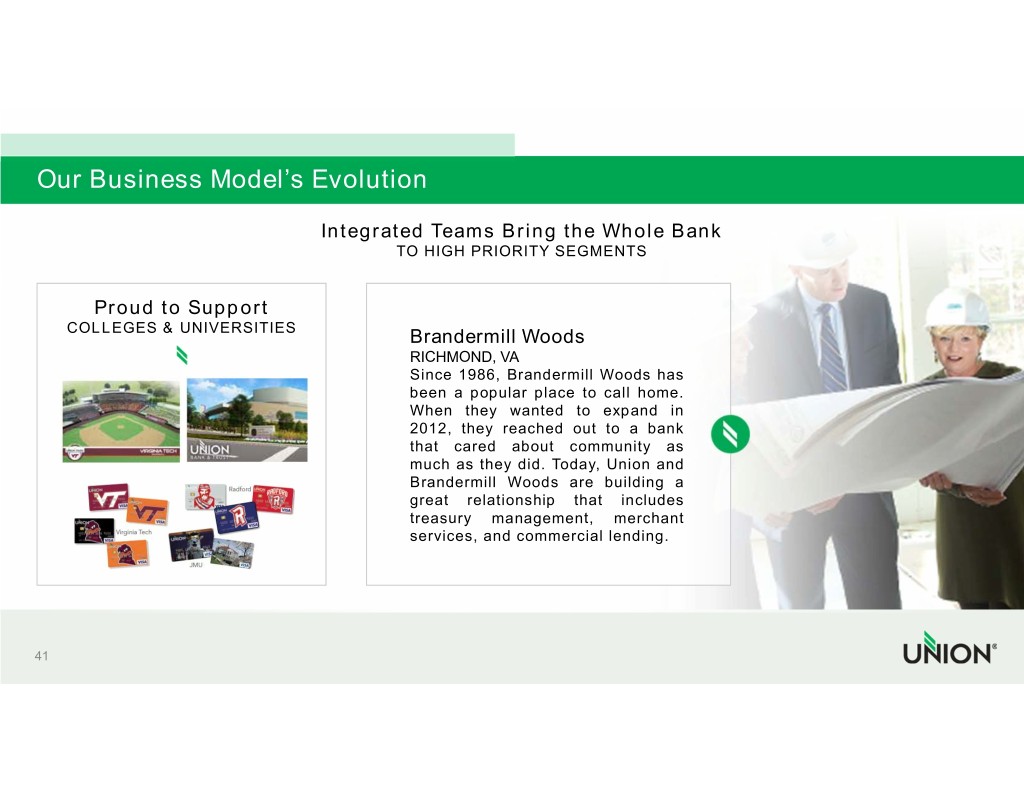
 
 
Our Business Model’s Evolution                                       Integrated Teams Bring the Whole Bank                                                TO HIGH PRIORITY SEGMENTS          Proud to Support     COLLEGES & UNIVERSITIES                     Brandermill Woods                                                 RICHMOND, VA                                                 Since 1986, Brandermill Woods has                                                 been a popular place to call home.                                                 When   they  wanted   to expand   in                                                 2012, they reached   out to  a bank                                                 that  cared  about   community   as                                                 much as they did. Today, Union and                                                 Brandermill Woods    are building a                                                 great   relationship that   includes                                                 treasury   management,     merchant                                                 services, and commercial lending.   41 
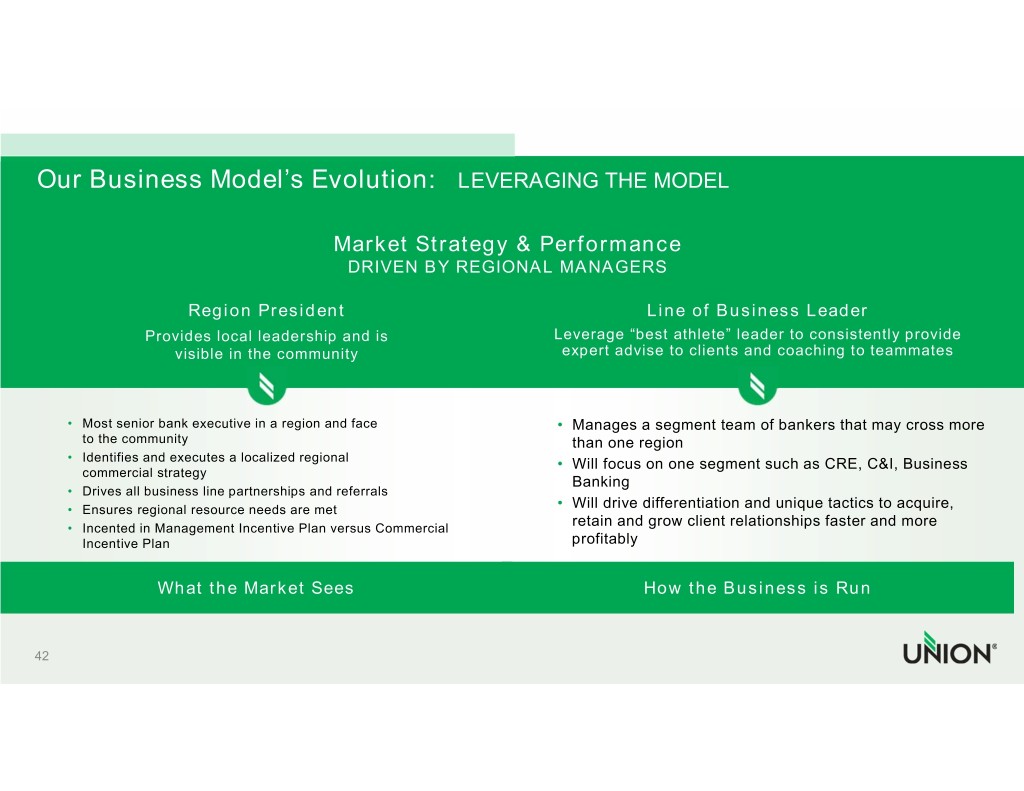
 
 
Our Business Model’s Evolution:   LEVERAGING THE MODEL                                        Market Strategy & Performance                                         DRIVEN BY REGIONAL MANAGERS                      Region President                                           Line of Business Leader               Provides local leadership and is                     Leverage “best athlete” leader to consistently provide                    visible in the community                          expert advise to clients and coaching to teammates       • Most senior bank executive in a region and face              • Manages a segment team of bankers that may cross more        to the community                                               than one region     • Identifies and executes a localized regional                 • Will focus on one segment such as CRE, C&I, Business        commercial strategy                                                                      Banking     • Drives all business line partnerships and referrals     • Ensures regional resource needs are met                      • Will drive differentiation and unique tactics to acquire,      • Incented in Management Incentive Plan versus Commercial        retain and grow client relationships faster and more        Incentive Plan                                                 profitably                  What the Market Sees                                          How the Business is Run   42 
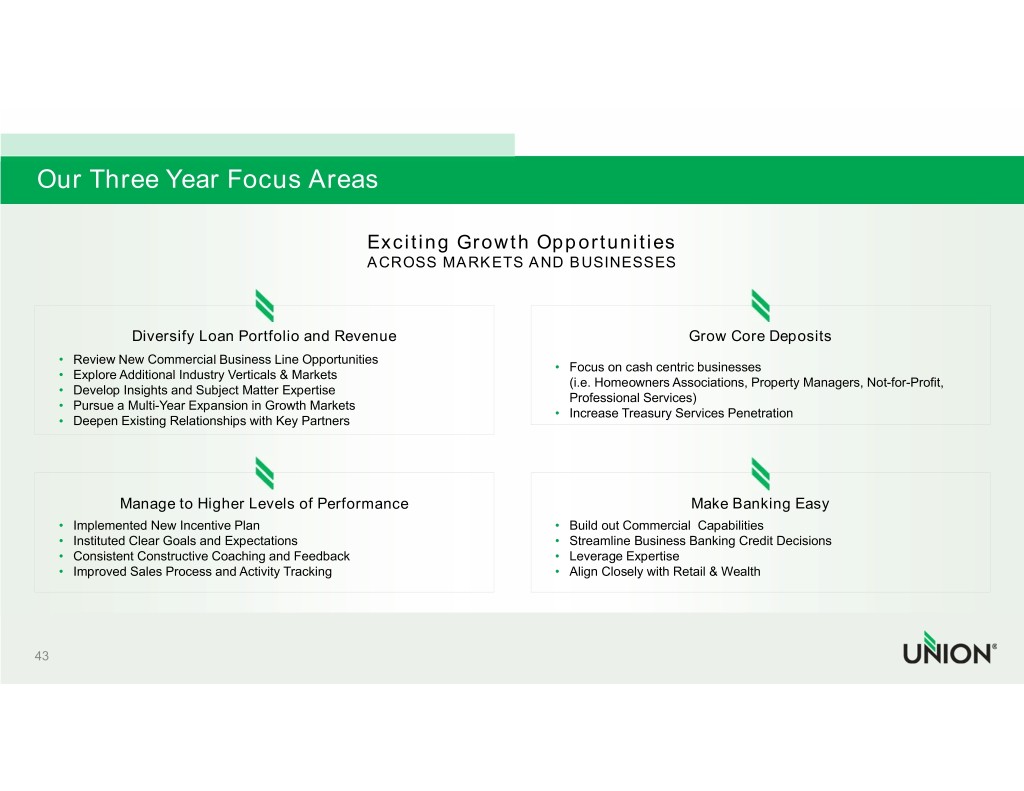
 
 
Our Three Year Focus Areas                                                        Exciting Growth Opportunities                                                        ACROSS MARKETS AND BUSINESSES                   Diversify Loan Portfolio and Revenue                                                     Grow Core Deposits     • Review New Commercial Business Line Opportunities                                                                                     • Focus on cash centric businesses     • Explore Additional Industry Verticals & Markets                                                                                       (i.e. Homeowners Associations, Property Managers, Not-for-Profit,      • Develop Insights and Subject Matter Expertise                                                                                       Professional Services)     • Pursue a Multi-Year Expansion in Growth Markets                                                                                     • Increase Treasury Services Penetration     • Deepen Existing Relationships with Key Partners                 Manage to Higher Levels of Performance                                                      Make Banking Easy     • Implemented New Incentive Plan                                                • Build out Commercial  Capabilities     • Instituted Clear Goals and Expectations                                       • Streamline Business Banking Credit Decisions     • Consistent Constructive Coaching and Feedback                                 • Leverage Expertise     • Improved Sales Process and Activity Tracking                                  • Align Closely with Retail & Wealth   43 

 
 
                  Bob Martin PRESIDENT OF THE WEALTH MANAGEMENT DIVISION 
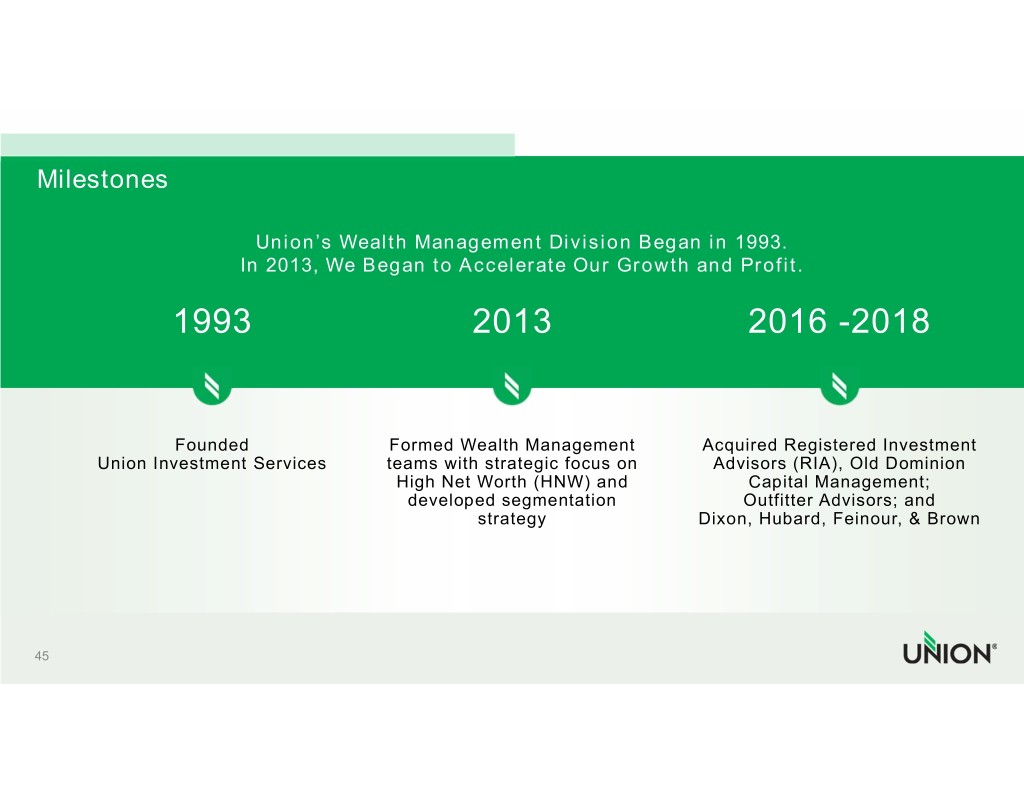
 
 
Milestones                          Union’s Wealth Management Division Began in 1993.                       In 2013, We Began to Accelerate Our Growth and Profit.                1993                            2013                          2016 -2018                  Founded                Formed Wealth Management          Acquired Registered Investment         Union Investment Services      teams with strategic focus on      Advisors (RIA), Old Dominion                                         High Net Worth (HNW) and              Capital Management;                                         developed segmentation              Outfitter Advisors; and                                                 strategy               Dixon, Hubard, Feinour, & Brown   45 
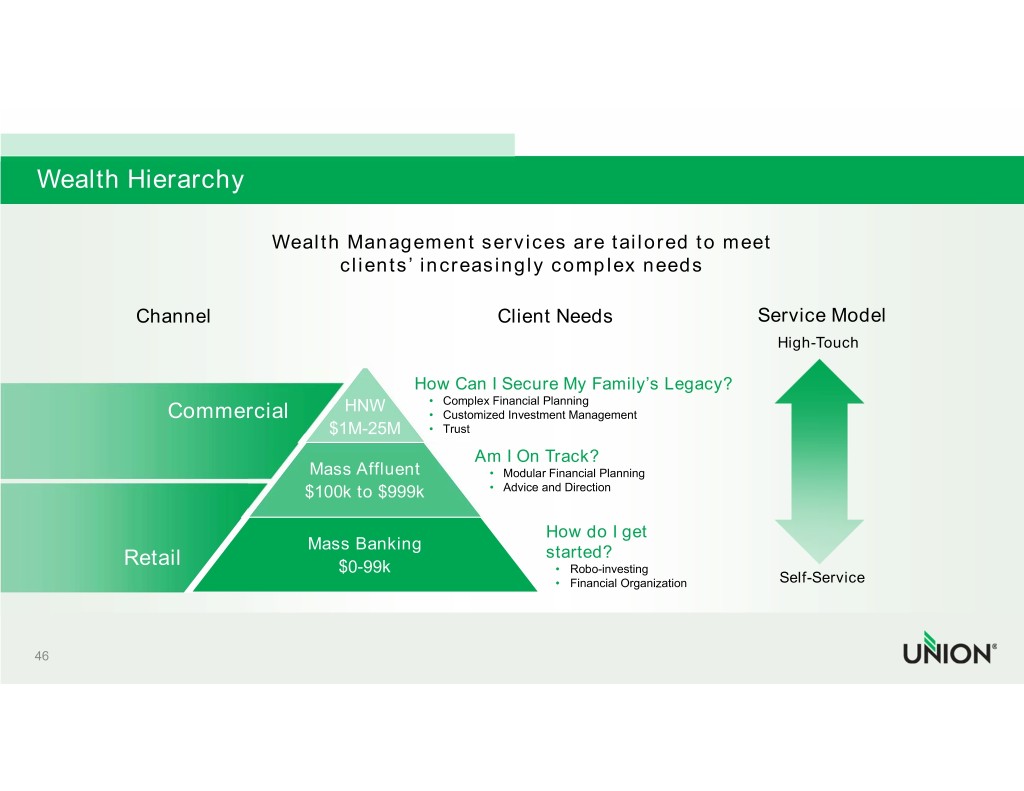
 
 
Wealth Hierarchy                                        Wealth Management services are tailored to meet                                                  clients’ increasingly complex needs                   Channel                                                    Client Needs                              Service Model                                                                                                                         High-Touch                                                               How Can I Secure My Family’s Legacy?                                                   HNW           • Complex Financial Planning                      Commercial                                 • Customized Investment Management                                                $1M-25M          • Trust                                                                        Am I On Track?                                             Mass Affluent                •  Modular Financial Planning                                             $100k to $999k               •  Advice and Direction                                                                                    How do I get                                              Mass Banking               Retail                                                              started?                                                  $0-99k                             • Robo-investing                                                                                     • Financial Organization            Self-Service   46 
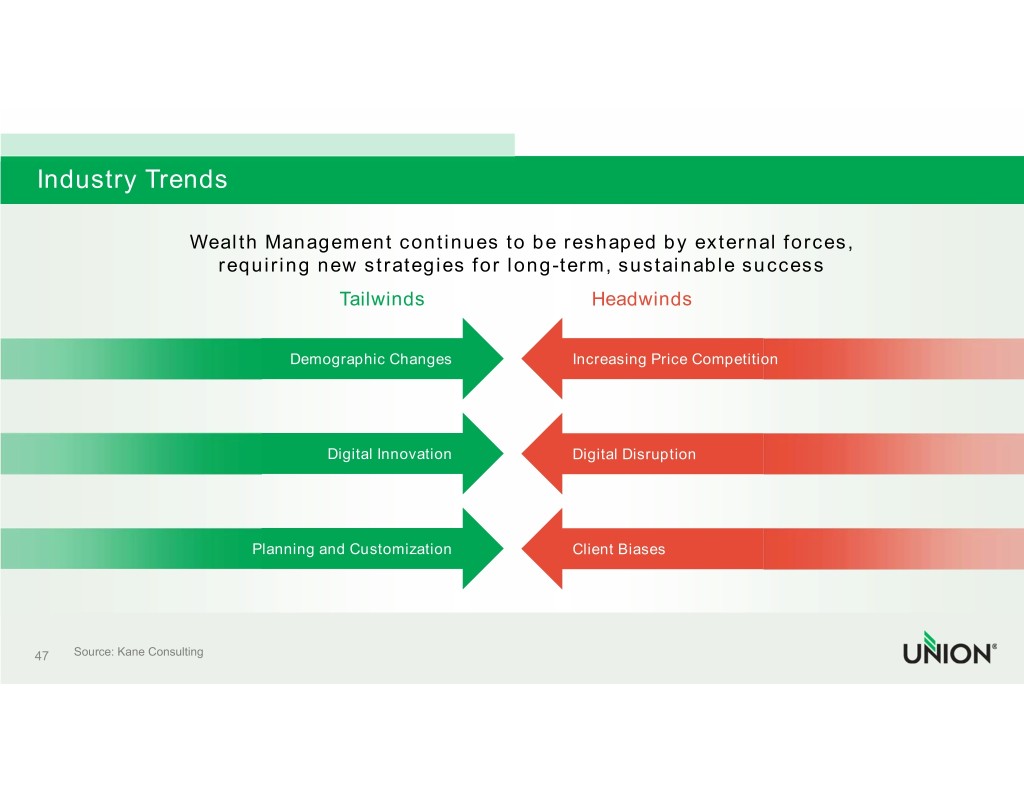
 
 
Industry Trends                 Wealth Management continues to be reshaped by external forces,                   requiring new strategies for long-term, sustainable success                               Tailwinds                Headwinds                           Demographic Changes         Increasing Price Competition                                Digital Innovation      Digital Disruption                        Planning and Customization      Client Biases   47  Source: Kane Consulting 
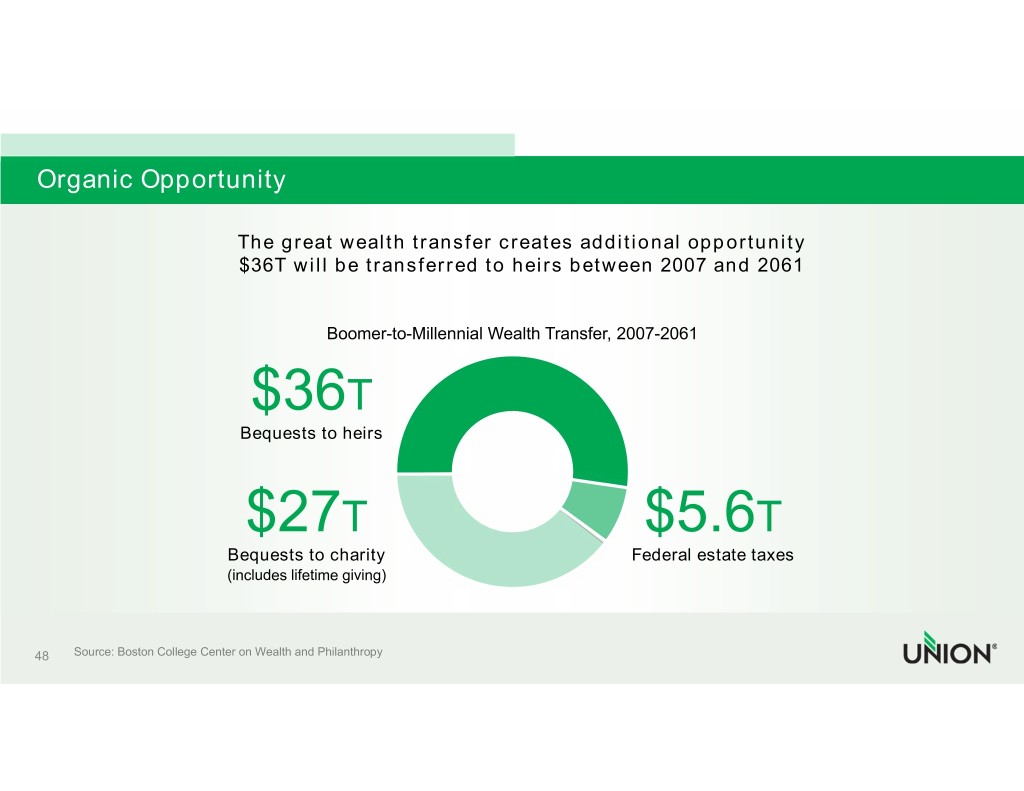
 
 
Organic Opportunity                      The great wealth transfer creates additional opportunity                     $36T will be transferred to heirs between 2007 and 2061                               Boomer-to-Millennial Wealth Transfer, 2007-2061                      $36T                     Bequests to heirs                       $27T                                   $5.6T                    Bequests to charity                     Federal estate taxes                    (includes lifetime giving)   48  Source: Boston College Center on Wealth and Philanthropy 
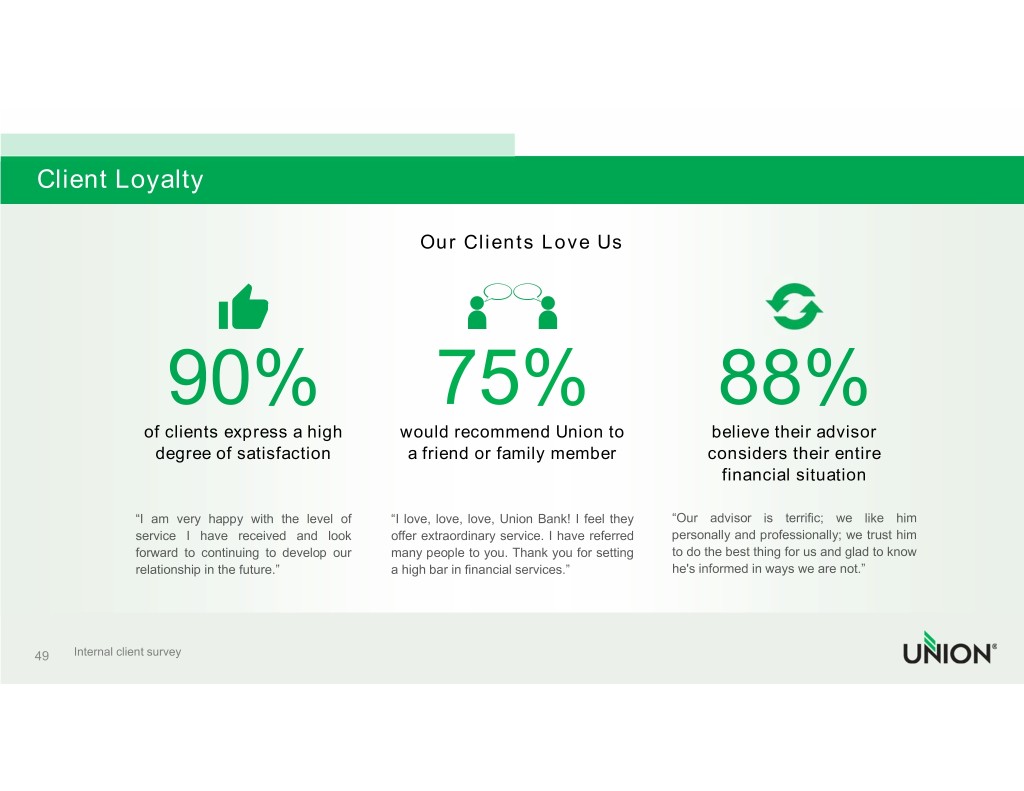
 
 
Client Loyalty                                                                Our Clients Love Us                       90%                                         75%                                          88%                   of clients express a high                would recommend Union to                          believe their advisor                     degree of satisfaction                   a friend or family member                       considers their entire                                                                                                                 financial situation                  “I am  very happy with the level of      “I love, love, love, Union Bank! I feel they  “Our  advisor is  terrific; we like him                 service I have   received and  look      offer extraordinary service. I have referred  personally and professionally; we trust him                 forward to continuing to develop our     many people to you. Thank you for setting     to do the best thing for us and glad to know                 relationship in the future.”             a high bar in financial services.”            he's informed in ways we are not.”   49    Internal client survey 
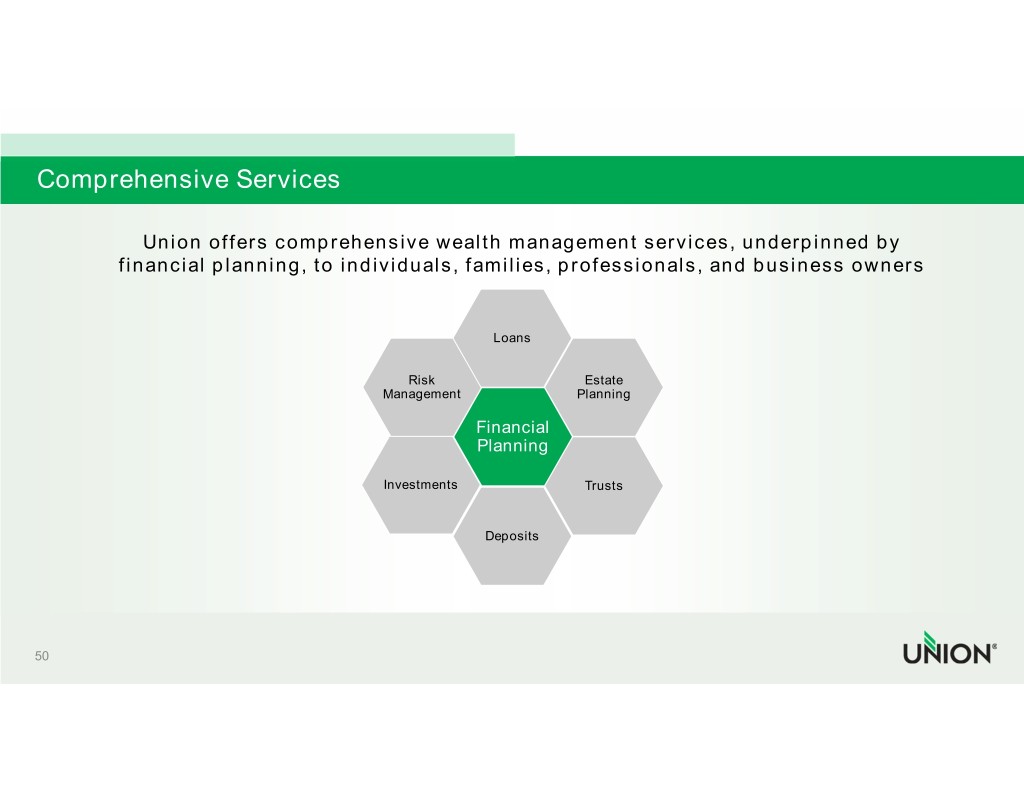
 
 
Comprehensive Services             Union offers comprehensive wealth management services, underpinned by          financial planning, to individuals, families, professionals, and business owners                                                Loans                                       Risk             Estate                                   Management          Planning                                              Financial                                              Planning                                    Investments         Trusts                                               Deposits   50 
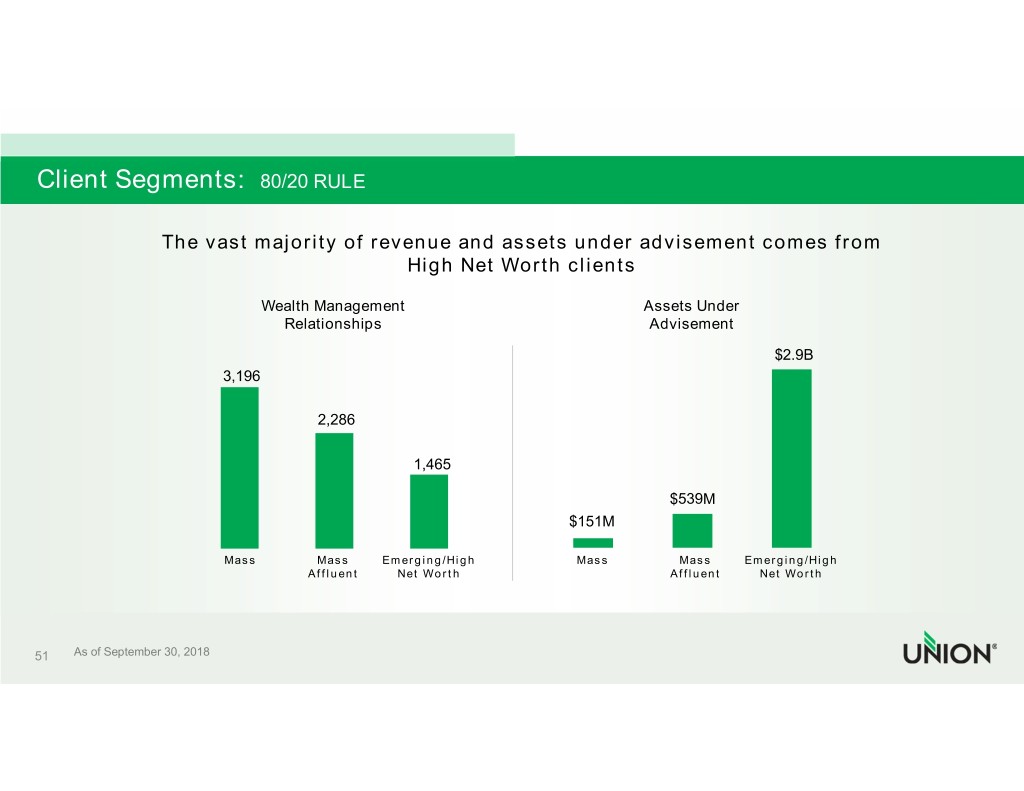
 
 
Client Segments:  80/20 RULE                         The vast majority of revenue and assets under advisement comes from                                                                      High Net Worth clients                                            Wealth Management                                                     Assets Under                                                Relationships                                                      Advisement                                                                                                                                          $2.9B                                   3,196                                                       2,286                                                                         1,465                                                                                                                        $539M                                                                                                   $151M                                     MassMass                     Emerging/High                       MassMass                       Emerging/High                                                   Affluent         Net Worth                                         Affluent        Net Worth   51     As of September 30, 2018 
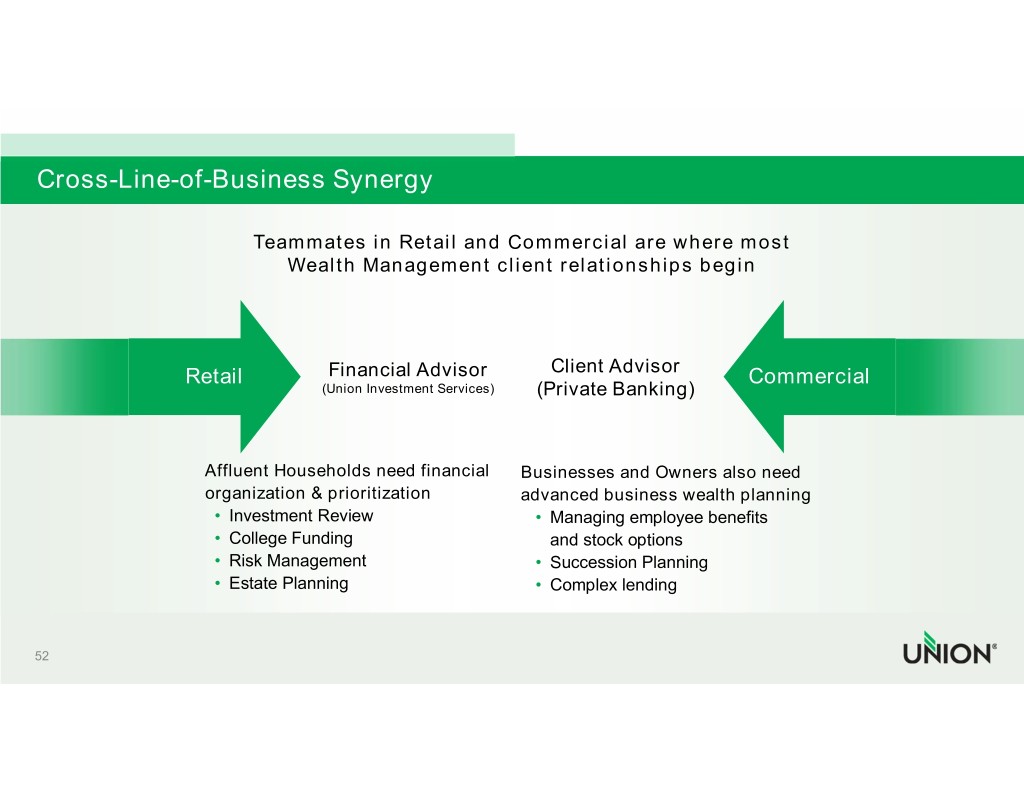
 
 
Cross-Line-of-Business Synergy                          Teammates in Retail and Commercial are where most                            Wealth Management client relationships begin                   Retail          Financial Advisor       Client Advisor       Commercial                                (Union Investment Services) (Private Banking)                     Affluent Households need financial Businesses and Owners also need                    organization & prioritization     advanced business wealth planning                    • Investment Review                • Managing employee benefits                    • College Funding                    and stock options                    • Risk Management                  • Succession Planning                    • Estate Planning                  • Complex lending   52 
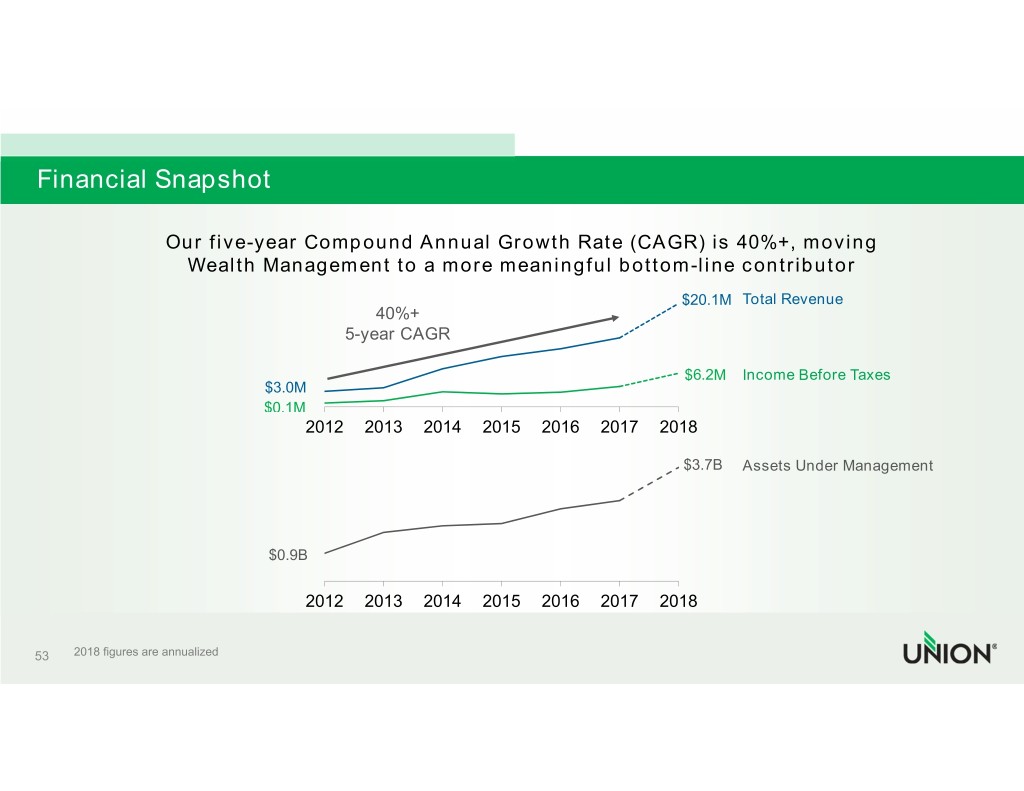
 
 
Financial Snapshot               Our five-year Compound Annual Growth Rate (CAGR) is 40%+, moving                 Wealth Management to a more meaningful bottom-line contributor                                                                  $20.1M Total Revenue                                   40%+                                 5-year CAGR                                                                  $6.2M Income Before Taxes                        $3.0M                        $0.1M                            2012  2013 2014  2015  2016  2017  2018                                                                  $3.7B Assets Under Management                          $0.9B                             2012  2013 2014  2015  2016  2017  2018   53  2018 figures are annualized 
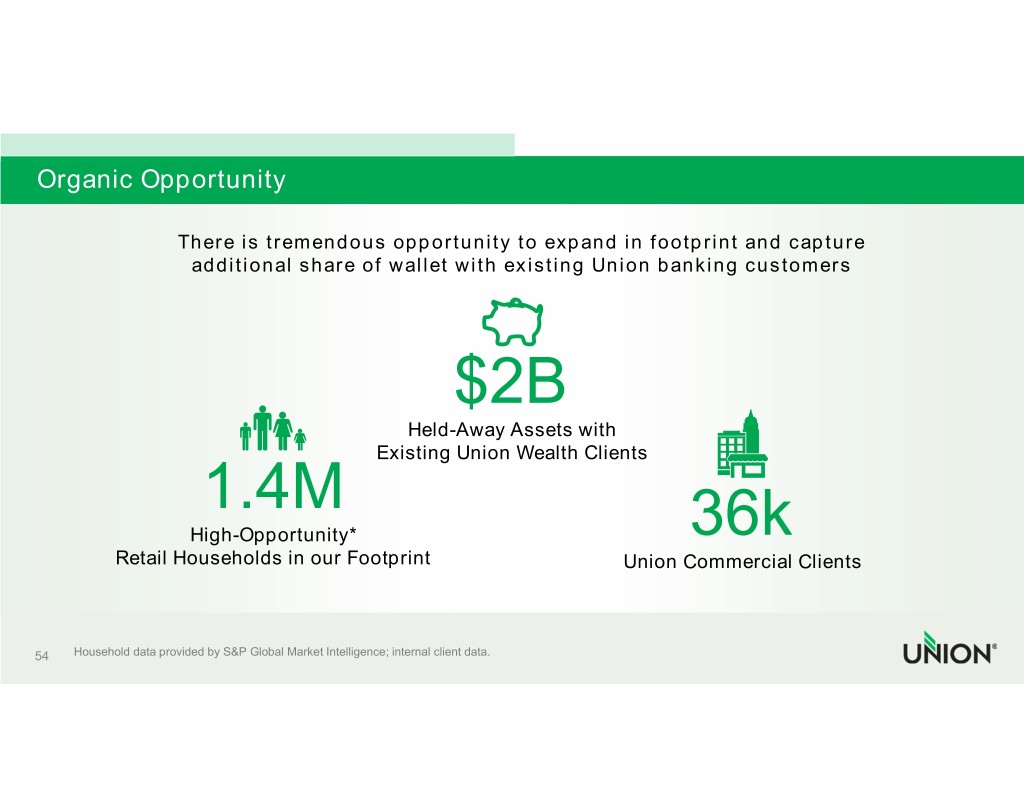
 
 
Organic Opportunity                There is tremendous opportunity to expand in footprint and capture                 additional share of wallet with existing Union banking customers                                           $2B                                      Held-Away Assets with                                    Existing Union Wealth Clients                  1.4M                High-Opportunity*                                 36k         Retail Households in our Footprint                Union Commercial Clients   54  Household data provided by S&P Global Market Intelligence; internal client data. 
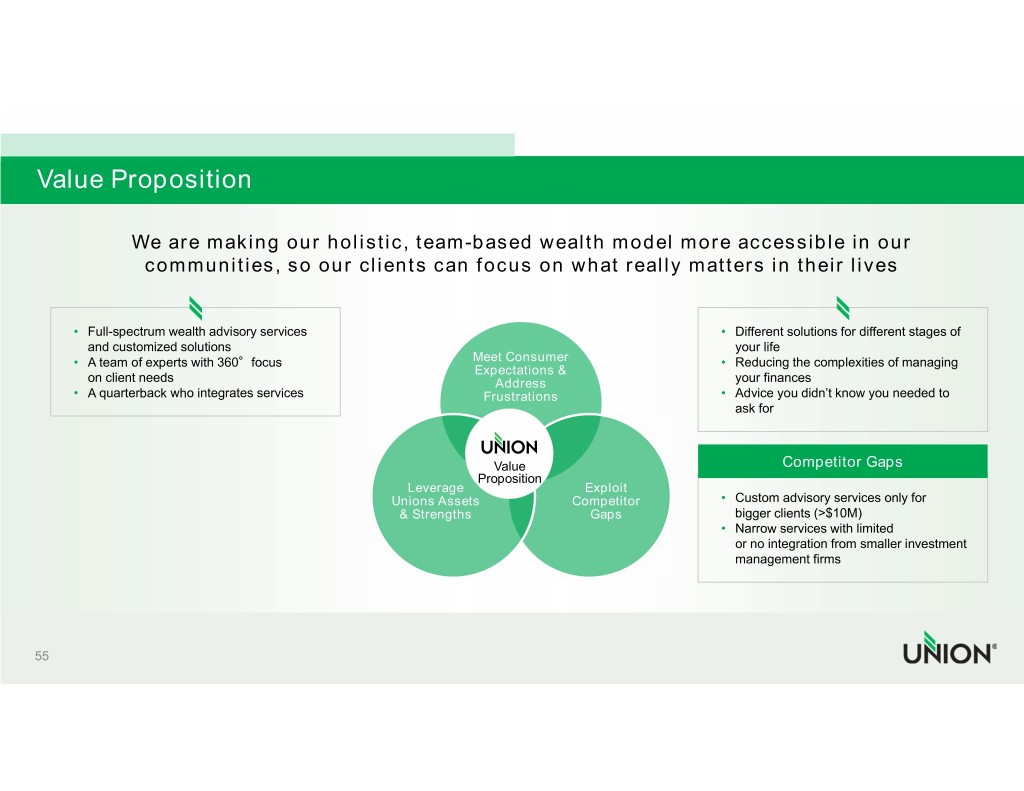
 
 
Value Proposition                  We are making our holistic, team-based wealth model more accessible in our                    communities, so our clients can focus on what really matters in their lives         •  Full-spectrum wealth advisory services                                                                • Different solutions for different stages of           and customized solutions                                                                                your life       •  A team of experts with 360°focus                              Meet Consumer                           • Reducing the complexities of managing                                                                         Expectations &           on client needs                                                  Address                                your finances       •  A quarterback who integrates services                          Frustrations                           • Advice you didn’t know you needed to                                                                                                                   ask for                                                                             Value                                         Competitor Gaps                                                                        Proposition                                                             Leverage                     Exploit                                                            Unions Assets                Competitor              • Custom advisory services only for                                                            & Strengths                    Gaps                   bigger clients (>$10M)                                                                                                                • Narrow services with limited                                                                                                                  or no integration from smaller investment                                                                                                                   management firms   55 
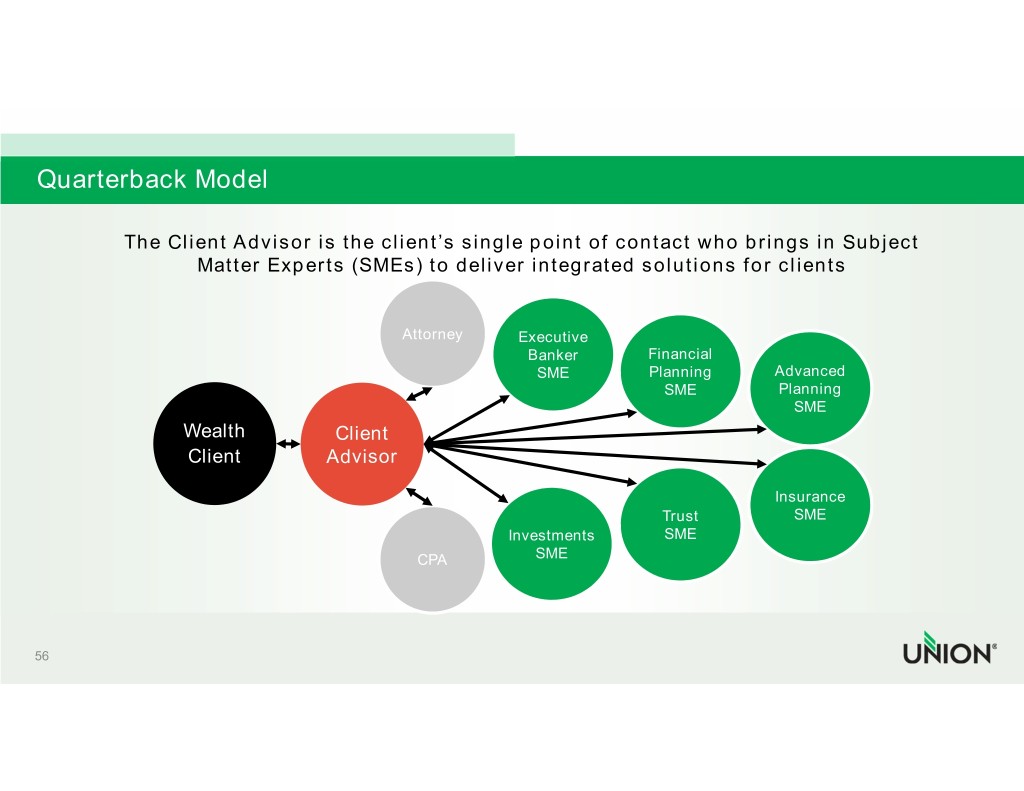
 
 
Quarterback Model           The Client Advisor is the client’s single point of contact who brings in Subject                  Matter Experts (SMEs) to deliver integrated solutions for clients                                       Attorney    Executive                                                   Banker      Financial                                                    SME        Planning    Advanced                                                                SME         Planning                                                                             SME                Wealth         Client                 Client        Advisor                                                                           Insurance                                                               Trust        SME                                                Investments    SME                                       CPA         SME   56 
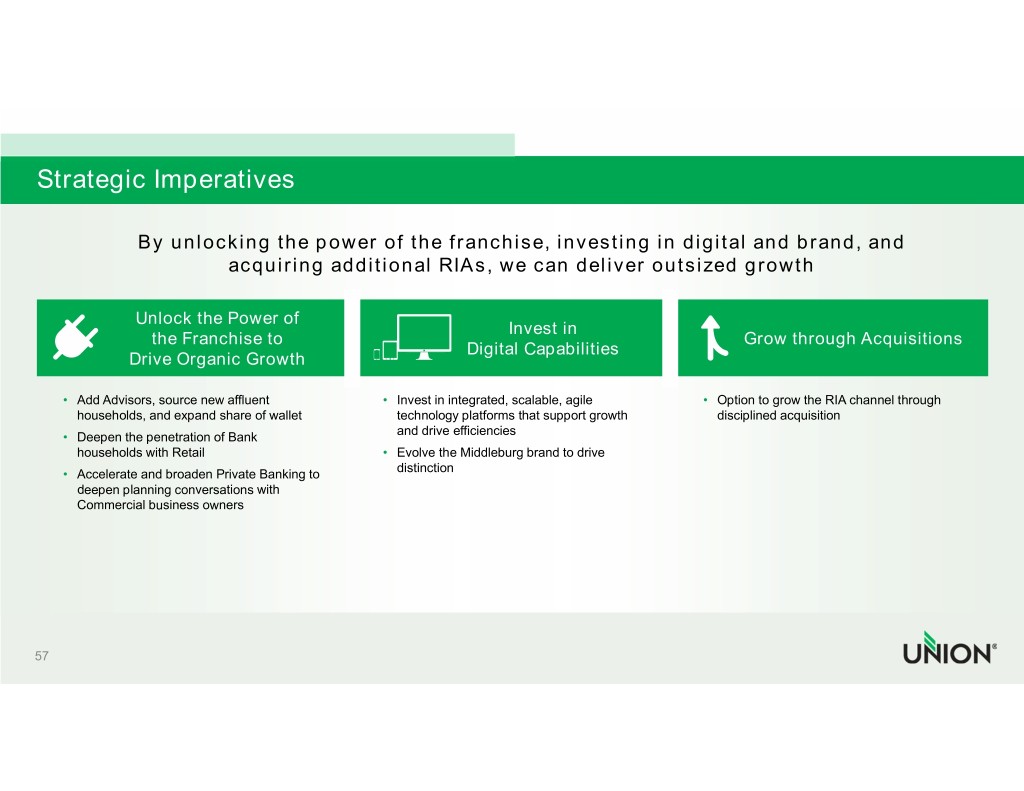
 
 
Strategic Imperatives                   By unlocking the power of the franchise, investing in digital and brand, and                                 acquiring additional RIAs, we can deliver outsized growth                  Unlock the Power of                                                                             Invest in                    the Franchise to                                                                               Grow through Acquisitions                                                                       Digital Capabilities                Drive Organic Growth       • Add Advisors, source new affluent                • Invest in integrated, scalable, agile             • Option to grow the RIA channel through         households, and expand share of wallet             technology platforms that support growth            disciplined acquisition                                                           and drive efficiencies      • Deepen the penetration of Bank         households with Retail                           • Evolve the Middleburg brand to drive       • Accelerate and broaden Private Banking to          distinction        deepen planning conversations with         Commercial business owners   57 
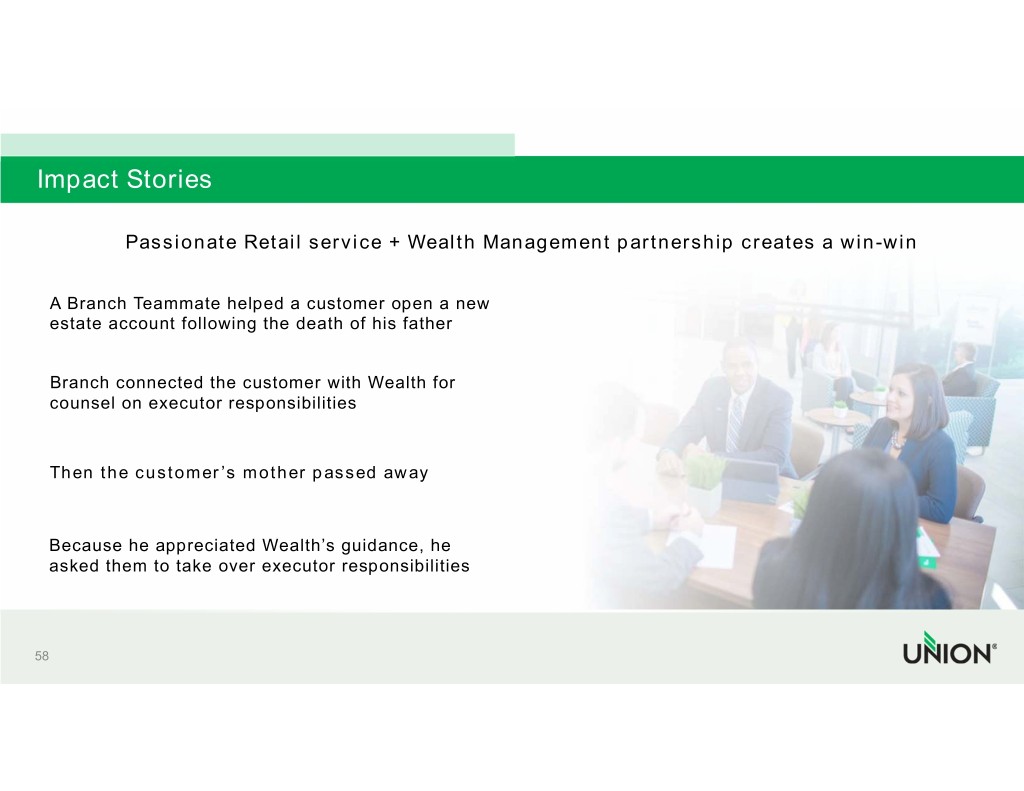
 
 
Impact Stories            Passionate Retail service + Wealth Management partnership creates a win-win    A Branch Teammate helped a customer open a new    estate account following the death of his father    Branch connected the customer with Wealth for    counsel on executor responsibilities     Then the customer’s mother passed away     Because he appreciated Wealth’s guidance, he    asked them to take over executor responsibilities   58 
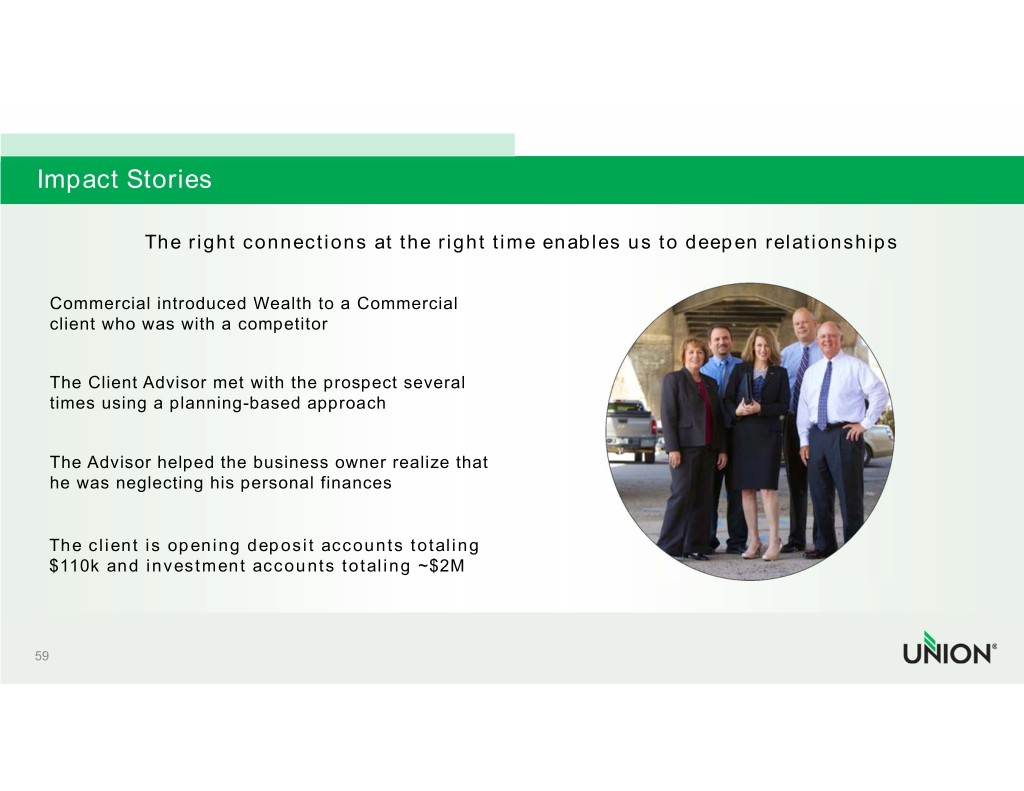
 
 
Impact Stories              The right connections at the right time enables us to deepen relationships    Commercial introduced Wealth to a Commercial    client who was with a competitor    The Client Advisor met with the prospect several    times using a planning-based approach    The Advisor helped the business owner realize that    he was neglecting his personal finances    The client is opening deposit accounts totaling    $110k and investment accounts totaling ~$2M   59 

 
 
      Maria Tedesco PRESIDENT UNION BANK & TRUST 
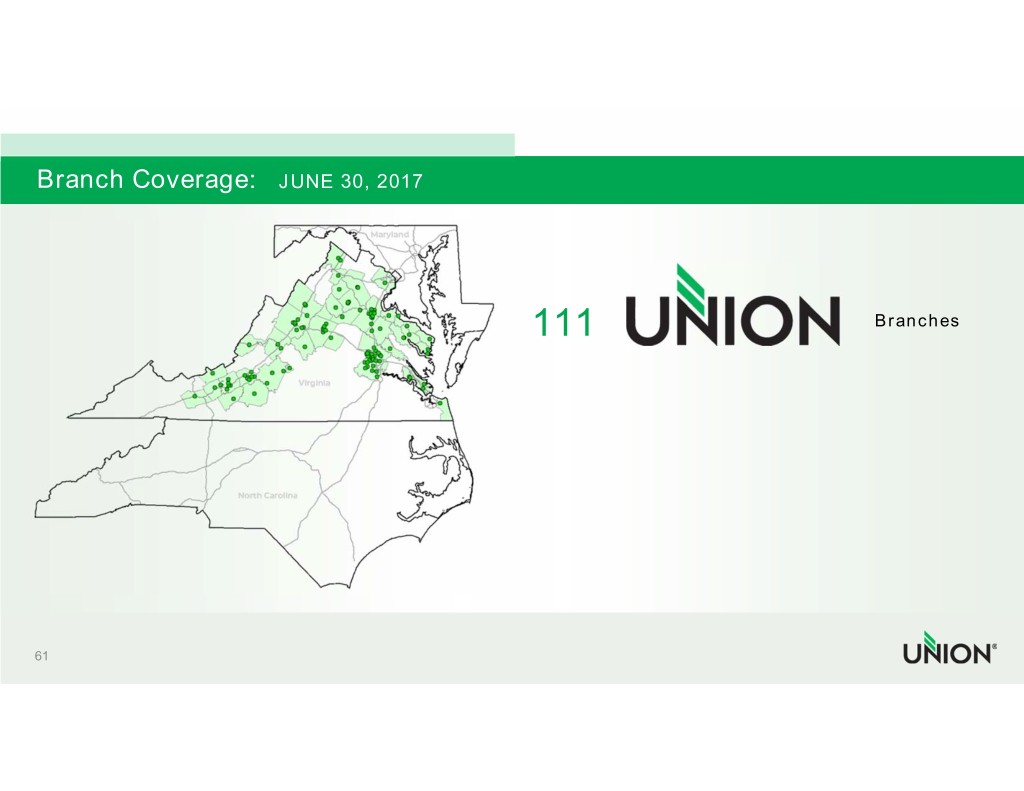
 
 
Branch Coverage:   JUNE 30, 2017                                       111                     Branches   61 
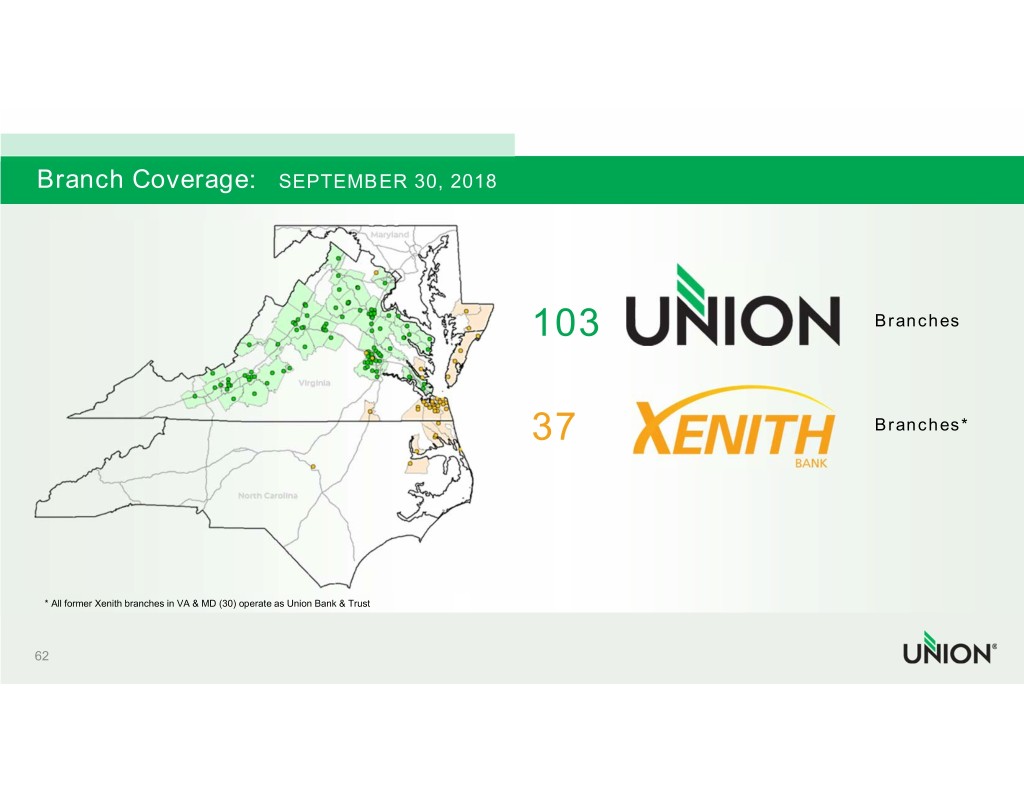
 
 
Branch Coverage:   SEPTEMBER 30, 2018                                                                                                              103                                                                      Branches                                                                                                             37                                                                       Branches*     * All former Xenith branches in VA & MD (30) operate as Union Bank & Trust   62 
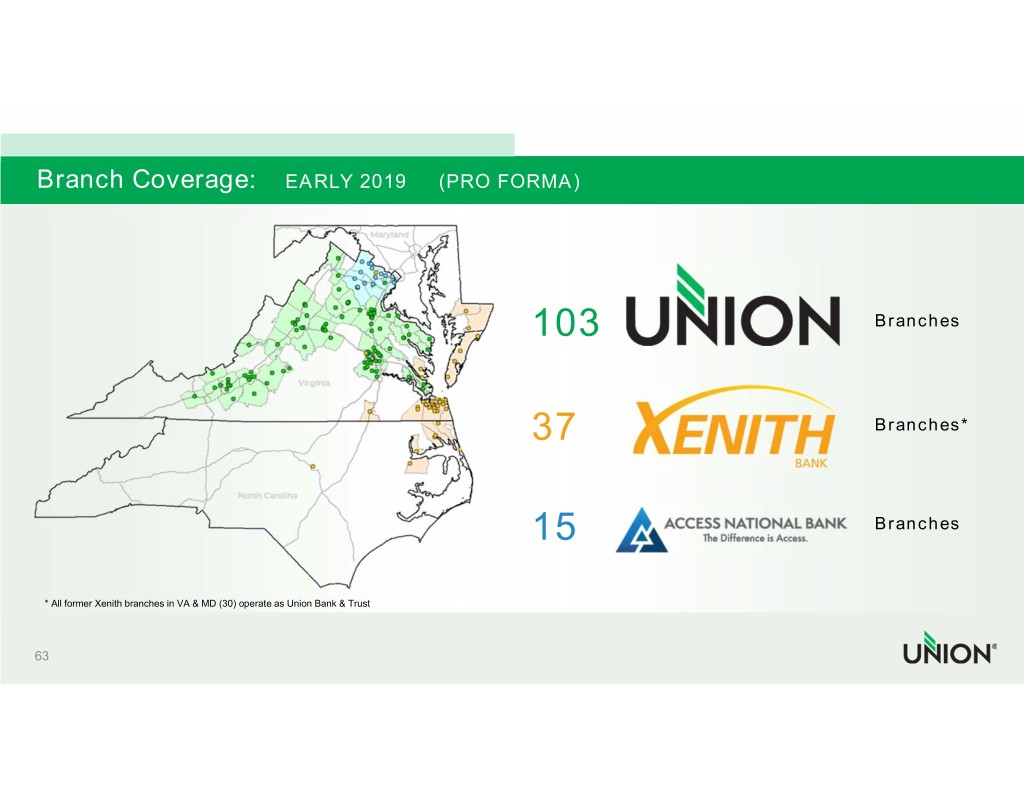
 
 
Branch Coverage:                                      EARLY 2019     (PRO FORMA)                                                                                                              103                                                                      Branches                                                                                                             37                                                                       Branches*                                                                                                             15                                                                       Branches     * All former Xenith branches in VA & MD (30) operate as Union Bank & Trust   63 
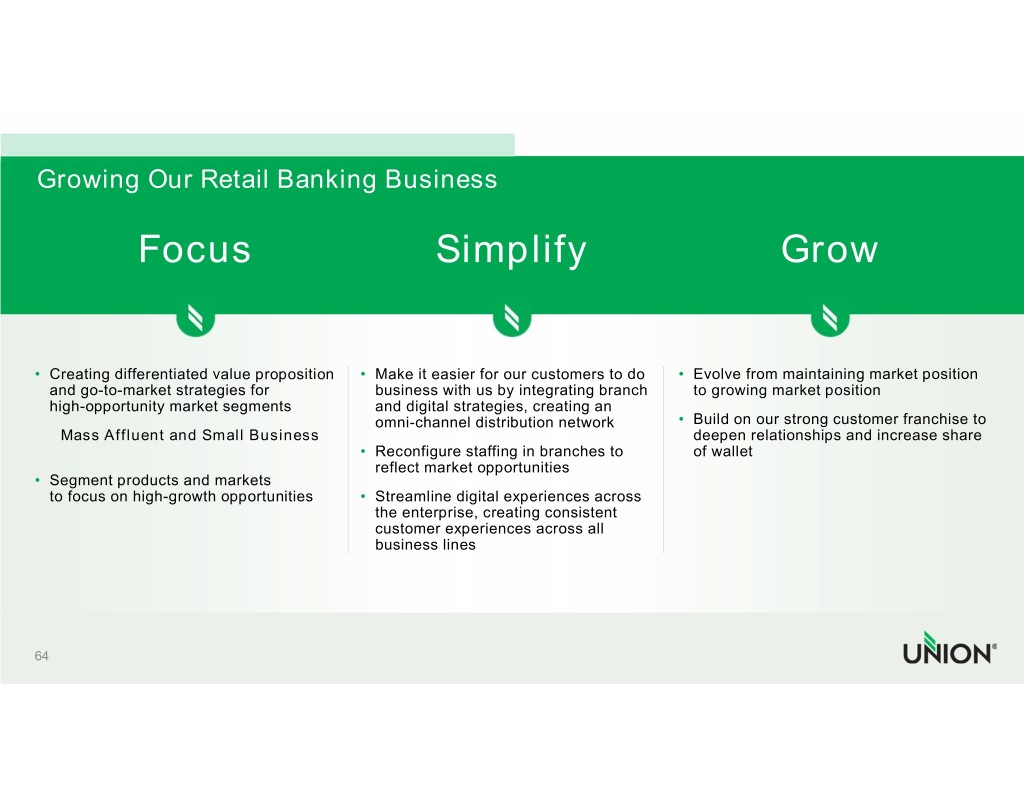
 
 
Growing Our Retail Banking Business               Focus                                  Simplify                                    Grow   • Creating differentiated value proposition • Make it easier for our customers to do • Evolve from maintaining market position    and go-to-market strategies for           business with us by integrating branch   to growing market position   high-opportunity market segments          and digital strategies, creating an                                             omni-channel distribution network      • Build on our strong customer franchise to     Mass Affluent and Small Business                                                  deepen relationships and increase share                                            • Reconfigure staffing in branches to      of wallet                                             reflect market opportunities • Segment products and markets   to focus on high-growth opportunities   • Streamline digital experiences across                                              the enterprise, creating consistent                                              customer experiences across all                                              business lines   64 
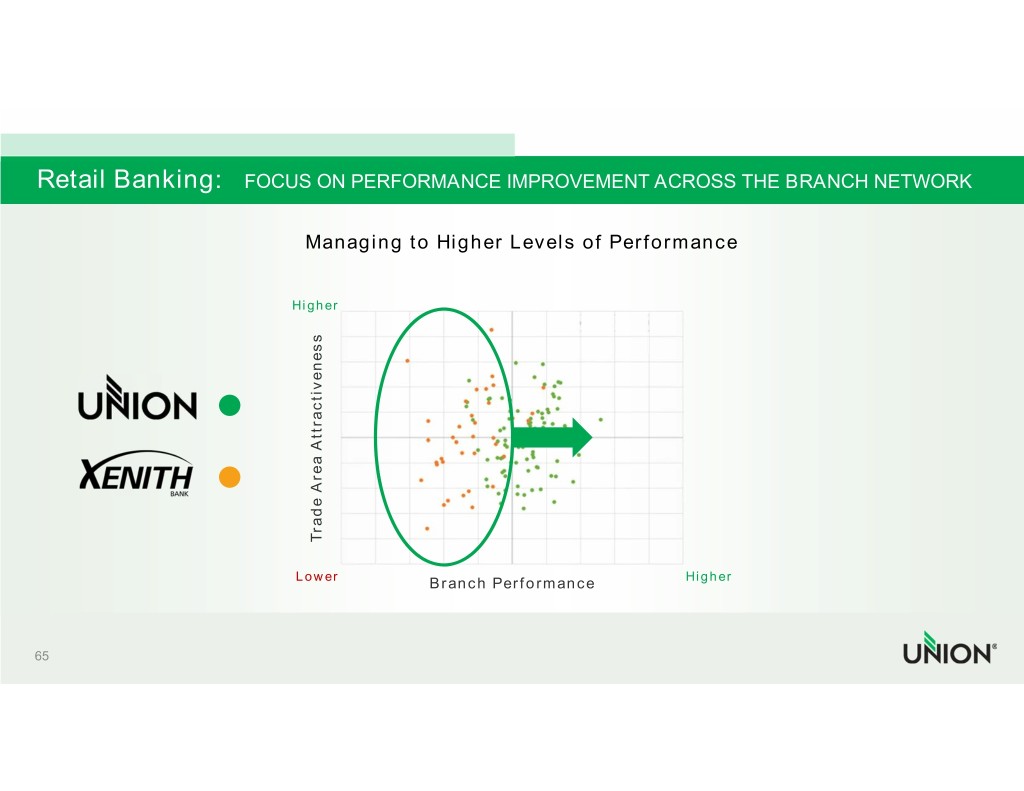
 
 
Retail Banking:   FOCUS ON PERFORMANCE IMPROVEMENT ACROSS THE BRANCH NETWORK                             Managing to Higher Levels of Performance                            Higher                             Trade Area Attractiveness Trade                            Lower        Branch Performance       Higher   65 
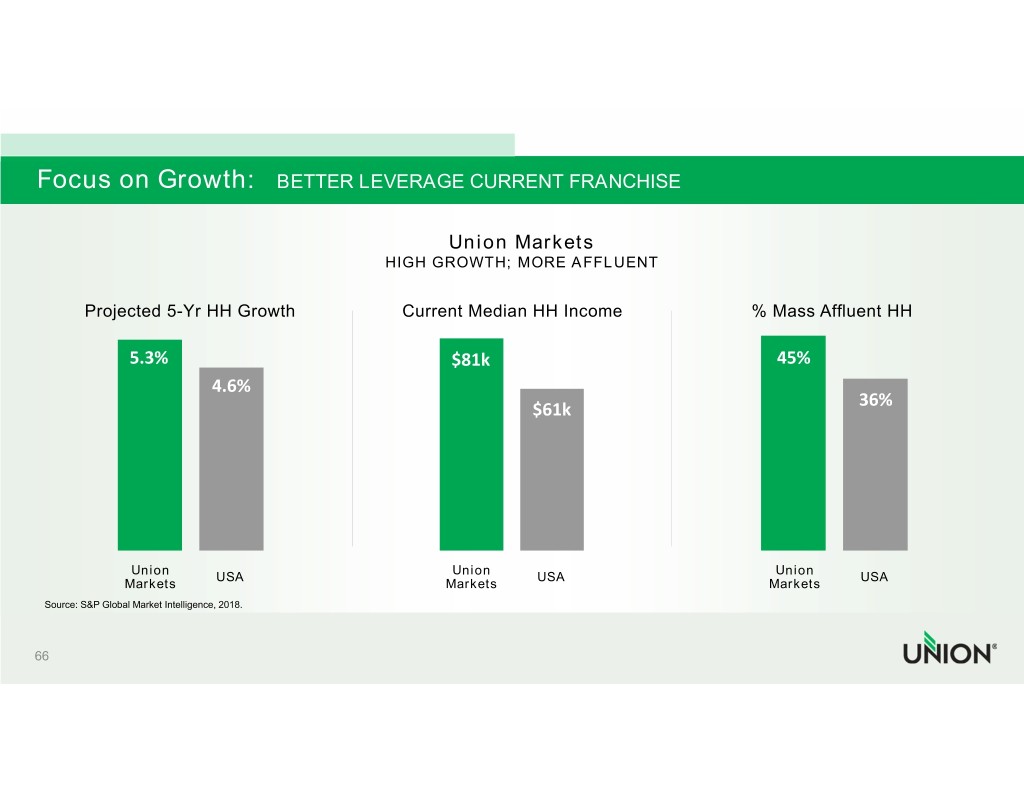
 
 
Focus on Growth:   BETTER LEVERAGE CURRENT FRANCHISE                                               Union Markets                                       HIGH GROWTH; MORE AFFLUENT        Projected 5-Yr HH Growth          Current Median HH Income             % Mass Affluent HH            5.3%                               $81k                               45%                    4.6%                                                                                          36%                                                       $61k              Union                             Union                              Union                      USA                               USA                                USA           Markets                           Markets                            Markets  Source: S&P Global Market Intelligence, 2018.   66 
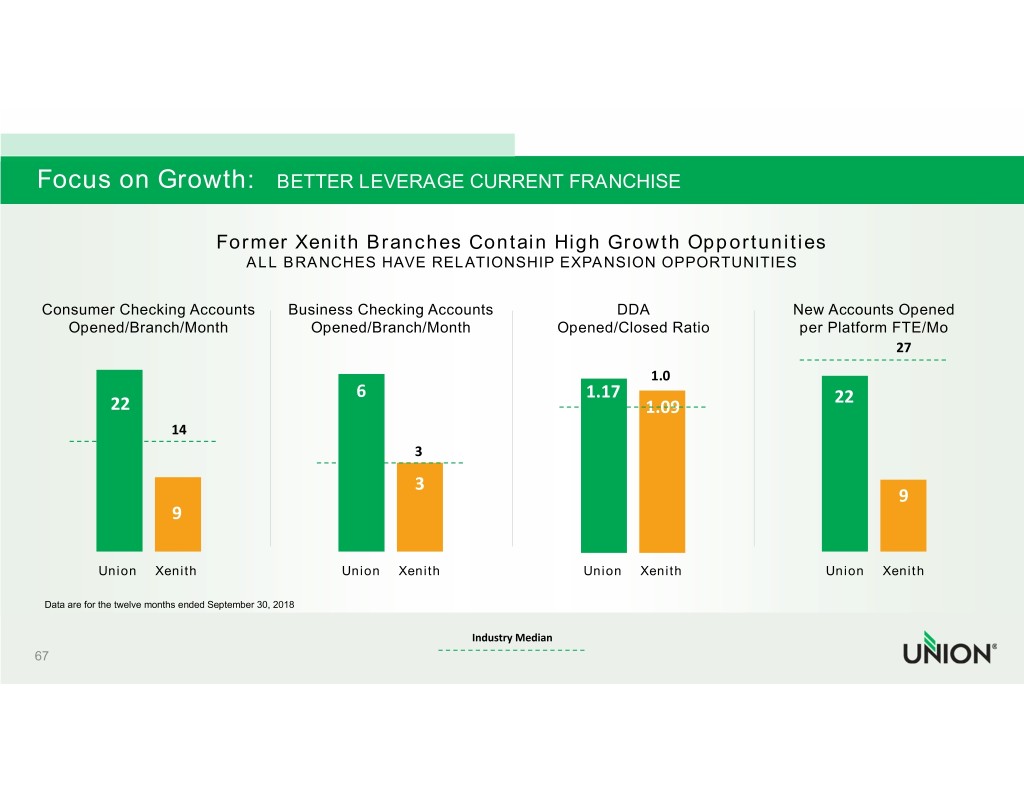
 
 
Focus on Growth:   BETTER LEVERAGE CURRENT FRANCHISE                         Former Xenith Branches Contain High Growth Opportunities                            ALL BRANCHES HAVE RELATIONSHIP EXPANSION OPPORTUNITIES   Consumer Checking Accounts      Business Checking Accounts                DDA                    New Accounts Opened     Opened/Branch/Month             Opened/Branch/Month            Opened/Closed Ratio             per Platform FTE/Mo                                                                                                                27                                                                                1.0                                          6                             1.17                            22           22                                                                   1.09                   14                                                  3                                                  3                                                                                                                9                   9           Union  Xenith                   Union  Xenith                  Union  Xenith                  Union  Xenith   Data are for the twelve months ended September 30, 2018                                                          Industry Median 67 
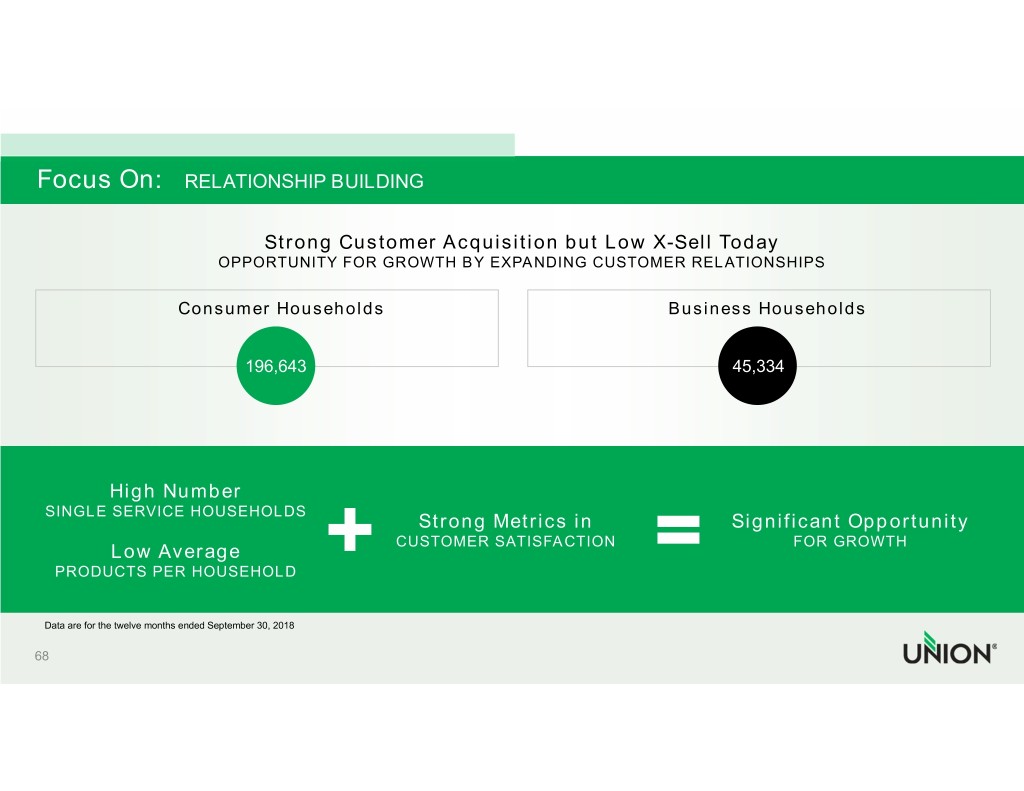
 
 
Focus On:   RELATIONSHIP BUILDING                                Strong Customer Acquisition but Low X-Sell Today                         OPPORTUNITY FOR GROWTH BY EXPANDING CUSTOMER RELATIONSHIPS                     Consumer Households                                             Business Households                             196,643                                                        45,334             High Number  SINGLE SERVICE HOUSEHOLDS                                                  Strong Metrics in                        Significant Opportunity                                               CUSTOMER SATISFACTION                               FOR GROWTH           Low Average    PRODUCTS PER HOUSEHOLD    Data are for the twelve months ended September 30, 2018  68 
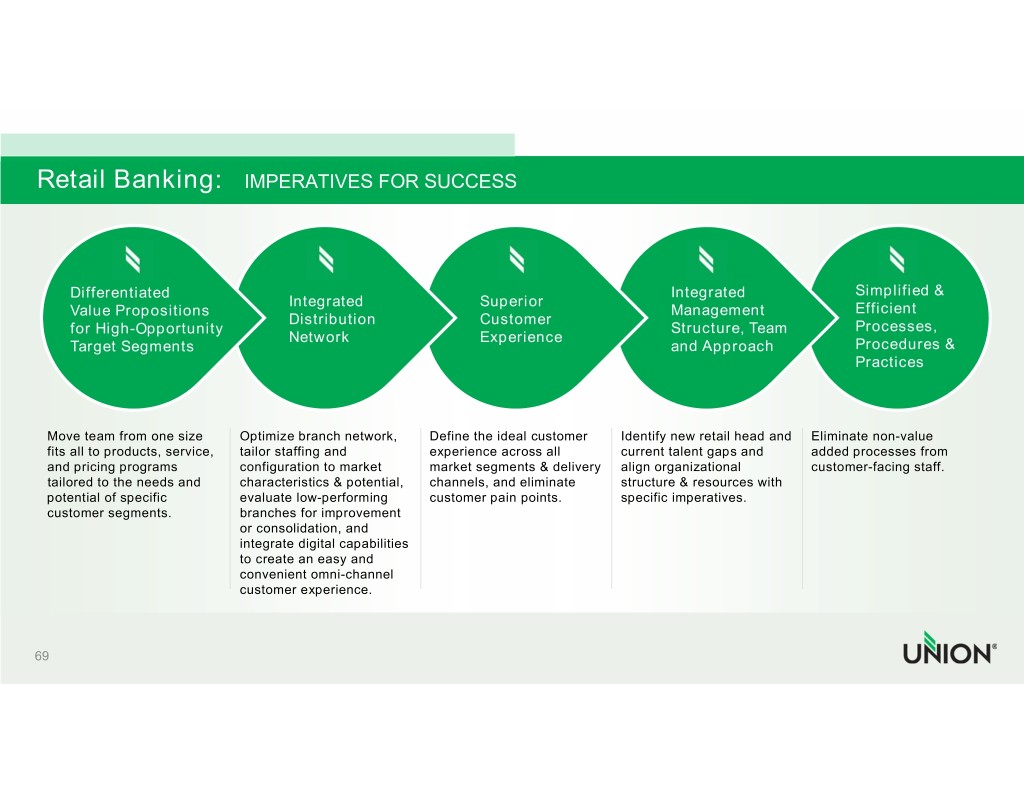
 
 
Retail Banking:   IMPERATIVES FOR SUCCESS         Differentiated                                                                                   Integrated                   Simplified &                                           Integrated                     Superior       Value Propositions                                                                               Management                   Efficient                                          Distribution                   Customer       for High-Opportunity                                                                             Structure, Team              Processes,                                           Network                        Experience       Target Segments                                                                                  and Approach                 Procedures &                                                                                                                                      Practices     Move team from one size        Optimize branch network,       Define the ideal customer     Identify new retail head and   Eliminate non-value   fits all to products, service, tailor staffing and            experience across all         current talent gaps and        added processes from    and pricing programs           configuration to market        market segments & delivery    align organizational           customer-facing staff.   tailored to the needs and      characteristics & potential,   channels, and eliminate       structure & resources with    potential of specific          evaluate low-performing        customer pain points.         specific imperatives.   customer segments.             branches for improvement                                   or consolidation, and                                   integrate digital capabilities                                   to create an easy and                                   convenient omni-channel                                   customer experience.   69 
 
 
                      Dean Brown CHIEF INFORMATION OFFICER & HEAD OF BANK OPERATIONS 
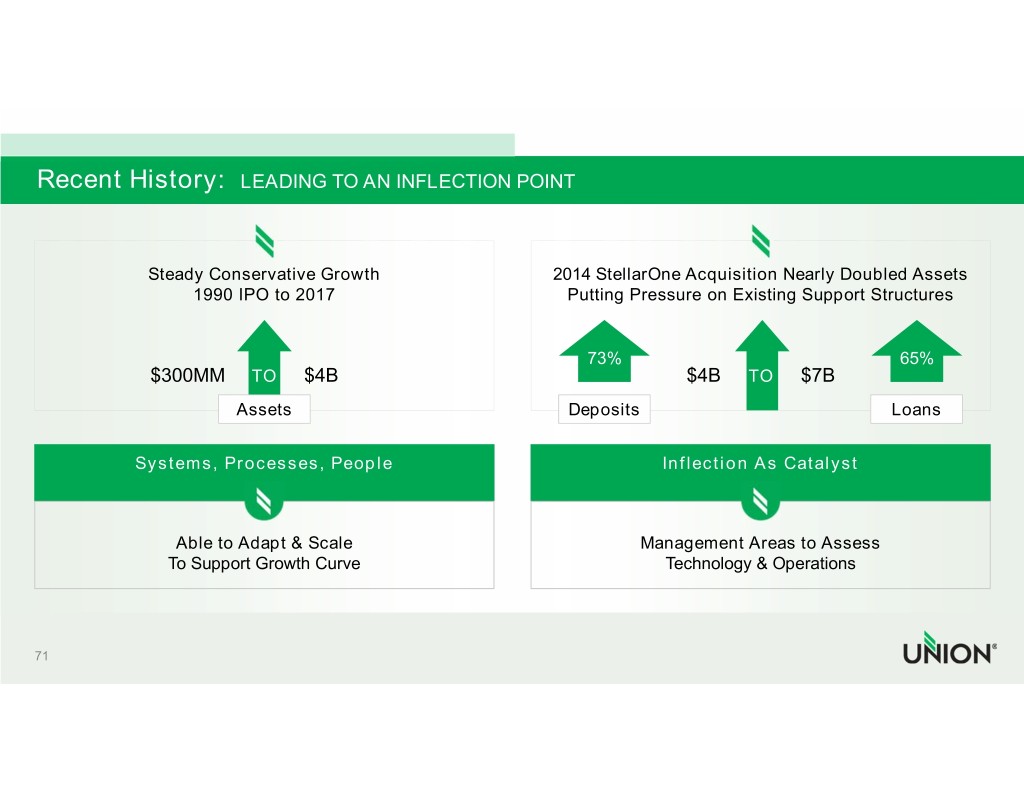
 
 
Recent History:  LEADING TO AN INFLECTION POINT                Steady Conservative Growth                  2014 StellarOne Acquisition Nearly Doubled Assets                  1990 IPO to 2017                        Putting Pressure on Existing Support Structures                                                              73%                              65%              $300MM     TO   $4B                                      $4B     TO  $7B                       Assets                              Deposits                          Loans             Systems, Processes, People                               Inflection As Catalyst                  Able to Adapt & Scale                             Management Areas to Assess               To Support Growth Curve                               Technology & Operations   71 
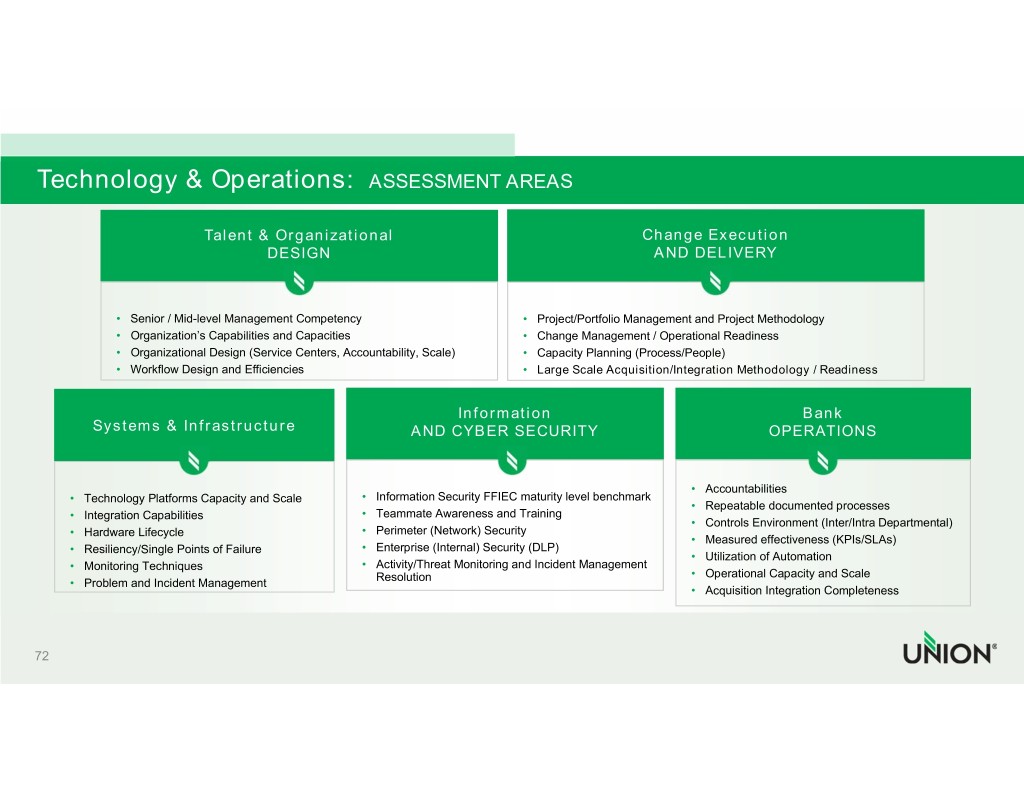
 
 
Technology & Operations:  ASSESSMENT AREAS                             Talent & Organizational                                                Change Execution                                      DESIGN                                                         AND DELIVERY                • Senior / Mid-level Management Competency                        • Project/Portfolio Management and Project Methodology              • Organization’s Capabilities and Capacities                      • Change Management / Operational Readiness              • Organizational Design (Service Centers, Accountability, Scale)  • Capacity Planning (Process/People)              • Workflow Design and Efficiencies                                • Large Scale Acquisition/Integration Methodology / Readiness                                                                      Information                                             Bank          Systems & Infrastructure                            AND CYBER SECURITY                                       OPERATIONS                                                                                                             • Accountabilities       • Technology Platforms Capacity and Scale      • Information Security FFIEC maturity level benchmark                                                                                                           • Repeatable documented processes       • Integration Capabilities                     • Teammate Awareness and Training                                                                                                           • Controls Environment (Inter/Intra Departmental)       • Hardware Lifecycle                           • Perimeter (Network) Security                                                                                                           • Measured effectiveness (KPIs/SLAs)       • Resiliency/Single Points of Failure          • Enterprise (Internal) Security (DLP)                                                                                                           • Utilization of Automation       • Monitoring Techniques                        • Activity/Threat Monitoring and Incident Management                                                         Resolution                                         • Operational Capacity and Scale       • Problem and Incident Management                                                                                                           • Acquisition Integration Completeness   72 
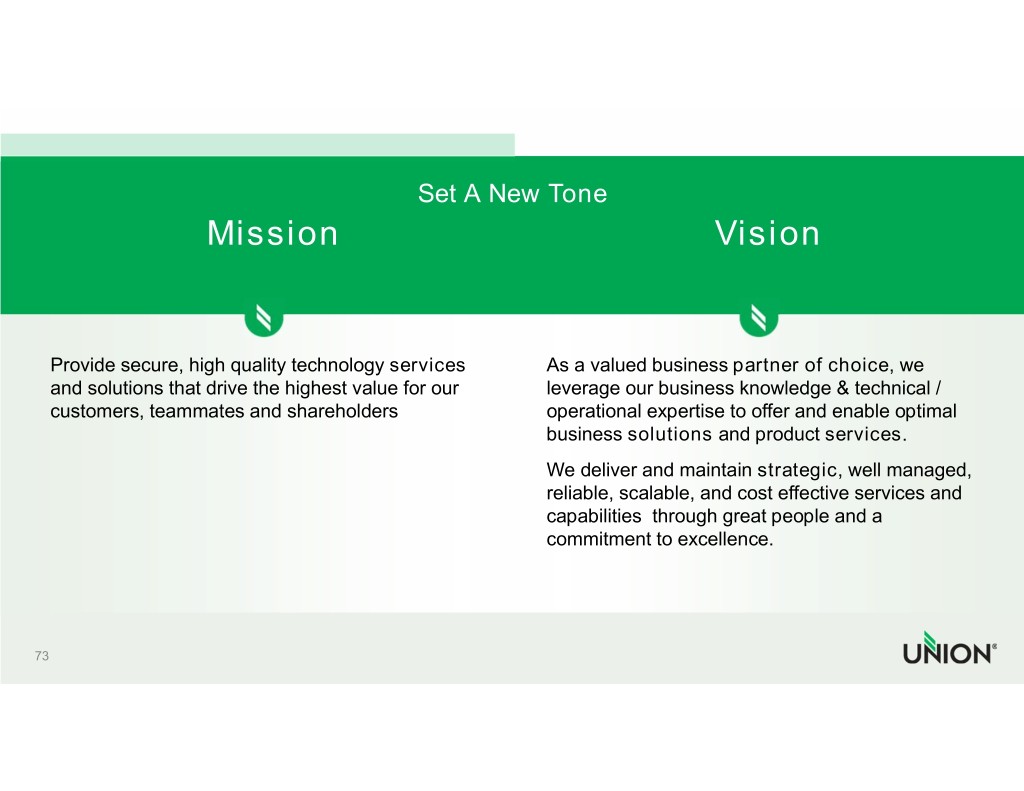
 
 
                                      Set A New Tone                  Mission                                           Vision    Provide secure, high quality technology services  As a valued business partner of choice, we   and solutions that drive the highest value for our leverage our business knowledge & technical /   customers, teammates and shareholders             operational expertise to offer and enable optimal                                                     business solutions and product services.                                                    We deliver and maintain strategic, well managed,                                                     reliable, scalable, and cost effective services and                                                     capabilities  through great people and a                                                     commitment to excellence.   73 
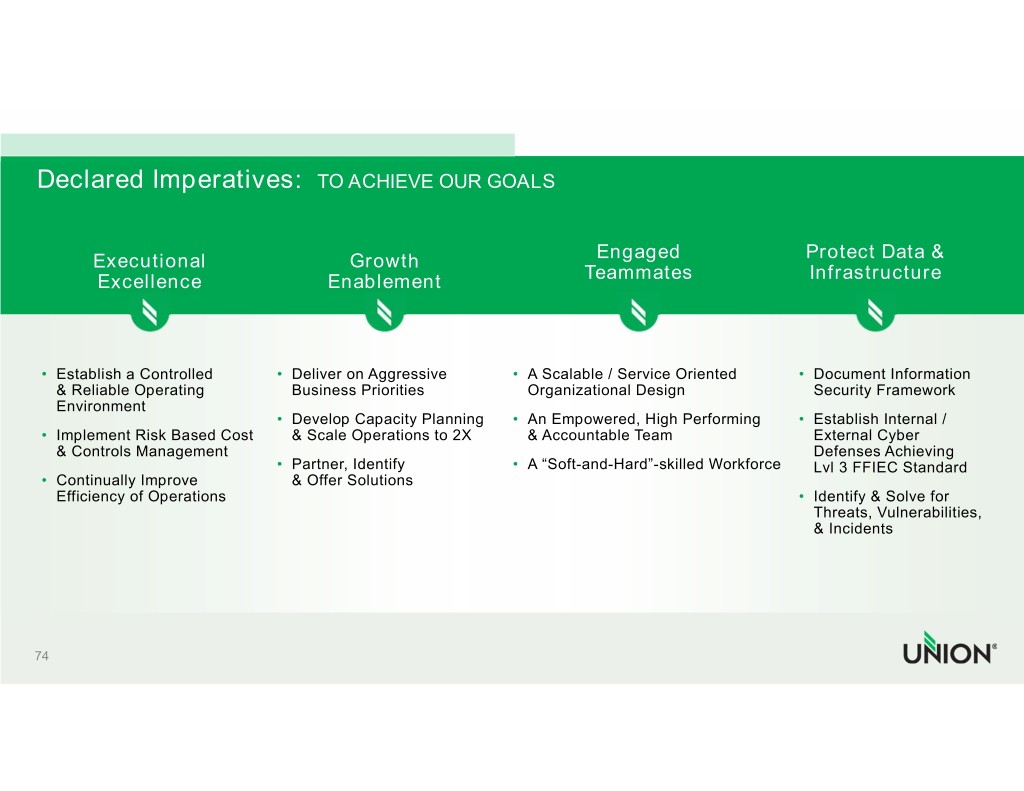
 
 
Declared Imperatives:  TO ACHIEVE OUR GOALS          Executional                       Growth                         Engaged                    Protect Data &         Excellence                    Enablement                       Teammates                    Infrastructure    • Establish a Controlled      • Deliver on Aggressive        • A Scalable / Service Oriented     • Document Information     & Reliable Operating          Business Priorities           Organizational Design                Security Framework    Environment                                • Develop Capacity Planning    • An Empowered, High Performing     • Establish Internal /   • Implement Risk Based Cost     & Scale Operations to 2X      & Accountable Team                   External Cyber     & Controls Management                                                                            Defenses Achieving                                • Partner, Identify            • A “Soft-and-Hard”-skilled Workforce Lvl 3 FFIEC Standard  • Continually Improve           & Offer Solutions    Efficiency of Operations                                                                       • Identify & Solve for                                                                                                      Threats, Vulnerabilities,                                                                                                      & Incidents   74 
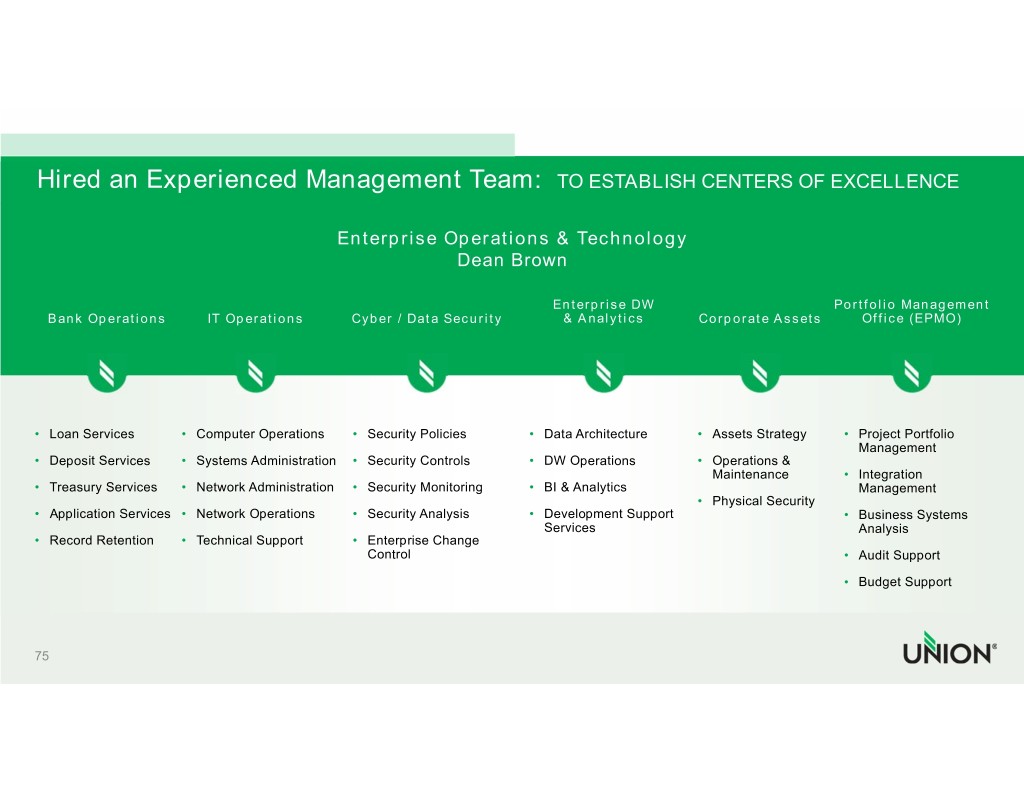
 
 
Hired an Experienced Management Team:  TO ESTABLISH CENTERS OF EXCELLENCE                                                   Enterprise Operations & Technology                                                                     Dean Brown                                                                                      Enterprise DW                                Portfolio Management   Bank Operations           IT Operations          Cyber / Data Security             & Analytics           Corporate Assets          Office (EPMO)   • Loan Services         • Computer Operations      •  Security Policies         • Data Architecture        • Assets Strategy      •  Project Portfolio                                                                                                                                       Management • Deposit Services      • Systems Administration   •  Security Controls         • DW Operations            • Operations &                                                                                                               Maintenance          •  Integration  • Treasury Services     • Network Administration   •  Security Monitoring       • BI & Analytics                                     Management                                                                                                            • Physical Security • Application Services  • Network Operations       •  Security Analysis         • Development Support                             •  Business Systems                                                                                    Services                                           Analysis • Record Retention      • Technical Support        •  Enterprise Change                                                       Control                                                                     •  Audit Support                                                                                                                                    •  Budget Support   75 
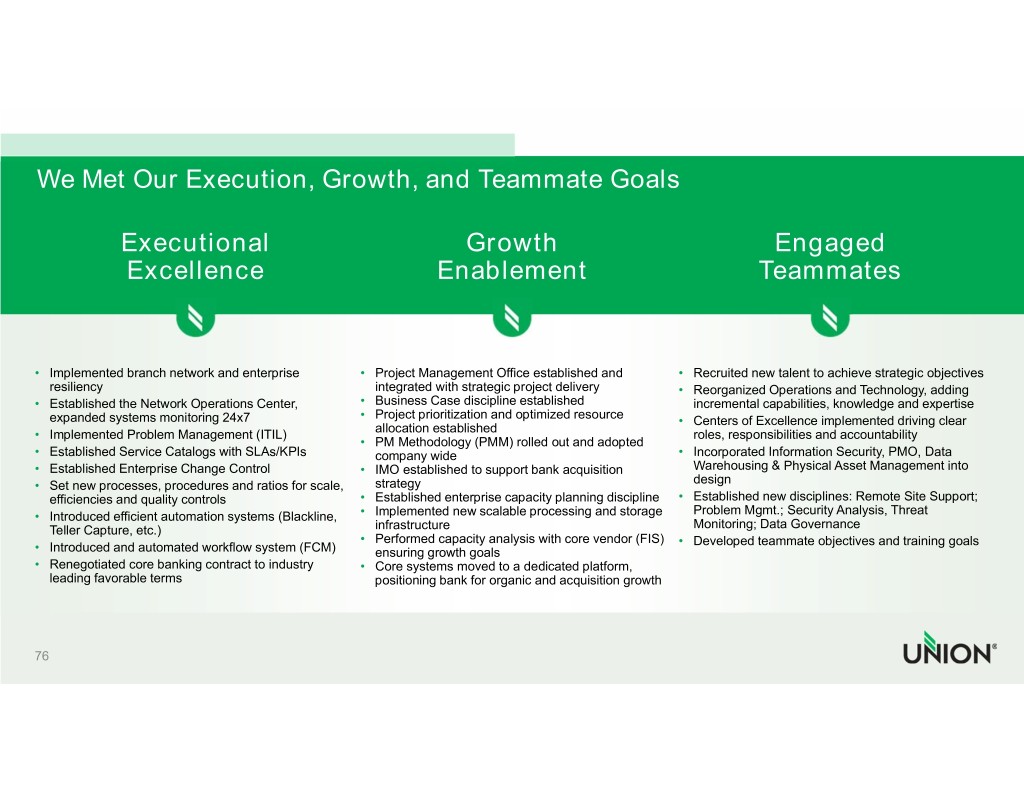
 
 
We Met Our Execution, Growth, and Teammate Goals                Executional                                             Growth                                           Engaged                Excellence                                        Enablement                                          Teammates   • Implemented branch network and enterprise         •  Project Management Office established and        • Recruited new talent to achieve strategic objectives   resiliency                                           integrated with strategic project delivery       • Reorganized Operations and Technology, adding  • Established the Network Operations Center,        •  Business Case discipline established               incremental capabilities, knowledge and expertise                                                     •  Project prioritization and optimized resource    expanded systems monitoring 24x7                                                                      • Centers of Excellence implemented driving clear                                                         allocation established • Implemented Problem Management (ITIL)                                                                   roles, responsibilities and accountability                                                     •  PM Methodology (PMM) rolled out and adopted  • Established Service Catalogs with SLAs/KPIs          company wide                                     • Incorporated Information Security, PMO, Data  • Established Enterprise Change Control             •  IMO established to support bank acquisition        Warehousing & Physical Asset Management into  • Set new processes, procedures and ratios for scale,  strategy                                           design   efficiencies and quality controls                 •  Established enterprise capacity planning discipline • Established new disciplines: Remote Site Support;                                                                                                            Problem Mgmt.; Security Analysis, Threat  • Introduced efficient automation systems (Blackline, • Implemented new scalable processing and storage    Teller Capture, etc.)                                infrastructure                                     Monitoring; Data Governance                                                     •  Performed capacity analysis with core vendor (FIS) • Developed teammate objectives and training goals • Introduced and automated workflow system (FCM)       ensuring growth goals • Renegotiated core banking contract to industry    •  Core systems moved to a dedicated platform,    leading favorable terms                              positioning bank for organic and acquisition growth   76 
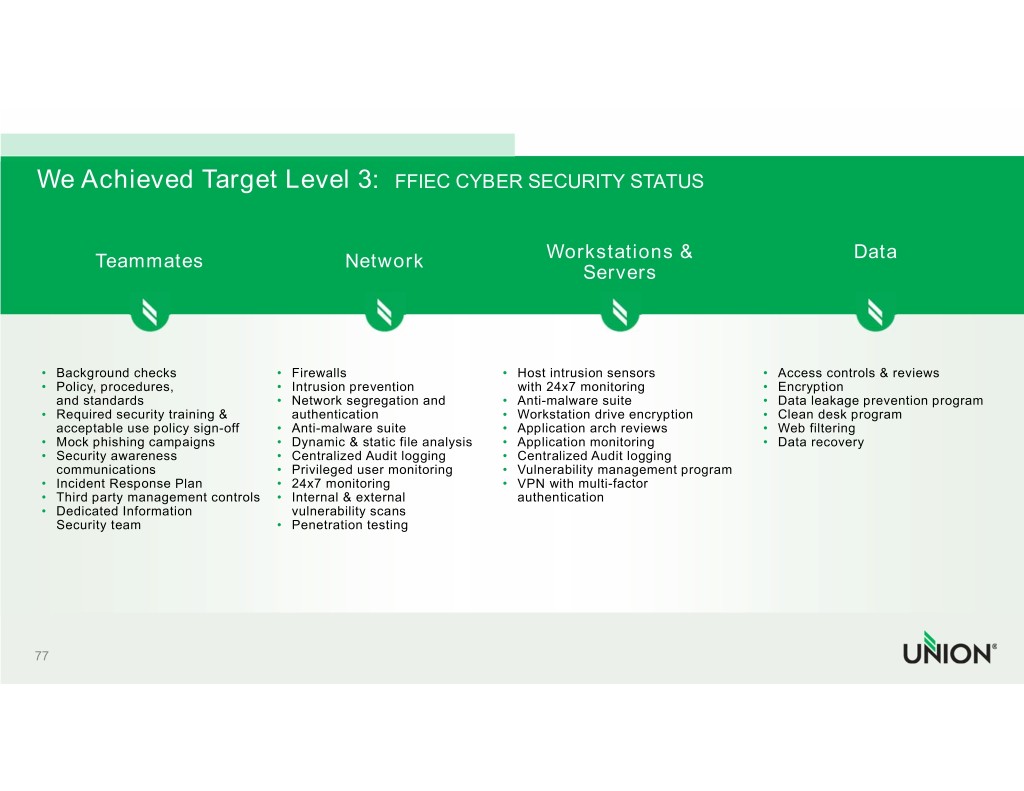
 
 
We Achieved Target Level 3:  FFIEC CYBER SECURITY STATUS             Teammates                               Network                         Workstations &                                    Data                                                                                         Servers    •  Background checks                  • Firewalls                         •  Host intrusion sensors                 •  Access controls & reviews  •  Policy, procedures,                • Intrusion prevention                 with 24x7 monitoring                   •  Encryption     and standards                      • Network segregation and           •  Anti-malware suite                     •  Data leakage prevention program  •  Required security training &         authentication                    •  Workstation drive encryption           •  Clean desk program     acceptable use policy sign-off     • Anti-malware suite                •  Application arch reviews               •  Web filtering  •  Mock phishing campaigns            • Dynamic & static file analysis    •  Application monitoring                 •  Data recovery  •  Security awareness                 • Centralized Audit logging         •  Centralized Audit logging     communications                     • Privileged user monitoring        •  Vulnerability management program  •  Incident Response Plan             • 24x7 monitoring                   •  VPN with multi-factor   •  Third party management controls    • Internal & external                  authentication  •  Dedicated Information                vulnerability scans     Security team                      • Penetration testing   77 
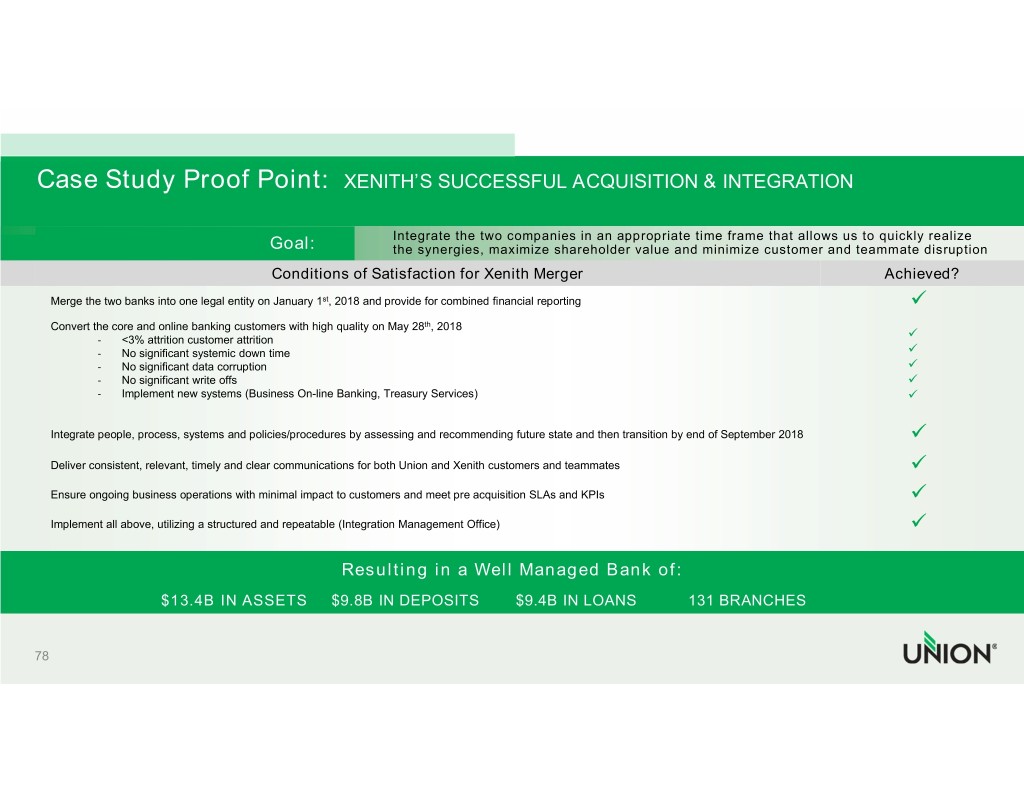
 
 
Case Study Proof Point:  XENITH’S SUCCESSFUL ACQUISITION & INTEGRATION                                                                    Integrate the two companies in an appropriate time frame that allows us to quickly realize                                             Goal:                  the synergies, maximize shareholder value and minimize customer and teammate disruption                                            Conditions of Satisfaction for Xenith Merger                                                                     Achieved?    Merge the two banks into one legal entity on January 1st, 2018 and provide for combined financial reporting                                                       Convert the core and online banking customers with high quality on May 28th, 2018                                                                                                                                                                              ‐    <3% attrition customer attrition            ‐    No significant systemic down time                                                                                                                            ‐    No significant data corruption                                                                                                                               ‐    No significant write offs                                                                                                                                    ‐    Implement new systems (Business On-line Banking, Treasury Services)                                                                                   Integrate people, process, systems and policies/procedures by assessing and recommending future state and then transition by end of September 2018                 Deliver consistent, relevant, timely and clear communications for both Union and Xenith customers and teammates                                                   Ensure ongoing business operations with minimal impact to customers and meet pre acquisition SLAs and KPIs                                                        Implement all above, utilizing a structured and repeatable (Integration Management Office)                                                                                                                              Resulting in a Well Managed Bank of:                        $13.4B     IN ASSETS           $9.8B    IN DEPOSITS              $9.4B    IN LOANS               131   BRANCHES   78 
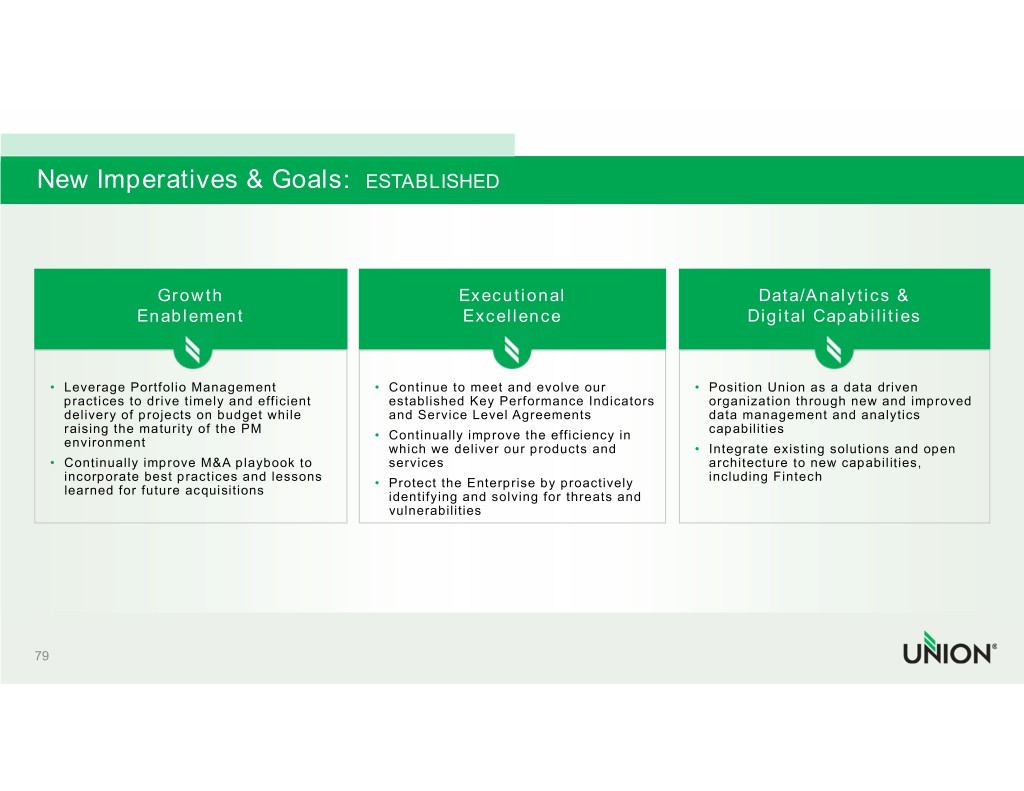
 
 
New Imperatives & Goals:  ESTABLISHED                       Growth                                          Executional                                      Data/Analytics &                  Enablement                                          Excellence                                    Digital Capabilities     •  Leverage Portfolio Management                     • Continue to meet and evolve our                  •  Position Union as a data driven       practices to drive timely and efficient             established Key Performance Indicators              organization through new and improved       delivery of projects on budget while                and Service Level Agreements                        data management and analytics       raising the maturity of the PM                                                                          capabilities                                                        • Continually improve the efficiency in       environment                                                          which we deliver our products and                •  Integrate existing solutions and open    •  Continually improve M&A playbook to                 services                                            architecture to new capabilities,       incorporate best practices and lessons                                                                  including Fintech                                                        • Protect the Enterprise by proactively       learned for future acquisitions                                                          identifying and solving for threats and                                                           vulnerabilities   79 
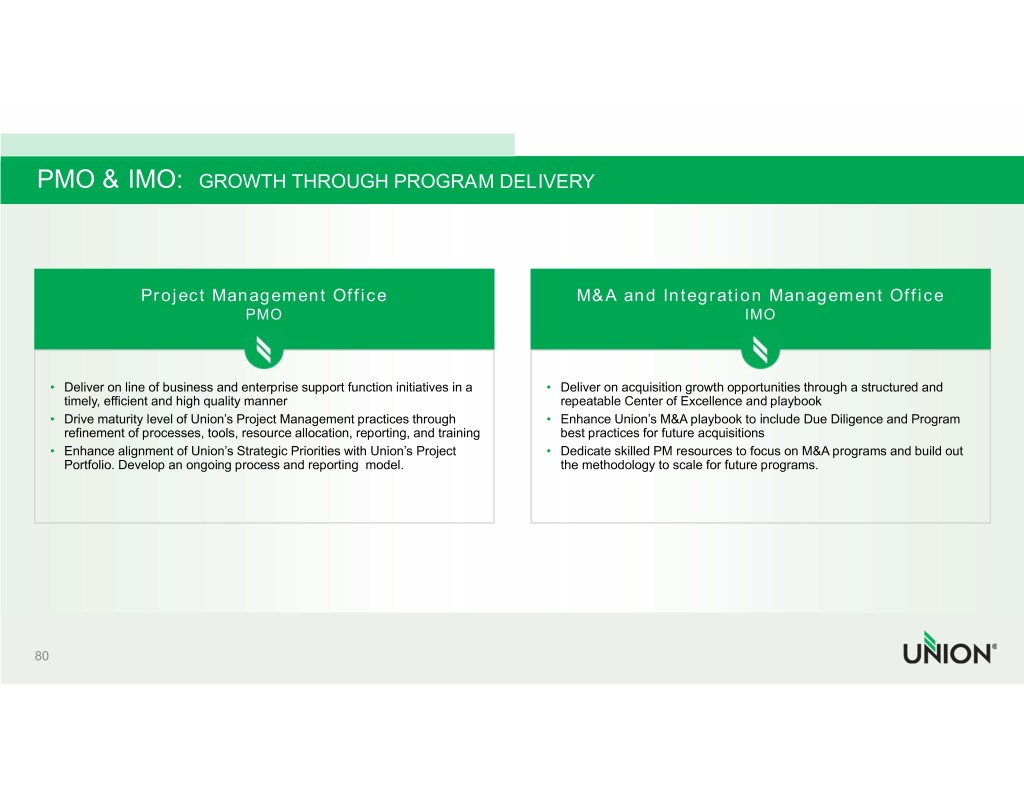
 
 
PMO & IMO:  GROWTH THROUGH PROGRAM DELIVERY                    Project Management Office                                             M&A and Integration Management Office                                   PMO                                                                             IMO     •  Deliver on line of business and enterprise support function initiatives in a •  Deliver on acquisition growth opportunities through a structured and       timely, efficient and high quality manner                                       repeatable Center of Excellence and playbook    •  Drive maturity level of Union’s Project Management practices through         •  Enhance Union’s M&A playbook to include Due Diligence and Program       refinement of processes, tools, resource allocation, reporting, and training    best practices for future acquisitions   •  Enhance alignment of Union’s Strategic Priorities with Union’s Project       •  Dedicate skilled PM resources to focus on M&A programs and build out       Portfolio. Develop an ongoing process and reporting  model.                     the methodology to scale for future programs.   80 
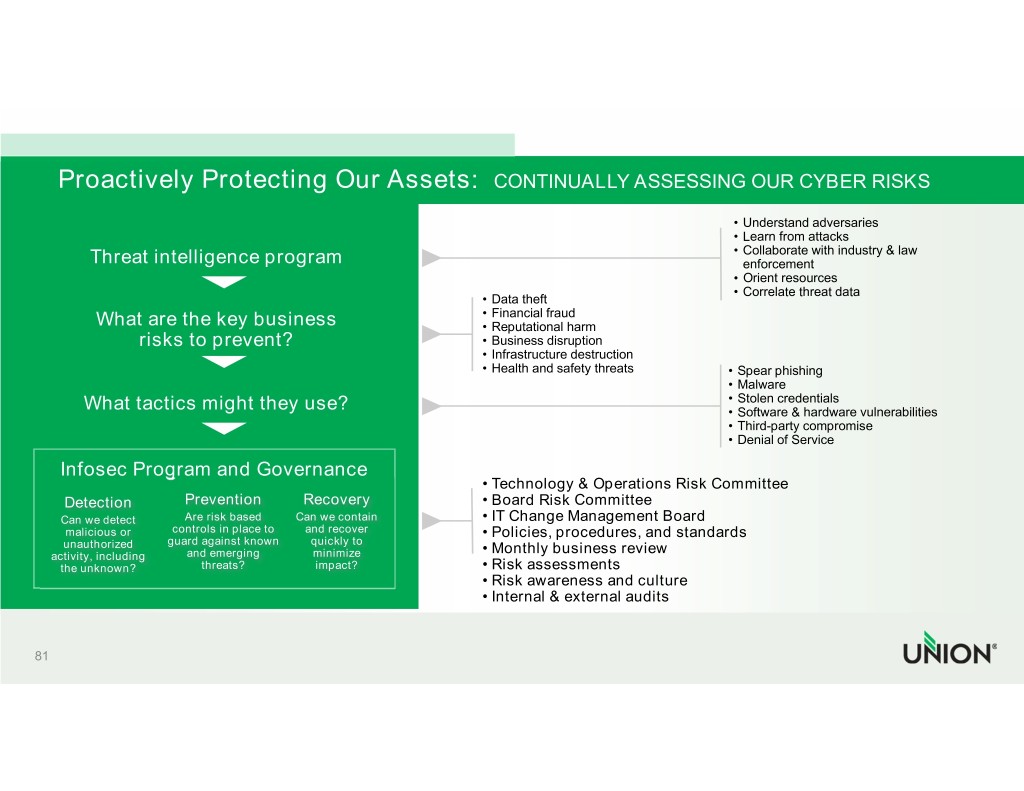
 
 
    Proactively Protecting Our Assets:  CONTINUALLY ASSESSING OUR CYBER RISKS                                                                                                                   • Understand adversaries                                                                                                                  • Learn from attacks                                                                                                                  • Collaborate with industry & law           Threat intelligence program                                                                              enforcement                                                                                                                  • Orient resources                                                                                                                  • Correlate threat data                                                                         • Data theft                                                                         • Financial fraud           What are the key business                                     • Reputational harm                  risks to prevent?                                      • Business disruption                                                                         • Infrastructure destruction                                                                         • Health and safety threats             • Spear phishing                                                                                                                 •Malware                                                                                                                 • Stolen credentials         What tactics might they use?                                                                            • Software & hardware vulnerabilities                                                                                                                 • Third-party compromise                                                                                                                 • Denial of Service     Infosec Program and Governance                                                                         • Technology & Operations Risk Committee      Detection          Prevention         Recovery                     • Board Risk Committee     Can we detect       Are risk based    Can we contain                • IT Change Management Board      malicious or     controls in place to  and recover                 • Policies, procedures, and standards      unauthorized    guard against known     quickly to                 • Monthly business review    activity, including   and emerging        minimize      the unknown?           threats?          impact?                    • Risk assessments                                                                         • Risk awareness and culture                                                                         • Internal & external audits   81 
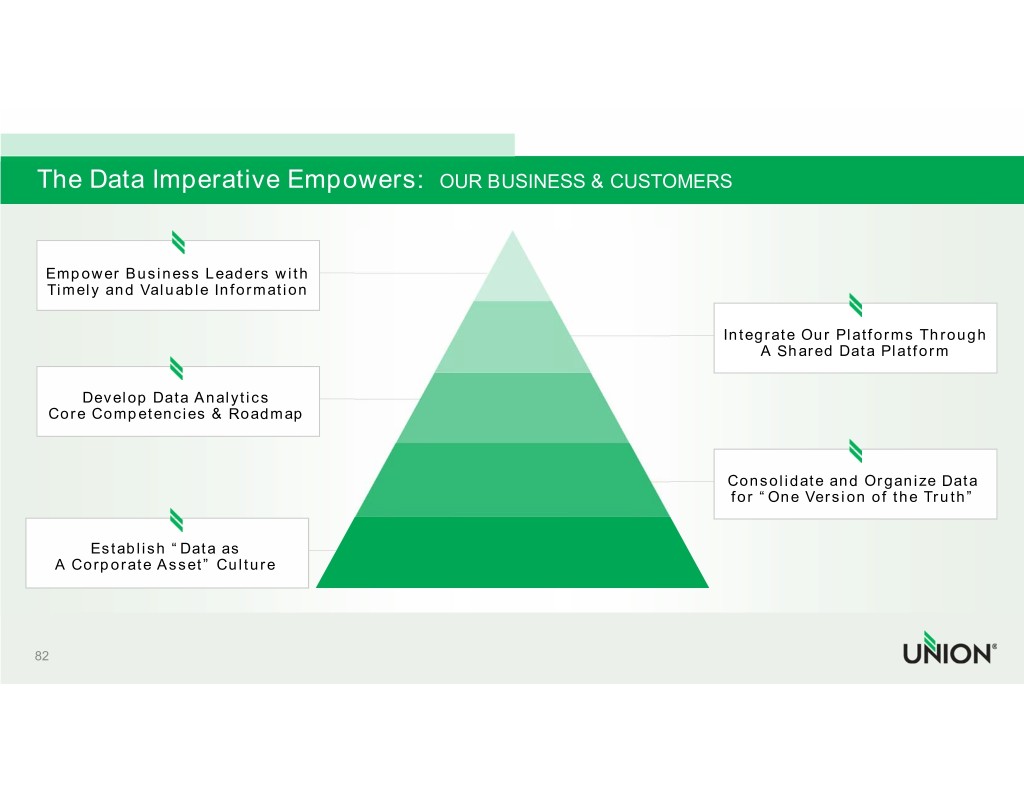
 
 
The Data Imperative Empowers:  OUR BUSINESS & CUSTOMERS    Empower Business Leaders with    Timely and Valuable Information                                                                                           Integrate Our Platforms Through                                                                                              A Shared Data Platform        Develop Data Analytics   Core Competencies & Roadmap                                                                                            Consolidate and Organize Data                                                                                            for “One Version of the Truth”         Establish “Data as    A Corporate Asset” Culture   82 
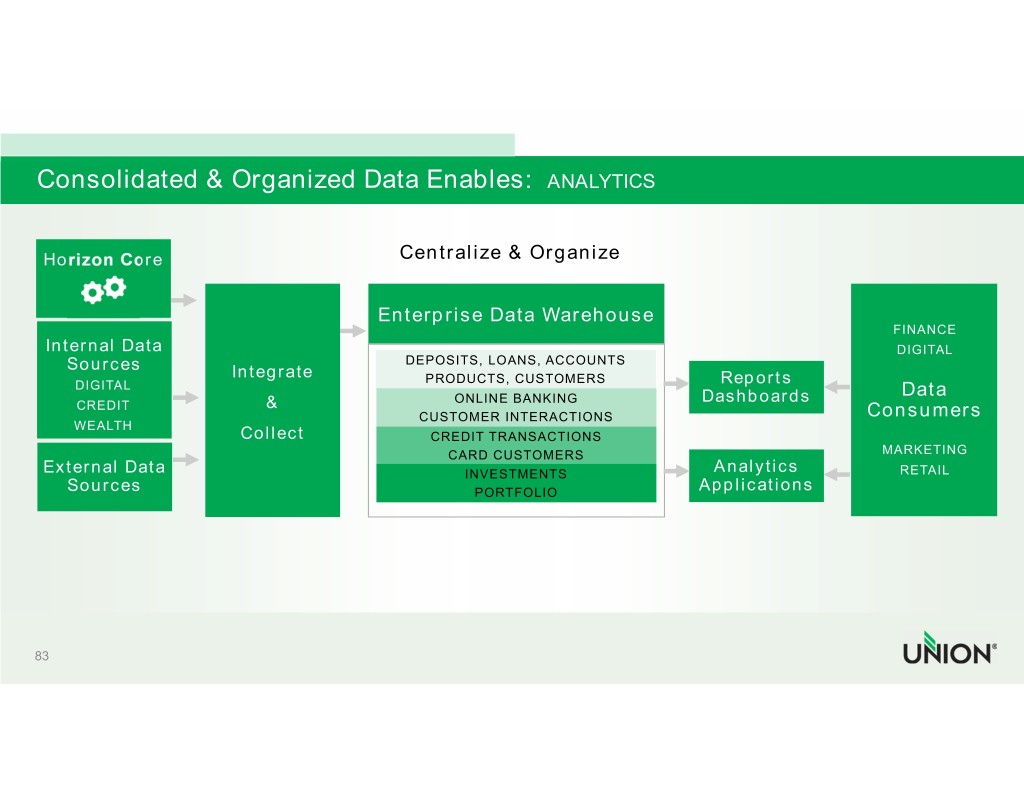
 
 
Consolidated & Organized Data Enables:  ANALYTICS    Horizon Core                                              Centralize & Organize                                                         Enterprise Data Warehouse                                                                                                                                           FINANCE   Internal Data                                                                                                                            DIGITAL      Sources                                                DEPOSITS, LOANS, ACCOUNTS                                 Integrate                      PRODUCTS, CUSTOMERS        DIGITAL                                                                                                 Reports                                                                     ONLINE BANKING                          Dashboards                      Data         CREDIT                        &                                                               CUSTOMER INTERACTIONS                                                   Consumers       WEALTH                                  Collect                        CREDIT TRANSACTIONS                                                                    CARD CUSTOMERS                                                        MARKETING  External Data                                                       INVESTMENTS                             Analytics                     RETAIL      Sources                                                           PORTFOLIO                           Applications   83 
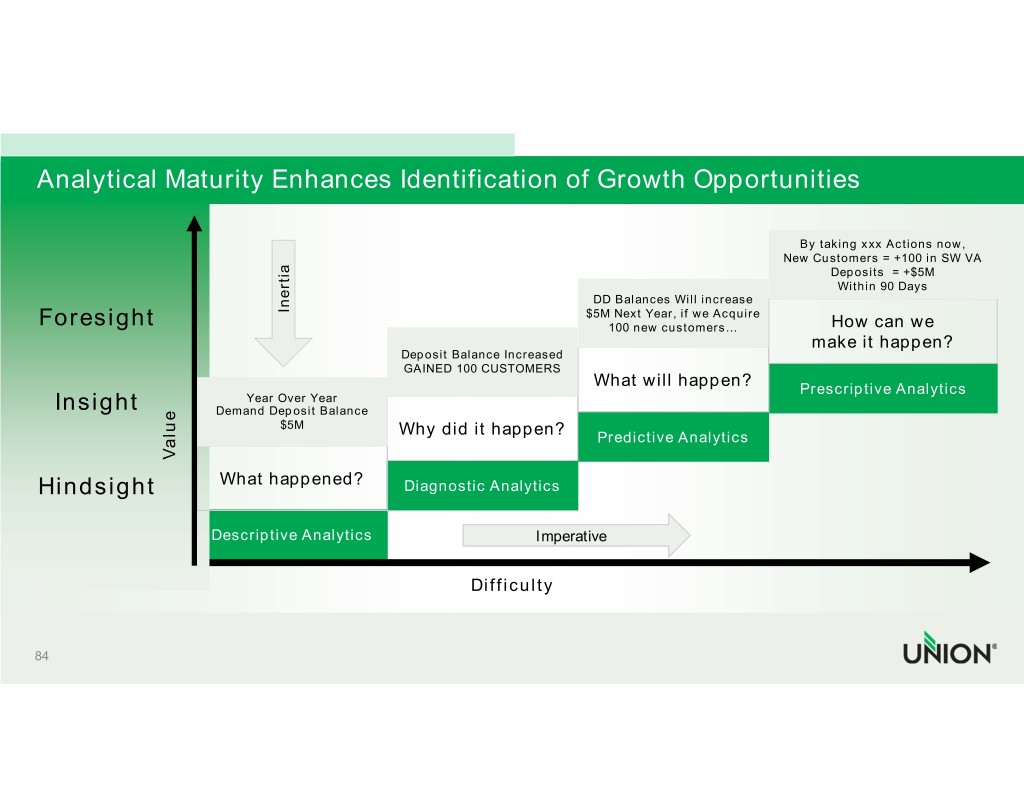
 
 
Analytical Maturity Enhances Identification of Growth Opportunities                                                                                                                              By taking xxx Actions now,                                                                                                                             New Customers = +100 in SW VA                                                                                                                                 Deposits  = +$5M                                                                                                                                   Within 90 Days                                                                                           DD Balances Will increase                                           Inertia                                         $5M Next Year, if we Acquire   Foresight                                                                                  100 new customers…                  How can we                                                                                                                              make it happen?                                                            Deposit Balance Increased                                                            GAINED 100 CUSTOMERS                                                                                           What will happen?                                                                                                                            Prescriptive Analytics                                   Year Over Year    Insight                   Demand Deposit Balance                                         $5M                                                            Why did it happen?              Predictive Analytics                        Value  Hindsight                    What happened?                Diagnostic Analytics                              Descriptive Analytics                                Imperative                                                                        Difficulty   84 
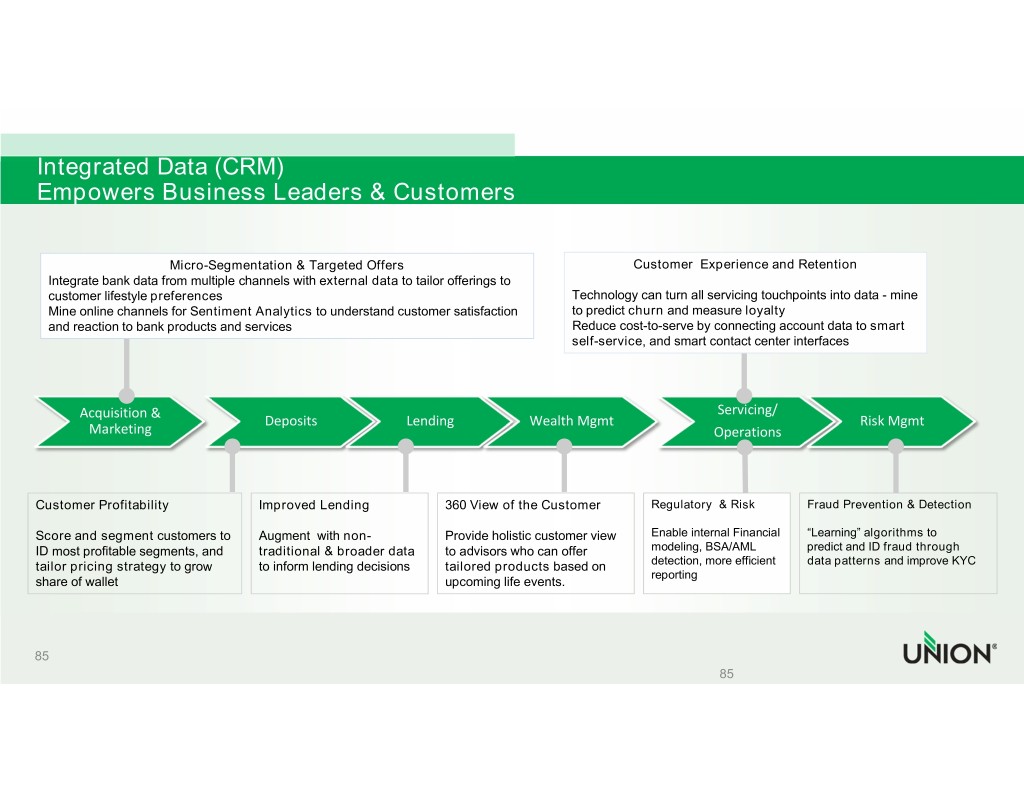
 
 
Integrated Data (CRM) Empowers Business Leaders & Customers                         Micro-Segmentation & Targeted Offers                                      Customer  Experience and Retention   Integrate bank data from multiple channels with external data to tailor offerings to    customer lifestyle preferences                                                       Technology can turn all servicing touchpoints into data - mine    Mine online channels for Sentiment Analytics to understand customer satisfaction     to predict churn and measure loyalty   and reaction to bank products and services                                           Reduce cost-to-serve by connecting account data to smart                                                                                        self-service, and smart contact center interfaces          Acquisition &                                                                                          Servicing/                                      Deposits               Lending             Wealth Mgmt                                          Risk Mgmt          Marketing                                                                                           Operations   Customer Profitability              Improved Lending              360 View of the Customer         Regulatory  & Risk        Fraud Prevention & Detection  Score and segment customers to      Augment  with non-            Provide holistic customer view   Enable internal Financial “Learning” algorithms to ID most profitable segments, and    traditional & broader data    to advisors who can offer        modeling, BSA/AML         predict and ID fraud through tailor pricing strategy to grow     to inform lending decisions   tailored products based on       detection, more efficient data patterns and improve KYC                                                                                                    reporting share of wallet                                                   upcoming life events.     85                                                                                                               85 
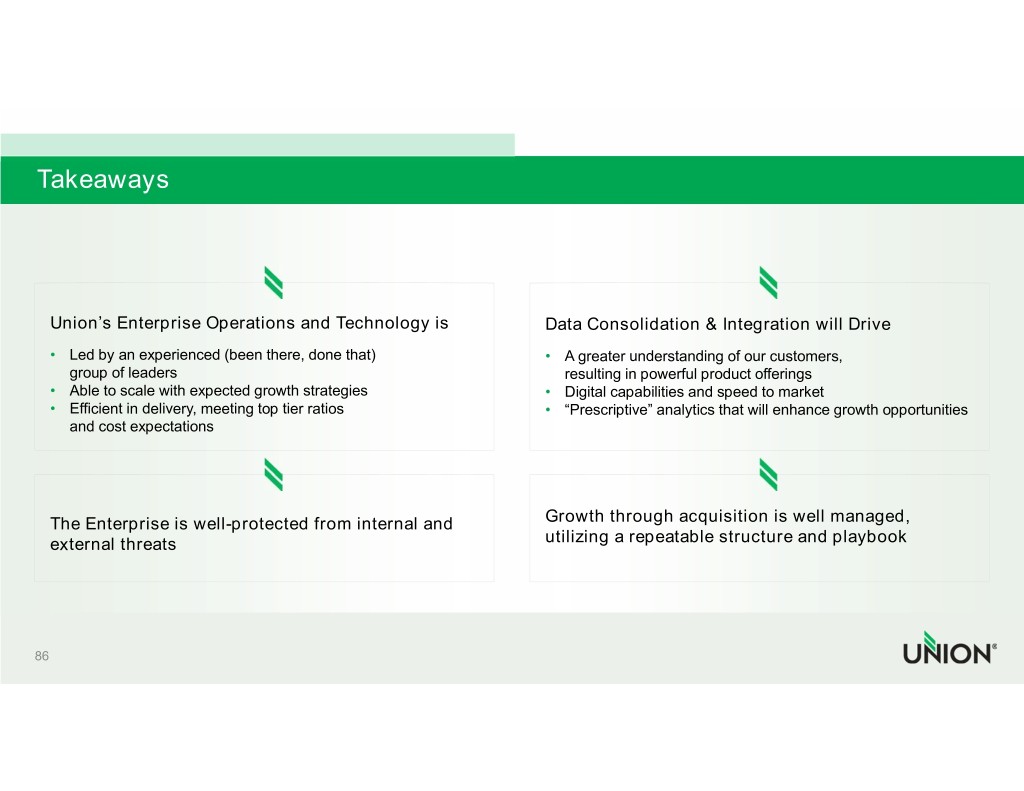
 
 
Takeaways     Union’s Enterprise Operations and Technology is                 Data Consolidation & Integration will Drive    • Led by an experienced (been there, done that)                 • A greater understanding of our customers,     group of leaders                                                resulting in powerful product offerings   • Able to scale with expected growth strategies                 • Digital capabilities and speed to market   • Efficient in delivery, meeting top tier ratios                • “Prescriptive” analytics that will enhance growth opportunities     and cost expectations     The Enterprise is well-protected from internal and              Growth through acquisition is well managed,    external threats                                                utilizing a repeatable structure and playbook   86 

 
 
    Sara Rountree HEAD OF DIGITAL STRATEGY 
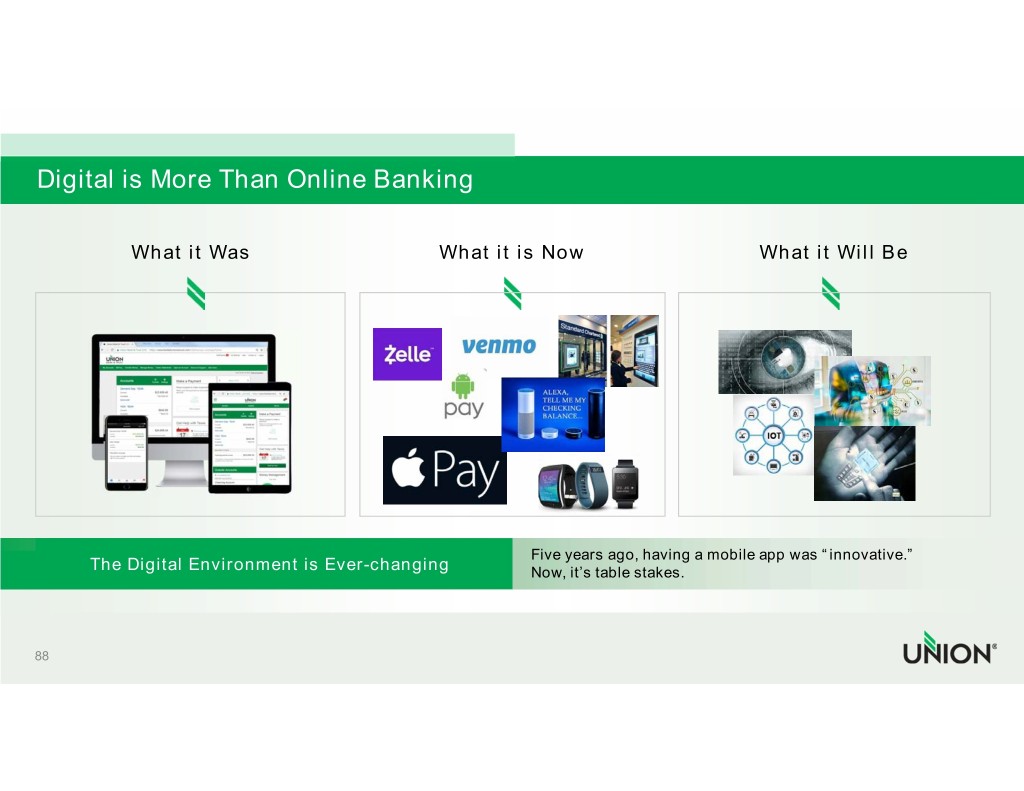
 
 
Digital is More Than Online Banking              What it Was                             What it is Now                           What it Will Be                                                                   Five years ago, having a mobile app was “innovative.”        The Digital Environment is Ever-changing                 Now, it’s table stakes.   88 
 
 
 Digital is No Longer “A Thing”                               Digital is a way of doing things.                          A way of interacting with our customers.   89 
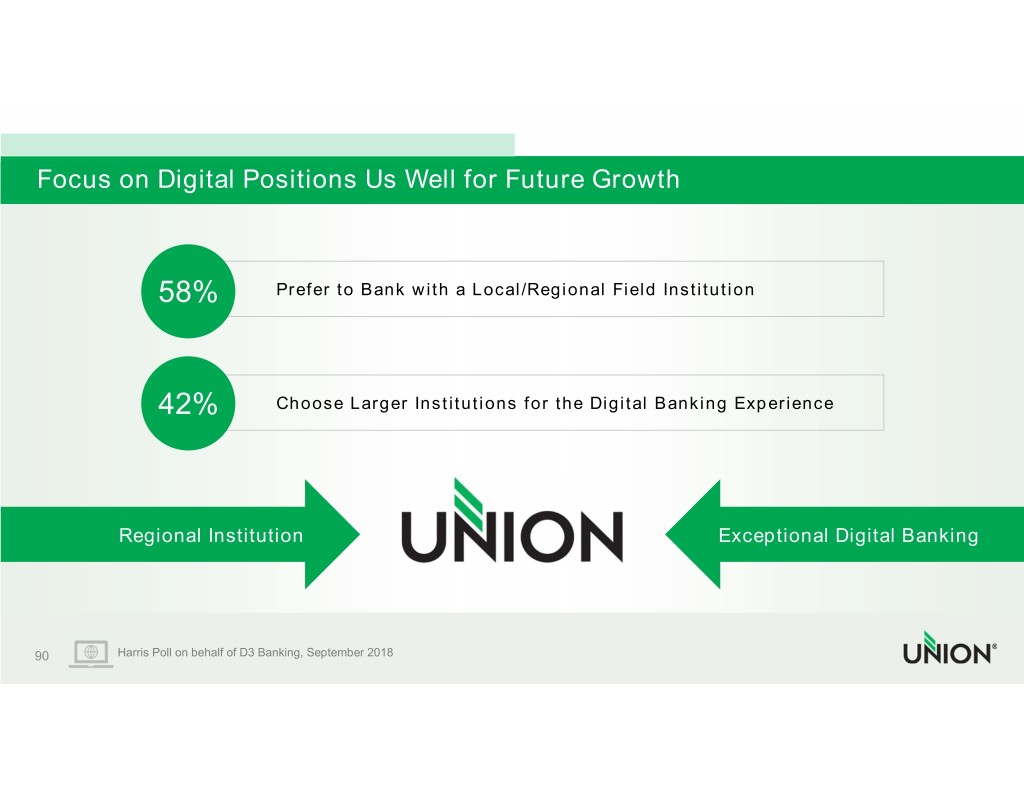
 
 
Focus on Digital Positions Us Well for Future Growth                58%          Prefer to Bank with a Local/Regional Field Institution                42%          Choose Larger Institutions for the Digital Banking Experience            Regional Institution                                             Exceptional Digital Banking   90       Harris Poll on behalf of D3 Banking, September 2018 
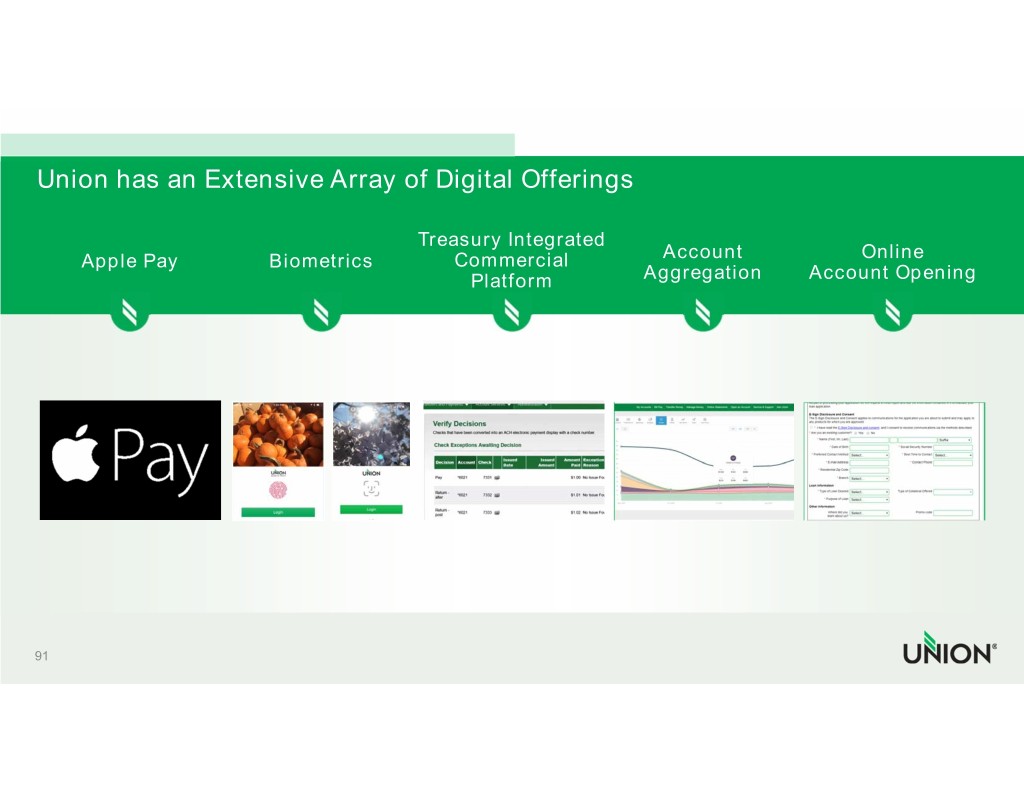
 
 
Union has an Extensive Array of Digital Offerings                                        Treasury Integrated       Apple Pay         Biometrics         Commercial          Account             Online                                            Platform         Aggregation      Account Opening   91 
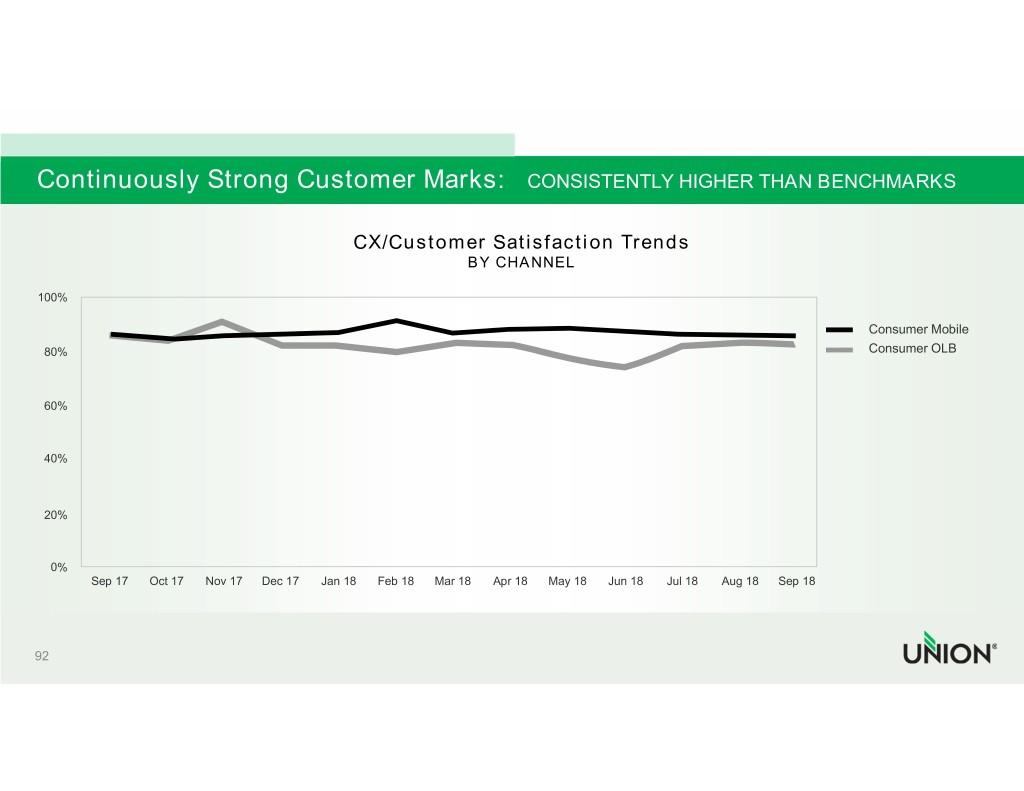
 
 
Continuously Strong Customer Marks:   CONSISTENTLY HIGHER THAN BENCHMARKS                                                     CX/Customer Satisfaction Trends                                                                       BY CHANNEL  100%                                                                                                                                        Consumer Mobile   80%                                                                                                                                 Consumer OLB     60%     40%     20%      0%          Sep 17    Oct 17   Nov 17   Dec 17   Jan 18   Feb 18   Mar 18    Apr 18   May 18   Jun 18    Jul 18   Aug 18   Sep 18   92 
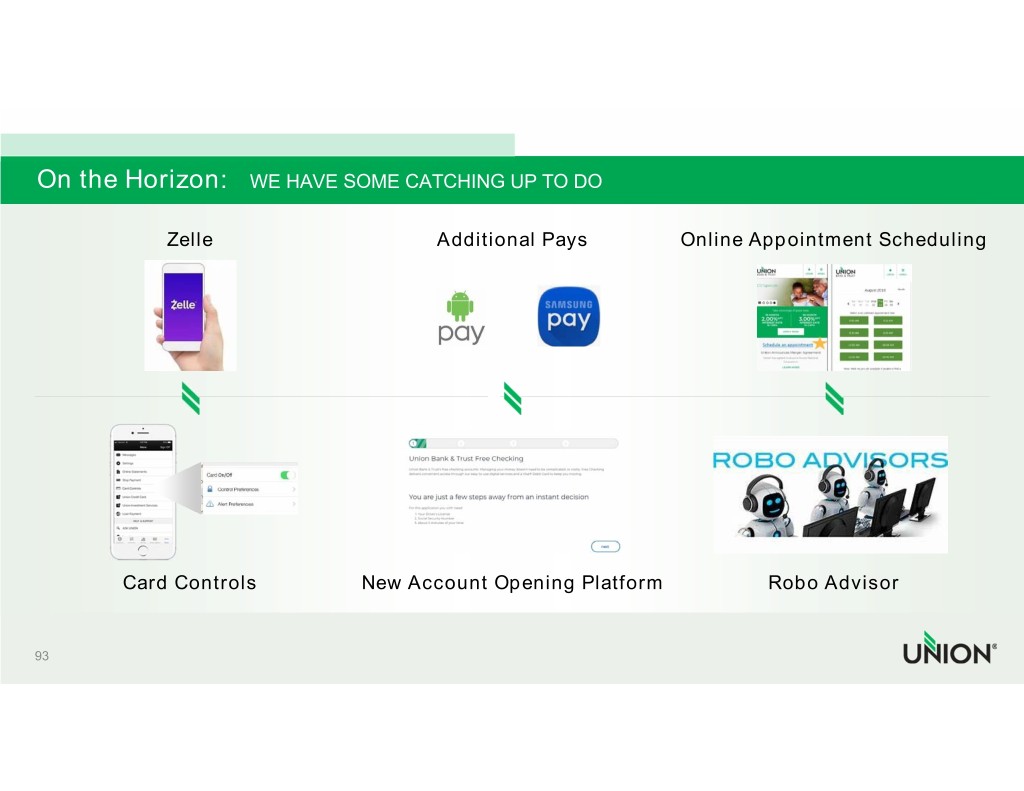
 
 
On the Horizon:   WE HAVE SOME CATCHING UP TO DO               Zelle                      Additional Pays         Online Appointment Scheduling            Card Controls          New Account Opening Platform             Robo Advisor   93 
 
 
                                Our Approach                    IS NOT                                       IS           to strive to be first to market         to ensure each interaction through             with digital capabilities            any channel is easy and exceeds                                                    our customers’ expectations   94 
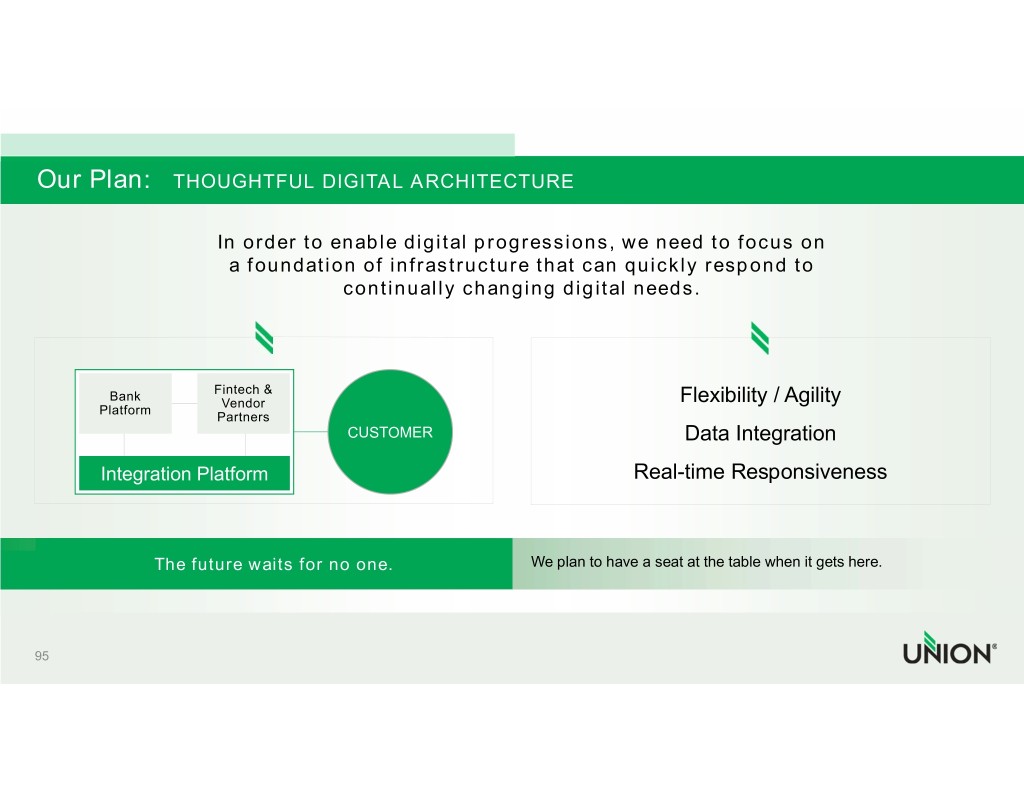
 
 
Our Plan:   THOUGHTFUL DIGITAL ARCHITECTURE                    In order to enable digital progressions, we need to focus on                    a foundation of infrastructure that can quickly respond to                               continually changing digital needs.                      Fintech &         Bank                    Vendor                                        Flexibility / Agility       Platform                   Partners                                CUSTOMER                         Data Integration        Integration Platform                                 Real-time Responsiveness               The future waits for no one.         We plan to have a seat at the table when it gets here.   95 
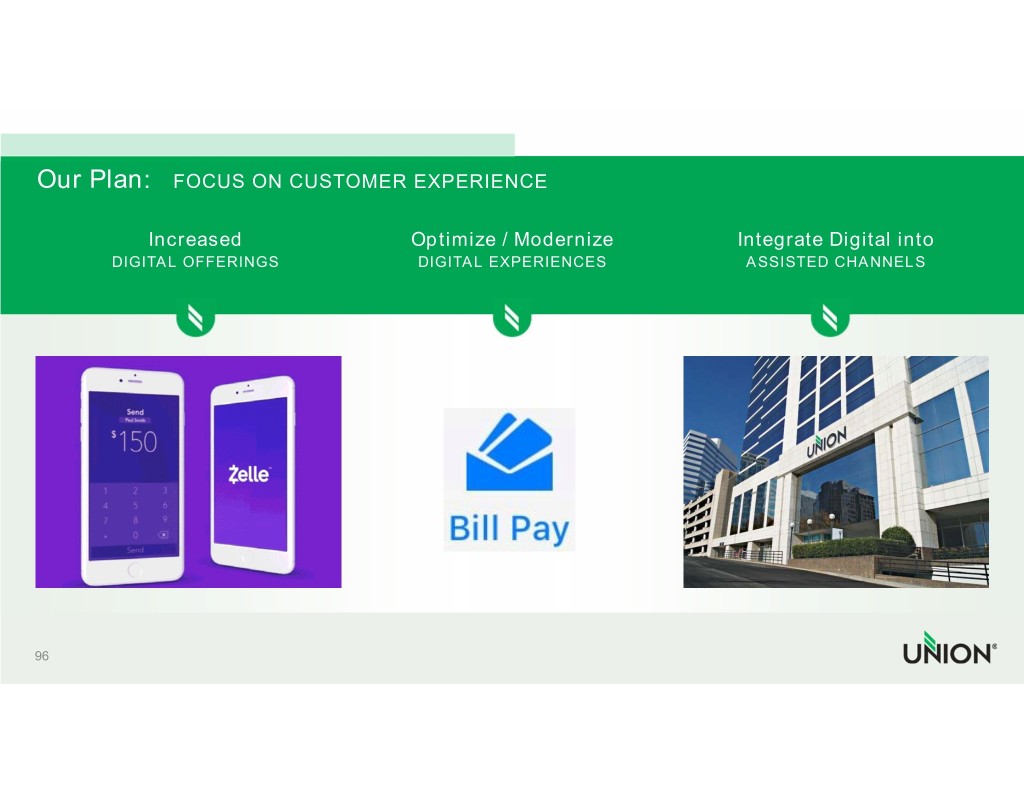
 
 
Our Plan:   FOCUS ON CUSTOMER EXPERIENCE             Increased                 Optimize / Modernize             Integrate Digital into         DIGITAL OFFERINGS             DIGITAL EXPERIENCES             ASSISTED CHANNELS   96 
 
 
Our Plan:   FOCUS ON OUR TEAMMATES         The Right               The Right               The Right               The Right       INFORMATION                TOOLS                 SUPPORT                  PEOPLE   97 
 
 
Immediate Focus Areas            Catch Up                 Platform Evolutions         TABLE STAKES                   ROLLOUTS      Prepare Our Teammates         Prepare for the Future   98 
 
 
The Future of Banking Depends on DIGITAL INCLUSION 

 
 
    Duane Smith CHIEF MARKETING OFFICER 
 
 
Marketing Vision                            Be the engine that drives                               our business growth.                                     Corporate Brand & Reputation                           Retail            Commercial             Wealth   101 
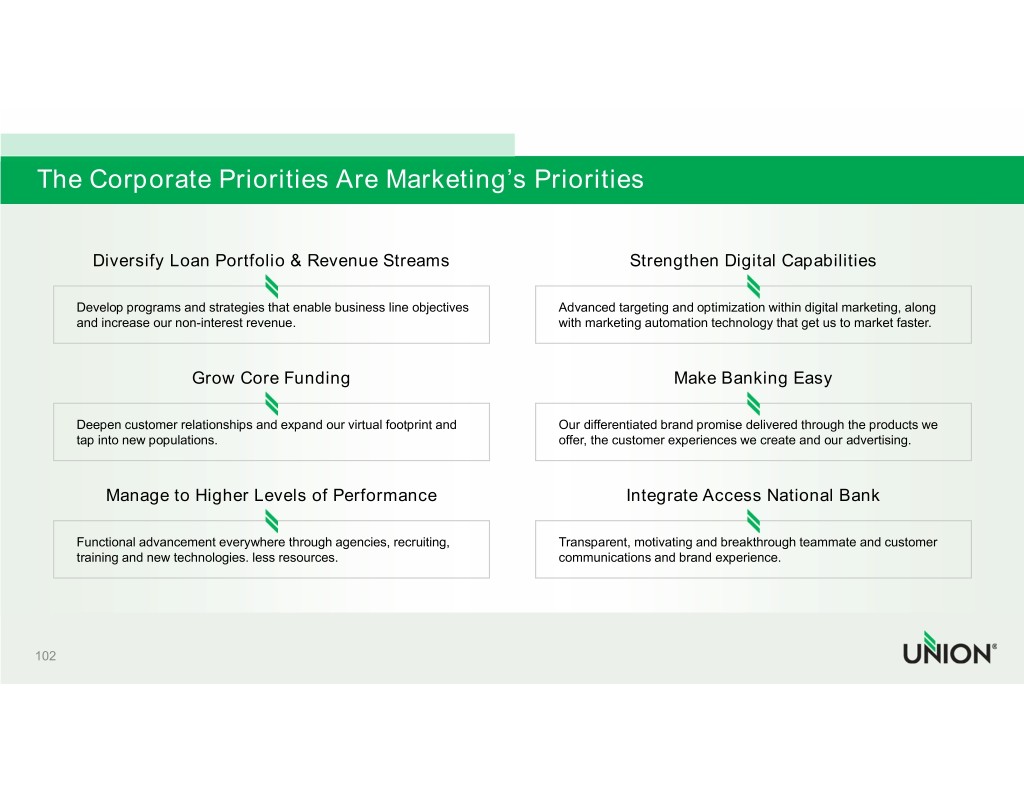
 
 
The Corporate Priorities Are Marketing’s Priorities            Diversify Loan Portfolio & Revenue Streams                                             Strengthen Digital Capabilities         Develop programs and strategies that enable business line objectives         Advanced targeting and optimization within digital marketing, along         and increase our non-interest revenue.                                       with marketing automation technology that get us to market faster.                           Grow Core Funding                                                             Make Banking Easy         Deepen customer relationships and expand our virtual footprint and           Our differentiated brand promise delivered through the products we         tap into new populations.                                                    offer, the customer experiences we create and our advertising.              Manage to Higher Levels of Performance                                             Integrate Access National Bank         Functional advancement everywhere through agencies, recruiting,              Transparent, motivating and breakthrough teammate and customer         training and new technologies. less resources.                               communications and brand experience.   102 
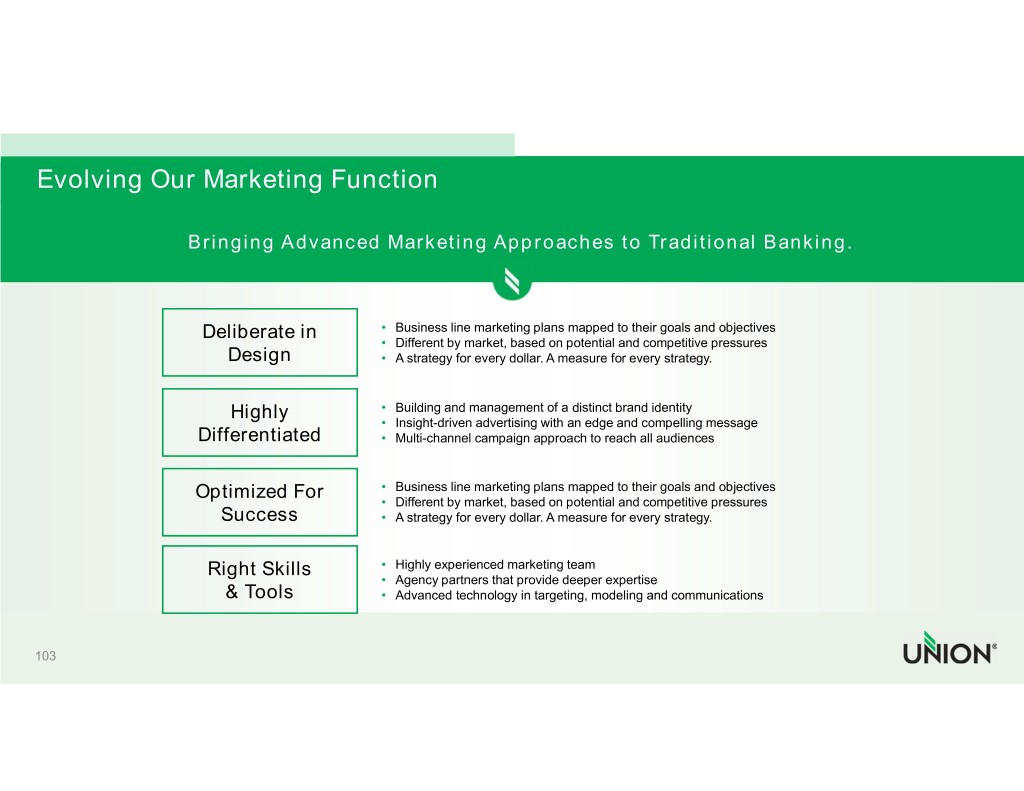
 
 
Evolving Our Marketing Function                           Bringing Advanced Marketing Approaches to Traditional Banking.                              Deliberate in                • Business line marketing plans mapped to their goals and objectives                                                         • Different by market, based on potential and competitive pressures                                Design                   • A strategy for every dollar. A measure for every strategy.                                  Highly                  • Building and management of a distinct brand identity                                                         • Insight-driven advertising with an edge and compelling message                           Differentiated                • Multi-channel campaign approach to reach all audiences                            Optimized For                 • Business line marketing plans mapped to their goals and objectives                                                         • Different by market, based on potential and competitive pressures                               Success                   • A strategy for every dollar. A measure for every strategy.                              Right Skills                • Highly experienced marketing team                                                         • Agency partners that provide deeper expertise                                & Tools                  • Advanced technology in targeting, modeling and communications   103 
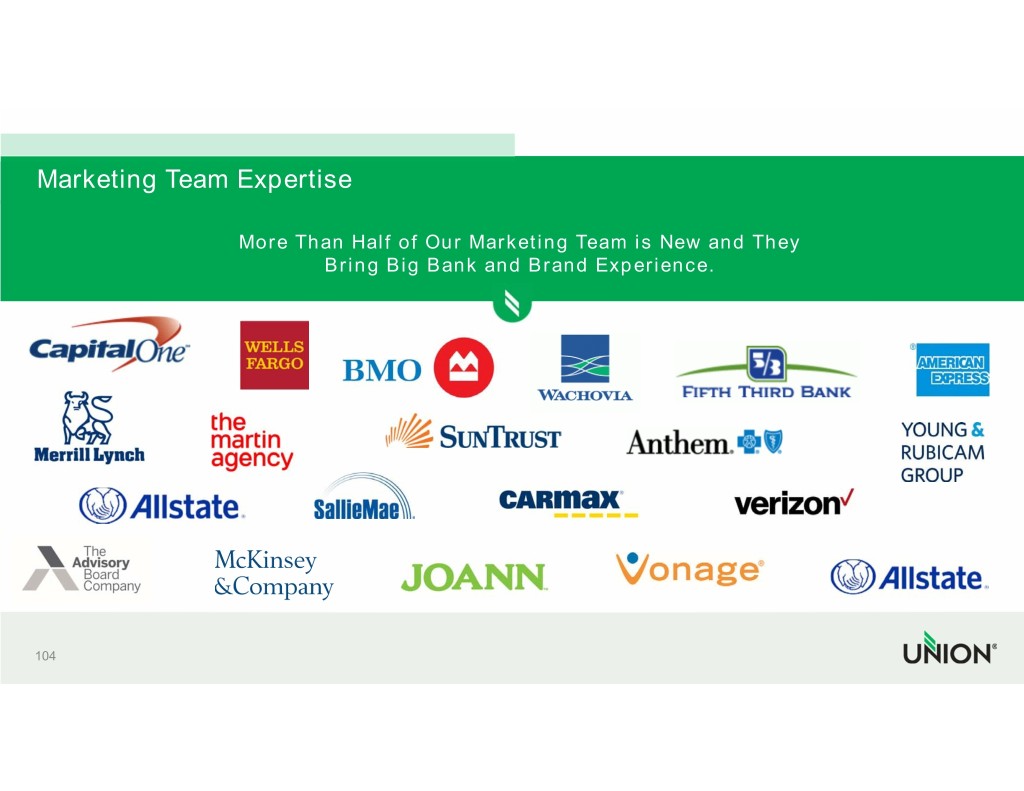
 
 
Marketing Team Expertise                      More Than Half of Our Marketing Team is New and They                               Bring Big Bank and Brand Experience.   104 
 
 
Agency Partner Expansion                       Deeper Capabilities Are Coming From Expanding Our                                     Agency and Partner Pool.             Pre-2017                                          Current   105 
 
 
Our Marketing Agenda Starts with the Union Brand                                                  “A brand is a promise that when kept                                                 creates preference.”                                                         - Peter Sealey, Ph.D.                                                         author, Consultant and former CMO, Coca-Cola                                           We make banking easy.   106 
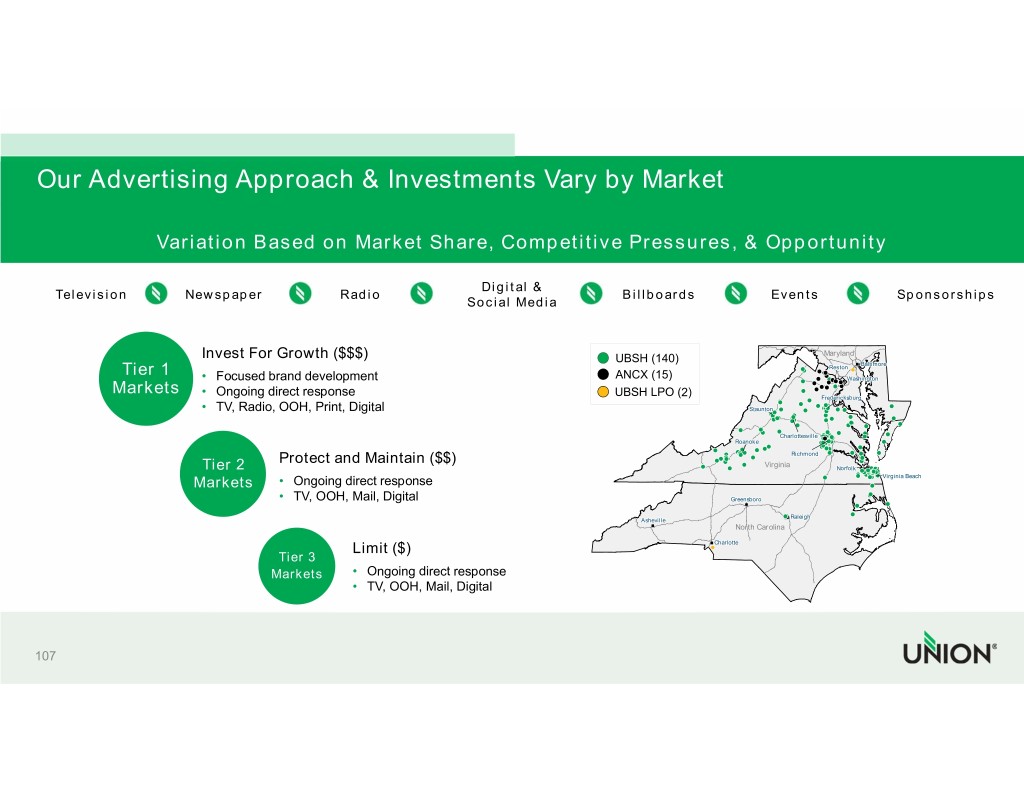
 
 
 Our Advertising Approach & Investments Vary by Market                                                       Variation Based on Market Share, Competitive Pressures, & Opportunity                                                                                                                                                                                                  Digital &          Television                                              Newspaper                                                         Radio                                                                                                                     Billboards                                                      Events                                                Sponsorships                                                                                                                                                                                           Social Media                                                                           Invest For Growth ($$$)                                                                                                                                                           UBSH (140)                                                                                Maryland                                                                                                                                                                                                                                                                                                                                                                    BaltimoreBaltimore                                                                                                                                                                                                                                                                                                                                                      RestonReston                                                                                                                                                                                                                                                                                                                                                                                      Tier 1                                                                                                                                                                                                                                                                                                                                                                               •     Focused brand development                                                                                                                                                   ANCX (15)                                                                                       Washington                                                                                                                                                                                                                                                                                                                                                                                                                                                                                                                                                                                                                                                                                                                                           Markets                                                                                                                                                                                                                                                                                                                                                                              •     Ongoing direct response                                                                                                                                                    UBSH LPO (2)                                                                             FredericksburgFredericksburg                                                                                                                                                                                                                                                                                                                                                                                                                                                                                                                                                                                                                                                                                                                                                                                                                                                                                                                                                                                                                StauntonStaunton                                                                                                                •     TV, Radio, OOH, Print, Digital                                                                                                                                                                                                                                                                                                                                                                                                                                                                                                                                                                                                                                                                                                                                                                                                                                                                                                                                                                                                                                                                                                                                                                                                                                                                                                                                                                                                                                                                                                                                                                                                                                                                                                                                                                                                                                                                                                                                                                                                                                                                                                                                                                                                                                                                                                                                                                                                                                                                                                                                                                                                                                                                                                                                                                  CharlottesvilleCharlottesville                                                                                                                                                                                                                                                                                                                                                                                                                                                                                                                                                                                                                                                                                  RoanokeRoanoke                                                                                                                                                                                                                                                                                                                                                                                                                                                                                                                                                                                                                                                                                                                                                                                                                                                                                                                                                                                                                                                                                                      RichmondRichmond                                                                                                                                                                                                                                                                                                                                                                                                                                                                                                                                                                                                                                                                                                                                                                                                                                                      Protect and Maintain ($$)                                                                                                                                                                                                                                                                                                                                                                                                                                                                                                                                                     Virginia                       NorfolkNorfolk                                                                         Tier 2                                                                                                                                                                                                                                                                        NorfolkNorfolk                                                                                                                                                                                                                                                                                                                                                                                                                                                                                                                                                                                                                                                                                                                                       VirginiaVirginia  BeachBeach                                                                     Markets                              •     Ongoing direct response                                                                                                                                                                                                                                                                                                                                                                                                                                                                                                                                                                                                                                                                                                                  •     TV, OOH, Mail, Digital                                                                                                                                                                      Greensboro                                                                                                                                                                                                                                                                                                                                                                                                                                                                                                                                                                                                                                                                                                                   Raleigh                                                                                                                                                                                                                                                                                       AshevilleAsheville                                               Raleigh                                                                                                                                                                                                                                                                                                              North Carolina                                                                                                                                          Limit ($)                                                                                                                                                  Charlotte                                                                                                          Tier 3                                                                                                        Markets                            •     Ongoing direct response                                                                                                                                          •     TV, OOH, Mail, Digital   107 
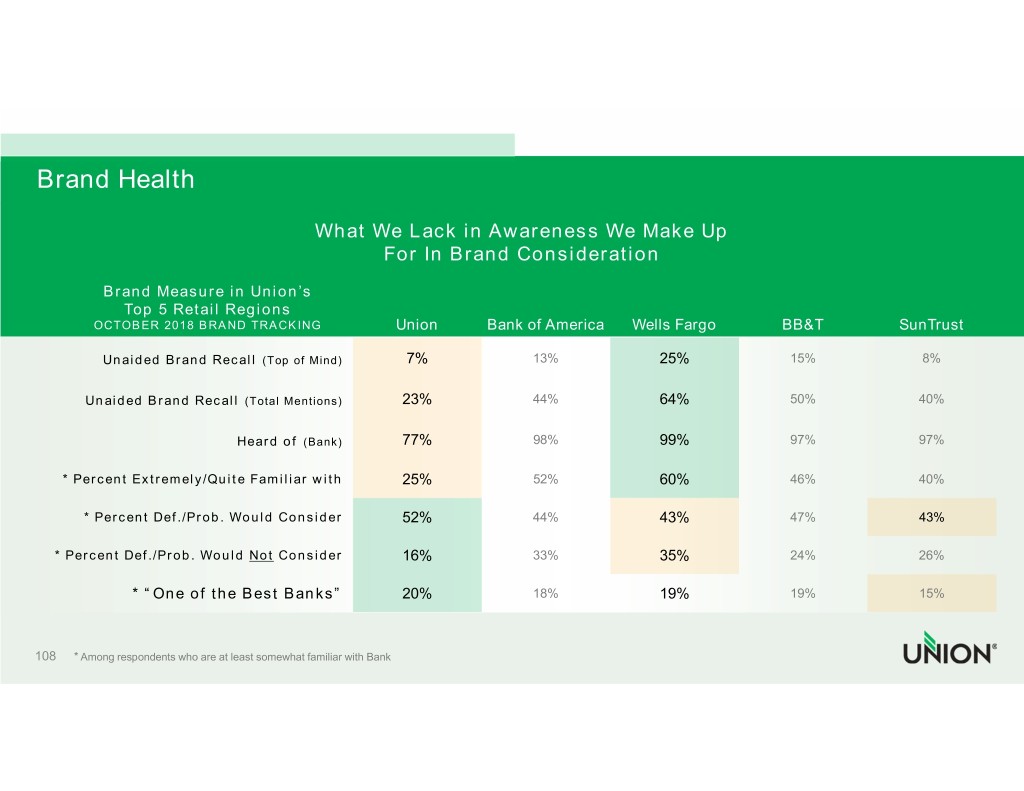
 
 
Brand Health                                               What We Lack in Awareness We Make Up                                                          For In Brand Consideration             Brand Measure in Union’s                Top 5 Retail Regions           OCTOBER 2018 BRAND TRACKING                     Union          Bank of America        Wells Fargo             BB&T               SunTrust             Unaided Brand Recall      (Top of Mind)          7%                  13%                  25%                  15%                  8%          Unaided Brand Recall      (Total Mentions)         23%                  44%                  64%                  50%                 40%                                   Heard of  (Bank)          77%                  98%                  99%                  97%                 97%       * Percent Extremely/Quite Familiar with               25%                  52%                  60%                  46%                 40%          * Percent Def./Prob. Would Consider                52%                  44%                  43%                  47%                  43%     * Percent Def./Prob. Would Not Consider                 16%                  33%                  35%                  24%                 26%                  * “One of the Best Banks”                  20%                  18%                  19%                  19%                  15%   108   * Among respondents who are at least somewhat familiar with Bank 
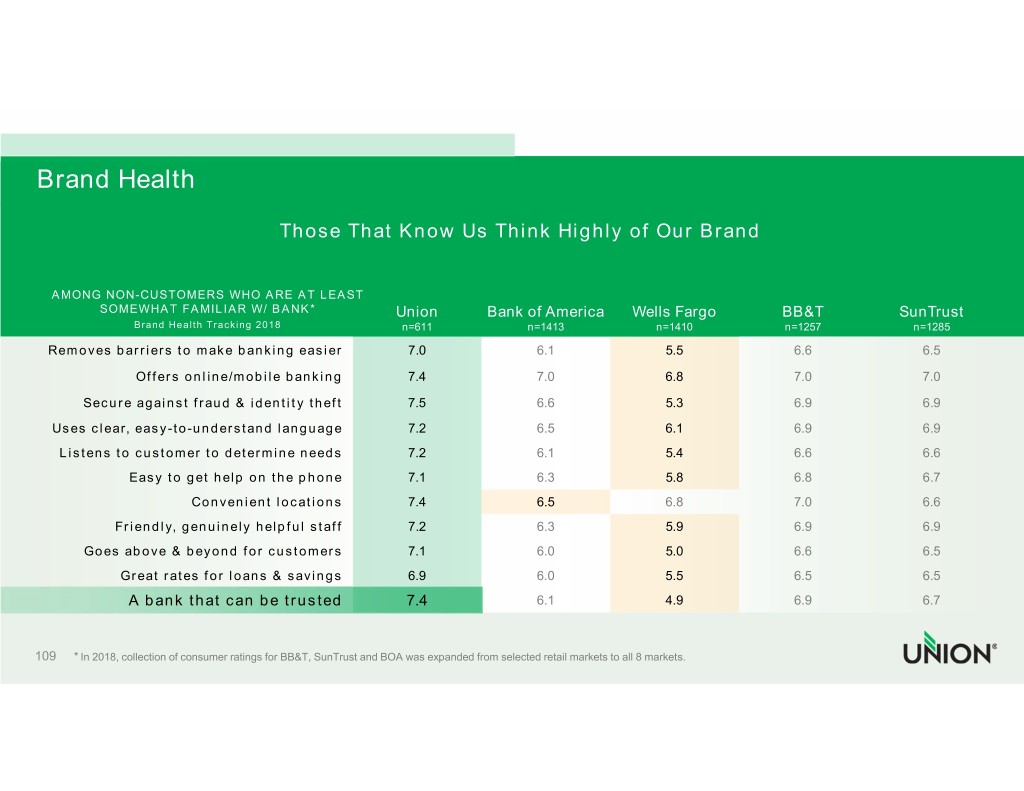
 
 
Brand Health                                         Those That Know Us Think Highly of Our Brand      AMONG NON-CUSTOMERS WHO ARE AT LEAST             SOMEWHAT FAMILIAR W/ BANK*                     Union          Bank of America        Wells Fargo             BB&T               SunTrust                 Brand Health Tracking 2018                 n=611               n=1413               n=1410               n=1257               n=1285   Removes barriers to make banking easier                   7.0                  6.1                  5.5                 6.6                  6.5                  Offers online/mobile banking                7.4                  7.0                  6.8                 7.0                  7.0          Secure against fraud & identity theft               7.5                  6.6                  5.3                 6.9                  6.9    Uses clear, easy-to-understand language                  7.2                  6.5                  6.1                 6.9                  6.9     Listens to customer to determine needs                  7.2                  6.1                  5.4                 6.6                  6.6                Easy to get help on the phone                7.1                  6.3                  5.8                 6.8                  6.7                          Convenient locations               7.4                  6.5                  6.8                 7.0                  6.6              Friendly, genuinely helpful staff              7.2                  6.3                  5.9                 6.9                  6.9         Goes above & beyond for customers                   7.1                  6.0                  5.0                 6.6                  6.5               Great rates for loans & savings               6.9                  6.0                  5.5                 6.5                  6.5                A bank that can be trusted                   7.4                  6.1                  4.9                 6.9                  6.7   109   * In 2018, collection of consumer ratings for BB&T, SunTrust and BOA was expanded from selected retail markets to all 8 markets. 
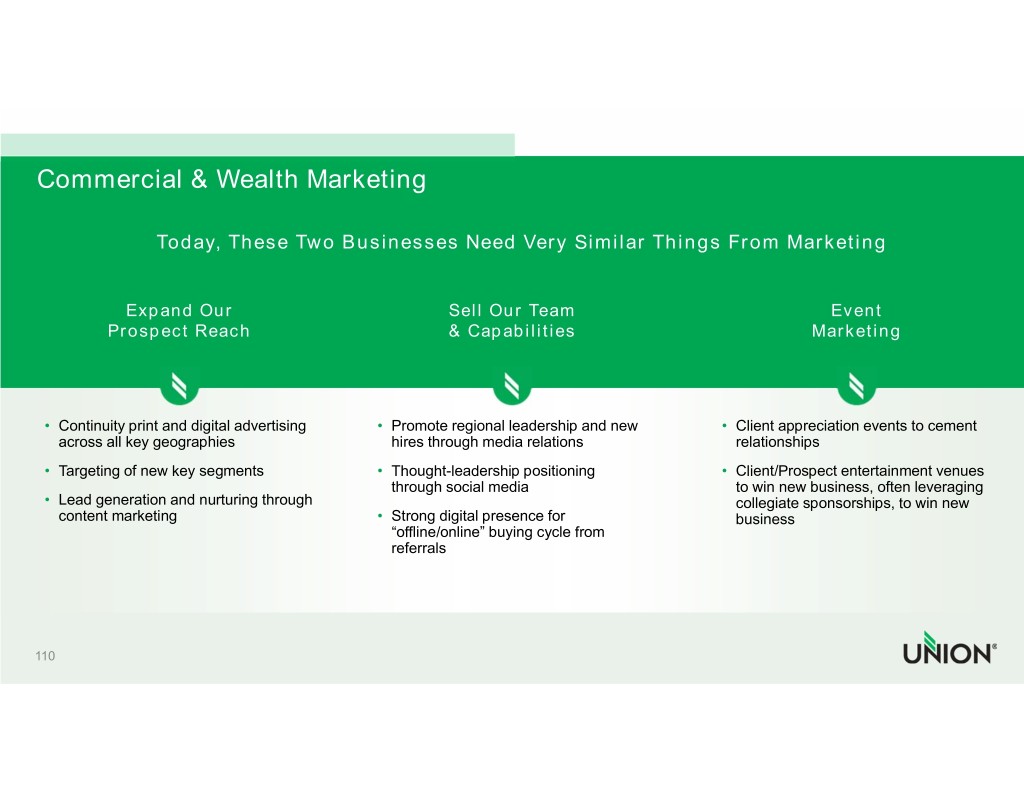
 
 
Commercial & Wealth Marketing                  Today, These Two Businesses Need Very Similar Things From Marketing              Expand Our                               Sell Our Team                                     Event          Prospect Reach                              & Capabilities                                 Marketing    • Continuity print and digital advertising • Promote regional leadership and new       • Client appreciation events to cement     across all key geographies                 hires through media relations               relationships  • Targeting of new key segments            • Thought-leadership positioning            • Client/Prospect entertainment venues                                                through social media                        to win new business, often leveraging   • Lead generation and nurturing through                                                  collegiate sponsorships, to win new     content marketing                        • Strong digital presence for                 business                                               “offline/online” buying cycle from                                                referrals   110 
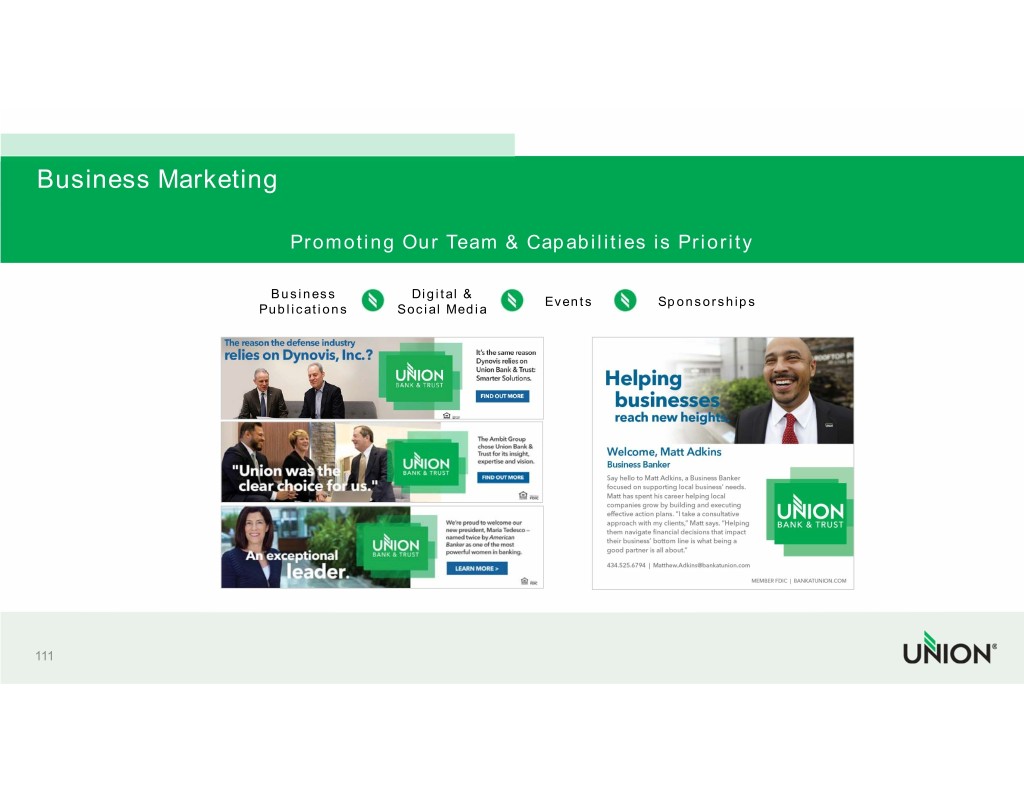
 
 
Business Marketing                                           Promoting Our Team & Capabilities is Priority                                        Business               Digital &                                                                                   Events            Sponsorships                                     Publications          Social Media   111 
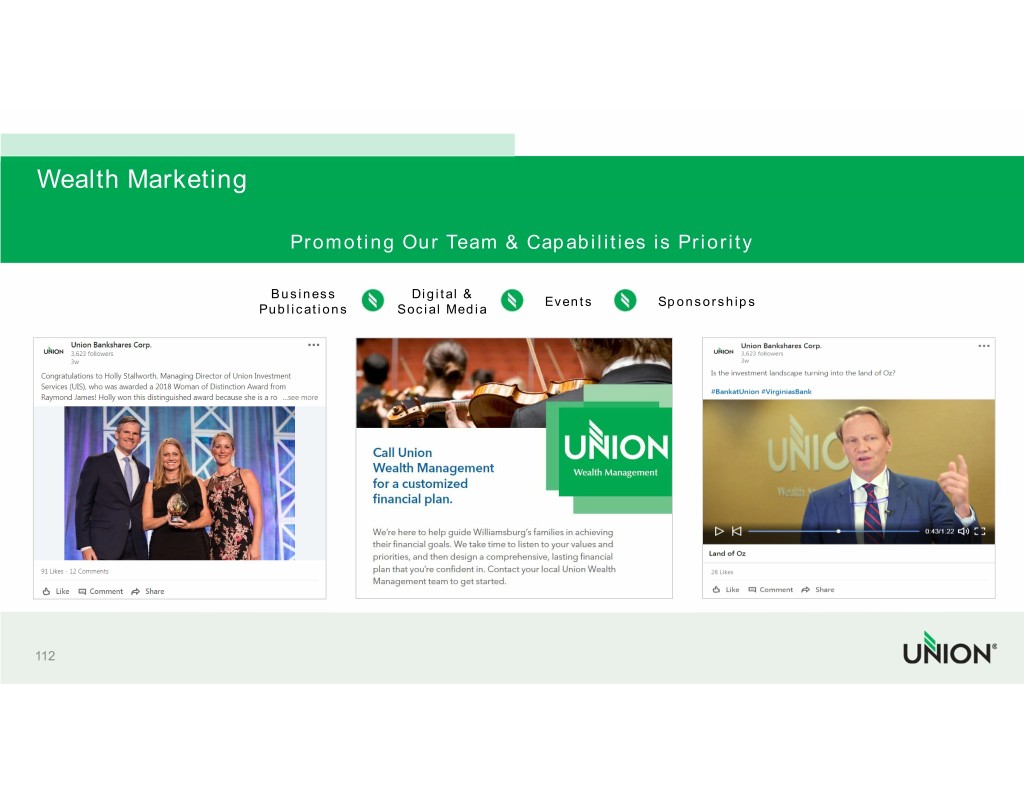
 
 
Wealth Marketing                                           Promoting Our Team & Capabilities is Priority                                        Business               Digital &                                                                                   Events            Sponsorships                                     Publications          Social Media   112 
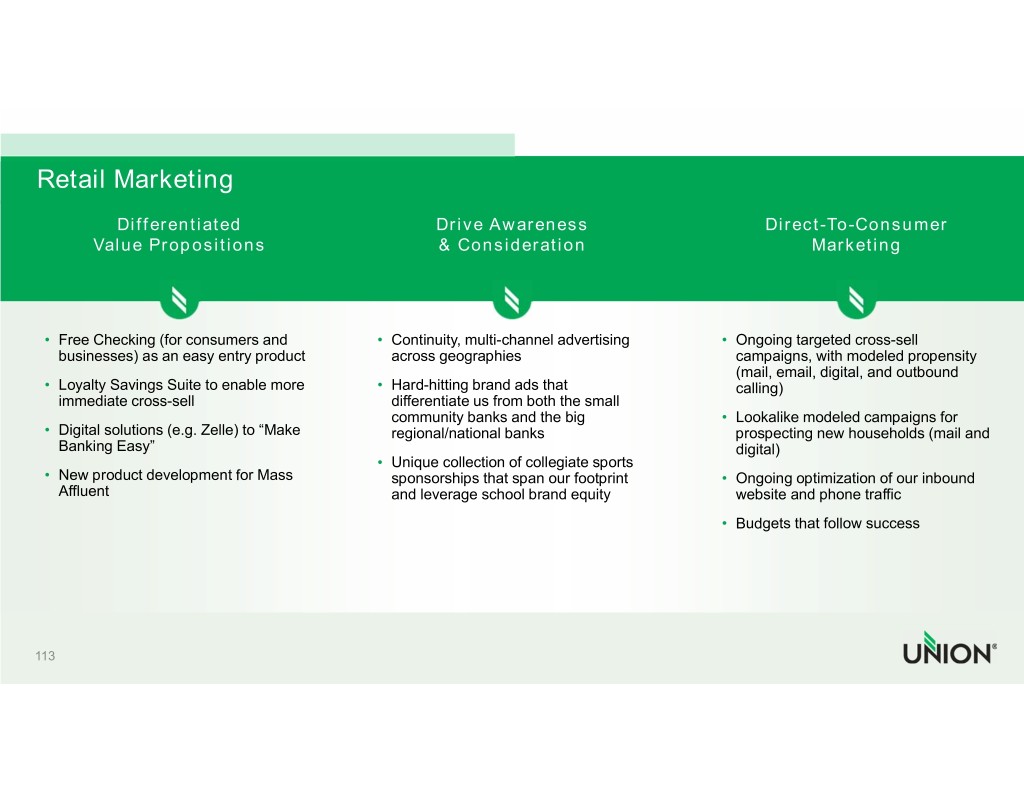
 
 
Retail Marketing             Differentiated                           Drive Awareness                           Direct-To-Consumer         Value Propositions                           & Consideration                                 Marketing    • Free Checking (for consumers and         • Continuity, multi-channel advertising     • Ongoing targeted cross-sell     businesses) as an easy entry product       across geographies                          campaigns, with modeled propensity                                                                                            (mail, email, digital, and outbound   • Loyalty Savings Suite to enable more     • Hard-hitting brand ads that                 calling)    immediate cross-sell                       differentiate us from both the small                                                community banks and the big               • Lookalike modeled campaigns for   • Digital solutions (e.g. Zelle) to “Make    regional/national banks                     prospecting new households (mail and     Banking Easy”                                                                          digital)                                             • Unique collection of collegiate sports   • New product development for Mass           sponsorships that span our footprint      • Ongoing optimization of our inbound     Affluent                                   and leverage school brand equity            website and phone traffic                                                                                         • Budgets that follow success   113 

 
 
Differentiated Advertising 2017/2018                                      Insert video of two TV ads –                                        one from each year.                                     Use animation feature to hold                                       video until I can set it up.   114 
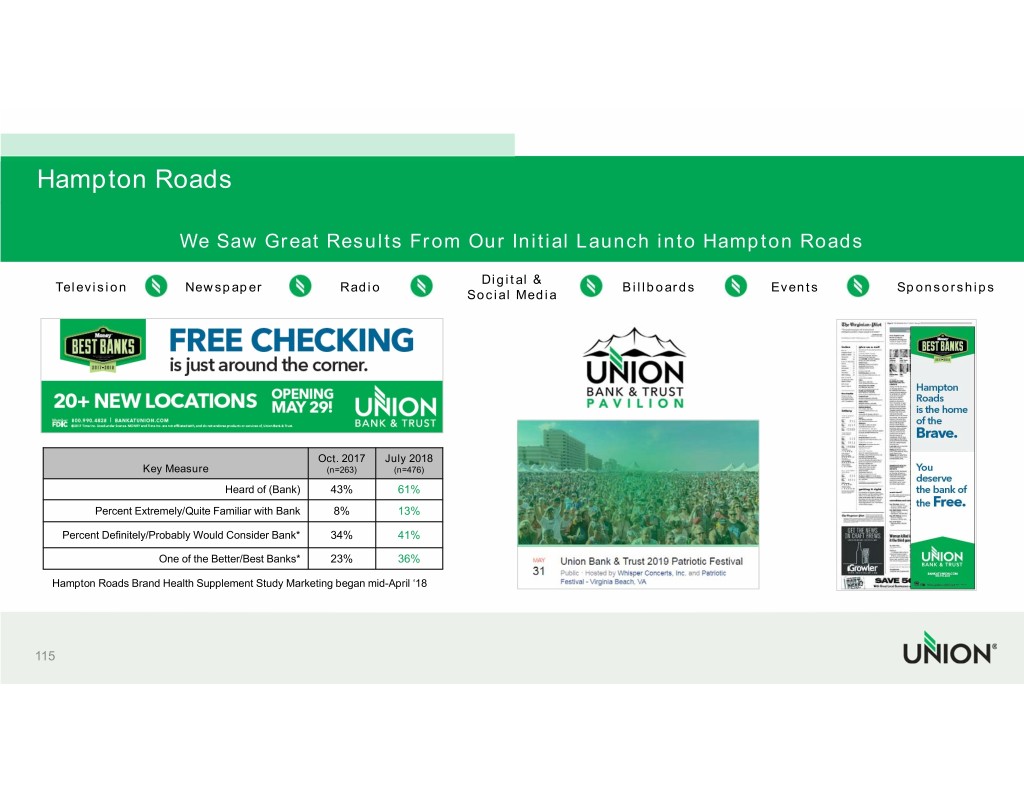
 
 
Hampton Roads                            We Saw Great Results From Our Initial Launch into Hampton Roads                                                                                    Digital &     Television             Newspaper                    Radio                                               Billboards                 Events                  Sponsorships                                                                                Social Media                                                       Oct. 2017   July 2018                     Key Measure                       (n=263)     (n=476)                                    Heard of (Bank)    43%          61%            Percent Extremely/Quite Familiar with Bank  8%          13%       Percent Definitely/Probably Would Consider Bank* 34%          41%                         One of the Better/Best Banks*  23%          36%     Hampton Roads Brand Health Supplement Study Marketing began mid-April ‘18   115 
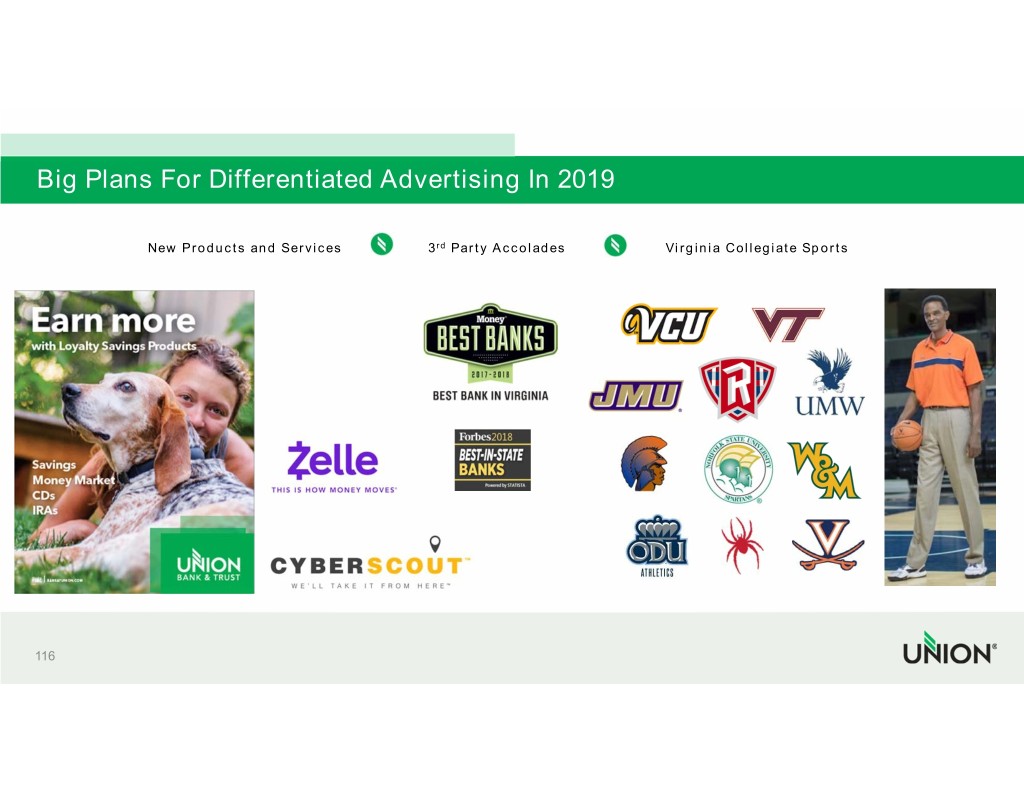
 
 
Big Plans For Differentiated Advertising In 2019                     New Products and Services                    3rd Party Accolades                    Virginia Collegiate Sports   116 
 
 
Our Customer Promise           We make banking easy.    Ready to Bank Better? Bank at   117 

 
 
    Rob Gorman CHIEF FINANCIAL OFFICER 
 
 
Union is Well Positioned Today            Union is financially strong, boasting strong            capital levels, good loan growth, excellent             asset quality, and profitable operations.                                                                  The  acquisition of Xenith Bankshares enabled    us to          The Bank’s statewide franchise offers greater                                                                  efficiently cross   the  $10  Billion  threshold,  and                 convenience for customers.                                                                 combined    with the  pending  acquisition  of Access                                                                 National Corporation, provides    us presence   across                                                                 Virginia, including in the attractive Northern Virginia           Union operates in many attractive markets             and  Hampton   Road  markets, and   also provides C&I        characterized by stable growth, where population         expertise  that  can   be  leveraged   throughout  the           growth is higher than the national average.           combined footprint. Through the mergers, we also now                                                                 have   footholds  in  North  Carolina   and  Maryland                                                                 providing a platform for further expansion.     Management depth and expertise enables Union to have a     sharper strategic focus and excellent execution capabilities.              To achieve competitive differentiation and to deliver sustainable shareholder value, Union will quickly                              capitalize on its advantages and address its strategic priorities. 119 
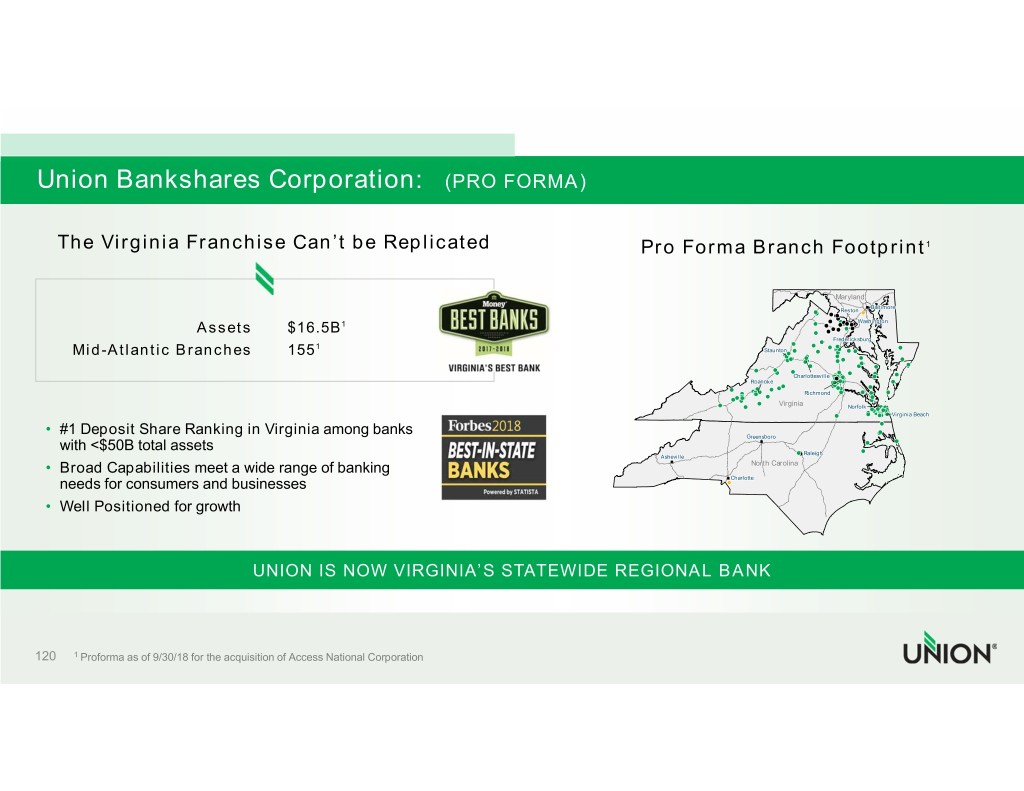
 
 
 Union Bankshares Corporation:   (PRO FORMA)            The Virginia Franchise Can’t be Replicated                                                                                                                                                                                                                 Pro Forma Branch Footprint1                                                                                                                                                                                                                                                                                                                                                            Maryland                                                                                                                                                                                                                                                                                                                                                                        Baltimore                                                                                                                                                                                                                                                                                                                                                           RestonReston                                                                                                                                                                                                                                                                                                                                                                                                                                                                                                                                                                                                                                                                                                                                                                                                                                                                                                                                                                                                                                                                           Washington                                                                                                                                     1                                                                                                                                                                                                                                                                                                                                                                                                                                                                                                                                                                                                                                                    Assets                                 $16.5B                                                                                                                                                                                                                                                                                                                                                                                                                                                                                                                                                                                        FredericksburgFredericksburg                                                                                                                                                                                                                                                                                                                                                                                                                                                                          1                                                                                                                                                                                                                                                                                                                                                                                                                                                                                                                                                                             StauntonStaunton                                                                                                                                                                                                                                                                                                                                                                                                              Mid-Atlantic Branches                                                                        155                                                                                                                                                                                                                                                                                                                                                                                                                                                                                                                                                                                                                                                                                                                                                                                                                                                                                                                                                                                                                                                                                                                                                                                                                                                                                                                                                                                                                                                                                                                                                                                                                                                                                                                                                                                                                                                                                                                                                                                                                                                                                                                                                                                                                                                                                                                                                                                                                                              Charlottesville                                                                                                                                                                                                                                                                                                                                                                                                                                                                                                                                                                                                                                                                                                      Roanoke                                                                                                                                                                                                                                                                                                                                                                                                                                                                                                                                                                                                                                                                                                                                                                                                                                                                                                                                                                                                                                                                                                       Richmond                                                                                                                                                                                                                                                                                                                                                                                                                                                                                                                                                                                                                                                                                                                                                                                                                                                                                                                                                                                                                                                                                                                                                                                                                                                                                                                                                                                                                                                                  Virginia                     Norfolk                                                                                                                                                                                                                                                                                                                                                                                                                                                                                                                                                                                                                                                                                                                                                        VirginiaVirginia  BeachBeach                                                                                                                                                                                                                                                                                                                                                                            VirginiaVirginia  BeachBeach                                                                                                                                                                                                                                                                                                                                                                                  •     #1 Deposit Share Ranking in Virginia                                                                             among banks                                                                                                                                                                                                                                                                                                                                                                                                                                                                                                                                                      Greensboro                                                                                                                                                                                                                                                                                                                                                                                              with <$50B total assets                                                                                                                                                                                                                                                                                                                                                                                                                                                                                                                                                                                                                                                                          Raleigh                                                                                                                                                                                                                                                                                                Asheville                                                   Raleigh      •     Broad Capabilities                                        meet a wide range of banking                                                                                                                                                                                                                   North Carolina            needs for consumers and businesses                                                                                                                                                                                                                                                              Charlotte      •     Well Positioned                                  for growth                                                                                                UNION IS NOW VIRGINIA’S STATEWIDE REGIONAL BANK   120              1 Proforma as of 9/30/18 for the acquisition of Access National Corporation 
 
 
Our Value Proposition                        Shareholder                                                                                                                         Scale                  SOLID DIVIDEND YIELD &            PAYOUT RATIO W/EARNINGS UPSIDE                                                                   LARGEST VA REGIONAL BANK                                                                                                         UNIQUE VALUE IN BRANCH FOOTPRINT                       Opportunity                  COMMITTED TO TOP-TIER                        PERFORMANCE                                                                                    Strength                                                                                                          BALANCE SHEET & CAPITAL LEVELS                                                                           Growth                                                                 ORGANIC & ACQUISITION                                                                       OPPORTUNITIES   121 
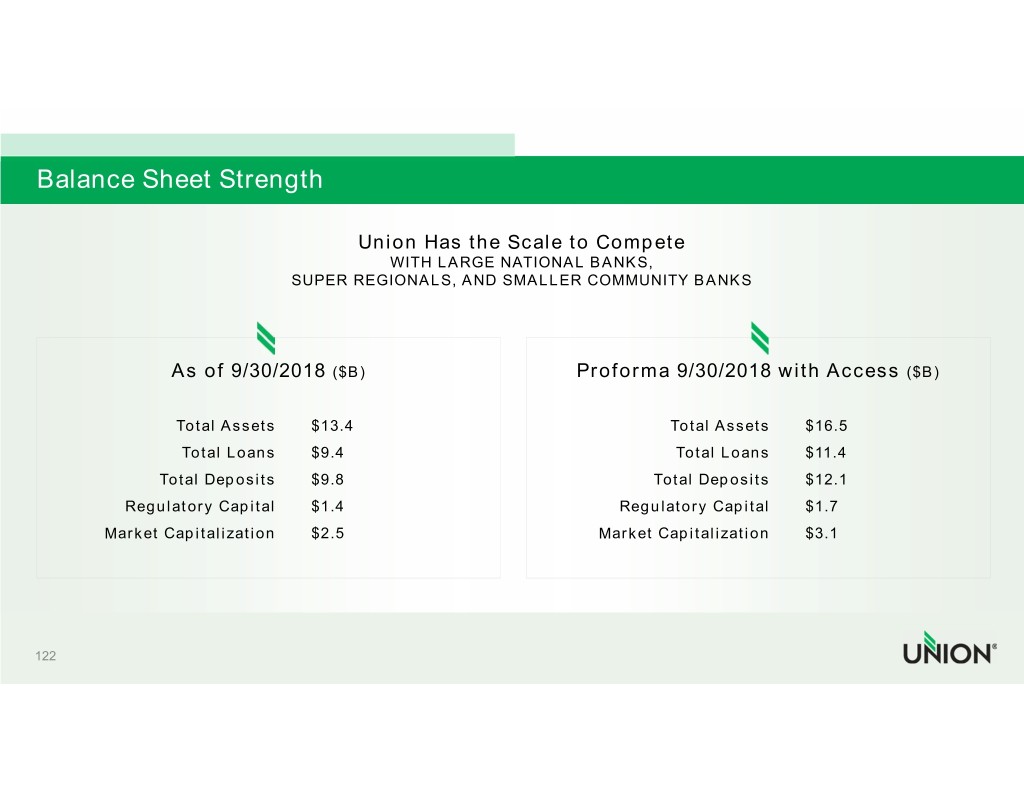
 
 
Balance Sheet Strength                                            Union Has the Scale to Compete                                               WITH LARGE NATIONAL BANKS,                                  SUPER REGIONALS, AND SMALLER COMMUNITY BANKS                      As of 9/30/2018 ($B)                                Proforma 9/30/2018 with Access ($B)                    Total Assets      $13.4                                         Total Assets     $16.5                     Total Loans      $9.4                                           Total Loans     $11.4                 Total Deposits      $9.8                                        Total Deposits     $12.1             Regulatory Capital      $1.4                                   Regulatory Capital      $1.7          Market Capitalization      $2.5                                 Market Capitalization     $3.1   122 
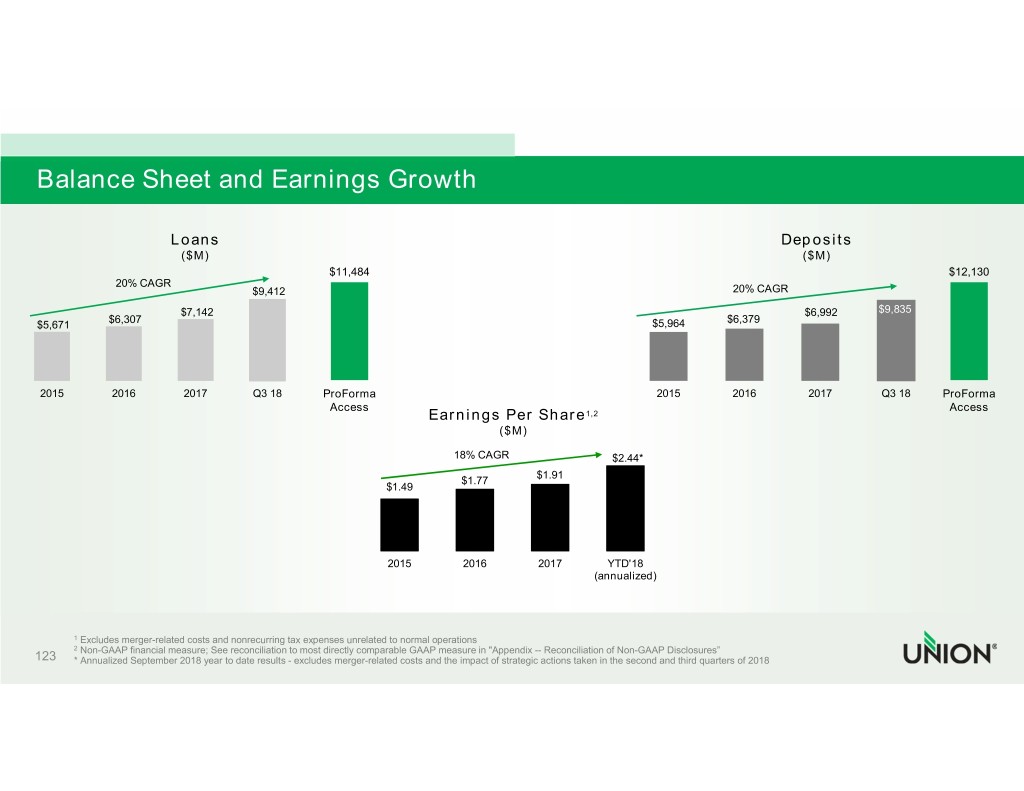
 
 
Balance Sheet and Earnings Growth                               Loans                                                                                                                              Deposits                                ($M)                                                                                                                                  ($M)                                                                $11,484                                                                                                                              $12,130                  20% CAGR                                                $9,412                                                                                                 20% CAGR                                $7,142                                                                                                                                $6,992          $9,835                 $6,307                                                                                                                               $6,379 $5,671                                                                                                                               $5,964    2015           2016            2017           Q3 18          ProForma                                                               2015             2016            2017            Q3 18        ProForma                                                                Access                                                                                                                               Access                                                                                     Earnings Per Share1,2                                                                                                     ($M)                                                                                            18% CAGR                          $2.44*                                                                                                             $1.91                                                                                             $1.77                                                                            $1.49                                                                               2015            2016            2017           YTD'18                                                                                                                         (annualized)           1 Excludes merger-related costs and nonrecurring tax expenses unrelated to normal operations         2 Non-GAAP financial measure; See reconciliation to most directly comparable GAAP measure in "Appendix -- Reconciliation of Non-GAAP Disclosures” 123     * Annualized September 2018 year to date results - excludes merger-related costs and the impact of strategic actions taken in the second and third quarters of 2018 
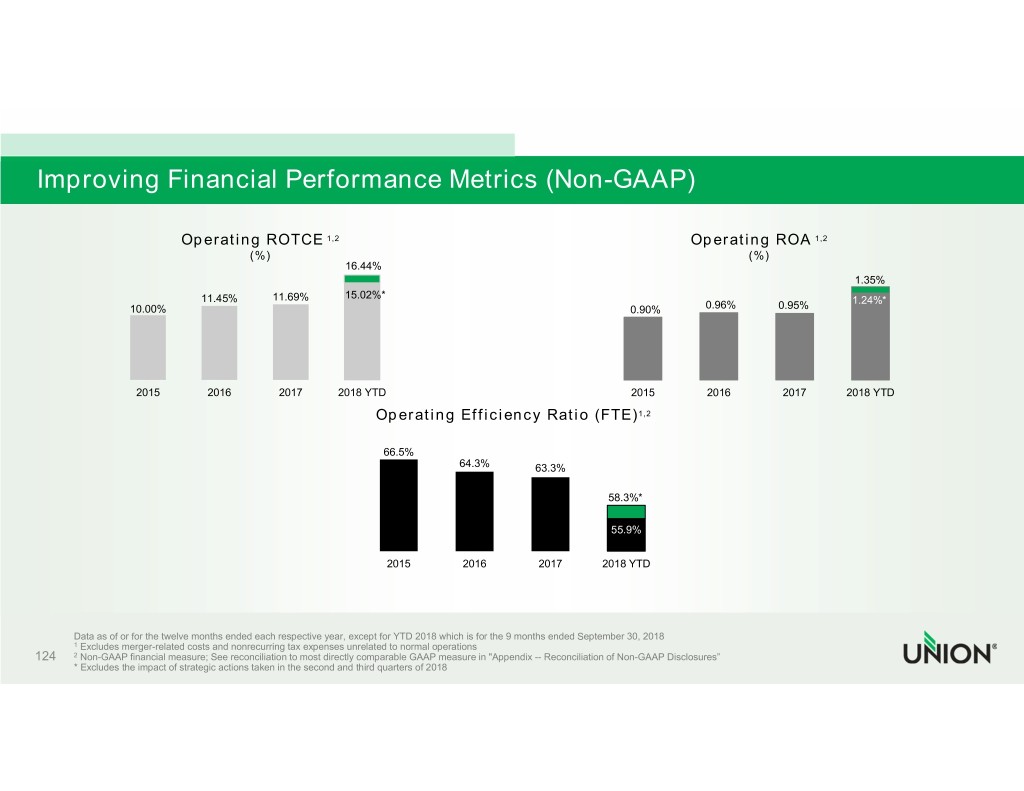
 
 
Improving Financial Performance Metrics (Non-GAAP)                                  Operating ROTCE                 1,2                                                                           Operating ROA             1,2                                               (%)                                                                                                        (%)                                                                    16.44%                                                                                                                                                                                 1.35%                                     11.45%         11.69%          15.02%*                                                                                                     1.24%*                     10.00%                                                                                                      0.90%           0.96%           0.95%                         2015           2016           2017         2018 YTD                                                       2015            2016             2017         2018 YTD                                                                          Operating Efficiency Ratio (FTE)1,2                                                                             66.5%                                                                                            64.3%           63.3%                                                                                                                             58.3%*                                                                                                                              55.9%                                                                              2015            2016            2017          2018 YTD           Data as of or for the twelve months ended each respective year, except for YTD 2018 which is for the 9 months ended September 30, 2018         1 Excludes merger-related costs and nonrecurring tax expenses unrelated to normal operations 124     2 Non-GAAP financial measure; See reconciliation to most directly comparable GAAP measure in "Appendix -- Reconciliation of Non-GAAP Disclosures”         * Excludes the impact of strategic actions taken in the second and third quarters of 2018 
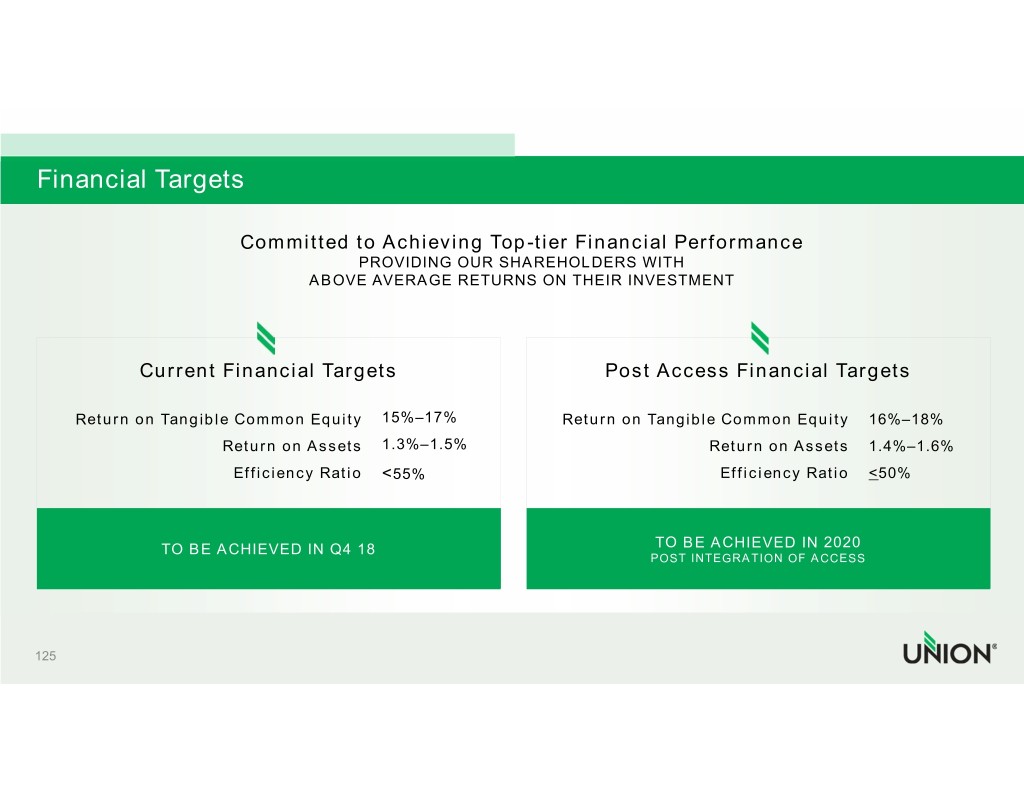
 
 
Financial Targets                            Committed to Achieving Top-tier Financial Performance                                           PROVIDING OUR SHAREHOLDERS WITH                                    ABOVE AVERAGE RETURNS ON THEIR INVESTMENT                Current Financial Targets                                   Post Access Financial Targets       Return on Tangible Common Equity        15%–17%                Return on Tangible Common Equity       16%–18%                         Return on Assets     1.3%–1.5%                                 Return on Assets    1.4%–1.6%                           Efficiency Ratio   <55%                                       Efficiency Ratio   <50%                   TO BE ACHIEVED IN Q4 18                                         TO BE ACHIEVED IN 2020                                                                                POST INTEGRATION OF ACCESS   125 
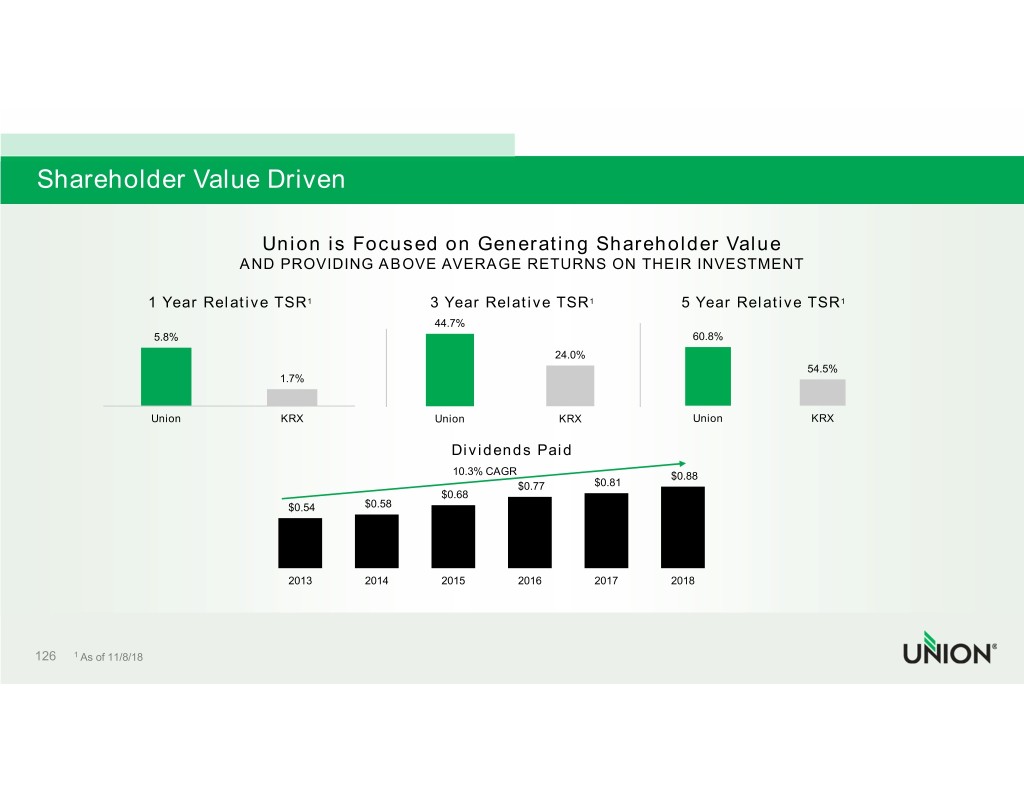
 
 
Shareholder Value Driven                                            Union is Focused on Generating Shareholder Value                                       AND PROVIDING ABOVE AVERAGE RETURNS ON THEIR INVESTMENT                       1 Year Relative TSR1                                3 Year Relative TSR1                          5 Year Relative TSR1                                                                          44.7%                       5.8%                                                                                               60.8%                                                                                                 24.0%                                                                                                                                               54.5%                                              1.7%                       Union                   KRX                         Union                  KRX                      Union                 KRX                                                                               Dividends Paid                                                                               10.3% CAGR                              $0.88                                                                                           $0.77         $0.81                                                                             $0.68                                                 $0.54         $0.58                                                   2013          2014          2015          2016          2017          2018   126    1 As of 11/8/18 
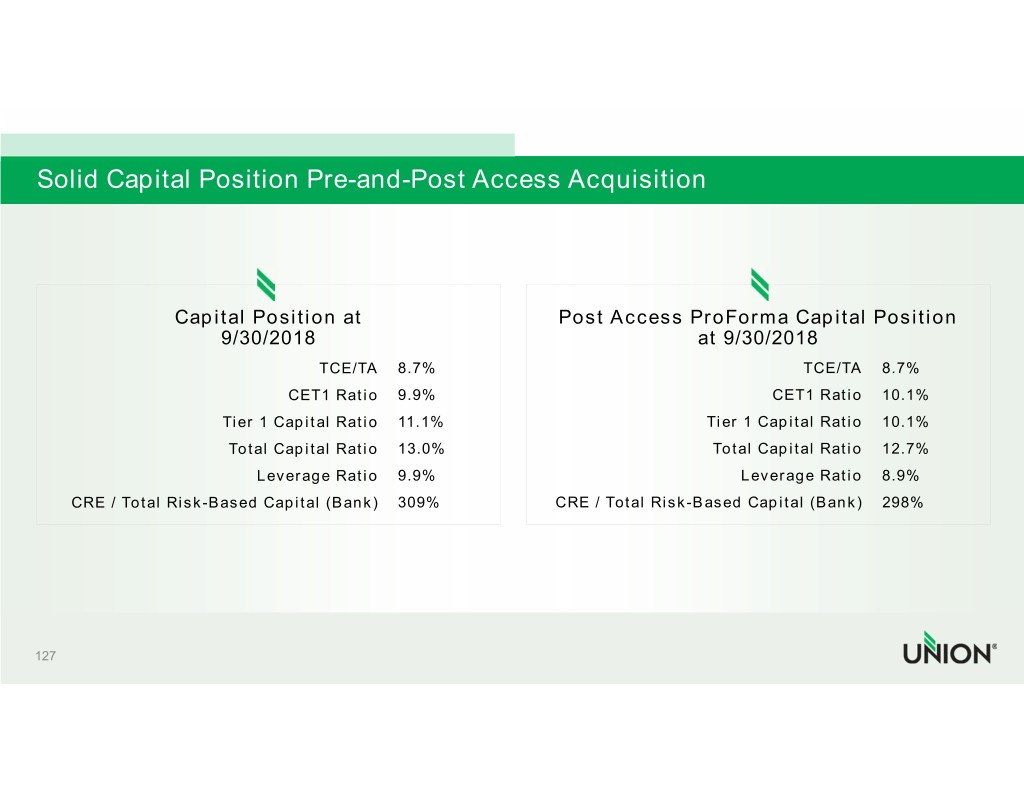
 
 
Solid Capital Position Pre-and-Post Access Acquisition                     Capital Position at                              Post Access ProForma Capital Position                          9/30/2018                                                    at 9/30/2018                                      TCE/TA    8.7%                                                TCE/TA    8.7%                                  CET1 Ratio    9.9%                                            CET1 Ratio    10.1%                         Tier 1 Capital Ratio   11.1%                                   Tier 1 Capital Ratio  10.1%                          Total Capital Ratio   13.0%                                   Total Capital Ratio   12.7%                              Leverage Ratio    9.9%                                        Leverage Ratio    8.9%      CRE / Total Risk-Based Capital (Bank)     309%                CRE / Total Risk-Based Capital (Bank)     298%   127 
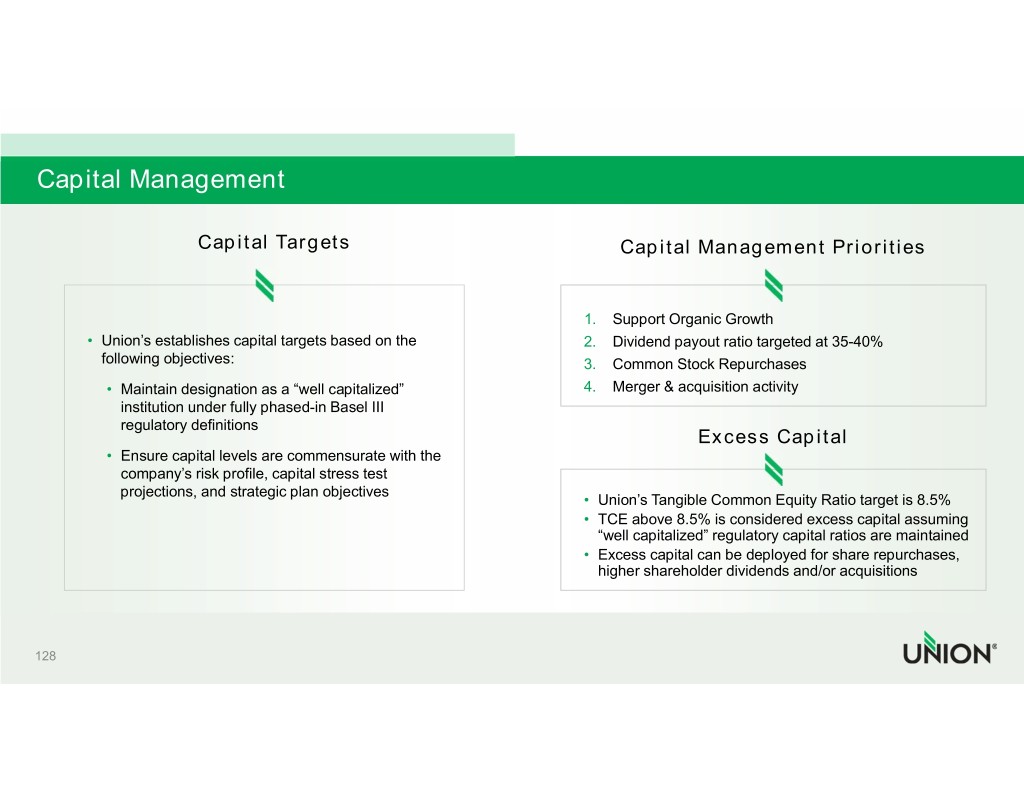
 
 
Capital Management                       Capital Targets                                       Capital Management Priorities                                                                          1. Support Organic Growth        • Union’s establishes capital targets based on the              2. Dividend payout ratio targeted at 35-40%           following objectives:                                         3. Common Stock Repurchases          • Maintain designation as a “well capitalized”                4. Merger & acquisition activity            institution under fully phased-in Basel III             regulatory definitions                                                                                      Excess Capital          • Ensure capital levels are commensurate with the             company’s risk profile, capital stress test             projections, and strategic plan objectives                                                                        • Union’s Tangible Common Equity Ratio target is 8.5%                                                                        • TCE above 8.5% is considered excess capital assuming                                                                           “well capitalized” regulatory capital ratios are maintained                                                                        • Excess capital can be deployed for share repurchases,                                                                           higher shareholder dividends and/or acquisitions   128 
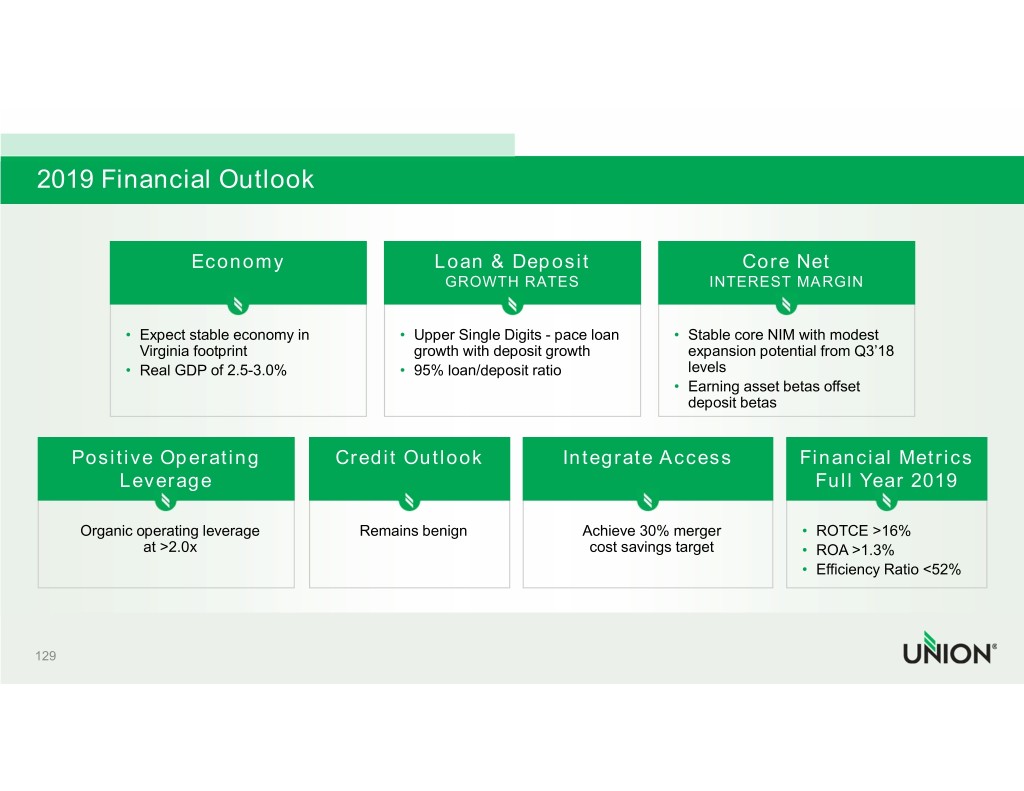
 
 
2019 Financial Outlook                       Economy                        Loan & Deposit                          Core Net                                                      GROWTH RATES                      INTEREST MARGIN              • Expect stable economy in         • Upper Single Digits - pace loan  • Stable core NIM with modest               Virginia footprint                  growth with deposit growth         expansion potential from Q3’18              • Real GDP of 2.5-3.0%             • 95% loan/deposit ratio             levels                                                                                   • Earning asset betas offset                                                                                      deposit betas       Positive Operating                Credit Outlook               Integrate Access               Financial Metrics            Leverage                                                                                  Full Year 2019        Organic operating leverage          Remains benign               Achieve 30% merger          • ROTCE >16%               at >2.0x                                                 cost savings target         • ROA >1.3%                                                                                                    • Efficiency Ratio <52%   129 

 
 
             John Asbury WITH A FINAL MESSAGE BEFORE QUESTIONS 
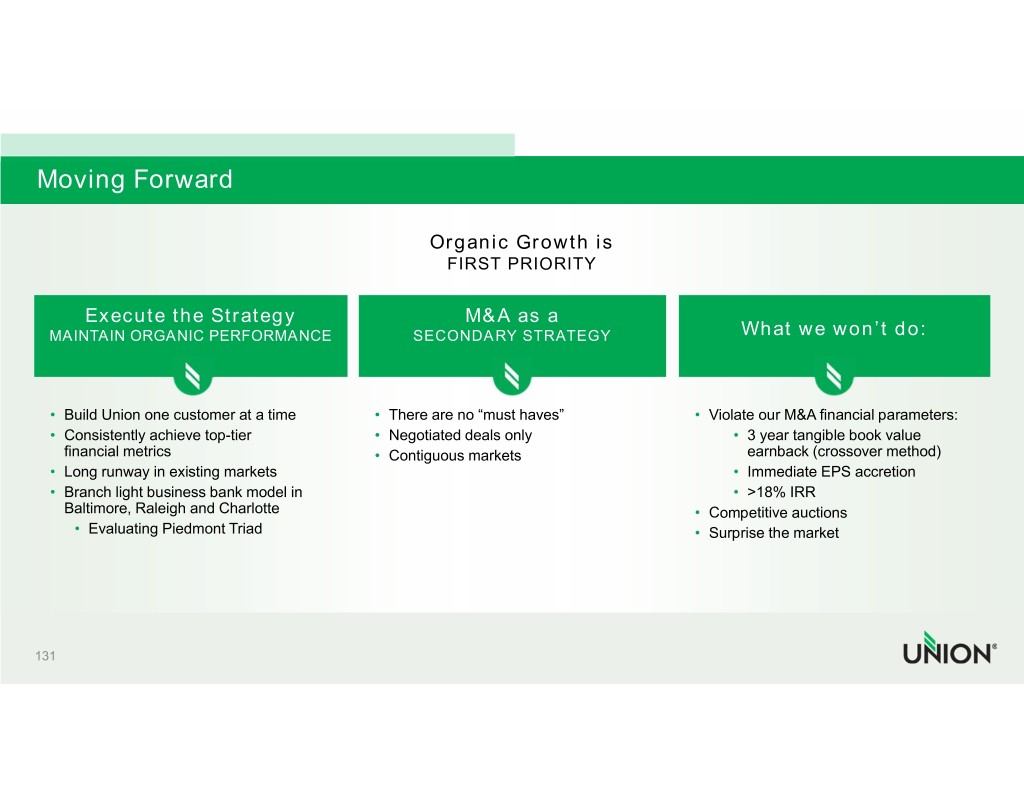
 
 
Moving Forward                                                     Organic Growth is                                                      FIRST PRIORITY        Execute the Strategy                             M&A as a   MAINTAIN ORGANIC PERFORMANCE                   SECONDARY STRATEGY                        What we won’t do:     • Build Union one customer at a time      • There are no “must haves”              • Violate our M&A financial parameters:    • Consistently achieve top-tier           • Negotiated deals only                       • 3 year tangible book value      financial metrics                       • Contiguous markets                            earnback (crossover method)    • Long runway in existing markets                                                       • Immediate EPS accretion    • Branch light business bank model in                                                   • >18% IRR     Baltimore, Raleigh and Charlotte                                                 • Competitive auctions      • Evaluating Piedmont Triad                                                     • Surprise the market   131 
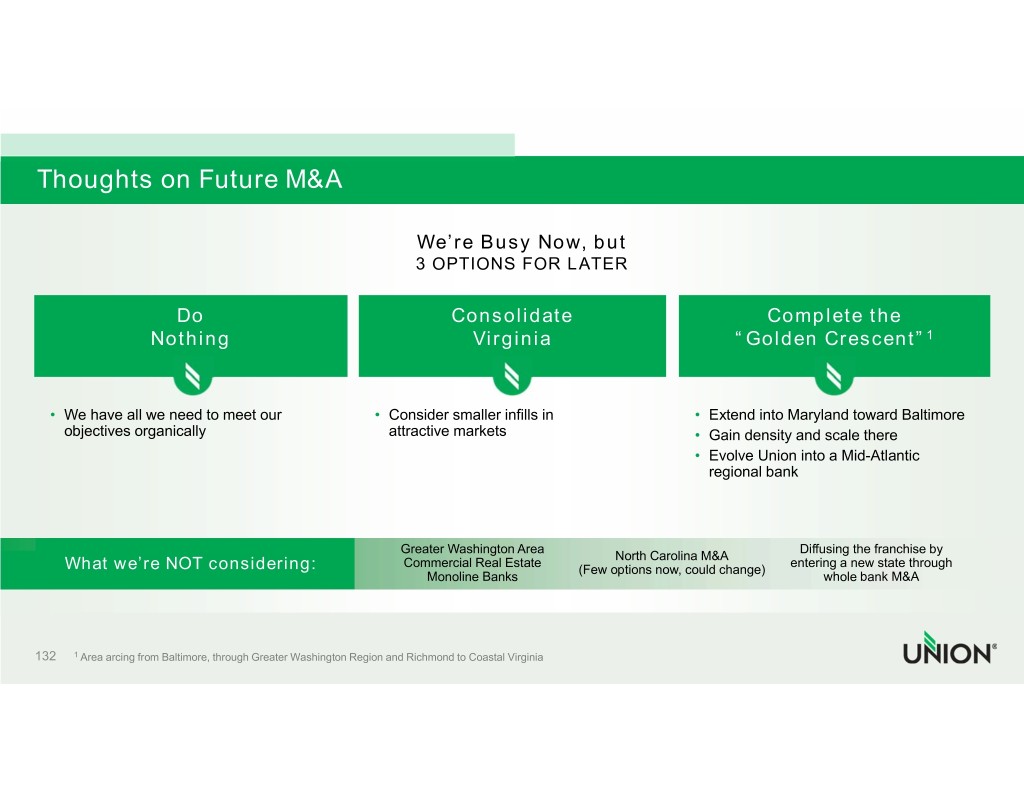
 
 
Thoughts on Future M&A                                                   We’re Busy Now, but                                                  3 OPTIONS FOR LATER                    Do                                  Consolidate                             Complete the                Nothing                                  Virginia                          “Golden Crescent”1     • We have all we need to meet our         • Consider smaller infills in            • Extend into Maryland toward Baltimore      objectives organically                    attractive markets                     • Gain density and scale there                                                                                      • Evolve Union into a Mid-Atlantic                                                                                        regional bank                                                  Greater Washington Area                             Diffusing the franchise by                                                                            North Carolina M&A                                                Commercial Real Estate                            entering a new state through     What we’re NOT considering:                                       (Few options now, could change)                                                   Monoline Banks                                      whole bank M&A   132  1 Area arcing from Baltimore, through Greater Washington Region and Richmond to Coastal Virginia 
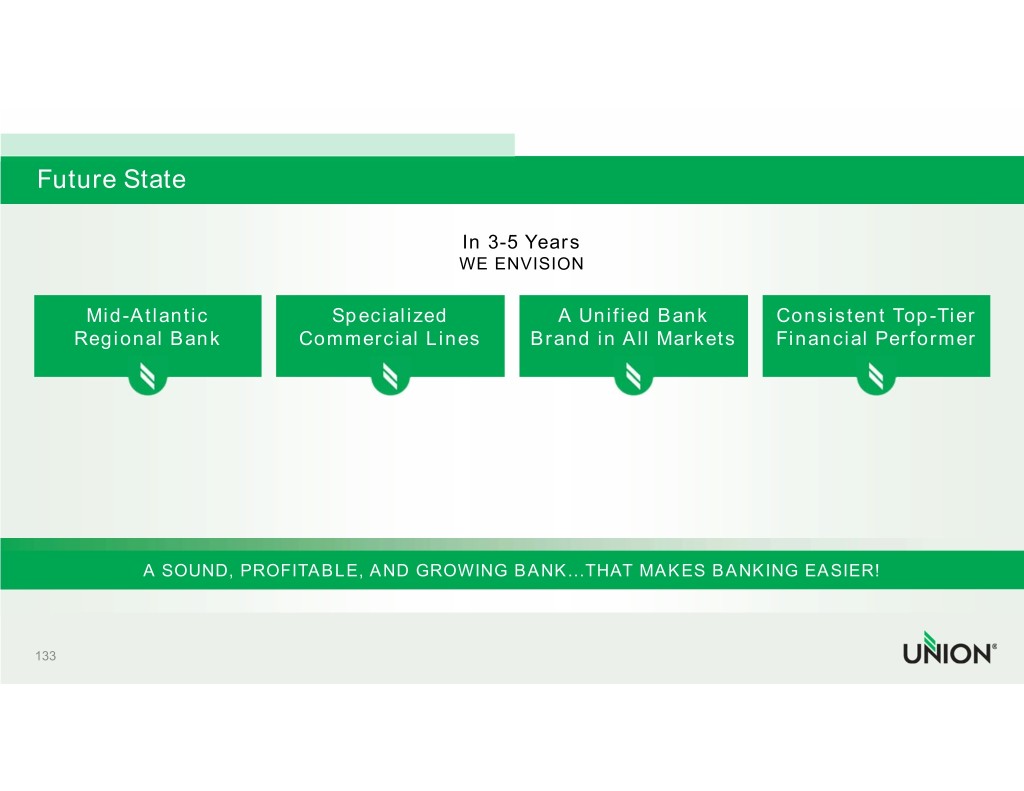
 
 
Future State                                            In 3-5 Years                                           WE ENVISION       Mid-Atlantic            Specialized            A Unified Bank       Consistent Top-Tier     Regional Bank         Commercial Lines       Brand in All Markets    Financial Performer              A SOUND, PROFITABLE, AND GROWING BANK...THAT MAKES BANKING EASIER!   133