
Investor Presentation
6th Annual KBW US Regional Leaders Bank Conference in London
June 12, 2017
Exhibit 99.1
2
Forward Looking Statements
Certain statements in this presentation may constitute “forward-looking statements” within the meaning of the Private Securities
Litigation Reform Act of 1995. Forward-looking statements are statements that include projections, predictions, expectations, or beliefs
about future events or results or otherwise are not statements of historical fact, are based on certain assumptions as of the time they
are made, and are inherently subject to risks and uncertainties, some of which cannot be predicted or quantified. Such statements are
often characterized by the use of qualified words (and their derivatives) such as “expect,” “believe,” “estimate,” “plan,” “project,”
“anticipate,” “intend,” “will,” “may,” “view,” “opportunity,” “potential,” or words of similar meaning or other statements concerning opinions
or judgment of Union Bankshares Corporation (“Union” or “UBSH”) or Xenith Bankshares, Inc. (“Xenith” or “XBKS”) or their
management about future events. Such statements include statements as to the anticipated benefits of the merger, including future
financial and operating results, cost savings and enhanced revenues as well as other statements regarding the merger. Although each
of Union and Xenith believes that its expectations with respect to forward-looking statements are based upon reasonable assumptions
within the bounds of its existing knowledge of its business and operations, there can be no assurance that actual results, performance,
or achievements of Union or Xenith will not differ materially from any projected future results, performance, or achievements expressed
or implied by such forward-looking statements. Actual future results and trends may differ materially from historical results or those
anticipated depending on a variety of factors, including but not limited to: (1) the businesses of Union and Xenith may not be integrated
successfully or such integration may be more difficult, time-consuming or costly than expected; (2) expected revenue synergies and
cost savings from the merger may not be fully realized or realized within the expected time frame; (3) revenues following the merger
may be lower than expected; (4) customer and employee relationships and business operations may be disrupted by the merger; (5)
the ability to obtain required regulatory and shareholder approvals, and the ability to complete the merger on the expected timeframe
may be more difficult, time-consuming or costly than expected; (6) changes in interest rates, general economic conditions, tax rates,
legislative/regulatory changes, monetary and fiscal policies of the U.S. government, including policies of the U.S. Treasury and the
Board of Governors of the Federal Reserve System; the quality and composition of the loan and securities portfolios; demand for loan
products; deposit flows; competition; demand for financial services in the companies’ respective market areas; their implementation of
new technologies; their ability to develop and maintain secure and reliable electronic systems; and accounting principles, policies, and
guidelines, and (7) other risk factors detailed from time to time in filings made by Union or Xenith with the Securities and Exchange
Commission (the “SEC”). Forward-looking statements speak only as of the date they are made and Union and Xenith undertake no
obligation to update or clarify these forward-looking statements, whether as a result of new information, future events or otherwise.
Company Snapshot
3
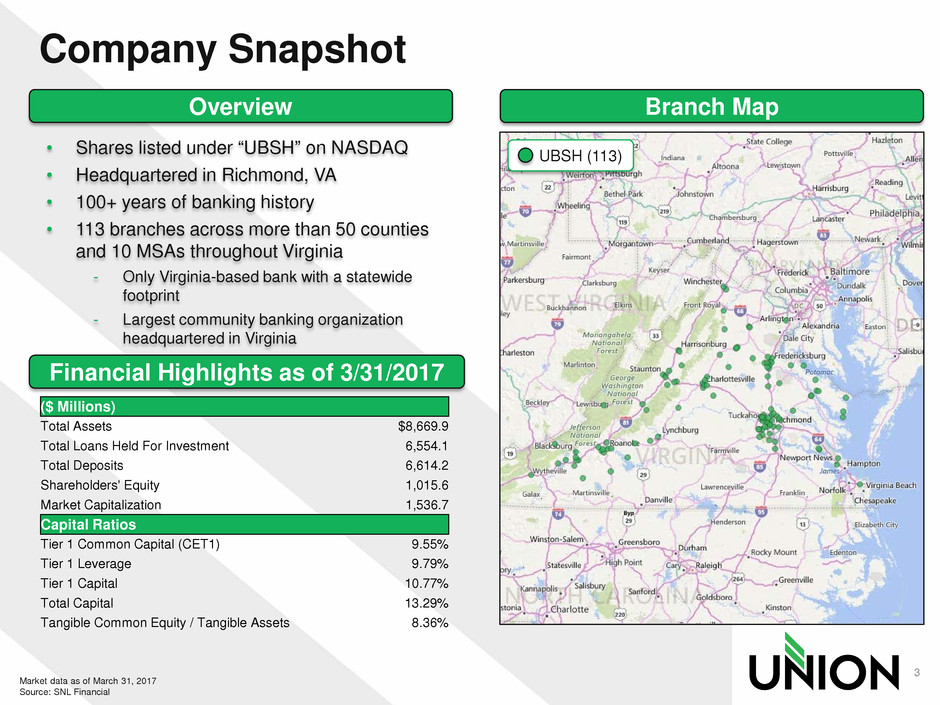
Overview Branch Map
• Shares listed under “UBSH” on NASDAQ
• Headquartered in Richmond, VA
• 100+ years of banking history
• 113 branches across more than 50 counties
and 10 MSAs throughout Virginia
- Only Virginia-based bank with a statewide
footprint
- Largest community banking organization
headquartered in Virginia
Financial Highlights as of 3/31/2017
Market data as of March 31, 2017
Source: SNL Financial
UBSH (113)
($ Millions)
Total Assets $8,669.9
Total Loans Held For Investment 6,554.1
Total Deposits 6,614.2
Shareholders' Equity 1,015.6
Market Capitalization 1,536.7
Capital Ratios
Tier 1 Common Capital (CET1) 9.55%
Tier 1 Leverage 9.79%
Tier 1 Capital 10.77%
Total Capital 13.29%
Tangible Common Equity / Tangible Assets 8.36%
Diversity Supports Growth in Virginia
Richmond
• State Capital
• Fortune 500 headquarters (6)
• Finance and insurance
• VCU & VCU Medical Center
Fredericksburg
• Defense and security
contractors
• Health care
• Retail
• Real Estate development
Charlottesville
• University of Virginia & Medical
College
• High-tech and professional
businesses
• Real Estate development
Northern Virginia
• Nation’s Capital
• Defense and security
contractors
• Associations (lobbyists)
• High tech
Virginia Beach - Norfolk
• Military
• Shipbuilding
• Fortune 500 headquarters (3)
• Tourism
Roanoke - Blacksburg
• Virginia Tech
• Health care
• Retail
• Fortune 500 headquarters (1)
4
Union Bank & Trust Key Statistics
• 113 (-10 in 2016; -1 YTD 2017) Branches
• 1,309 Full Time Equivalent
• 58 Commercial Bankers
• $6.55 billion Loans
• $6.61 billion Deposits
• 178+ thousand Consumer Households
5
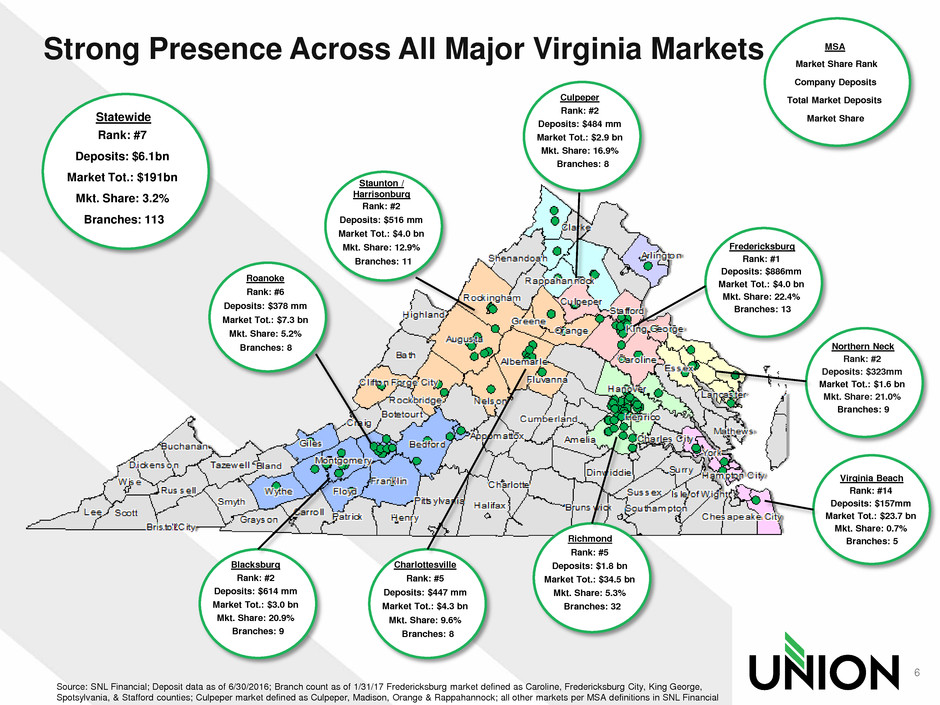
Union is the only Virginia-based bank with a statewide
footprint
MSA
Market Share Rank
Company Deposits
Total Market Deposits
Market Share
Roanoke
Deposits: $378 mm
Market Tot.: $7.3 bn
Mkt. Share: 5.2%
Rank: #6
Branches: 8
Staunton /
Harrisonburg
Rank: #2
Deposits: $516 mm
Market Tot.: $4.0 bn
Mkt. Share: 12.9%
Branches: 11
Blacksburg
Rank: #2
Deposits: $614 mm
Market Tot.: $3.0 bn
Mkt. Share: 20.9%
Branches: 9
Charlottesville
Rank: #5
Deposits: $447 mm
Market Tot.: $4.3 bn
Mkt. Share: 9.6%
Branches: 8
Richmond
Rank: #5
Deposits: $1.8 bn
Market Tot.: $34.5 bn
Mkt. Share: 5.3%
Branches: 32
Culpeper
Rank: #2
Deposits: $484 mm
Market Tot.: $2.9 bn
Mkt. Share: 16.9%
Branches: 8
Fredericksburg
Rank: #1
Deposits: $886mm
Market Tot.: $4.0 bn
Mkt. Share: 22.4%
Branches: 13
Statewide
Rank: #7
Deposits: $6.1bn
Market Tot.: $191bn
Mkt. Share: 3.2%
Branches: 113
Strong Presence Across All Major Virginia Markets
Northern Neck
Rank: #2
Deposits: $323mm
Market Tot.: $1.6 bn
Mkt. Share: 21.0%
Branches: 9
Virginia Beach
Rank: #14
Deposits: $157mm
Market Tot.: $23.7 bn
Mkt. Share: 0.7%
Branches: 5
Source: SNL Financial; Deposit data as of 6/30/2016; Branch count as of 1/31/17 Fredericksburg market defined as Caroline, Fredericksburg City, King George,
Spotsylvania, & Stafford counties; Culpeper market defined as Culpeper, Madison, Orange & Rappahannock; all other markets per MSA definitions in SNL Financial
6
Financial Highlights
7
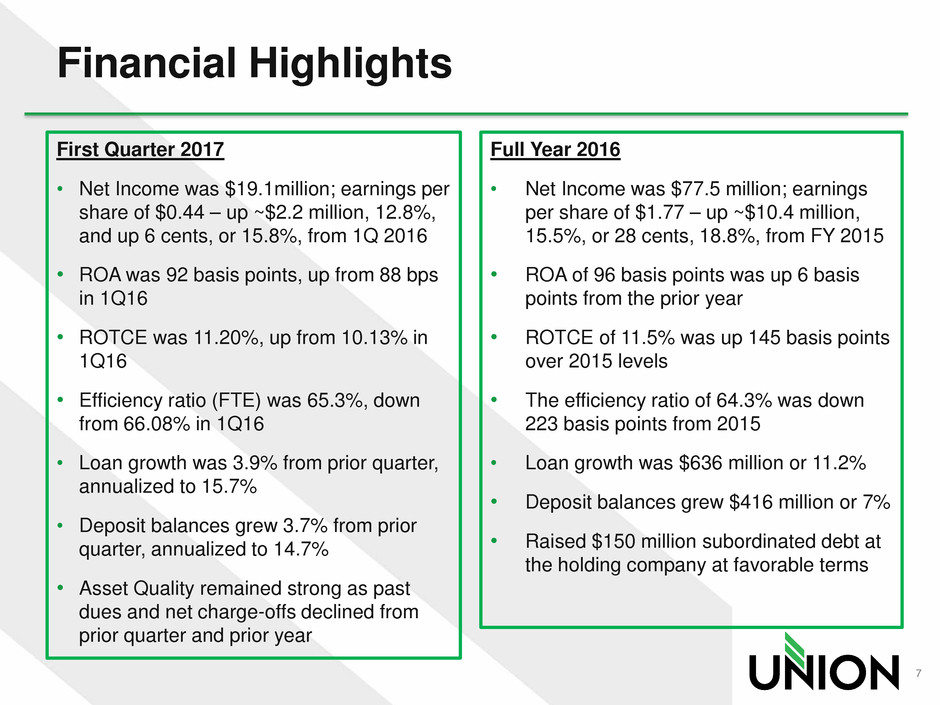
Full Year 2016
• Net Income was $77.5 million; earnings
per share of $1.77 – up ~$10.4 million,
15.5%, or 28 cents, 18.8%, from FY 2015
• ROA of 96 basis points was up 6 basis
points from the prior year
• ROTCE of 11.5% was up 145 basis points
over 2015 levels
• The efficiency ratio of 64.3% was down
223 basis points from 2015
• Loan growth was $636 million or 11.2%
• Deposit balances grew $416 million or 7%
• Raised $150 million subordinated debt at
the holding company at favorable terms
First Quarter 2017
• Net Income was $19.1million; earnings per
share of $0.44 – up ~$2.2 million, 12.8%,
and up 6 cents, or 15.8%, from 1Q 2016
• ROA was 92 basis points, up from 88 bps
in 1Q16
• ROTCE was 11.20%, up from 10.13% in
1Q16
• Efficiency ratio (FTE) was 65.3%, down
from 66.08% in 1Q16
• Loan growth was 3.9% from prior quarter,
annualized to 15.7%
• Deposit balances grew 3.7% from prior
quarter, annualized to 14.7%
• Asset Quality remained strong as past
dues and net charge-offs declined from
prior quarter and prior year
Balance Sheet Trends
8
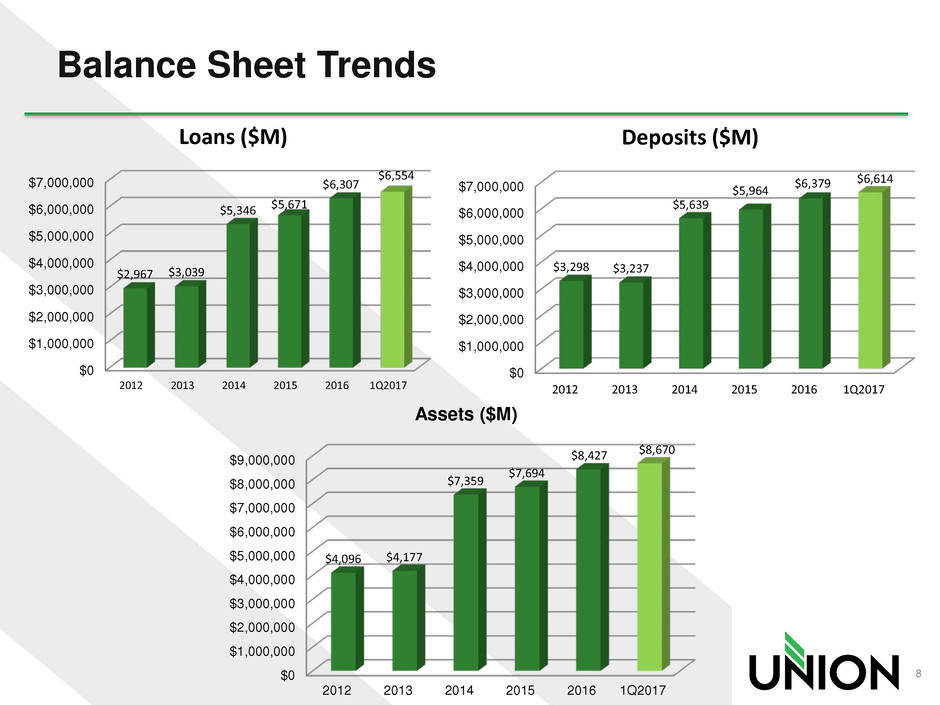
$0
$1,000,000
$2,000,000
$3,000,000
$4,000,000
$5,000,000
$6,000,000
$7,000,000
2012 2013 2014 2015 2016 1Q2017
$3,298 $3,237
$5,639
$5,964
$6,379 $6,614
Deposits ($M)
$0
$1,000,000
$2,000,000
$3,000,000
$4,000,000
$5,000,000
$6,000,000
$7,000,000
2012 2013 2014 2015 2016 1Q2017
$2,967 $3,039
$5,346 $5,671
$6,307
$6,554
Loans ($M)
$0
$1,000,000
$2,000,000
$3,000,000
$4,000,000
$5,000,000
$6,000,000
$7,000,000
$8,000,000
$9,000,000
2012 2013 2014 2015 2016 1Q2017
$4,096 $4,177
$7,359
$7,694
$8,427 $8,670
Assets ($M)
0.00%
2.00%
4.00%
6.00%
8.00%
10.00%
12.00%
14.00%
16.00%
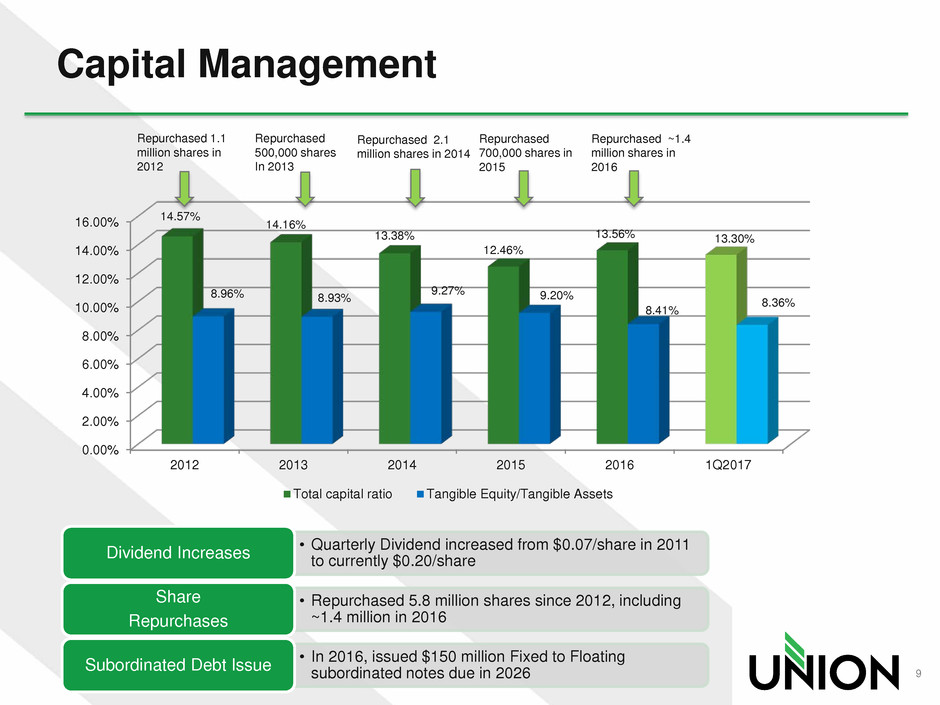
2012 2013 2014 2015 2016 1Q2017
14.57%
14.16%
13.38%
12.46%
13.56% 13.30%
8.96% 8.93%
9.27% 9.20%
8.41%
8.36%
Total capital ratio Tangible Equity/Tangible Assets
Repurchased 1.1
million shares in
2012
Capital Management
9
Repurchased
500,000 shares
In 2013
Repurchased 2.1
million shares in 2014
Repurchased
700,000 shares in
2015
Repurchased ~1.4
million shares in
2016
• Quarterly Dividend increased from $0.07/share in 2011
to currently $0.20/share Dividend Increases
• Repurchased 5.8 million shares since 2012, including
~1.4 million in 2016
Share
Repurchases
• In 2016, issued $150 million Fixed to Floating
subordinated notes due in 2026 Subordinated Debt Issue
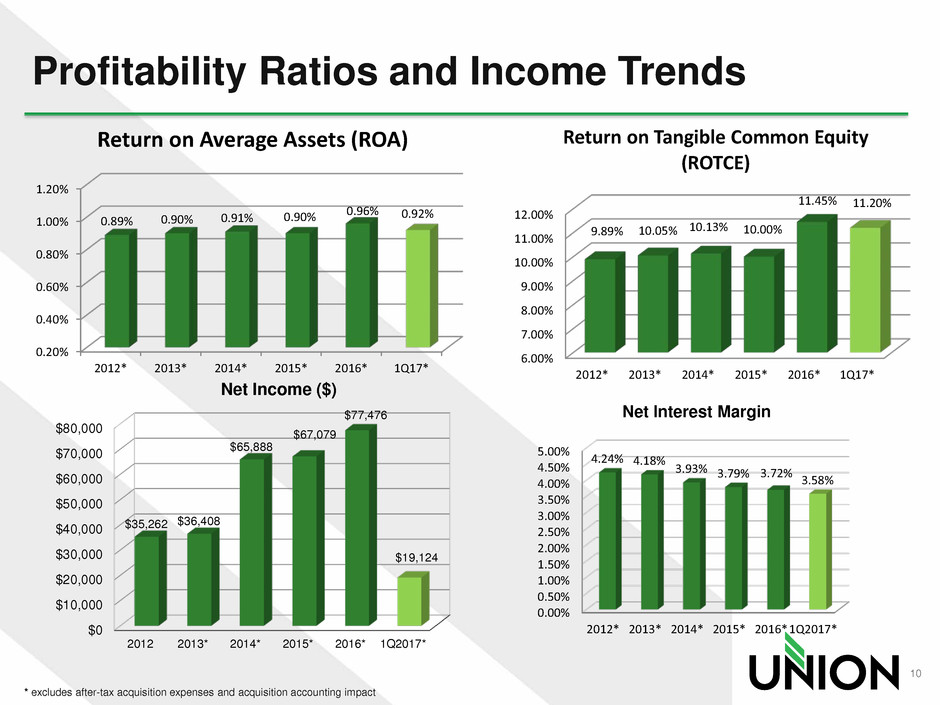
Profitability Ratios and Income Trends
* excludes after-tax acquisition expenses and acquisition accounting impact
10
0.20%
0.40%
0.60%
0.80%
1.00%
1.20%
2012* 2013* 2014* 2015* 2016* 1Q17*
0.89% 0.90% 0.91% 0.90%
0.96% 0.92%
Return on Average Assets (ROA)
6.00%
7.00%
8.00%
9.00%
10.00%
11.00%
12.00%
2012* 2013* 2014* 2015* 2016* 1Q17*
9.89% 10.05% 10.13% 10.00%
11.45% 11.20%
Return on Tangible Common Equity
(ROTCE)
0.00%
0.50%
1.00%
1.50%
2.00%
2.50%
3.00%
3.50%
4.00%
4.50%
5.00%
2012* 2013* 2014* 2015* 2016*1Q2017*
4.24% 4.18%
3.93% 3.79% 3.72% 3.58%
Net Interest Margin
$0
$10,000
$20,000
$30,000
$40,000
$50,000
$60,000
$70,000
$80,000
2012 2013* 2014* 2015* 2016* 1Q2017*
$35,262 $36,408
$65,888
$67,079
$77,476
$19,124
Net Income ($)
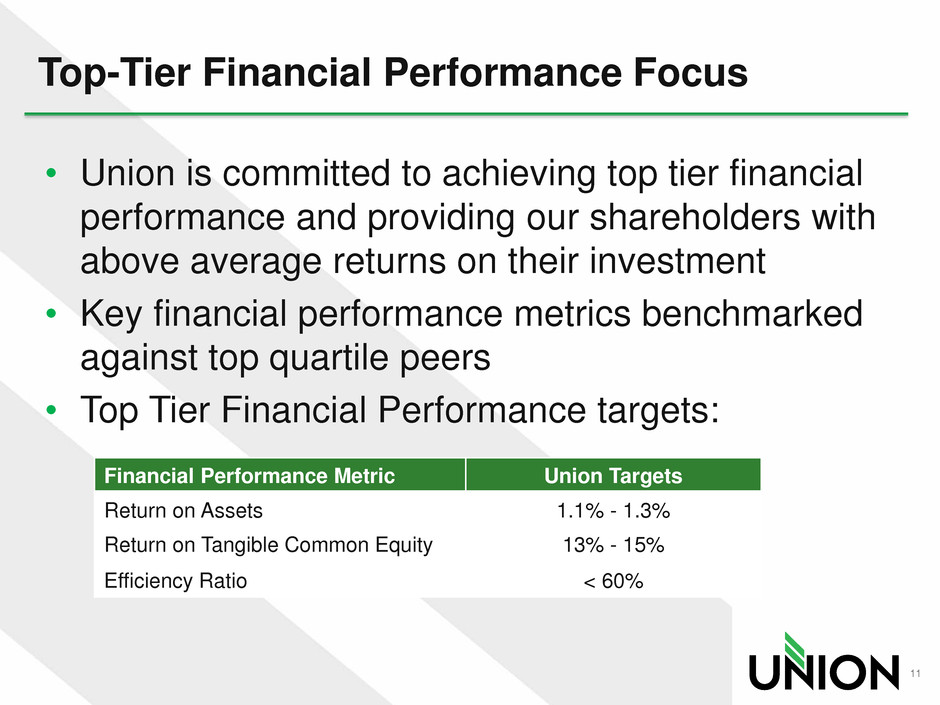
Top-Tier Financial Performance Focus
• Union is committed to achieving top tier financial
performance and providing our shareholders with
above average returns on their investment
• Key financial performance metrics benchmarked
against top quartile peers
• Top Tier Financial Performance targets:
11
Financial Performance Metric Union Targets
Return on Assets 1.1% - 1.3%
Return on Tangible Common Equity 13% - 15%
Efficiency Ratio < 60%
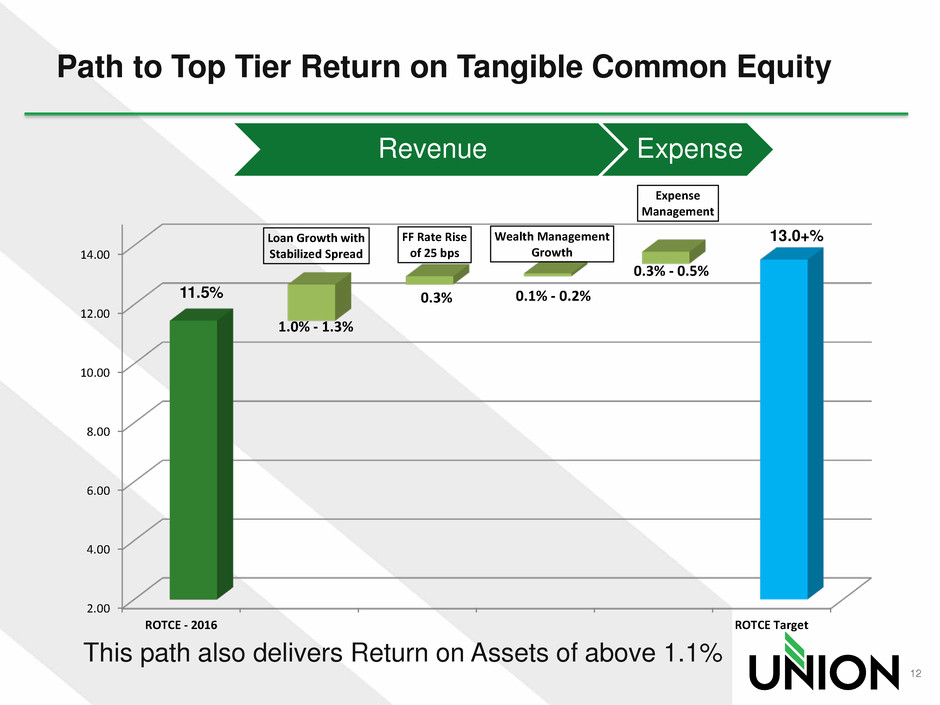
Path to Top Tier Return on Tangible Common Equity
Revenue Expense
This path also delivers Return on Assets of above 1.1%
12
2.00
4.00
6.00
8.00
10.00
12.00
14.00
ROTCE - 2016 ROTCE Target
11.5%
1.0% - 1.3%
0.3% 0.1% - 0.2%
0.3% - 0.5%
Loan Growth with
Stabilized Spread
FF Rate Rise
of 25 bps
Wealth Management
Growth
Expense
Management
13.0+%
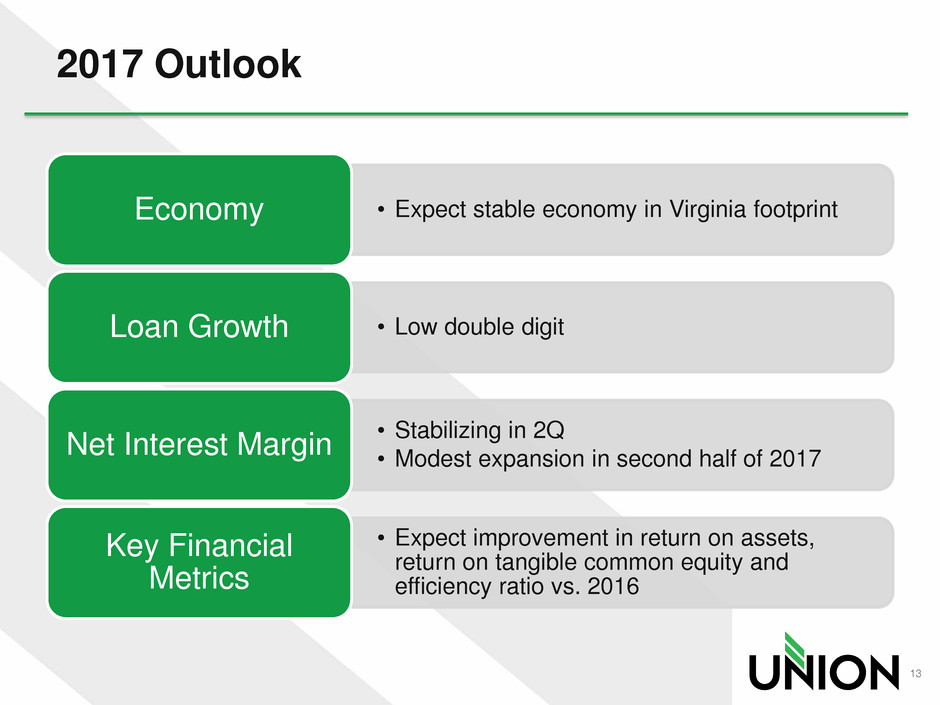
2017 Outlook
• Expect stable economy in Virginia footprint Economy
• Low double digit Loan Growth
• Stabilizing in 2Q
• Modest expansion in second half of 2017 Net Interest Margin
• Expect improvement in return on assets,
return on tangible common equity and
efficiency ratio vs. 2016
Key Financial
Metrics
13
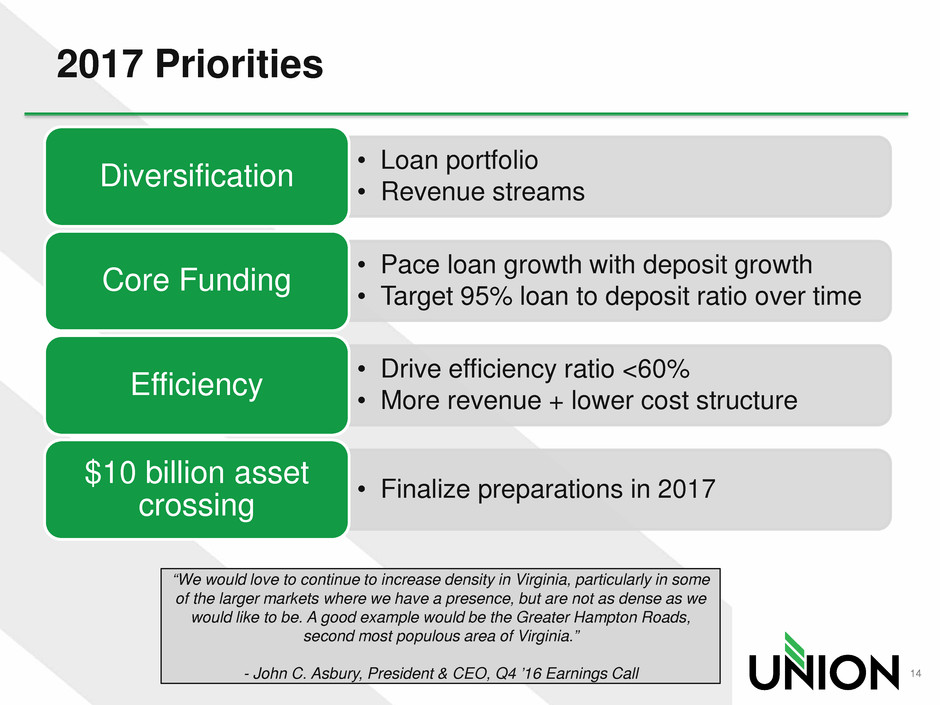
2017 Priorities
14
• Loan portfolio
• Revenue streams Diversification
• Pace loan growth with deposit growth
• Target 95% loan to deposit ratio over time Core Funding
• Drive efficiency ratio <60%
• More revenue + lower cost structure Efficiency
• Finalize preparations in 2017 $10 billion asset crossing
“We would love to continue to increase density in Virginia, particularly in some
of the larger markets where we have a presence, but are not as dense as we
would like to be. A good example would be the Greater Hampton Roads,
second most populous area of Virginia.”
- John C. Asbury, President & CEO, Q4 ’16 Earnings Call
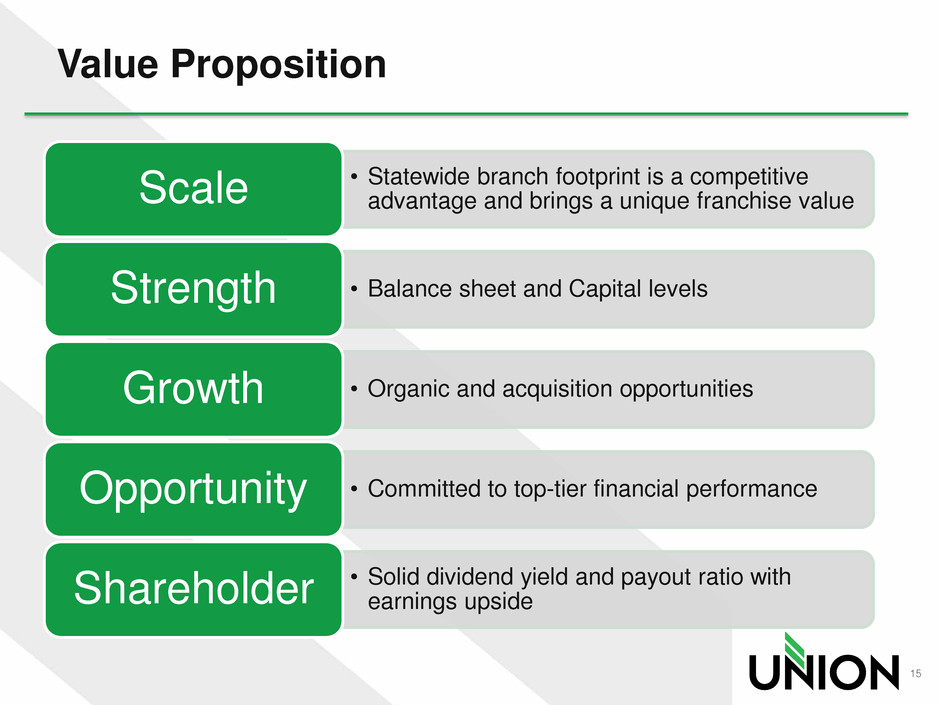
Value Proposition
• Statewide branch footprint is a competitive
advantage and brings a unique franchise value Scale
• Balance sheet and Capital levels Strength
• Organic and acquisition opportunities Growth
• Committed to top-tier financial performance Opportunity
• Solid dividend yield and payout ratio with
earnings upside Shareholder
15
Merger Details
17
Additional Merger Information
Additional Information and Where to Find It
In connection with the proposed merger, Union will file with the SEC a registration statement on Form S-4 to register the shares of Union common
stock to be issued to the shareholders of Xenith. The registration statement will include a joint proxy statement of Union and Xenith and a prospectus
of Union. A definitive joint proxy statement/prospectus will be sent to the shareholders of Union and Xenith seeking their approval of the merger and
related matters. This release does not constitute an offer to sell or the solicitation of an offer to buy any securities or a solicitation of any vote or
approval. Before making any voting or investment decision, investors and shareholders of Union and Xenith are urged to read carefully the
entire registration statement and joint proxy statement/prospectus when they become available, including any amendments thereto,
because they will contain important information about the proposed transaction. Free copies of these documents may be obtained as
described below.
Investors and shareholders of both companies are urged to read the registration statement on Form S-4 and the joint proxy statement/prospectus
included within the registration statement and any other relevant documents to be filed with the SEC in connection with the proposed merger because
they will contain important information about Union, Xenith and the proposed transaction. Investors and shareholders of both companies are urged to
review carefully and consider all public filings by Union and Xenith with the SEC, including but not limited to their Annual Reports on Form 10-K, their
proxy statements, their Quarterly Reports on Form 10-Q, and their Current Reports on Form 8-K. Investors and shareholders may obtain free copies
of these documents through the website maintained by the SEC at www.sec.gov. Free copies of the joint proxy statement/prospectus and other
documents filed with the SEC also may be obtained by directing a request by telephone or mail to Union Bankshares Corporation, 1051 East Cary
Street, Suite 1200, Richmond, Virginia 23219, Attention: Investor Relations (telephone: (804) 633-5031), or Xenith Bankshares, Inc. 901 E. Cary Street
Richmond, Virginia, 23219, Attention: Thomas W. Osgood (telephone: (804) 433-2200), or by accessing Union’s website at www.bankatunion.com
under “Investor Relations” or Xenith’s website at www.xenithbank.com under “Investor Relations” under “About Us.” The information on Union’s and
Xenith’s websites is not, and shall not be deemed to be, a part of this release or incorporated into other filings either company makes with the SEC.
Union and Xenith and their respective directors and executive officers may be deemed to be participants in the solicitation of proxies from the
shareholders of Union and/or Xenith in connection with the merger. Information about the directors and executive officers of Union is set forth in the
proxy statement for Union’s 2017 annual meeting of shareholders filed with the SEC on March 21, 2017. Information about the directors and executive
officers of Xenith is set forth in Xenith’s Annual Report on Form 10-K, as amended, filed with the SEC on May 1, 2017. Additional information regarding
the interests of these participants and other persons who may be deemed participants in the merger may be obtained by reading the joint proxy
statement/prospectus regarding the merger when it becomes available. Free copies of these documents may be obtained as described above.
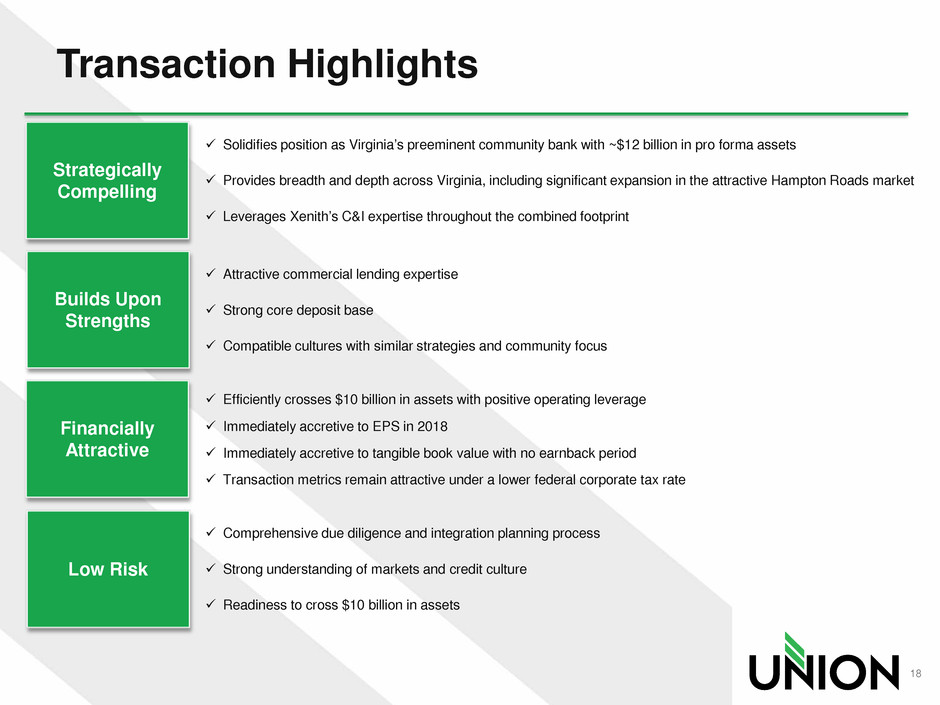
Solidifies position as Virginia’s preeminent community bank with ~$12 billion in pro forma assets
Provides breadth and depth across Virginia, including significant expansion in the attractive Hampton Roads market
Leverages Xenith’s C&I expertise throughout the combined footprint
Transaction Highlights
Attractive commercial lending expertise
Strong core deposit base
Compatible cultures with similar strategies and community focus
Efficiently crosses $10 billion in assets with positive operating leverage
Immediately accretive to EPS in 2018
Immediately accretive to tangible book value with no earnback period
Transaction metrics remain attractive under a lower federal corporate tax rate
Comprehensive due diligence and integration planning process
Strong understanding of markets and credit culture
Readiness to cross $10 billion in assets
Strategically
Compelling
Builds Upon
Strengths
Financially
Attractive
Low Risk
18
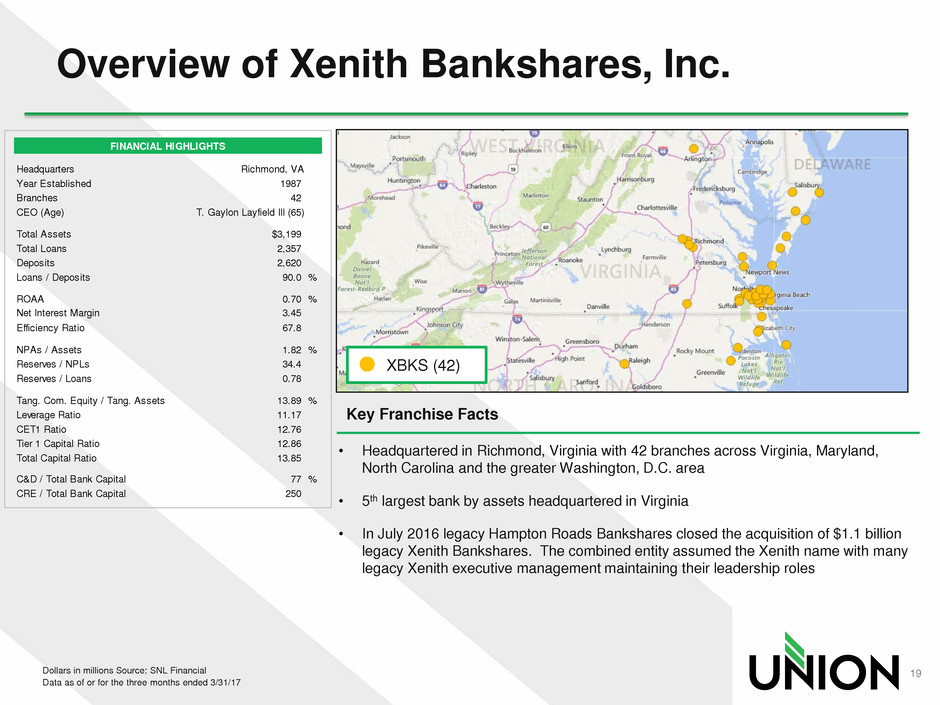
FINANCIAL HIGHLIGHTS
Headquarters Richmond, VA
Year Established 1987
Branches 42
CEO (Age) T. Gaylon Layfield III (65)
Total Assets $3,199
Total Loans 2,357
Deposits 2,620
Loans / Deposits 90.0 %
ROAA 0.70 %
Net Interest Margin 3.45
Efficiency Ratio 67.8
NPAs / Assets 1.82 %
Reserves / NPLs 34.4
Reserves / Loans 0.78
Tang. Com. Equity / Tang. Assets 13.89 %
Leverage Ratio 11.17
CET1 Ratio 12.76
Tier 1 Capital Ratio 12.86
Total Capital Ratio 13.85
C&D / Total Bank Capital 77 %
CRE / Total Bank Capital 250
Overview of Xenith Bankshares, Inc.
Dollars in millions Source: SNL Financial
Data as of or for the three months ended 3/31/17
• Headquartered in Richmond, Virginia with 42 branches across Virginia, Maryland,
North Carolina and the greater Washington, D.C. area
• 5th largest bank by assets headquartered in Virginia
• In July 2016 legacy Hampton Roads Bankshares closed the acquisition of $1.1 billion
legacy Xenith Bankshares. The combined entity assumed the Xenith name with many
legacy Xenith executive management maintaining their leadership roles
Key Franchise Facts
XBKS (42)
19
Virginia
North Carolina
Maryland
Stauntont ttauntont tt ttauntont ttaunton
Charlottesvillel tt illr svha lotte illel tt illl tt illrr svsvha lo te i lel t i lha lo te i le
Richmondici h ondiicci h ondii h ond
Roanokekoano ekkoano eoano e
Fredricksburgir r rcksF ed i bu giir r rr r rckscksF ed i bu giF ed i bu g
Norfolkf lr ko folf lf lrr kko folf lo fol
Raleighl ialeighl il ialeighl ialeigh
Greensboror rseen bo or rr rsseen bo oeen bo o
Virginia Beachi i i r ci ginia ea hi i i i i i rr cci ginia ea hi i i i ginia ea h
Ashevilleills vhe illeillills vs vhe i lei lhe i le
Washingtoni tsa hingtoni ti tssa hingtoni ta hington
Baltimorelti ralti o eltilti rralti o eltialti o e
Charlottel ttrha lottel ttl ttrrha lo tel tha lo te
40
40
95
95
85
85
66
64
81
81
77
64
70
270
95
95
Our Combined Company
Note: Financial data as of 3/31/2017
Dollars in billions
(1) Excludes purchase accounting adjustments
(2) Regional bank defined as having less than $50 billion in assets
UBSH (113)
XBKS (42)
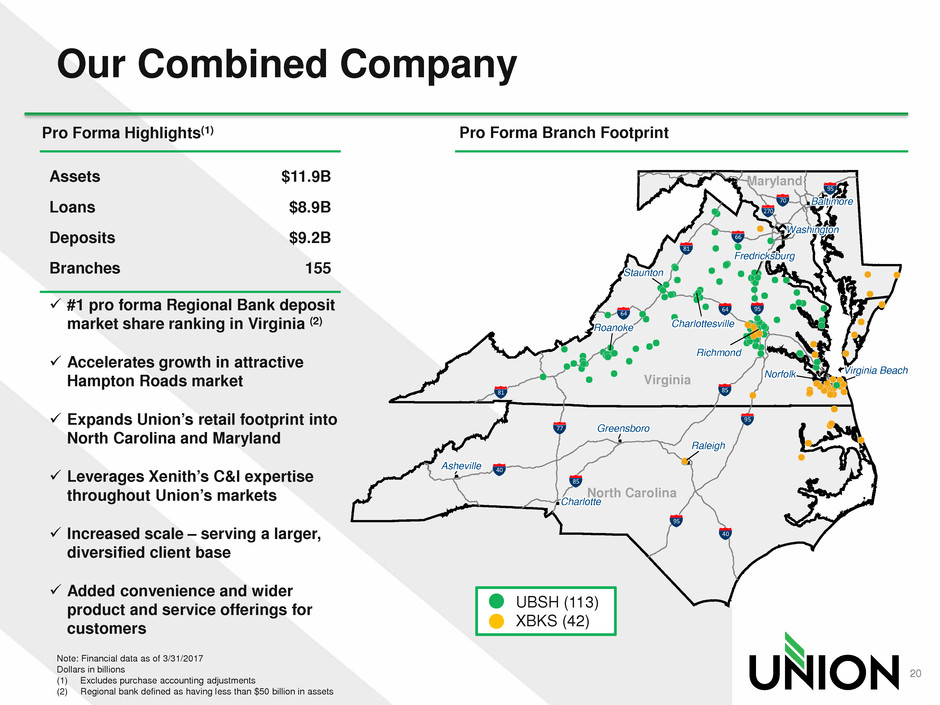
Pro Forma Branch Footprint Pro Forma Highlights(1)
#1 pro forma Regional Bank deposit
market share ranking in Virginia (2)
Accelerates growth in attractive
Hampton Roads market
Expands Union’s retail footprint into
North Carolina and Maryland
Leverages Xenith’s C&I expertise
throughout Union’s markets
Increased scale – serving a larger,
diversified client base
Added convenience and wider
product and service offerings for
customers
Assets $11.9B
Loans $8.9B
Deposits $9.2B
Branches 155
20
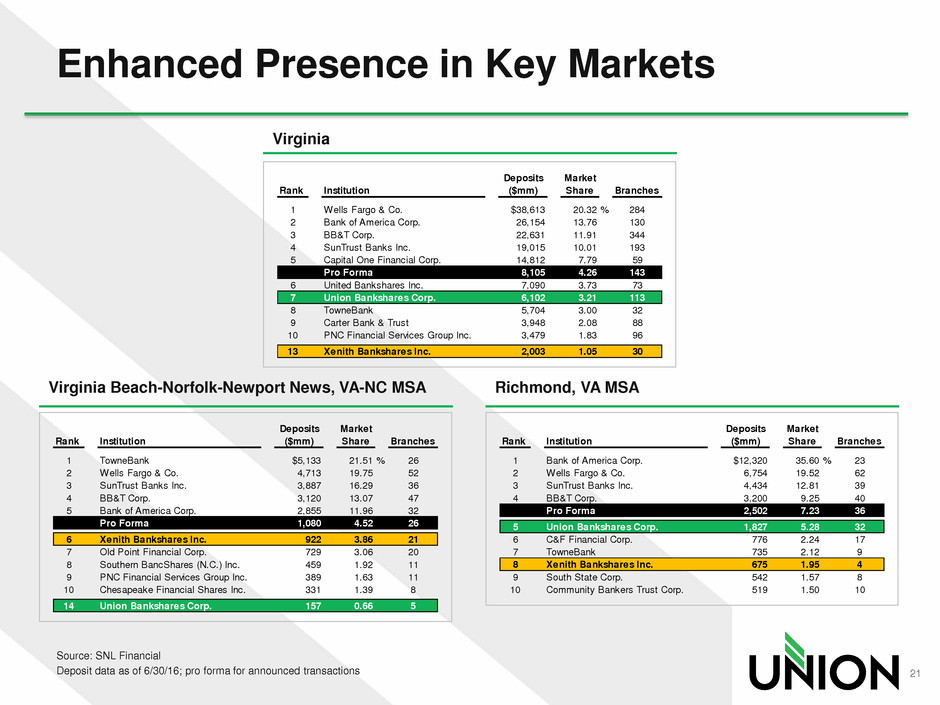
Deposits Market
Rank Institution ($mm) Share Branches
1 Wells Fargo & Co. $38,613 20.32 % 284
2 Bank of America Corp. 26,154 13.76 130
3 BB&T Corp. 22,631 11.91 344
4 SunTrust Banks Inc. 19,015 10.01 193
5 Capital One Financial Corp. 14,812 7.79 59
Pro Forma 8,105 4.26 143
6 United Bankshares Inc. 7,090 3.73 73
7 Union Bankshares Corp. 6,102 3.21 113
8 TowneBank 5,704 3.00 32
9 Carter Bank & Trust 3,948 2.08 88
10 PNC Financial Services Group Inc. 3,479 1.83 96
13 Xenith Bankshares Inc. 2,003 1.05 30
Enhanced Presence in Key Markets
Source: SNL Financial
Deposit data as of 6/30/16; pro forma for announced transactions
Virginia Beach-Norfolk-Newport News, VA-NC MSA
Deposits Market
Rank Institution ($mm) Share Branches
1 TowneBank $5,133 21.51 % 26
2 Wells Fargo & Co. 4,713 19.75 52
3 SunTrust Banks Inc. 3,887 16.29 36
4 BB&T Corp. 3,120 13.07 47
5 Bank of America Corp. 2,855 11.96 32
Pro Forma 1,080 4.52 26
6 Xenith Bankshares Inc. 922 3.86 21
7 Old Point Financial Corp. 729 3.06 20
8 Southern BancShares (N.C.) Inc. 459 1.92 11
9 PNC Financial Services Group Inc. 389 1.63 11
10 Chesapeake Financial Shares Inc. 331 1.39 8
14 Union Bankshares Corp. 157 0.66 5
Deposits Market
Rank Institution ($mm) Share Branches
1 Bank of America Corp. $12,320 35.60 % 23
2 Wells Fargo & Co. 6,754 19.52 62
3 SunTrust Banks Inc. 4,434 12.81 39
4 BB&T Corp. 3,200 9.25 40
Pro Forma 2,502 7.23 36
5 Union Bankshares Corp. 1,827 5.28 32
6 C&F Financial Corp. 776 2.24 17
7 TowneBank 735 2.12 9
8 Xenith Bankshares Inc. 675 1.95 4
9 South State Corp. 542 1.57 8
10 Community Bankers Trust Corp. 519 1.50 10
Richmond, VA MSA
Virginia
21
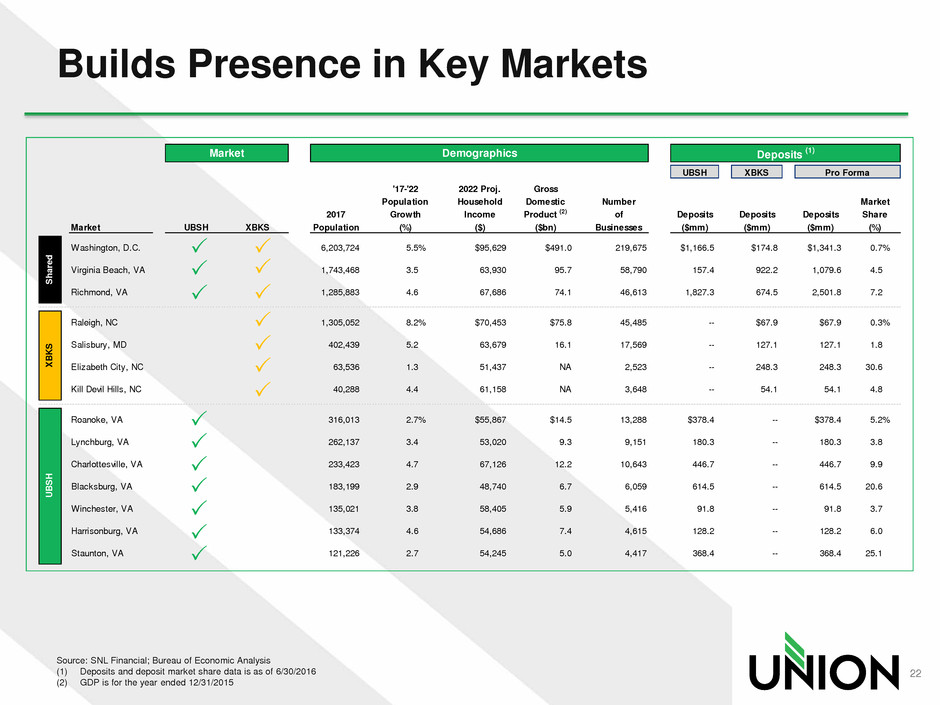
Market Demographics Deposits (1)
UBSH XBKS Pro Forma
'17-'22 2022 Proj. Gross
Population Household Domestic Number Market
2017 Growth Income Product (2) of Deposits Deposits Deposits Share
Market UBSH XBKS Population (%) ($) ($bn) Businesses ($mm) ($mm) ($mm) (%)
Washington, D.C. 6,203,724 5.5% $95,629 $491.0 219,675 $1,166.5 $174.8 $1,341.3 0.7%
Virginia Beach, VA 1,743,468 3.5 63,930 95.7 58,790 157.4 922.2 1,079.6 4.5
Richmond, VA 1,285,883 4.6 67,686 74.1 46,613 1,827.3 674.5 2,501.8 7.2
Raleigh, NC 1,305,052 8.2% $70,453 $75.8 45,485 -- $67.9 $67.9 0.3%
Salisbury, MD 402,439 5.2 63,679 16.1 17,569 -- 127.1 127.1 1.8
Elizabeth City, NC 63,536 1.3 51,437 NA 2,523 -- 248.3 248.3 30.6
Kill Devil Hills, NC 40,288 4.4 61,158 NA 3,648 -- 54.1 54.1 4.8
Roanoke, VA 316,013 2.7% $55,867 $14.5 13,288 $378.4 -- $378.4 5.2%
Lynchburg, VA 262,137 3.4 53,020 9.3 9,151 180.3 -- 180.3 3.8
Charlottesville, VA 233,423 4.7 67,126 12.2 10,643 446.7 -- 446.7 9.9
Blacksburg, VA 183,199 2.9 48,740 6.7 6,059 614.5 -- 614.5 20.6
Winchester, VA 135,021 3.8 58,405 5.9 5,416 91.8 -- 91.8 3.7
Harrisonburg, VA 133,374 4.6 54,686 7.4 4,615 128.2 -- 128.2 6.0
Staunton, VA 121,226 2.7 54,245 5.0 4,417 368.4 -- 368.4 25.1
U
B
S
H
X
B
K
S
S
ha
re
d
Builds Presence in Key Markets
Source: SNL Financial; Bureau of Economic Analysis
(1) Deposits and deposit market share data is as of 6/30/2016
(2) GDP is for the year ended 12/31/2015
22
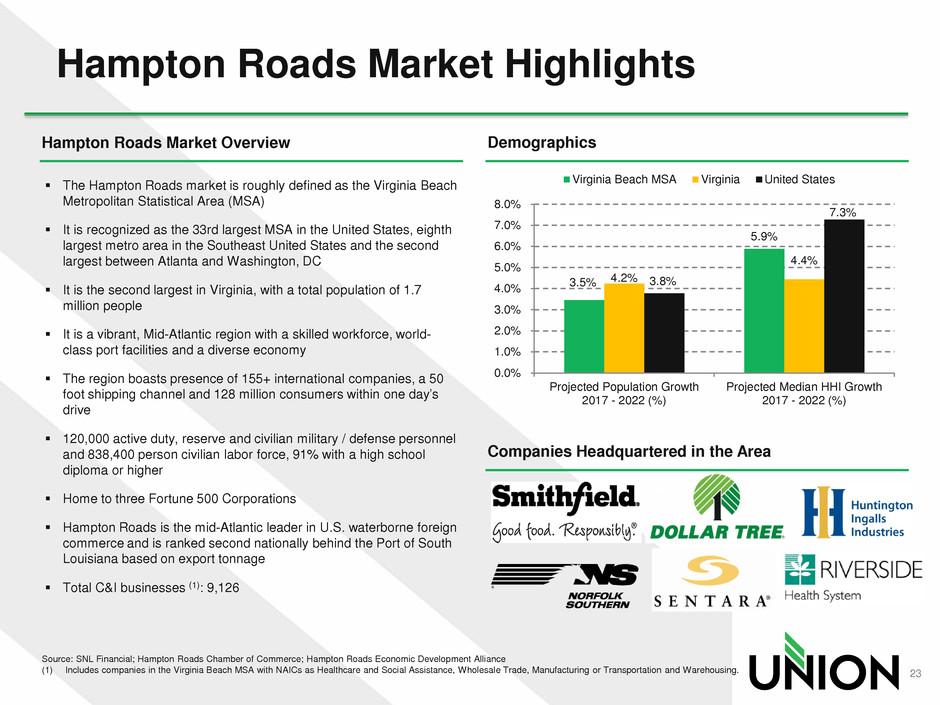
Hampton Roads Market Highlights
Source: SNL Financial; Hampton Roads Chamber of Commerce; Hampton Roads Economic Development Alliance
(1) Includes companies in the Virginia Beach MSA with NAICs as Healthcare and Social Assistance, Wholesale Trade, Manufacturing or Transportation and Warehousing.
Demographics Hampton Roads Market Overview
The Hampton Roads market is roughly defined as the Virginia Beach
Metropolitan Statistical Area (MSA)
It is recognized as the 33rd largest MSA in the United States, eighth
largest metro area in the Southeast United States and the second
largest between Atlanta and Washington, DC
It is the second largest in Virginia, with a total population of 1.7
million people
It is a vibrant, Mid-Atlantic region with a skilled workforce, world-
class port facilities and a diverse economy
The region boasts presence of 155+ international companies, a 50
foot shipping channel and 128 million consumers within one day’s
drive
120,000 active duty, reserve and civilian military / defense personnel
and 838,400 person civilian labor force, 91% with a high school
diploma or higher
Home to three Fortune 500 Corporations
Hampton Roads is the mid-Atlantic leader in U.S. waterborne foreign
commerce and is ranked second nationally behind the Port of South
Louisiana based on export tonnage
Total C&I businesses (1): 9,126
3.5%
5.9%
4.2%
4.4%
3.8%
7.3%
0.0%
1.0%
2.0%
3.0%
4.0%
5.0%
6.0%
7.0%
8.0%
Projected Population Growth
2017 - 2022 (%)
Projected Median HHI Growth
2017 - 2022 (%)
Virginia Beach MSA Virginia United States
Companies Headquartered in the Area
23
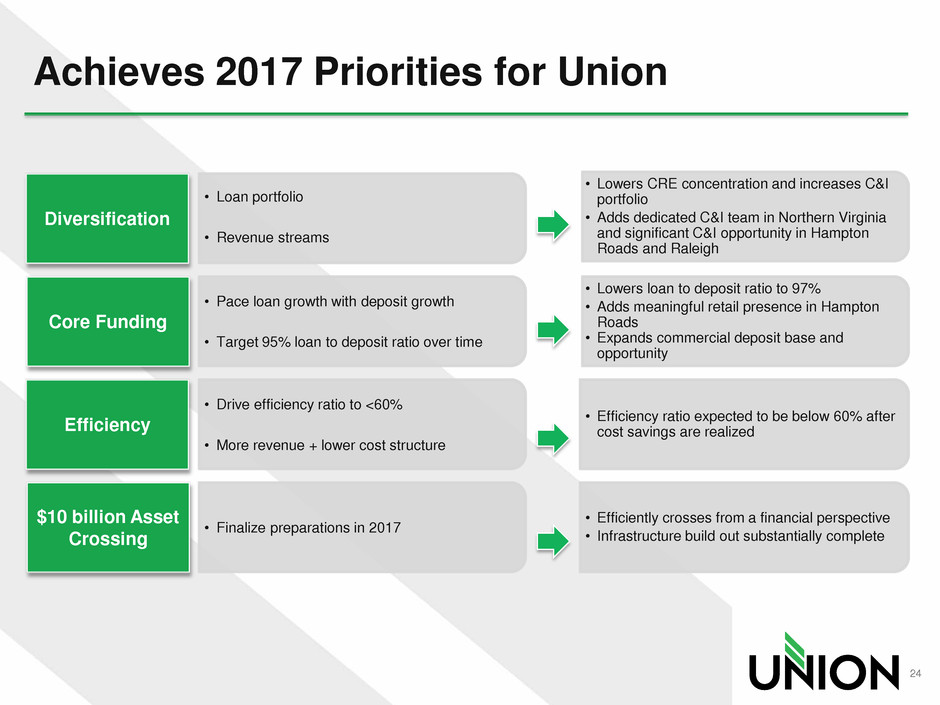
Achieves 2017 Priorities for Union
• Lowers CRE concentration and increases C&I
portfolio
• Adds dedicated C&I team in Northern Virginia
and significant C&I opportunity in Hampton
Roads and Raleigh
• Lowers loan to deposit ratio to 97%
• Adds meaningful retail presence in Hampton
Roads
• Expands commercial deposit base and
opportunity
• Efficiency ratio expected to be below 60% after
cost savings are realized
• Efficiently crosses from a financial perspective
• Infrastructure build out substantially complete
Diversification
Core Funding
Efficiency
$10 billion Asset
Crossing
• Loan portfolio
• Revenue streams
• Pace loan growth with deposit growth
• Target 95% loan to deposit ratio over time
• Drive efficiency ratio to <60%
• More revenue + lower cost structure
• Finalize preparations in 2017
24
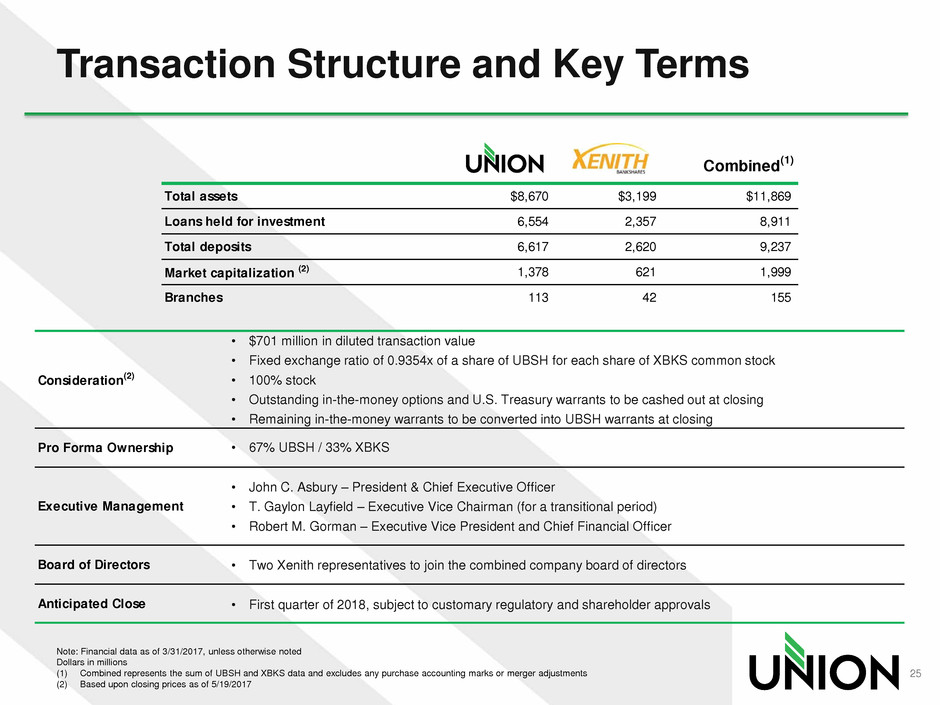
Consideration(2)
Pro Forma Ownership
Executive Management
Board of Directors
Anticipated Close
Transaction Structure and Key Terms
Note: Financial data as of 3/31/2017, unless otherwise noted
Dollars in millions
(1) Combined represents the sum of UBSH and XBKS data and excludes any purchase accounting marks or merger adjustments
(2) Based upon closing prices as of 5/19/2017
Combined(1)
Total assets $8,670 $3,199 $11,869
Loans held for investment 6,554 2,357 8,911
Total deposits 6,617 2,620 9,237
Market capitalization (2) 1,378 621 1,999
Branches 113 42 155
• $701 million in diluted transaction value
• Fixed exchange ratio of 0.9354x of a share of UBSH for each share of XBKS common stock
• 100% stock
• Outstanding in-the-money options and U.S. Treasury warrants to be cashed out at closing
• Remaining in-the-money warrants to be converted into UBSH warrants at closing
• 67% UBSH / 33% XBKS
• John C. Asbury – President & Chief Executive Officer
• T. Gaylon Layfield – Executive Vice Chairman (for a transitional period)
• Robert M. Gorman – Executive Vice President and Chief Financial Officer
• Two Xenith representatives to join the combined company board of directors
• First quarter of 2018, subject to customary regulatory and shareholder approvals
25
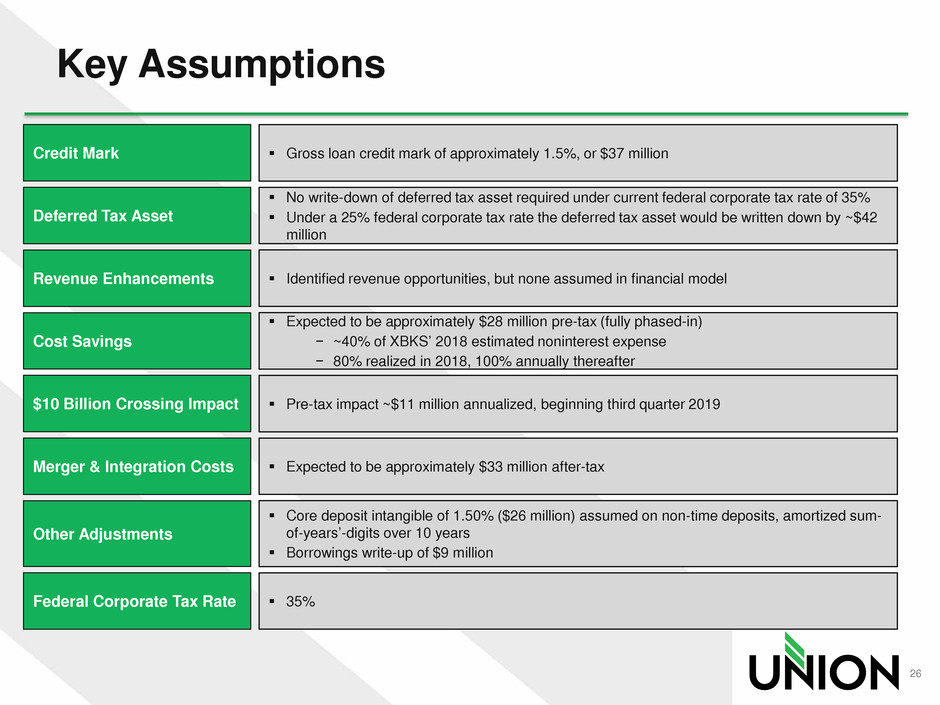
Key Assumptions
Cost Savings
Credit Mark Gross loan credit mark of approximately 1.5%, or $37 million
Expected to be approximately $28 million pre-tax (fully phased-in)
− ~40% of XBKS’ 2018 estimated noninterest expense
− 80% realized in 2018, 100% annually thereafter
Merger & Integration Costs Expected to be approximately $33 million after-tax
$10 Billion Crossing Impact Pre-tax impact ~$11 million annualized, beginning third quarter 2019
Other Adjustments
Core deposit intangible of 1.50% ($26 million) assumed on non-time deposits, amortized sum-
of-years’-digits over 10 years
Borrowings write-up of $9 million
Deferred Tax Asset
No write-down of deferred tax asset required under current federal corporate tax rate of 35%
Under a 25% federal corporate tax rate the deferred tax asset would be written down by ~$42
million
Revenue Enhancements Identified revenue opportunities, but none assumed in financial model
Federal Corporate Tax Rate 35%
26
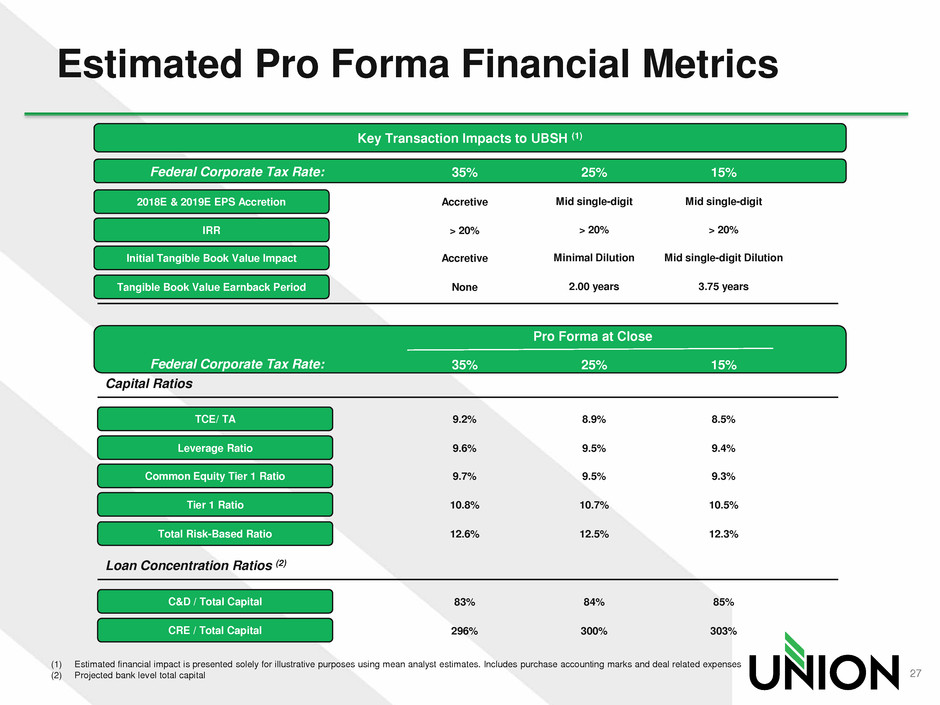
Estimated Pro Forma Financial Metrics
(1) Estimated financial impact is presented solely for illustrative purposes using mean analyst estimates. Includes purchase accounting marks and deal related expenses
(2) Projected bank level total capital
Key Transaction Impacts to UBSH (1)
2018E & 2019E EPS Accretion
IRR
Initial Tangible Book Value Impact
Tangible Book Value Earnback Period
Capital Ratios
TCE/ TA
Leverage Ratio
Common Equity Tier 1 Ratio
Tier 1 Ratio
Total Risk-Based Ratio
Loan Concentration Ratios (2)
C&D / Total Capital
CRE / Total Capital
Accretive
> 20%
Accretive
None
9.2%
9.6%
9.7%
10.8%
12.6%
8.9%
9.5%
9.5%
10.7%
12.5%
8.5%
9.4%
9.3%
10.5%
12.3%
83%
296%
84%
300%
85%
303%
Pro Forma at Close
35% Federal Corporate Tax Rate: 25% 15%
Mid single-digit
> 20%
Minimal Dilution
2.00 years
Mid single-digit
> 20%
Mid single-digit Dilution
3.75 years
35% Federal Corporate Tax Rate: 25% 15%
27
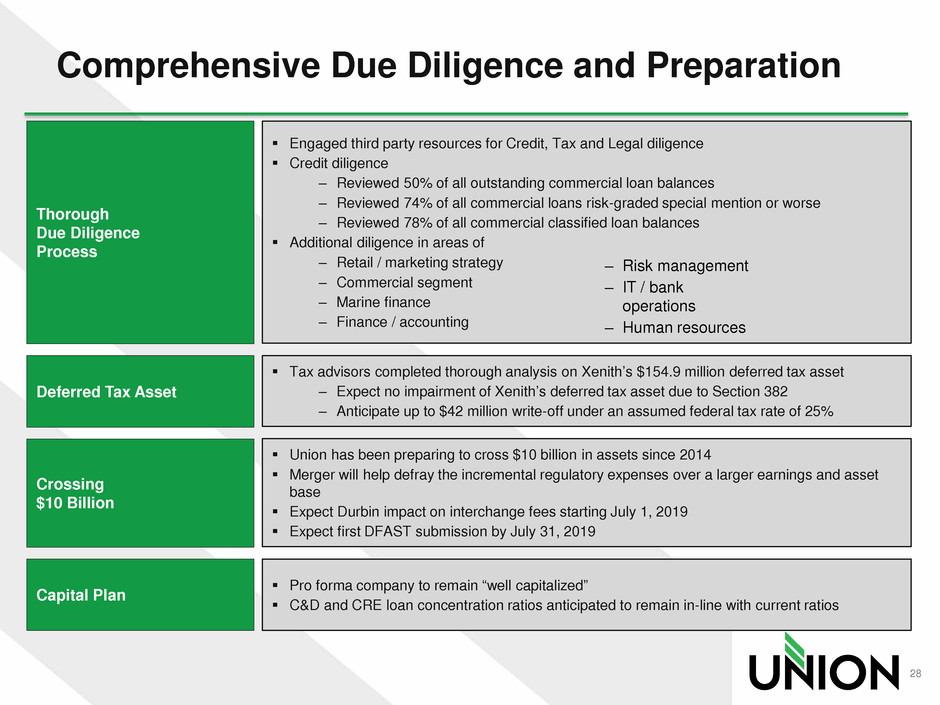
Comprehensive Due Diligence and Preparation
Deferred Tax Asset
Tax advisors completed thorough analysis on Xenith’s $154.9 million deferred tax asset
‒ Expect no impairment of Xenith’s deferred tax asset due to Section 382
‒ Anticipate up to $42 million write-off under an assumed federal tax rate of 25%
Thorough
Due Diligence
Process
Engaged third party resources for Credit, Tax and Legal diligence
Credit diligence
‒ Reviewed 50% of all outstanding commercial loan balances
‒ Reviewed 74% of all commercial loans risk-graded special mention or worse
‒ Reviewed 78% of all commercial classified loan balances
Additional diligence in areas of
‒ Retail / marketing strategy
‒ Commercial segment
‒ Marine finance
‒ Finance / accounting
Crossing
$10 Billion
Union has been preparing to cross $10 billion in assets since 2014
Merger will help defray the incremental regulatory expenses over a larger earnings and asset
base
Expect Durbin impact on interchange fees starting July 1, 2019
Expect first DFAST submission by July 31, 2019
‒ Risk management
‒ IT / bank
operations
‒ Human resources
Capital Plan
Pro forma company to remain “well capitalized”
C&D and CRE loan concentration ratios anticipated to remain in-line with current ratios
28
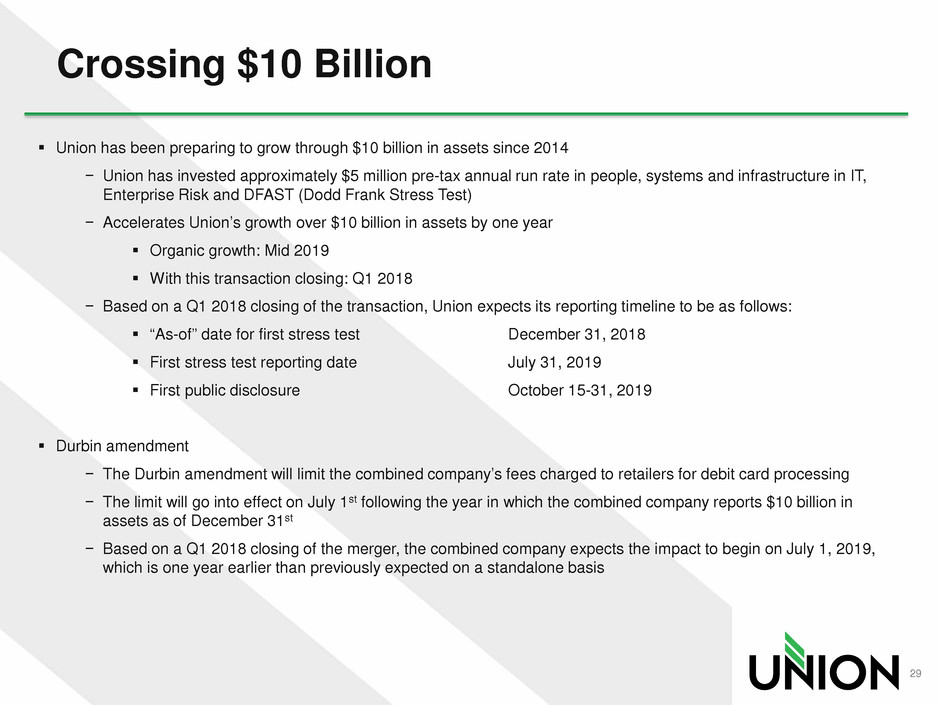
Crossing $10 Billion
Union has been preparing to grow through $10 billion in assets since 2014
− Union has invested approximately $5 million pre-tax annual run rate in people, systems and infrastructure in IT,
Enterprise Risk and DFAST (Dodd Frank Stress Test)
− Accelerates Union’s growth over $10 billion in assets by one year
Organic growth: Mid 2019
With this transaction closing: Q1 2018
− Based on a Q1 2018 closing of the transaction, Union expects its reporting timeline to be as follows:
“As-of” date for first stress test December 31, 2018
First stress test reporting date July 31, 2019
First public disclosure October 15-31, 2019
Durbin amendment
− The Durbin amendment will limit the combined company’s fees charged to retailers for debit card processing
− The limit will go into effect on July 1st following the year in which the combined company reports $10 billion in
assets as of December 31st
− Based on a Q1 2018 closing of the merger, the combined company expects the impact to begin on July 1, 2019,
which is one year earlier than previously expected on a standalone basis
29
Creates Virginia’s preeminent community bank with more than $12 billion in pro forma assets
at closing
Enhances presence in key markets and provides a platform for future growth
Financially attractive transaction for all shareholders with conservative assumptions
Proven track record of successful conversions and integrations at both companies
Deal Summary
30
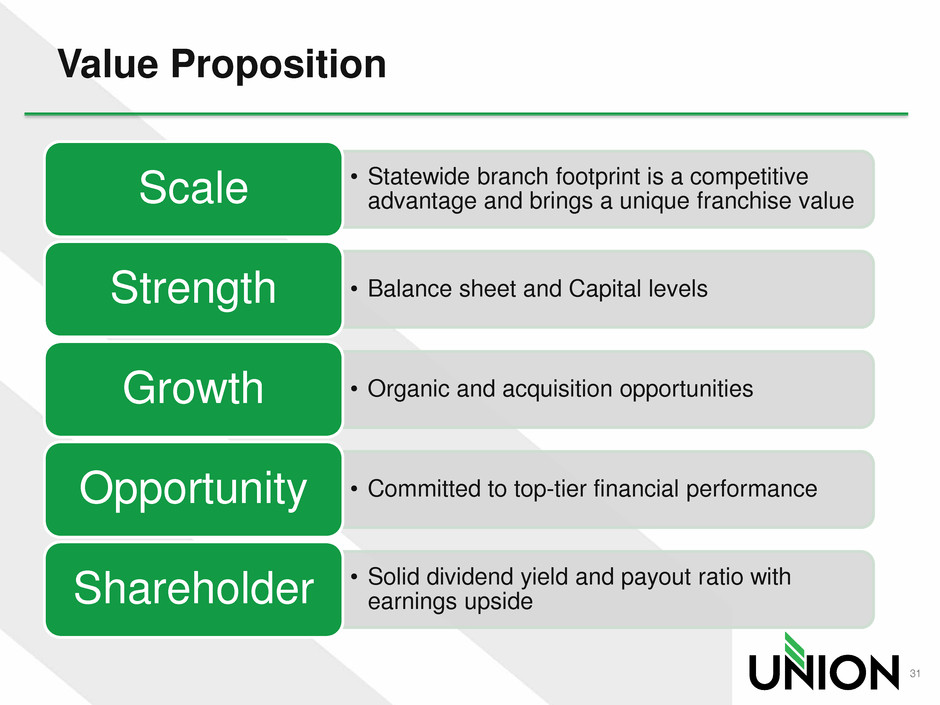
Value Proposition
• Statewide branch footprint is a competitive
advantage and brings a unique franchise value Scale
• Balance sheet and Capital levels Strength
• Organic and acquisition opportunities Growth
• Committed to top-tier financial performance Opportunity
• Solid dividend yield and payout ratio with
earnings upside Shareholder
31
APPENDIX
32

CEO Succession Plan
• John Asbury became President & CEO of Union Bank &
Trust and President of Union Bankshares Corporation on
October 1; CEO of Holding company on January 2, 2017 –
succeeding Billy Beale.
• Asbury was most recently President and CEO of First National Bank of
Santa Fe, a multi-state bank located in the Southwest
• Prior to that, he was Senior Executive Vice President at Regions
responsible for all lines serving business and commercial customers and
managed a $50 billion book of business
• Senior Vice President at Bank of America – served in a variety of roles last
position responsible for all Pacific Northwest Region business banking
• Asbury joined the board on October 1
• Billy was Executive Vice Chairman through March 31 and
was re-elected to board in May 2017 and will serve as an
advisor to the CEO and Board
33
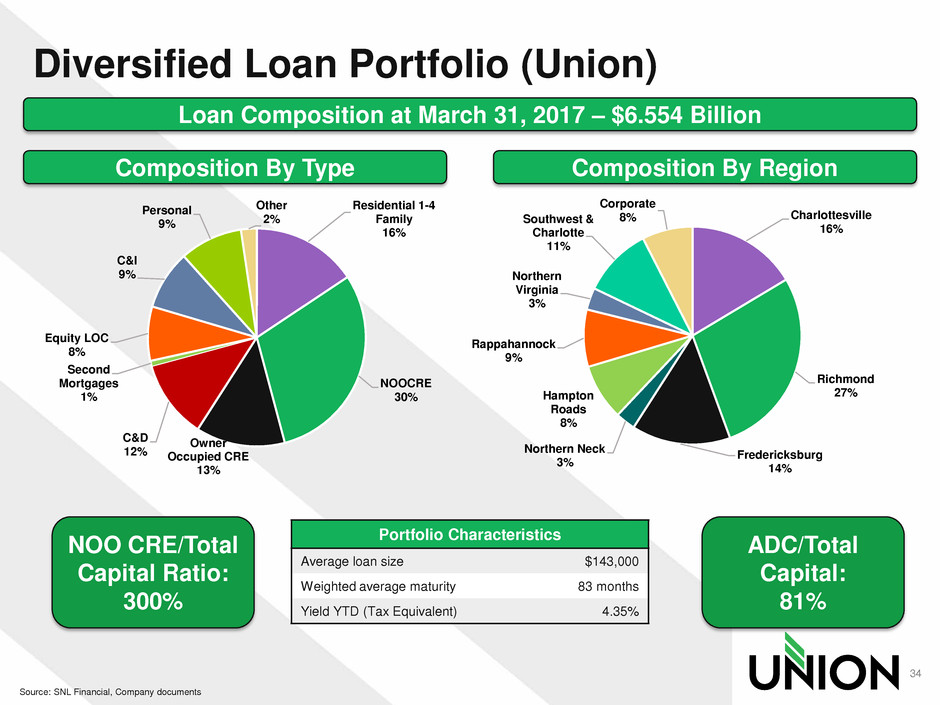
Diversified Loan Portfolio (Union)
34
Source: SNL Financial, Company documents
Loan Composition at March 31, 2017 – $6.554 Billion
Portfolio Characteristics
Average loan size $143,000
Weighted average maturity 83 months
Yield YTD (Tax Equivalent) 4.35%
Composition By Type Composition By Region
NOO CRE/Total
Capital Ratio:
300%
ADC/Total
Capital:
81%
Residential 1-4
Family
16%
NOOCRE
30%
Owner
Occupied CRE
13%
C&D
12%
Second
Mortgages
1%
Equity LOC
8%
C&I
9%
Personal
9%
Other
2% Charlottesville
16%
Richmond
27%
Fredericksburg
14%
Northern Neck
3%
Hampton
Roads
8%
Rappahannock
9%
Northern
Virginia
3%
Southwest &
Charlotte
11%
Corporate
8%
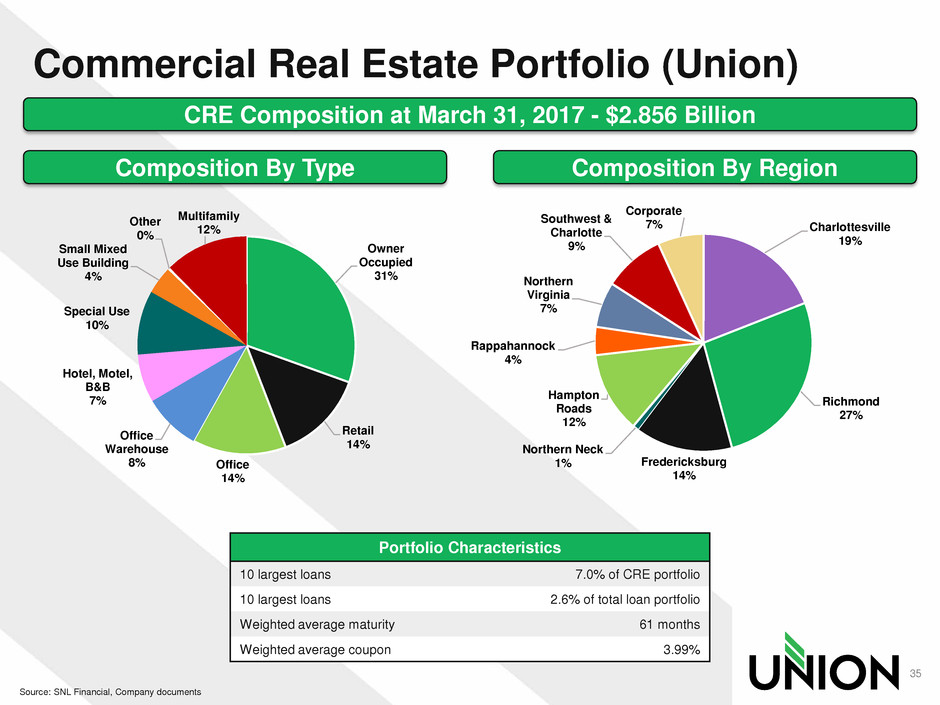
Commercial Real Estate Portfolio (Union)
35
Source: SNL Financial, Company documents
CRE Composition at March 31, 2017 - $2.856 Billion
Portfolio Characteristics
10 largest loans 7.0% of CRE portfolio
10 largest loans 2.6% of total loan portfolio
Weighted average maturity 61 months
Weighted average coupon 3.99%
Composition By Type Composition By Region
Owner
Occupied
31%
Retail
14%
Office
14%
Office
Warehouse
8%
Hotel, Motel,
B&B
7%
Special Use
10%
Small Mixed
Use Building
4%
Other
0%
Multifamily
12% Charlottesville
19%
Richmond
27%
Fredericksburg
14%
Northern Neck
1%
Hampton
Roads
12%
Rappahannock
4%
Northern
Virginia
7%
Southwest &
Charlotte
9%
Corporate
7%
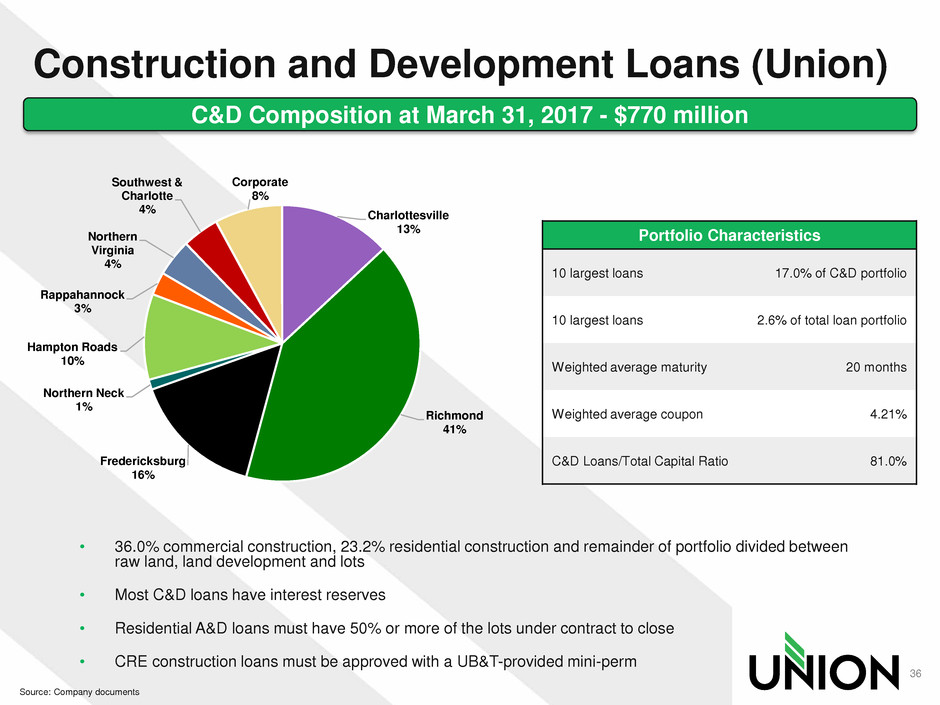
Construction and Development Loans (Union)
36
Source: Company documents
C&D Composition at March 31, 2017 - $770 million
Portfolio Characteristics
10 largest loans 17.0% of C&D portfolio
10 largest loans 2.6% of total loan portfolio
Weighted average maturity 20 months
Weighted average coupon 4.21%
C&D Loans/Total Capital Ratio 81.0%
• 36.0% commercial construction, 23.2% residential construction and remainder of portfolio divided between
raw land, land development and lots
• Most C&D loans have interest reserves
• Residential A&D loans must have 50% or more of the lots under contract to close
• CRE construction loans must be approved with a UB&T-provided mini-perm
Charlottesville
13%
Richmond
41%
Fredericksburg
16%
Northern Neck
1%
Hampton Roads
10%
Rappahannock
3%
Northern
Virginia
4%
Southwest &
Charlotte
4%
Corporate
8%
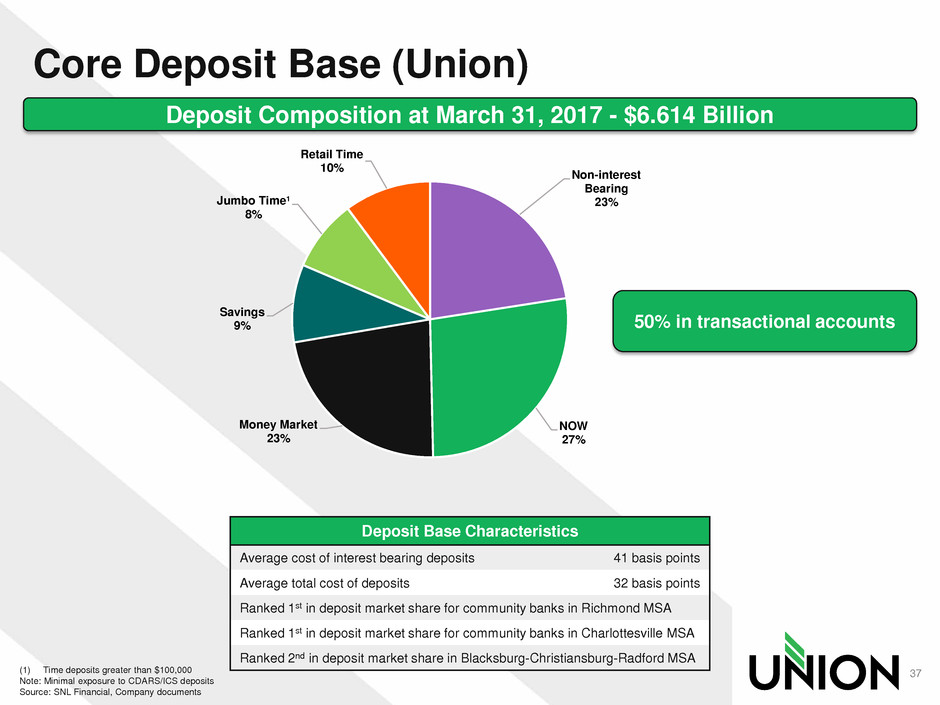
Core Deposit Base (Union)
37 (1) Time deposits greater than $100,000
Note: Minimal exposure to CDARS/ICS deposits
Source: SNL Financial, Company documents
Deposit Composition at March 31, 2017 - $6.614 Billion
Deposit Base Characteristics
Average cost of interest bearing deposits 41 basis points
Average total cost of deposits 32 basis points
Ranked 1st in deposit market share for community banks in Richmond MSA
Ranked 1st in deposit market share for community banks in Charlottesville MSA
Ranked 2nd in deposit market share in Blacksburg-Christiansburg-Radford MSA
50% in transactional accounts
Non-interest
Bearing
23%
NOW
27%
Money Market
23%
Savings
9%
Jumbo Time¹
8%
Retail Time
10%
C&D
12%
1-4 Family
24%
Multifamily
5%
Ow ner-
Occupied
CRE
13%
Non Ow ner-
Occupied
CRE
25%
C&I
9%
Consumer &
Other
11%
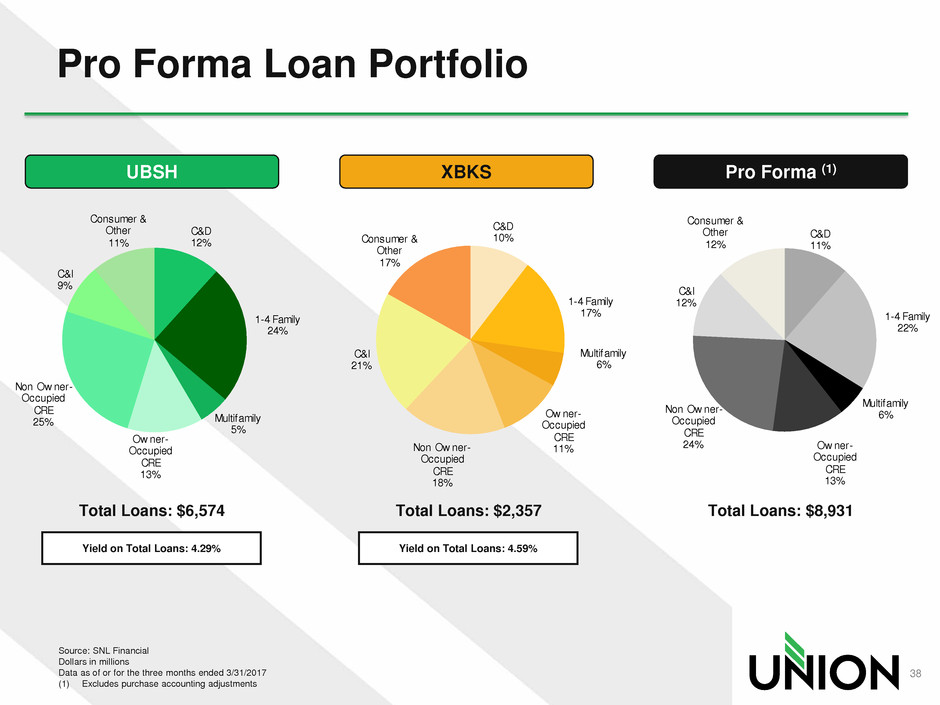
Pro Forma Loan Portfolio
Source: SNL Financial
Dollars in millions
Data as of or for the three months ended 3/31/2017
(1) Excludes purchase accounting adjustments
UBSH XBKS Pro Forma (1)
C&D
10%
1-4 Family
17%
Multifamily
6%
Ow ner-
Occupied
CRE
11%Non Ow ner-
Occupied
CRE
18%
C&I
21%
Consumer &
Other
17%
C&D
11%
1-4 Family
22%
Multifamily
6%
Ow ner-
Occupied
CRE
13%
Non Ow ner-
Occupied
CRE
24%
C&I
12%
Consumer &
Other
12%
Yield on Total Loans: 4.29% Yield on Total Loans: 4.59%
Total Loans: $6,574 Total Loans: $2,357 Total Loans: $8,931
38
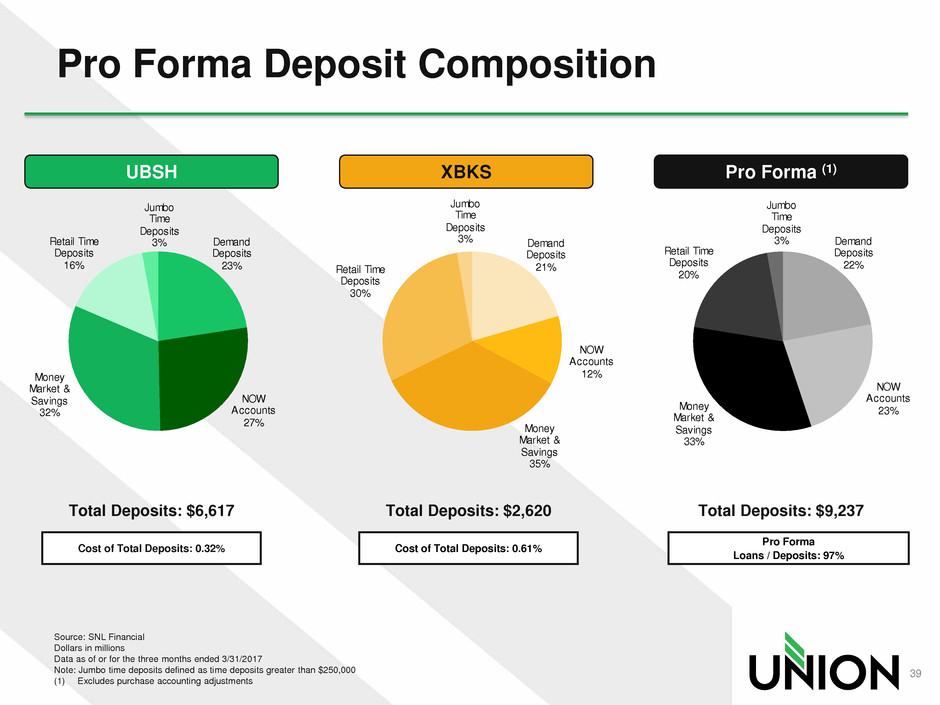
Pro Forma Deposit Composition
Source: SNL Financial
Dollars in millions
Data as of or for the three months ended 3/31/2017
Note: Jumbo time deposits defined as time deposits greater than $250,000
(1) Excludes purchase accounting adjustments
UBSH XBKS Pro Forma (1)
Demand
Deposits
23%
NOW
Accounts
27%
Money
Market &
Savings
32%
Retail Time
Deposits
16%
Jumbo
Time
Deposits
3% Demand
Deposits
21%
NOW
Accounts
12%
Money
Market &
Savings
35%
Retail Time
Deposits
30%
Jumbo
Time
Deposits
3%
Cost of Total Deposits: 0.32% Cost of Total Deposits: 0.61%
Demand
Deposits
22%
NOW
Accounts
23%Money
Market &
Savings
33%
Retail Time
Deposits
20%
Jumbo
Time
Deposits
3%
Total Deposits: $6,617 Total Deposits: $2,620 Total Deposits: $9,237
Pro Forma
Loans / Deposits: 97%
39