
Investor Presentation
May/June 2017
Exhibit 99.1
Forward-Looking Statement
Certain statements in this report may constitute “forward-looking statements” within the meaning of the
Private Securities Litigation Reform Act of 1995. Forward-looking statements are statements that include
projections, predictions, expectations, or beliefs about future events or results or otherwise and are not
statements of historical fact. Such statements are often characterized by the use of qualified words (and their
derivatives) such as “expect,” “believe,” “estimate,” “plan,” “project,” “anticipate,” “intend,” “will,” or words of
similar meaning or other statements concerning opinions or judgment of the Company and its management
about future events. Although the Company believes that its expectations with respect to forward-looking
statements are based upon reasonable assumptions within the bounds of its existing knowledge of its
business and operations, there can be no assurance that actual results, performance, or achievements of the
Company will not differ materially from any future results, performance, or achievements expressed or implied
by such forward-looking statements. Actual future results and trends may differ materially from historical
results or those anticipated depending on a variety of factors, including, but not limited to, the effects of and
changes in: general economic and bank industry conditions, the interest rate environment, legislative and
regulatory requirements, competitive pressures, new products and delivery systems, inflation, changes in the
stock and bond markets, accounting standards or interpretations of existing standards, mergers and
acquisitions, technology, and consumer spending and savings habits. More information is available on the
Company’s website, http://investors.bankatunion.com and on the Securities and Exchange Commission’s
website, www.sec.gov. The information on the Company’s website is not a part of this presentation. The
Company does not intend or assume any obligation to update or revise any forward-looking statements that
may be made from time to time by or on behalf of the Company.
2
Company Snapshot
3
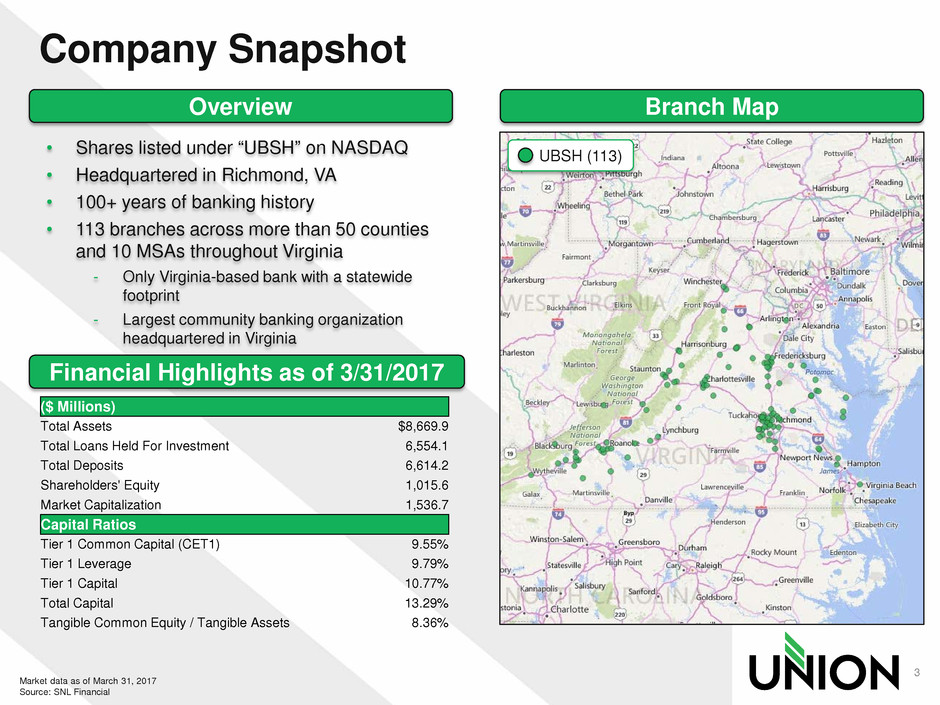
Overview Branch Map
• Shares listed under “UBSH” on NASDAQ
• Headquartered in Richmond, VA
• 100+ years of banking history
• 113 branches across more than 50 counties
and 10 MSAs throughout Virginia
- Only Virginia-based bank with a statewide
footprint
- Largest community banking organization
headquartered in Virginia
Financial Highlights as of 3/31/2017
Market data as of March 31, 2017
Source: SNL Financial
UBSH (113)
($ Millions)
Total Assets $8,669.9
Total Loans Held For Investment 6,554.1
Total Deposits 6,614.2
Shareholders' Equity 1,015.6
Market Capitalization 1,536.7
Capital Ratios
Tier 1 Common Capital (CET1) 9.55%
Tier 1 Leverage 9.79%
Tier 1 Capital 10.77%
Total Capital 13.29%
Tangible Common Equity / Tangible Assets 8.36%
Diversity Supports Growth in Virginia
Richmond
• State Capital
• Fortune 500 headquarters (6)
• Finance and insurance
• VCU & VCU Medical Center
Fredericksburg
• Defense and security
contractors
• Health care
• Retail
• Real Estate development
Charlottesville
• University of Virginia & Medical
College
• High-tech and professional
businesses
• Real Estate development
Northern Virginia
• Nation’s Capital
• Defense and security
contractors
• Associations (lobbyists)
• High tech
Virginia Beach - Norfolk
• Military
• Shipbuilding
• Fortune 500 headquarters (3)
• Tourism
Roanoke - Blacksburg
• Virginia Tech
• Health care
• Retail
• Fortune 500 headquarters (1)
4
Union Bank & Trust Key Statistics
• 113 (-10 in 2016; -1 YTD 2017) Branches
• 1,309 Full Time Equivalent
• 58 Commercial Bankers
• $6.55 billion Loans
• $6.61 billion Deposits
• 178+ thousand Consumer Households
5
Union is the only Virginia-based bank with a statewide
footprint
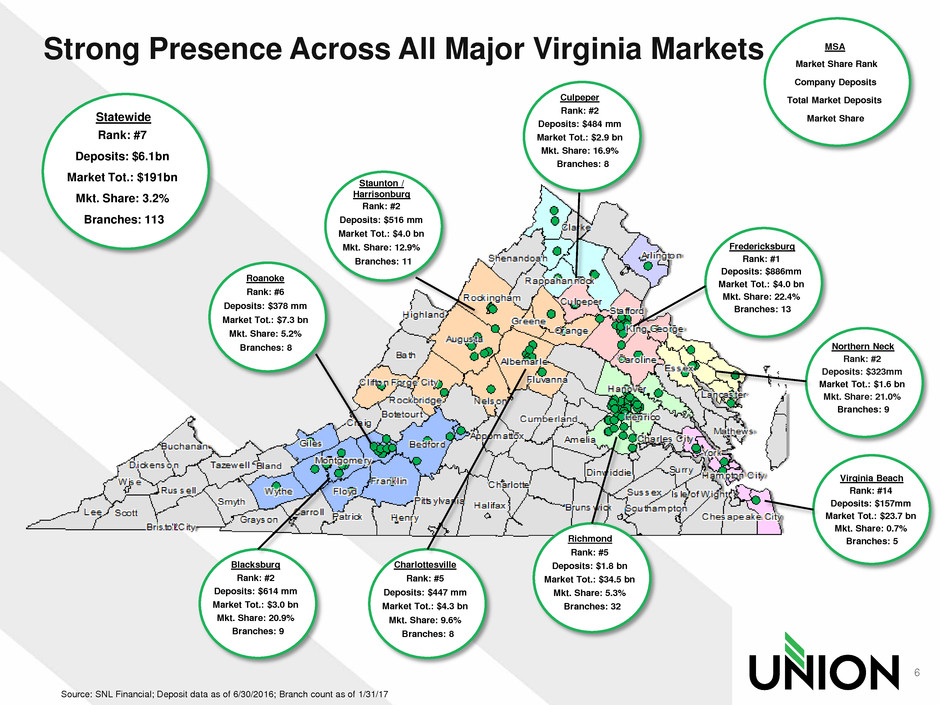
MSA
Market Share Rank
Company Deposits
Total Market Deposits
Market Share
Roanoke
Deposits: $378 mm
Market Tot.: $7.3 bn
Mkt. Share: 5.2%
Rank: #6
Branches: 8
Staunton /
Harrisonburg
Rank: #2
Deposits: $516 mm
Market Tot.: $4.0 bn
Mkt. Share: 12.9%
Branches: 11
Blacksburg
Rank: #2
Deposits: $614 mm
Market Tot.: $3.0 bn
Mkt. Share: 20.9%
Branches: 9
Charlottesville
Rank: #5
Deposits: $447 mm
Market Tot.: $4.3 bn
Mkt. Share: 9.6%
Branches: 8
Richmond
Rank: #5
Deposits: $1.8 bn
Market Tot.: $34.5 bn
Mkt. Share: 5.3%
Branches: 32
Culpeper
Rank: #2
Deposits: $484 mm
Market Tot.: $2.9 bn
Mkt. Share: 16.9%
Branches: 8
Fredericksburg
Rank: #1
Deposits: $886mm
Market Tot.: $4.0 bn
Mkt. Share: 22.4%
Branches: 13
Statewide
Rank: #7
Deposits: $6.1bn
Market Tot.: $191bn
Mkt. Share: 3.2%
Branches: 113
Strong Presence Across All Major Virginia Markets
Northern Neck
Rank: #2
Deposits: $323mm
Market Tot.: $1.6 bn
Mkt. Share: 21.0%
Branches: 9
Virginia Beach
Rank: #14
Deposits: $157mm
Market Tot.: $23.7 bn
Mkt. Share: 0.7%
Branches: 5
Source: SNL Financial; Deposit data as of 6/30/2016; Branch count as of 1/31/17
6
Source: SNL Financial; Deposit data as of 6/30/2016; Pro forma for recent acquisitions
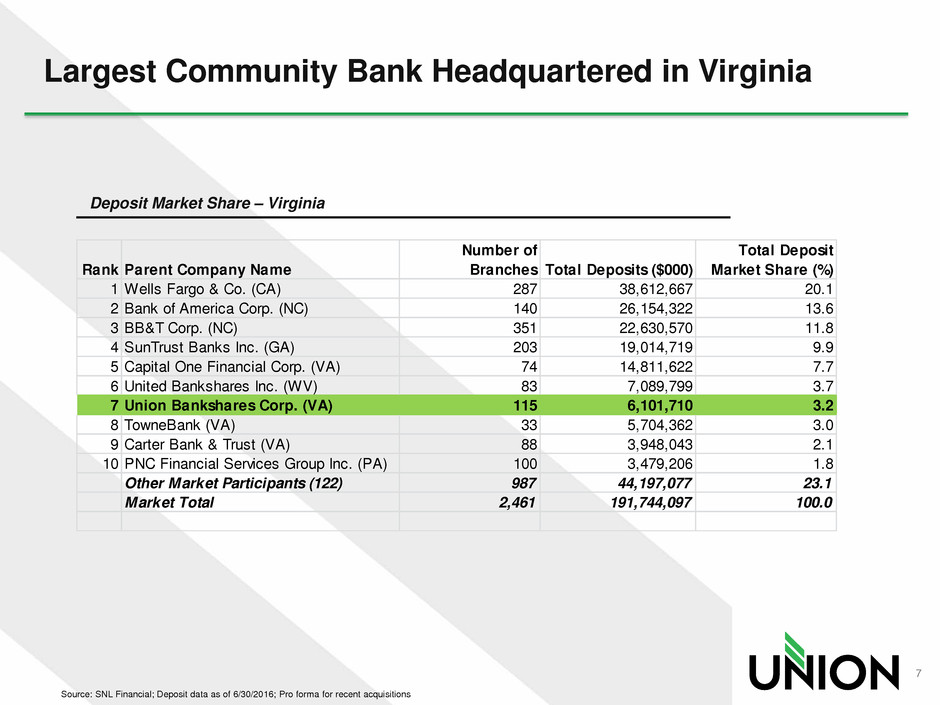
Largest Community Bank Headquartered in Virginia
Deposit Market Share – Virginia
7
Rank Parent Company Name
Number of
Branches Total Deposits ($000)
Total Deposit
Market Share (%)
1 Wells Fargo & Co. (CA) 287 38,612,667 20.1
2 Bank of America Corp. (NC) 140 26,154,322 13.6
3 BB&T Corp. (NC) 351 22,630,570 11.8
4 SunTrust Banks Inc. (GA) 203 19,014,719 9.9
5 Capital One Financial Corp. (VA) 74 14,811,622 7.7
6 United Bankshares Inc. (WV) 83 7,089,799 3.7
7 Union Bankshares Corp. (VA) 115 6,101,710 3.2
8 TowneBank (VA) 33 5,704,362 3.0
9 Carter Bank & Trust (VA) 88 3,948,043 2.1
10 PNC Financial Services Group Inc. (PA) 100 3,479,206 1.8
Other Market Participants (122) 987 44,197,077 23.1
Market Total 2,461 191,744,097 100.0
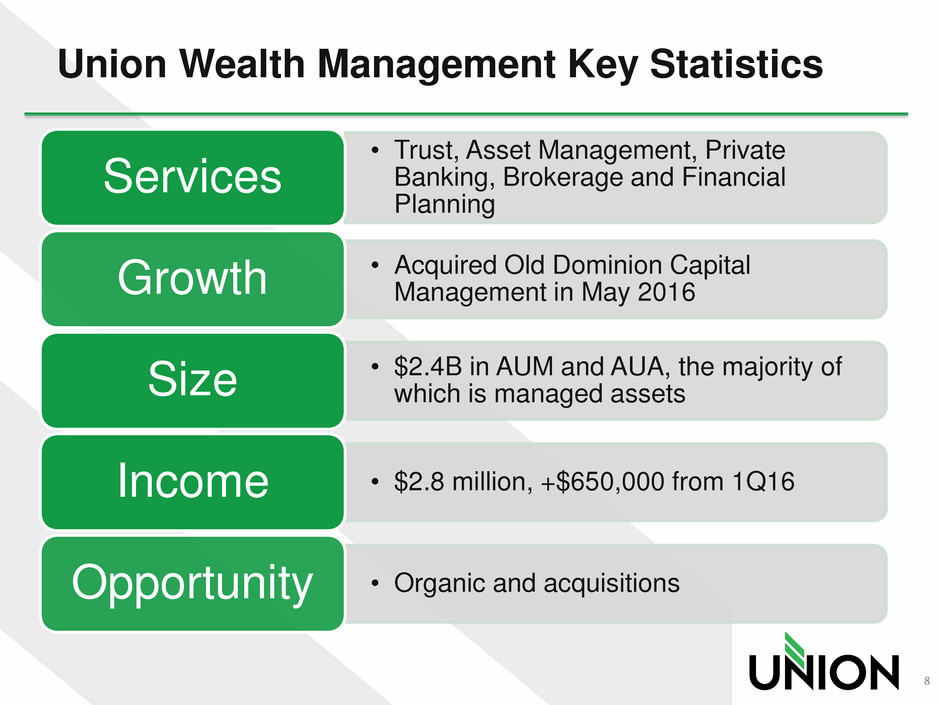
Union Wealth Management Key Statistics
• Trust, Asset Management, Private
Banking, Brokerage and Financial
Planning
Services
• Acquired Old Dominion Capital
Management in May 2016 Growth
• $2.4B in AUM and AUA, the majority of
which is managed assets Size
• $2.8 million, +$650,000 from 1Q16 Income
• Organic and acquisitions Opportunity
8
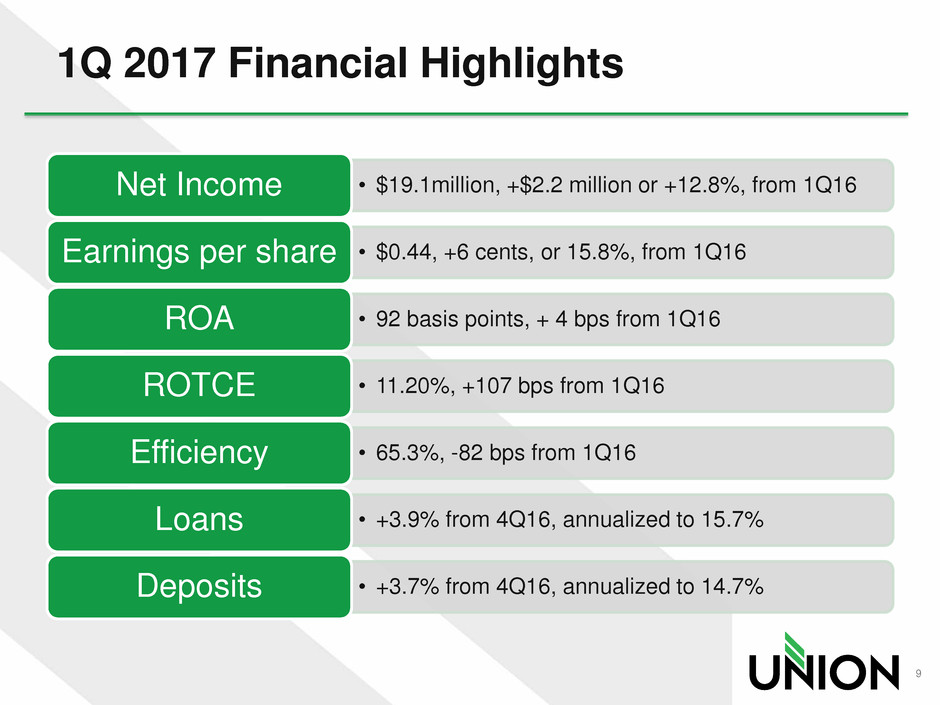
1Q 2017 Financial Highlights
9
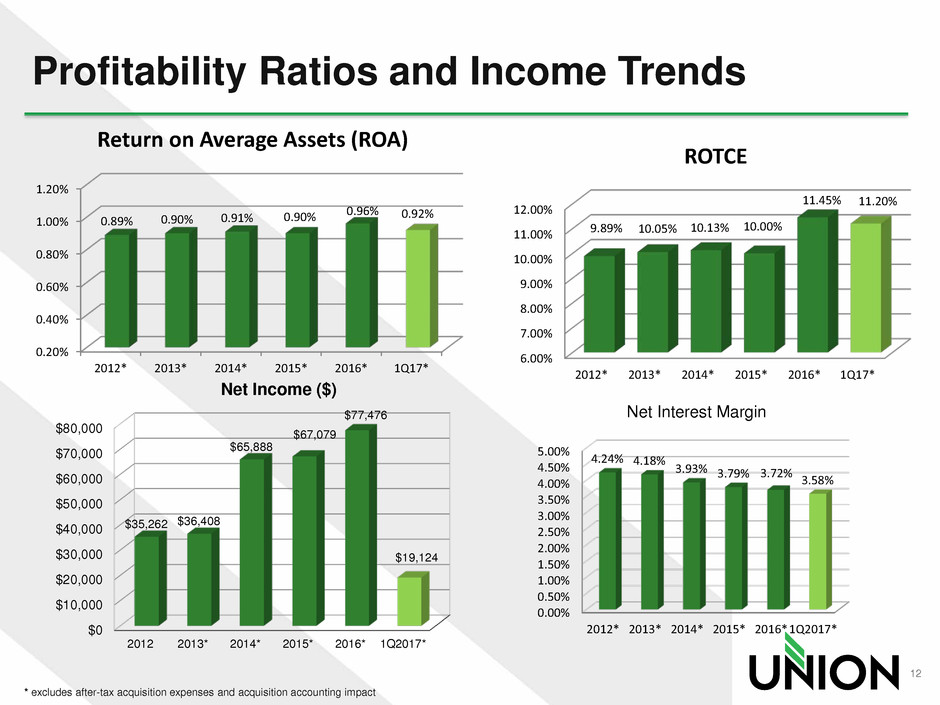
• $19.1million, +$2.2 million or +12.8%, from 1Q16 Net Income
• $0.44, +6 cents, or 15.8%, from 1Q16 Earnings per share
• 92 basis points, + 4 bps from 1Q16 ROA
• 11.20%, +107 bps from 1Q16 ROTCE
• 65.3%, -82 bps from 1Q16 Efficiency
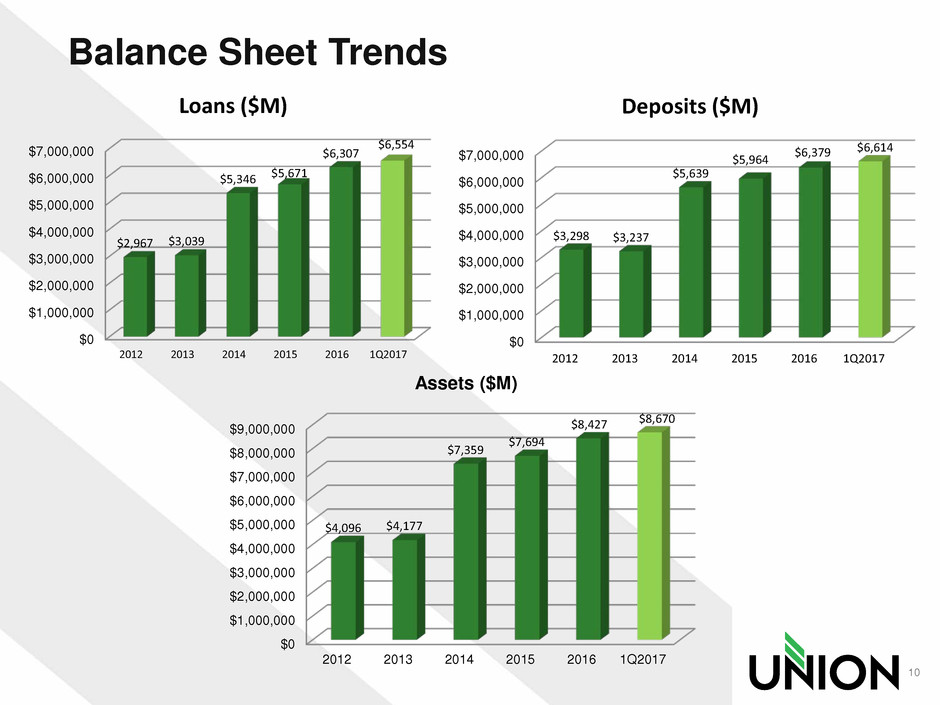
• +3.9% from 4Q16, annualized to 15.7% Loans
• +3.7% from 4Q16, annualized to 14.7% Deposits
Balance Sheet Trends
10
$0
$1,000,000
$2,000,000
$3,000,000
$4,000,000
$5,000,000
$6,000,000
$7,000,000
2012 2013 2014 2015 2016 1Q2017
$3,298 $3,237
$5,639
$5,964
$6,379 $6,614
Deposits ($M)
$0
$1,000,000
$2,000,000
$3,000,000
$4,000,000
$5,000,000
$6,000,000
$7,000,000
2012 2013 2014 2015 2016 1Q2017
$2,967 $3,039
$5,346 $5,671
$6,307
$6,554
Loans ($M)
$0
$1,000,000
$2,000,000
$3,000,000
$4,000,000
$5,000,000
$6,000,000
$7,000,000
$8,000,000
$9,000,000
2012 2013 2014 2015 2016 1Q2017
$4,096 $4,177
$7,359
$7,694
$8,427 $8,670
Assets ($M)
0.00%
2.00%
4.00%
6.00%
8.00%
10.00%
12.00%
14.00%
16.00%
2012 2013 2014 2015 2016 1Q2017
14.57%
14.16%
13.38%
12.46%
13.56% 13.30%
8.96% 8.93%
9.27% 9.20%
8.41%
8.36%
Total capital ratio Tangible Equity/Tangible Assets
Repurchased 1.1
million shares in
2012
Capital Management
11
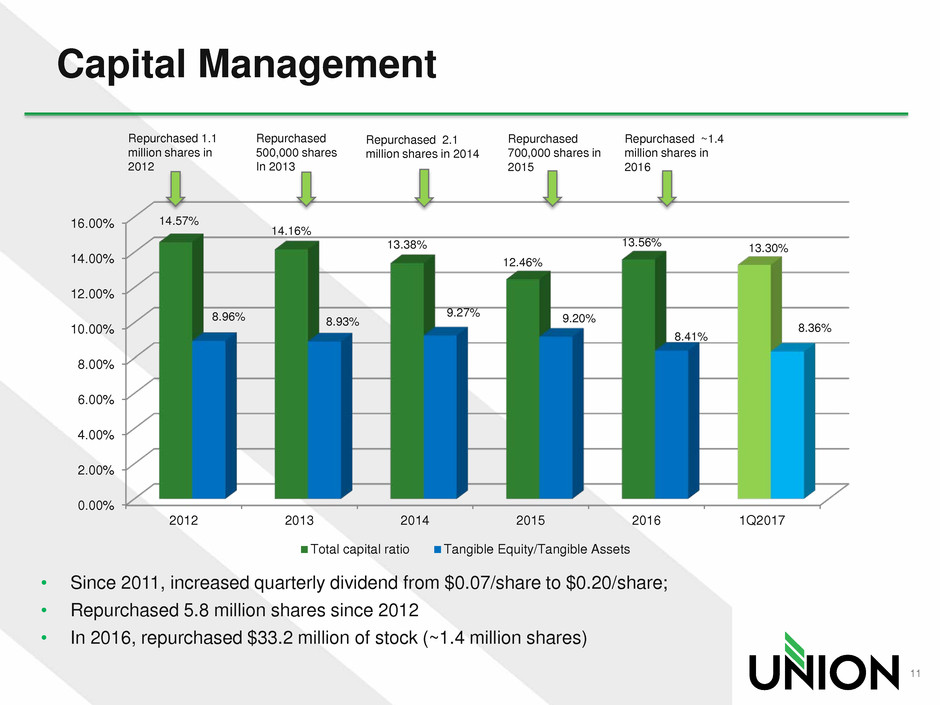
• Since 2011, increased quarterly dividend from $0.07/share to $0.20/share;
• Repurchased 5.8 million shares since 2012
• In 2016, repurchased $33.2 million of stock (~1.4 million shares)
Repurchased
500,000 shares
In 2013
Repurchased 2.1
million shares in 2014
Repurchased
700,000 shares in
2015
Repurchased ~1.4
million shares in
2016
Profitability Ratios and Income Trends
* excludes after-tax acquisition expenses and acquisition accounting impact
12
0.20%
0.40%
0.60%
0.80%
1.00%
1.20%
2012* 2013* 2014* 2015* 2016* 1Q17*
0.89% 0.90% 0.91% 0.90%
0.96% 0.92%
Return on Average Assets (ROA)
6.00%
7.00%
8.00%
9.00%
10.00%
11.00%
12.00%
2012* 2013* 2014* 2015* 2016* 1Q17*
9.89% 10.05% 10.13% 10.00%
11.45% 11.20%
ROTCE
0.00%
0.50%
1.00%
1.50%
2.00%
2.50%
3.00%
3.50%
4.00%
4.50%
5.00%
2012* 2013* 2014* 2015* 2016*1Q2017*
4.24% 4.18%
3.93% 3.79% 3.72% 3.58%
Net Interest Margin
$0
$10,000
$20,000
$30,000
$40,000
$50,000
$60,000
$70,000
$80,000
2012 2013* 2014* 2015* 2016* 1Q2017*
$35,262 $36,408
$65,888
$67,079
$77,476
$19,124
Net Income ($)
Top-Tier Financial Performance Focus
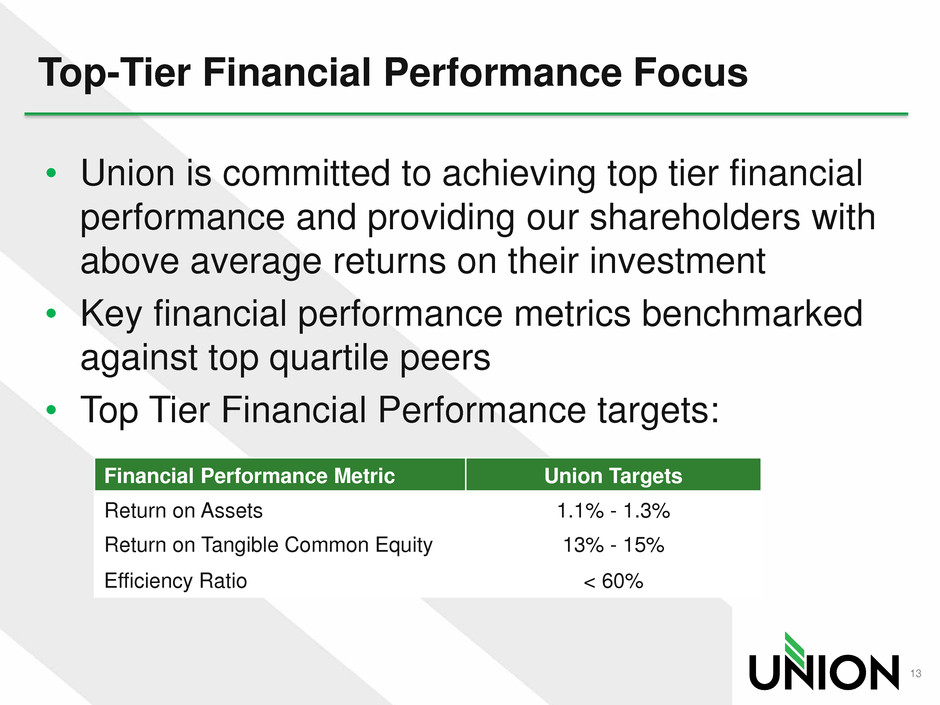
• Union is committed to achieving top tier financial
performance and providing our shareholders with
above average returns on their investment
• Key financial performance metrics benchmarked
against top quartile peers
• Top Tier Financial Performance targets:
13
Financial Performance Metric Union Targets
Return on Assets 1.1% - 1.3%
Return on Tangible Common Equity 13% - 15%
Efficiency Ratio < 60%
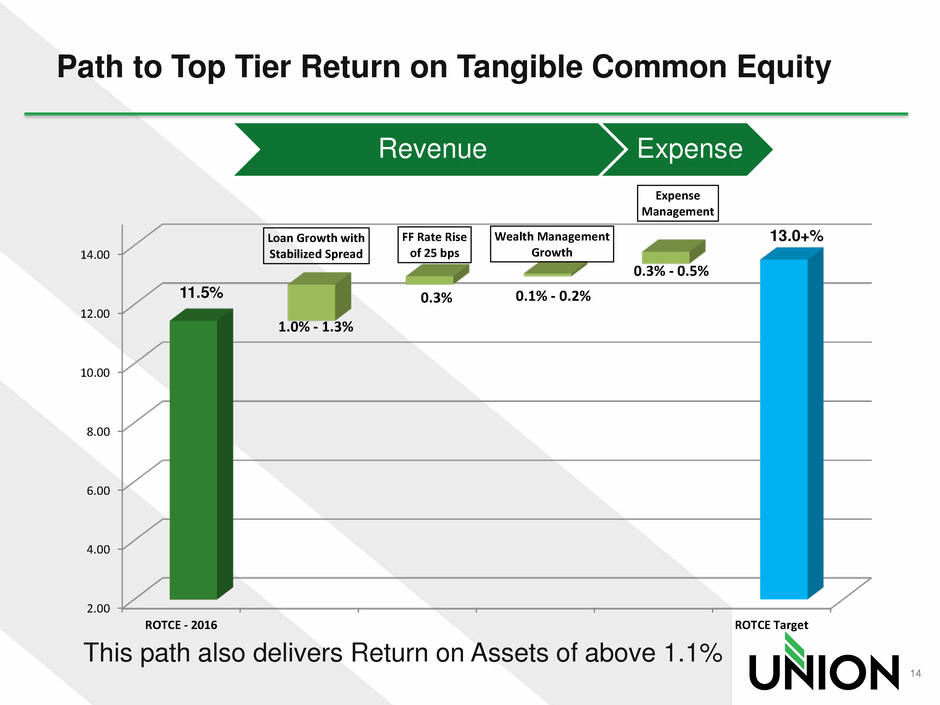
Path to Top Tier Return on Tangible Common Equity
Revenue Expense
This path also delivers Return on Assets of above 1.1%
14
2.00
4.00
6.00
8.00
10.00
12.00
14.00
ROTCE - 2016 ROTCE Target
11.5%
1.0% - 1.3%
0.3% 0.1% - 0.2%
0.3% - 0.5%
Loan Growth with
Stabilized Spread
FF Rate Rise
of 25 bps
Wealth Management
Growth
Expense
Management
13.0+%
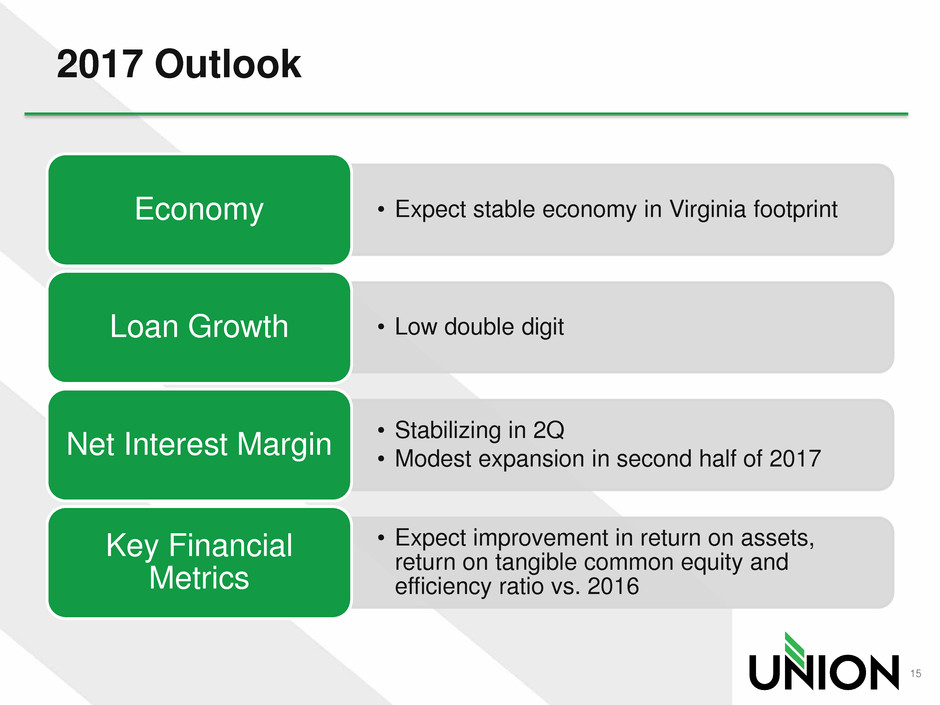
2017 Outlook
• Expect stable economy in Virginia footprint Economy
• Low double digit Loan Growth
• Stabilizing in 2Q
• Modest expansion in second half of 2017 Net Interest Margin
• Expect improvement in return on assets,
return on tangible common equity and
efficiency ratio vs. 2016
Key Financial
Metrics
15
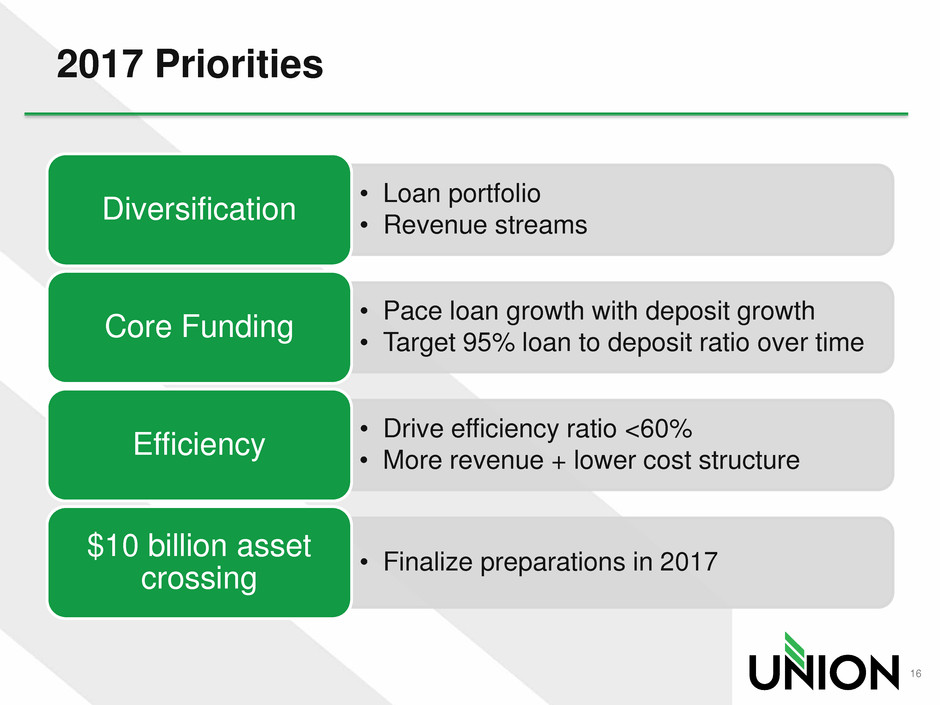
2017 Priorities
16
• Loan portfolio
• Revenue streams Diversification
• Pace loan growth with deposit growth
• Target 95% loan to deposit ratio over time Core Funding
• Drive efficiency ratio <60%
• More revenue + lower cost structure Efficiency
• Finalize preparations in 2017 $10 billion asset crossing
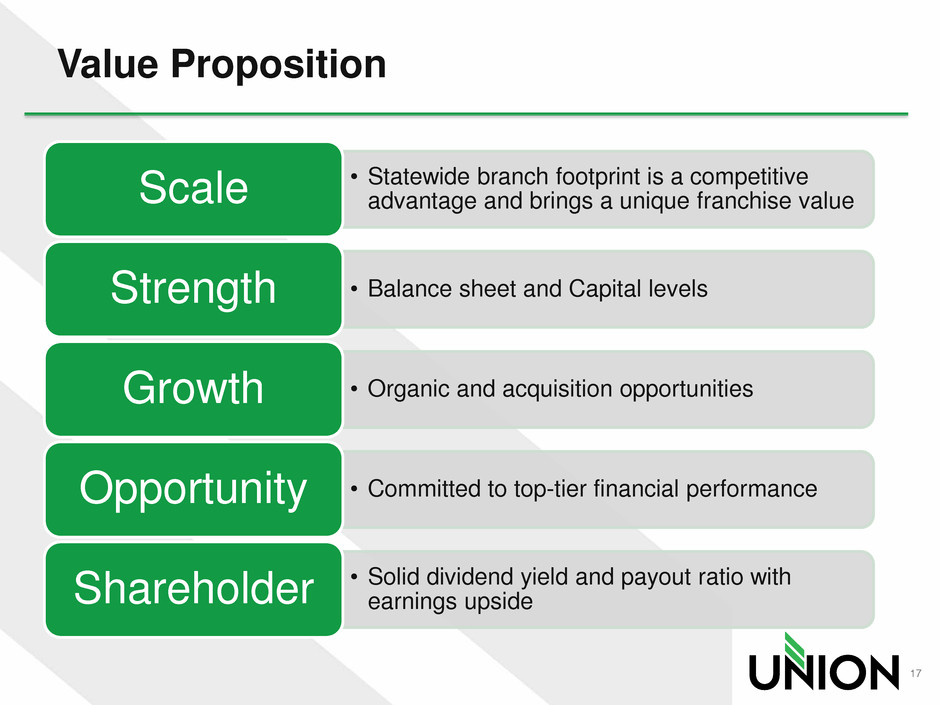
Value Proposition
• Statewide branch footprint is a competitive
advantage and brings a unique franchise value Scale
• Balance sheet and Capital levels Strength
• Organic and acquisition opportunities Growth
• Committed to top-tier financial performance Opportunity
• Solid dividend yield and payout ratio with
earnings upside Shareholder
17

APPENDIX
18
CEO Succession Plan
• John Asbury became President & CEO of Union Bank &
Trust and President of Union Bankshares Corporation on
October 1; CEO of Holding company on January 2, 2017 –
succeeding Billy Beale.
• Asbury was most recently President and CEO of First National Bank of
Santa Fe, a multi-state bank located in the Southwest
• Prior to that, he was Senior Executive Vice President at Regions
responsible for all lines serving business and commercial customers and
managed a $50 billion book of business
• Senior Vice President at Bank of America – served in a variety of roles last
position responsible for all Pacific Northwest Region business banking
• Asbury joined the board on October 1
• Billy was Executive Vice Chairman through March 31 and
was re-elected to board in May 2017 and will serve as an
advisor to the CEO and Board
19
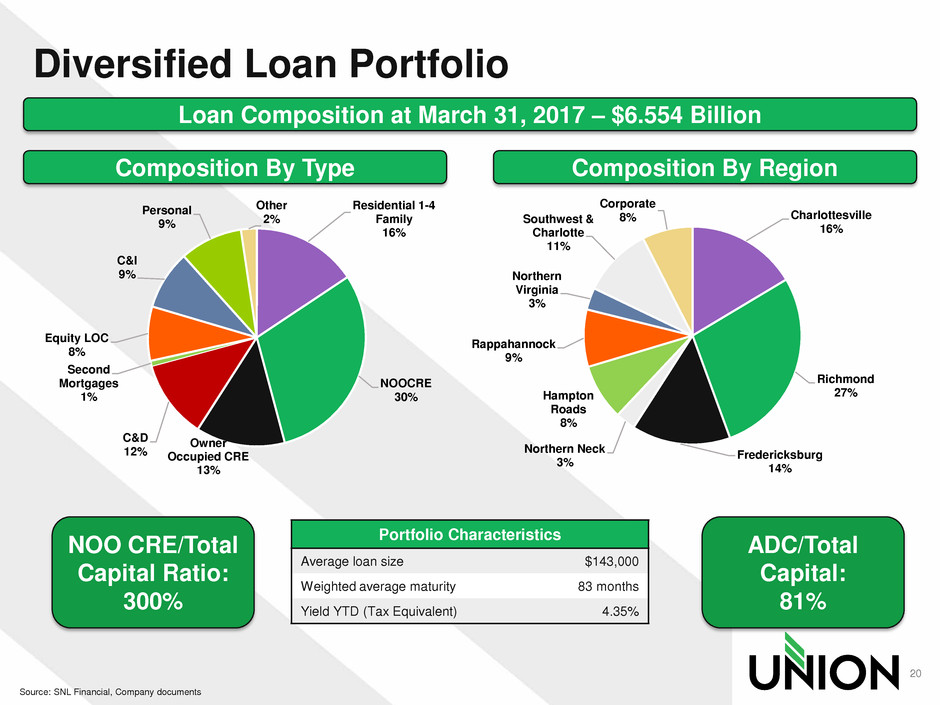
Diversified Loan Portfolio
20
Source: SNL Financial, Company documents
Loan Composition at March 31, 2017 – $6.554 Billion
Portfolio Characteristics
Average loan size $143,000
Weighted average maturity 83 months
Yield YTD (Tax Equivalent) 4.35%
Composition By Type Composition By Region
NOO CRE/Total
Capital Ratio:
300%
ADC/Total
Capital:
81%
Residential 1-4
Family
16%
NOOCRE
30%
Owner
Occupied CRE
13%
C&D
12%
Second
Mortgages
1%
Equity LOC
8%
C&I
9%
Personal
9%
Other
2% Charlottesville
16%
Richmond
27%
Fredericksburg
14%
Northern Neck
3%
Hampton
Roads
8%
Rappahannock
9%
Northern
Virginia
3%
Southwest &
Charlotte
11%
Corporate
8%
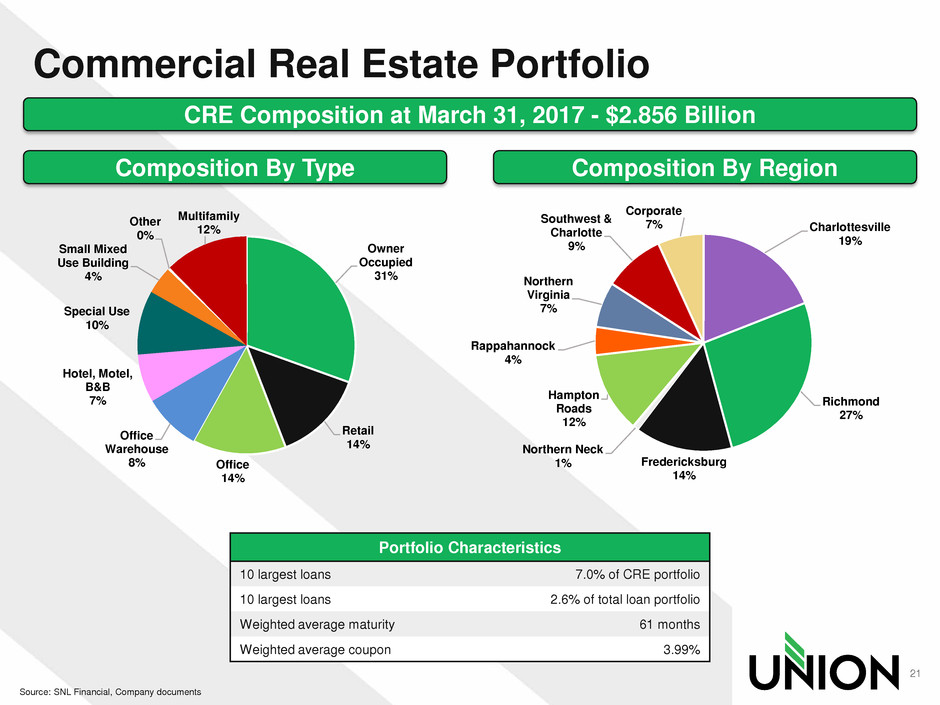
Commercial Real Estate Portfolio
21
Source: SNL Financial, Company documents
CRE Composition at March 31, 2017 - $2.856 Billion
Portfolio Characteristics
10 largest loans 7.0% of CRE portfolio
10 largest loans 2.6% of total loan portfolio
Weighted average maturity 61 months
Weighted average coupon 3.99%
Composition By Type Composition By Region
Owner
Occupied
31%
Retail
14%
Office
14%
Office
Warehouse
8%
Hotel, Motel,
B&B
7%
Special Use
10%
Small Mixed
Use Building
4%
Other
0%
Multifamily
12% Charlottesville
19%
Richmond
27%
Fredericksburg
14%
Northern Neck
1%
Hampton
Roads
12%
Rappahannock
4%
Northern
Virginia
7%
Southwest &
Charlotte
9%
Corporate
7%
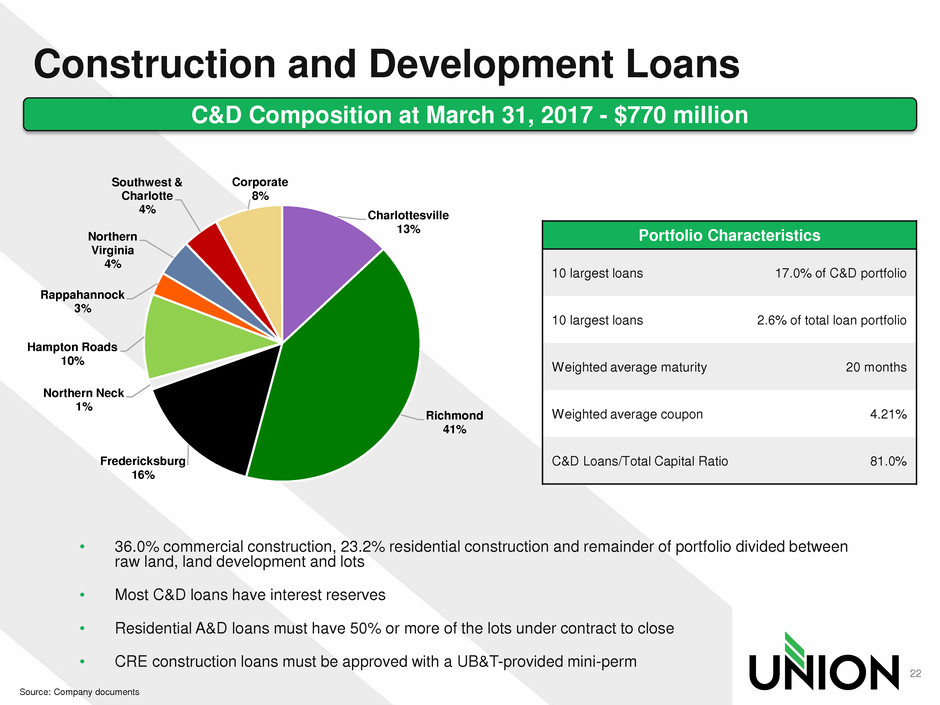
Construction and Development Loans
22
Source: Company documents
C&D Composition at March 31, 2017 - $770 million
Portfolio Characteristics
10 largest loans 17.0% of C&D portfolio
10 largest loans 2.6% of total loan portfolio
Weighted average maturity 20 months
Weighted average coupon 4.21%
C&D Loans/Total Capital Ratio 81.0%
• 36.0% commercial construction, 23.2% residential construction and remainder of portfolio divided between
raw land, land development and lots
• Most C&D loans have interest reserves
• Residential A&D loans must have 50% or more of the lots under contract to close
• CRE construction loans must be approved with a UB&T-provided mini-perm
Charlottesville
13%
Richmond
41%
Fredericksburg
16%
Northern Neck
1%
Hampton Roads
10%
Rappahannock
3%
Northern
Virginia
4%
Southwest &
Charlotte
4%
Corporate
8%
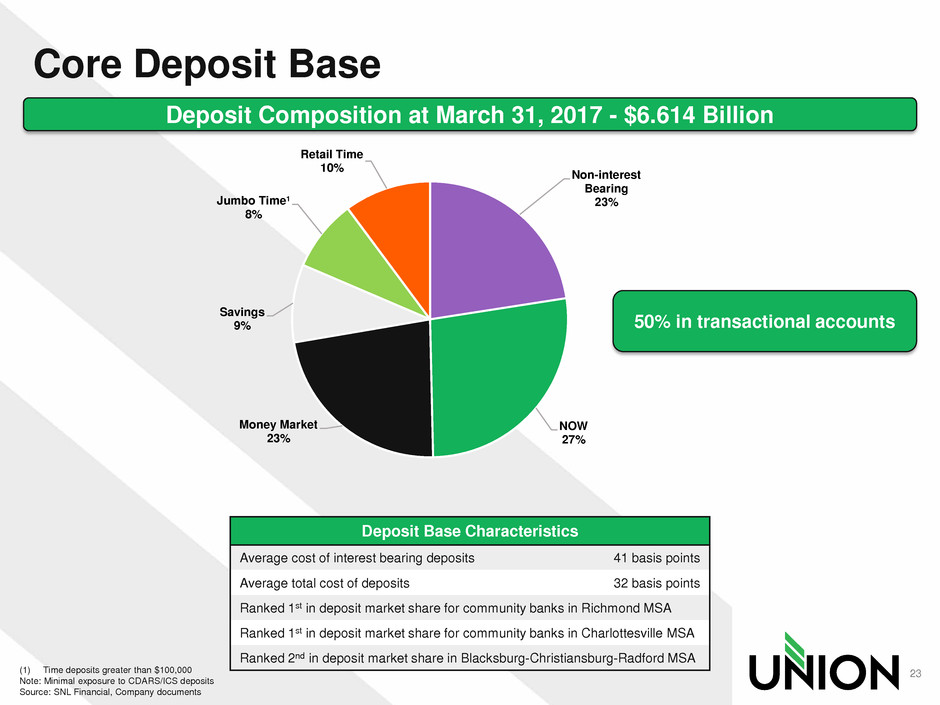
Core Deposit Base
23 (1) Time deposits greater than $100,000
Note: Minimal exposure to CDARS/ICS deposits
Source: SNL Financial, Company documents
Deposit Composition at March 31, 2017 - $6.614 Billion
Deposit Base Characteristics
Average cost of interest bearing deposits 41 basis points
Average total cost of deposits 32 basis points
Ranked 1st in deposit market share for community banks in Richmond MSA
Ranked 1st in deposit market share for community banks in Charlottesville MSA
Ranked 2nd in deposit market share in Blacksburg-Christiansburg-Radford MSA
50% in transactional accounts
Non-interest
Bearing
23%
NOW
27%
Money Market
23%
Savings
9%
Jumbo Time¹
8%
Retail Time
10%
Union Mortgage Group
• 22 offices: 20 in Virginia, 1 each in Maryland and North
Carolina
• 101 FTEs – 39 loan officers
• $100.2 million of originations 1Q17; (34% refinance)
• $4,000 net income in 1Q17
• Opportunities:
• Salesforce expansion in Virginia growth markets
• Process improvement
24